identification of radiation-induced alterations in the ... · identification of radiation-induced...
TRANSCRIPT

Aus der Abteilung für Strahlenzytogenetik des Helmholtz Zentrums München
Head Prof. Dr. Horst Zitzelsberger
Identification of radiation-induced alterations in the
proteome and miRNAome of the endothelial cell line
EA.hy926
Dissertation
zum Erwerb des Doktorgrades der Humanbiologie
an der Medizinischen Fakultät der
Ludwig-Maximilians-Universität München
Vorgelegt von
Arundhathi Sriharshan
Vom
Hassan, Indien
Jahr
2012

Mit Genehmigung der Medizinischen Fakultät der Universität München
Berichterstatter: Prof. Dr. Horst Zitzelsberger
Mitberichterstatter: Priv. Doz. Dr. Anna Friedl
Prof. Dr. Werner Rühm
Mitbetreuung durch den
promovierten Mitarbeiter:
Dekan: Prof. Dr. med. Dr. h. c. M. Reiser, FACR,FRCR
Tag der mündliche Prüfung: 20.12.2012

To my Father, Mother, and Husband

Table of Contents
II
Contents 1. Summary ..................................................................................................................................... 1
2. Zusammenfassung ....................................................................................................................... 3
3. Introduction ................................................................................................................................. 5
History .......................................................................................................................................... 5
Effects of ionising radiation on health .......................................................................................... 5
Endothelial cell biology ................................................................................................................ 7
Proteins and ionising radiation ..................................................................................................... 9
miRNA and ionising radiation .................................................................................................... 10
Objectives ................................................................................................................................... 11
4. Materials .................................................................................................................................... 13
4.1. Abbreviations .................................................................................................................. 13
4.2. Chemicals ........................................................................................................................ 15
4.3. Instruments and lab wares ............................................................................................... 19
4.4. Cell culture ...................................................................................................................... 20
4.4.1 Cryopreservation medium ....................................................................................... 20
4.4.2 DMEM medium ...................................................................................................... 20
4.4.3 SILAC media ........................................................................................................... 21
4.4.4 Buffers & solutions ................................................................................................. 21
4.4.5 Experimental kits ..................................................................................................... 27
4.4.6 Human endothelial cell line (EA.hy926) ................................................................. 28
4.4.7 Immunoblotting antibodies ...................................................................................... 28
4.4.8 RNA oligonucleotides ............................................................................................. 29
4.4.9 Software and databases............................................................................................ 29
5. Methods ..................................................................................................................................... 30
5.1. Cell culture ...................................................................................................................... 30
5.1.1 Maintenance culture of human endothelial cell line EA.hy926 .............................. 30
5.1.2 In vitro labelling (SILAC) ....................................................................................... 30
5.1.3 Cryopreservation ..................................................................................................... 31
5.1.4 Thawing cryopreserved cells ................................................................................... 31
5.1.5 Irradiation of cells ................................................................................................... 32
5.1.6 Harvesting cells for proteomic studies .................................................................... 32
5.2. Functional analysis .......................................................................................................... 32
5.2.1 Cell growth kinetics ................................................................................................. 32
5.2.2 Clonogenic survival assay ....................................................................................... 32

Table of Contents
III
5.3. Proteomic studies ............................................................................................................ 33
5.3.1 SILAC ..................................................................................................................... 33
5.3.2 2D-DIGE ................................................................................................................. 38
5.3.3 Immunoblotting ....................................................................................................... 44
5.4. microRNA analysis ......................................................................................................... 47
5.4.1 Total RNA isolation ................................................................................................ 47
5.4.2 Estimation of purity and concentration of RNA ...................................................... 47
5.4.3 microRNA profiling ................................................................................................ 47
5.4.4 Transfection of cells with Pre-miRTM and Anti-miRTM ........................................... 49
5.5. Bioinformatic analysis .................................................................................................... 49
5.5.1 Identification of protein interactions and biological pathways ............................... 49
5.5.2 Functional classification: ......................................................................................... 50
5.5.3 miRNA target search analysis ................................................................................. 50
6. Results ....................................................................................................................................... 51
6.1. Effects of irradiation on the growth of the cell line EA.hy926 ....................................... 51
6.1.1 Colony forming ability after exposure to ionising radiation ................................... 51
6.1.2 Effects of low and high doses of irradiation on cellular proliferation ..................... 52
6.2. Proteomic alterations in EA.hy926 observed after exposure to 2.5 Gy ionising radiation
53
6.2.1 Protein expression changes identified by the SILAC strategy ................................ 54
6.2.2 Protein expression changes identified by 2D-DIGE strategy .................................. 61
6.2.3 Functional correlation of the affected proteins ........................................................ 64
6.2.4 Deciphering affected biological pathways by bioinformatic analysis ..................... 67
6.2.5 In Silico analysis to establish the relationship between deregulated microRNAs and
proteins ................................................................................................................................ 78
6.3. Effect of low dose (200 mGy) ionising radiation on the endothelial cell line EA.hy926 82
6.3.1 Proteomic alterations ............................................................................................... 82
6.3.2 Analysis of miRNAome of the EA.hy926 cells in response to 200 mGy irradiation
85
6.4. Validation of proteomic and bioinformatic analysis by immunoblotting ....................... 94
7. Discussion ................................................................................................................................. 98
7.1. Establishment of the in vitro SILAC technique for the EA.hy926 cells for use with
irradiation ................................................................................................................................... 99
7.2. Endothelial cellular growth in response to irradiation .................................................. 100
7.3. Response of the endothelial cell line EA.hy926 to irradiation ...................................... 101

Table of Contents
IV
7.3.1 High Dose-exposure at 2.5 Gy .............................................................................. 101
7.3.2 Low Dose effects on the proteome after 200 mGy ................................................ 107
7.3.3 miRNA expression analysis .................................................................................. 109
7.3.4 Validation of proteomics data ............................................................................... 112
8. Bibliography ............................................................................................................................ 114
9. Curriculum vitae ...................................................................................................................... 123
10. Acknowledgements ................................................................................................................. 128
Table of Figures
V
Figure 1: Pattern of functions of vascular endothelium under normal and pathological conditions. Under normal
conditions endothelial cells produce substances which control constriction or dilation of blood vessels,
anti-thrombotic and anti-inflammatory substances. These substances regulate permeability, adhesion and
proliferation (top right). In pathological conditions endothelial dysfunction leads to alteration of the
modulators produced by endothelial cells, thus resulting in increased inflammation, vasoconstriction,
coagulation etc. (bottom right). Modified source: (Rodriguez-Feo and Pasterkamp, 2007). ......................... 8 Figure 2: Schematic presentation of in vitro labelling in cell culture ................................................................... 31 Figure 3: Schematic representation of SILAC workflow starting from labelling till mass spectrometric analysis35 Figure 4: Representative gel picture showing colloidal coomassie staining ......................................................... 37 Figure 5: Schematic representation of 2D-DIGE work flow ................................................................................. 39 Figure 6: Schematic representation of immunoblot aperture. ............................................................................... 45 Figure 7: Survival curve of EA.hy926 cells after 0, 1, 2, 3, 4 and 6 Gy of γ-irradiation. The colonies were
counted after 16 days. The graph represents a survival curve and shows 10 % (D37), 37 % (D0) and 50 %
(SF2) survival fractions. ............................................................................................................................... 51 Figure 8: Cellular growth rate. Growth rate of sham irradiated (blue box), and 200 mGy irradiated EA.hy926
cells (red box) followed for 180 h with identical seeding densities. ............................................................ 52 Figure 9: Cellular growth rate. Growth rate of sham irradiated (blue box), and 2.5 Gy irradiated EA.hy926 cells
(red box) followed for 240 h using identical seeding densities. ................................................................... 53 Figure 10: The “Christmas tree” model of all quantified proteins by SILAC. This figure shows normalised
protein ratios plotted against summed peptide intensities. Spots to the right of y-axis (= 1) represent
proteins with increased abundance and spots to the left of the y-axis (= 1) are proteins with decreased
abundance. Unaltered proteins are clustered on the y-axis where the ratio (H / L) is equal to 1. ................ 54 Figure 11: Typical 2D-DIGE gels of pH range 3-11 showing the EA.hy926 endothelial cell proteome. a: Gel
picture of the irradiated sample after 4 h. Positions of the deregulated protein spots with corresponding spot
numbers are indicated with arrows. b: Gel picture of the irradiated sample after 24 h. Positions of the
deregulated protein spots with corresponding spot numbers are indicated with arrows. The deregulated
proteins with the spot numbers were identified and they are listed in Table 10 (4 h) and Table 11 (24 h).. 63 Figure 12: Biological functions associated to the proteins found to be deregulated at 4 h after irradiation.
Differentially regulated proteins were analysed for “functional categories” using the UniProt knowledge
database and the PANTHER classification system. ..................................................................................... 65 Figure 13: Functional classification of differentially expressed proteins at 24 h after irradiation. Categorisation
according to the biological functions of deregulated proteins was done using the UniProt knowledge
database and the PANTHER classification system. Red and green arrows in the figure represent increase or
decrease of the functions in comparison to that of the 4 h time point respectively. ..................................... 66 Figure 14: The most significant network obtained from bioinformatic analysis for proteins found to be altered at
4 h after radiation. The network represents 23 proteins involved in “cell morphology, cellular function and
maintenance, DNA replication, recombination, and repair”. All coloured molecules are the molecules
identified to have differential expression values, green representing down-regulation and red up-regulation.
Dotted lines indicate indirect interactions and solid line represents direct interactions and loops represent
self-regulation. ............................................................................................................................................. 70

Table of Figures
VI
Figure 15: The second most significant network obtained from bioinformatic analysis for proteins found to be
altered 4 h after 2.5 Gy irradiation (coloured molecules; green - down-regulation and red up-regulation).
The network represents 13 proteins involved in “cellular compromise, morphology, death”. Dotted lines
indicate indirect interactions and solid line represents direct interactions and loops represent self-
regulation. .................................................................................................................................................... 71 Figure 16: DNA repair by non-homologueous end joining (NHEJ) pathway affected at 4 h after irradiation. The
figure shows the Ku-heterodimers involved in the DNA repair pathway by the non-homologous end joining
method. The Ku-heterodimers Ku70 / Ku80 that were found to be down-regulated at 4 h after 2.5 Gy
irradiation are represented as green coloured molecules of the Ku-heterodimer (Ku70 and Ku80). Modified
from source Ingenuity Pathway Analysis (www.Ingenuity.com). ............................................................... 72 Figure 17: Synthesis and degradation of ketone bodies affected at 4 h after irradiation. The figure shows the
synthesis and degradation of ketone bodies, representing the two proteins from this pathway the ACAT-1
down-regulated (green-2.3.1.9) and the up-regulated HMG-CoA synthase (red-2.3.3.10) found to be
differentially expressed at 4 h after 2.5 Gy irradiation. Modified from source Ingenuity Pathway Analysis
(www.Ingenuity.com). ................................................................................................................................. 73 Figure 18: Proteins of oxidative phosphorylation altered at the 24 h time point after irradiation. The figure
represents the electron transport chain and the coloured molecules (green – down-regulated and red – up-
regulated) were found to be differentially expressed in the EA.hy926 cells by either SILAC or 2D-DIGE
strategy at 24 hours after 2.5 Gy irradiation. The differentially regulated proteins include 2 subunits and 1
isoform of complex I, 1 subunit of complex III and 2 subunits of complex V. Modified from source
Ingenuity Pathway Analysis (www.Ingenuity.com). ................................................................................... 75 Figure 19: The radiation response on glycolysis / gluconeogenesis at the 24 h time point. Five of the 10 enzymes
involved in the glycolytic pathway were found to be up-regulated (red coloured molecules) at 24 h after
exposure to 2.5 Gy radiation. An increased expression of enolase, glyceraldehyde-3-phosphate
dehydrogenase, fructose-bisphosphate aldolase, 6-phosphofructokinase and hexokinase was found.
Modified from source Ingenuity Pathway Analysis (www.Ingenuity.com). ............................................... 76 Figure 20: Actin-based mobility by Rho related proteins. The figure shows proteins that were differentially
expressed in the Actin-based mobility pathway. Differentially regulated proteins (green: down-regulated
and red: up-regulated) are cofilin 1, myosin light chain 6 (MLC), profilin 1, and RhoA. Modified from
source Ingenuity Pathway Analysis (www.Ingenuity.com). ........................................................................ 77 Figure 21: Association of deregulated miRNAs and differentially expressed proteins 4 hours after the exposure
to irradiation. MiRNA data obtained from the study by Kraemer et al. (Kraemer et al., 2011) were
combined with proteomic alterations found in this study either by SILAC or 2D-DIGE technology to
analyse putative regulation and association between the miRNAs and proteins. Molecules coloured in
green indicate down-regulation and red colour represents up-regulation of expression. Solid line arrows
represent direct interactions. ........................................................................................................................ 80 Figure 22: Correlation between deregulated miRNAs and differentially expressed proteins at 24 hours after the
exposure to irradiation. The network represents the correlation between the deregulated miRNAs and
proteins, miRNA data obtained from the Kraemer et al. (Kraemer et al., 2011) study. Molecules coloured
in green indicate down-regulation and red colour represents up-regulation of expression. Solid line arrows
represent direct interactions. ........................................................................................................................ 81

Table of Figures
VII
Figure 23: Biological functions associated with the deregulated proteins after the radiation dose of 200 mGy.
Functional classification of proteins was done using the UniProt knowledge database and the PANTHER
classification system. Biological functions of proteins found to have altered expression levels at 4 hours
after a 200 mGy radiation dose. ................................................................................................................... 84 Figure 24: miRNAs showing altered expression levels at 4 h after a 200 mGy radiation dose. The columns
represent mean values of at least two of the three biological replicates. A total of 24 miRNAs with
differential expression levels having a p < 0.05 (∗) / < 0.01 (∗∗) and n fold change > + 1.5. 6 miRNAs were
down-regulated (green) and 18 were up-regulated (red). ............................................................................. 86 Figure 25: All deregulated miRNAs 24 hours after a 200 mGy radiation dose. The columns represent mean
values of at least two of the three biological replicates. Of the 15 deregulated miRNA 9 were up-regulated
(red) and 6 down-regulated (green) with a significance of p < 0.05 (*) / < 0.01 ( **) and a fold change
> + 1.5. ......................................................................................................................................................... 87 Figure 26: Venn diagram representing the total number and overlap of deregulated miRNAs at the time points 4
and 24 hours after a dose of 200 mGy. Of the total 24 (4 h) and 15 (24 h) deregulated miRNAs two were
found at both time points. miR-7 was up-regulated at both time points and miR-923 was 4.15-fold up-
regulated at 4 hours but -6.67-fold down-regulated at 24 hours. ................................................................. 88 Figure 27: Alterations in the HMGA2 protein level as a function of mir-let-7c expression. Immunoblot analysis
using the HMGA2 antibody in cells exposed to 0 Gy or 200 mGy, 1 and 4 hours after irradiation. A. Non-
transfected cells showed a slight down-regulation of the HMGA 2 expression 1and4 hours after irradiation.
B. Immunoblot analysis of control inhibitor transfected cells exposed 0 Gy or 200 mGy 1 h or 4 hours post-
irradiation. A trend for down-regulation is seen at 4 h after 200 mGy. C. Cells transfected with precursor
let-7c resulted in complete knock-down of the HMGA2 expression irrespective of irradiation. D. Cells
transfected with let-7c inhibitor showed an up-regulation of the HMGA2 protein irrespective of irradiation.
..................................................................................................................................................................... 89 Note: The un-transfected (A) and the transfected (C) were loaded on the same gel, similarly the scrambled B,
and the transfected let-7c inhibitor (D) were loaded on the same gel. ......................................................... 89 Figure 28: Merge of the 2 most significant networks obtained from deregulated proteins and miRNAs. The
network represents a total of 27 deregulated molecules (proteins and miRNAs) involved in “cancer,
developmental disorder” and “cell cycle, cell death, DNA replication, recombination and repair”. All
coloured molecules are molecules with differential expression values (molecules in green represent down-
regulation and red represents up-regulation. Arrows in orange represent interaction between the network 1
and network 2). Dotted lines indicate indirect interactions and solid line represents direct interactions and
loops represent self-regulation. .................................................................................................................... 92 Figure 29: Two most significant networks obtained from proteins and miRNAs deregulated 24 hours after
exposure to a radiation dose of 200 mGy. The network A represents a total of 35 molecules (proteins and
miRNAs) of which 10 were found to be differentially regulated after irradiation. The molecules are
involved in “cancer, cell death and necrosis”. The network B shows a total of 35 molecules 5 of which
were deregulated after irradiation and were involved in “cancer and hematological disease”. All coloured
molecules are molecules with differential expression values (molecules in green represent down-regulation
and the red ones represent up-regulation). Dotted lines indicate indirect interactions and solid line
represents direct interactions and loops represent self-regulation.. .............................................................. 93
Table of Figures
VIII
Figure 30: Immunoblot validation of differentially expressed proteins. Irradiated samples (4 h / 24 h, 2.5 Gy) and
respective controls were separated on 1D SDS-PAGE gels. Relative expression ratios (as indicated in
Table 23) were calculated after background subtraction with either ImageQuant 5.2 or TotalLAB TL100
softwares and normalised to the expression level of actin. The columns correspond to the mean values of
three technical replicates of two biological samples ± SD. Asterisk on the bars represent p-values (**
corresponds to p < 0.01, * corresponds to p < 0.05). P-values were calculated using student’s t-test. ........ 95 Figure 31: Immunoblot analysis of 5 OXPHOS subunits (24 h after irradiation). Analysis using total OXPHOS
rodent antibody cocktail revealed a significant down-regulation of four subunits NDUFB8 (C-I-20), C-III-
core2, C-IV-I and C-V-α. 30µg of total cell lysate was loaded in each lane of a 12 % gel (* corresponds to
p < 0.05). A: relative expression change between controls and treated cells. B: Representative images of
the blots. C: Fold differences between control and treated samples normalised to tubulin are indicated in
the form of a table; “C” represents control and “T” represents treated samples. P-values were calculated
using student’s t-test. ................................................................................................................................... 97 Figure 32: Venn diagram representing deregulated proteins identified with 2D-DIGE and SILAC methods
deregulated at 4 h and 24 h after irradiation. Five proteins were shared between the 2D-DIGE and SILAC
methods all at 24 h after 2.5 Gy irradiation. No overlap was seen in the deregulated proteins between the
two methods. One protein, desmoplakin was found to be differentially expressed at both 4 h (down-
regulated) and 24 h (up-regulated) by 2D-DIGE method. ......................................................................... 103
Index of Tables
IX
Table 1: List of Antibodies (* represents cocktail containing several antibodies) ................................................ 28 Table 2: List of miRNA inhibitors ........................................................................................................................ 29 Table 3: List of Pre-miRNAs ................................................................................................................................ 29 Table 4: Depicts the number of irradiated cells, feeder cells and their respective doses used in clonogenic assays.
..................................................................................................................................................................... 33 Table 5: Protocol used for IEF (isoelectric focussing) .......................................................................................... 41 Table 6: Protocol for setting filters during image acquisition ............................................................................... 42 Table 7: Represents the steps involved in silver staining ...................................................................................... 43 Table 8: Composition of the reaction mixture for a RT-PCR ............................................................................... 48 Table 9: Experimental setup for the RT-PCR reaction ......................................................................................... 48 Table 10: List of deregulated proteins 4 h after 2.5 Gy irradiation identified and quantified by SILAC with
significance. ................................................................................................................................................. 55 Table 11: List of deregulated proteins 24 h after 2.5 Gy irradiation identified and quantified by SILAC with
significance. ................................................................................................................................................. 56 Table 12: A list of all (27) deregulated proteins 4 h after irradiation identified and quantified by 2D-DIGE.
Corresponding spot numbers on the gels are indicated in the table. ............................................................ 62 Table 13: List of deregulated proteins 24 h after irradiation identified and quantified by 2D-DIGE with
significance (** = p ≤ 0.01). Corresponding spot numbers on the gels are indicated in the table. .............. 63 Table 14: The most significant networks and functions of the deregulated proteins. ........................................... 68 Table 15: Ingenuity names, protein names, UniProt ID and fold deregulation of proteins in the top two networks
of the molecules in Figure 14 and Figure 15. ............................................................................................... 68 Table 16: Biological pathways associated with deregulated proteins 4 h after irradiation. .................................. 72 Table 17: Most significant networks and functions associated with the deregulated proteins at the 24 h time point
after irradiation. ........................................................................................................................................... 74 Table 18: Biological pathways associated with the deregulated proteins at the 24-hour time point after
irradiation. .................................................................................................................................................... 74 Table 19: List of the significantly deregulated proteins 4 hours after irradiation with the 200 mGy dose identified
and quantified by SILAC. ............................................................................................................................ 83 Table 20: List of significantly deregulated proteins 24 h after irradiation with a 200 mGy dose identified and
quantified by SILAC. ................................................................................................................................... 83 Table 21: Most significant networks and functions associated with the deregulated proteins. ............................. 90 Table 22: Most significant networks and functions associated with the differentially expressed proteins 24 hours
after a radiation dose of 200 mGy. ............................................................................................................... 91 Table 23: The relative expression ratios of proteins chosen by immunoblotting .................................................. 96 Table 24: List of the deregulated proteins found using both 2D-DIGE and SILAC at 24 h after irradiation.
Corresponding spot numbers for proteins found to be deregulated by 2D-DIGE are indicated in the table.
................................................................................................................................................................... 102 Table 25: miRNAs found to be deregulated in endothelial cell / cell lines after irradiation in different studies. 111
Summary
1
1. Summary
Endothelial cells are highly sensitive to high doses of ionising radiation, the cellular response
leads to acute damages on the endothelium. Epidemiological data suggest that even moderate
doses (> 500 mGy to 1 Gy) may increase the risk of cardiovascular disease. At lower doses
endothelial cell stress and vascular damage may still occur, but the relevance of these effects for
long-term tissue damage is unknown.
The aim of this study was to analyse the effect of low- (200 mGy) and high-dose (2.5 Gy) Cs137 γ
–radiation (dose rate = 500 mGy / min) on the EA.hy926 cells which serve as a good model
mimicking the functions of the endothelial cells in vivo. The effect of ionizing radiation on the
proteome of the endothelial cells were analysed at 4 h and 24 h after exposure. For the high dose
proteomic studies two complementary proteomic strategies namely ‘stable isotope labeling by
amino acids in cell culture’ (SILAC) and 2D-DIGE analysis were used. The low dose analysis
was performed using the SILAC method only. Further, after exposure to low dose radiation the
alterations in the miRNAome was analysed using TaqMan® Low Density Array Human
MicroRNA Panel A v2.1 and TaqMan® Array Human MicroRNA B Card v2.0 to obtain a broader
perspective of the cellular response.
The high-dose exposure triggered considerable alterations in the endothelial protein expression.
The deregulated proteins were mainly categorised in four key pathways: (i) glycolysis /
gluconeogenesis (ii) oxidative phosphorylation, (iii) Rho-mediated cell motility and (iv) non-
homologous end joining (NHEJ). After exposure to high dose radiation an immediate down-
regulation was seen in the Ku70/Ku80 heterodimer and proliferating cell nuclear antigen (PCNA)
proteins belonging to the NHEJ DNA repair pathway. Later time point showed significant
decrease in the expression levels of proteins of the oxidative phosphorylation (OXPHOS) pathway
along with a significant expression increase in the enzymes of the glycolytic pathway. These
alterations might result in damaging the endothelial cells further leading to the dysfunctioning of
the endothelium, a condition where an imbalance in the vasodilatory and vasoconstricting
products of the endothelium are observed. This may result in the damage of the vascular system.
The alterations in the proteome level after exposure to low dose radiation (200 mGy) were subtle
when compared to that of the higher dose. Consistent increase in protein expression was observed
for translation proteins only. Pronounced alterations in the expression levels of miRNAs
(microRNA) were observed at the earlier time point (4 h) after irradiation which subsided after 24

Summary
2
h. The let-7 family miRNAs namely the let-7b, let-7c, let7d and let-7g were found to be radiation
responsive. In contrast to the high dose radiation study the data from the low dose radiation
experiments also indicated a transient stress response that occurs immediately after irradiation and
subsides with time. Further, this study could show that SILAC is a robust method and can be
successfully used for studying proteomic effects of in vitro irradiation studies.

Zusammenfassung
3
2. Zusammenfassung
Endothelzellen reagieren sehr empfindlich auf hohe Dosen ionisierender Strahlung. Ein
Hauptgrund für die akute schädliche Wirkung auf das Endothel nach Bestrahlung ist der Zelltod
der Endothelzellen. Epidemiologische Daten weisen darauf hin, dass moderate Dosen (> 500 mGy
bis 1 Gy) das Risiko kardiovaskulärer Erkrankungen erhöhen. Bei geringeren Strahlendosen
könnten zwar auch endothelialer Zellstress und vaskuläre Schäden stattfinden, aber die Relevanz
dieser Strahlenwirkungen für einen langfristigen Gewebeschaden ist bislang unbekannt.
Das Ziel dieser Arbeit war, die Wirkung niedriger (200 mGy) und hoher (2,5 Gy) Dosen Cs137 γ-
Strahlung (Dosisleistung = 500 mGy / min) auf Endothelzellen zu analysieren. Hierfür wurde die
Endothelzelllinie EA.hy926 verwendet, die ein geeignetes Zellkultur-Modell darstellt, um
proteomische Veränderungen in Endothelzellen zu verschiedenen Zeitpunkten (4h und 24h) nach
in vitro-Bestrahlung zu untersuchen. Für die Untersuchung proteomischer Veränderungen bei
hohen Dosen wurden zwei komplementäre Methoden, die sog. ‚stable isotope labelling amino
acids in cell culture’ (SILAC) Methode und die 2D-DIGE Analyse, benutzt. Die Analyse von
Effekten bei niedrigen Dosen wurde nur mit der SILAC Methode durchgeführt. Allerdings
wurden hier auch Veränderungen auf der miRNA Ebene untersucht, um einen besseren
mechanistischen Einblick in die zelluläre Strahlenantwort bei niedrigen Dosen zu bekommen.
Eine Bestrahlung mit der hohen Dosis hatte beträchtliche Veränderungen im Proteom der
Endothelzellen zur Folge. Die deregulierten Proteine nach Bestrahlung konnten folgenden vier
Hauptklassen zugeordnet werden: (i) der Glykolyse/Glukoneogenese (ii) der oxidativen
Phosphorylierung, (iii) der Rho-vermittelten Zellmotilität und (iv) der Nicht-homologen
Endverknüpfung (NHEJ). Nach 2,5 Gy Cs137 γ-Strahlung war bereits nach vier Stunden eine
deutliche Herunterregulierung der Expression der Untereinheiten des Ku-Heterodimers (Ku70 und
Ku80) und des Proliferating Cell Nuclear Antigen (PCNA) nachzuweisen. Alle drei Proteine
besitzen eine wichtige Funktion innerhalb des NHEJ DNA-Reparatursignalweges. Im Gegensatz
dazu nahm zu einem späteren Zeitpunkt (24 h) die Expression von Proteinen der oxidativen
Phosphorylierung (OXPHOS) und von wichtigen Enzymen der Glykolyse zu. Diese
Proteinveränderungen könnten zu einer Schädigung der Endothelzellen und in weiterer Folge zu
einer Dysfunktion des Endothels führen; letztere könnte dann infolge eines Ungleichgewichts
vasodilatorischer und vasokonstriktorischer Produkte des Endothels zu einer Schädigung des
vaskulären Systems führen.

Zusammenfassung
4
Die Proteomveränderungen, die nach der geringeren Strahlendosis von 200 mGy zu beobachten
waren, waren deutlich weniger im Vergleich zu den nachgewiesenen Veränderungen bei 2,5 Gy.
Eine gleichbleibende Zunahme der Expression konnte nur für Proteine der Translation
nachgewiesen werden. Es konnten jedoch bei der niedrigeren Dosis auch signifikante
Veränderungen der miRNA-Expression zum früheren Zeitpunkt (4 h) nach Bestrahlung
nachgewiesen werden. Zum späteren Zeitpunkt (24 h) nach Bestrahlung waren diese miRNA-
Expressionsänderungen weniger stark ausgeprägt. Für die miRNAs der let-7 Familie (let-7b, let-
7c, let-7d und let-7g) konnte gezeigt werden, dass sie durch Strahlung reguliert wird. Somit
zeigen die Daten, dass nach einer Bestrahlung mit einer geringeren Dosis eine transiente
Stressantwort in Endothelzellen stattfindet, die innerhalb der untersuchten Zeitspanne bereits
nachlässt. Weiter konnte die vorliegende Doktorarbeit zeigen, dass SILAC eine zuverlässige
Methode darstellt, um proteomische Effekte nach in vitro Bestrahlung von Endothelzellen
nachzuweisen.

Introduction
5
3. Introduction
History
Ionising radiation was applied for therapeutic purposes soon after the discovery of x-rays by
William Roentgen in 1895 (Durovic and Spasic-Jokic, 2008). In the early 1900’s the use widened
with applications in clinical diagnostics, and treatment of diseases, use of radiation therapy to cure
cancer in the 1920’s was to some extent successful (O'Farrell, 1975, Perluigi et al., 2009, Preston
L.Dale 1994). Apart from therapeutic applications ionising radiation has been used for
occupational purposes in the form of radium painting of luminous watch dials, nuclear panels,
aircrafts etc (Herrera et al., 2010). One other non-therapeutic breakthrough in the field of ionising
radiation was the development of nuclear power generation plants. The first reported adverse
effects of radiation were noticed to be skin lesions after exposure (Gilchrist, 1897). The adverse
consequences of all of these applications have come to the forefront, as in the case of over-
exposure during radiation therapy, atomic bomb explosions or in the case of nuclear accidents
(Chernobyl). The harmful effects of exposure to ionising radiation are dependent on the quality
and dose of ionising radiation received (Beebe, 1982).
Effects of ionising radiation on health
i) Cancer
As the therapeutic application of radiation for non-lethal diseases (mostly skin lesions and thyroid
disorders) increased, cases of cancer in long term survivors were reported (Takahashi and
Kitabatake, 1965, Valentini et al., 2011). A classical example for the fatality of non-therapeutic
application was occupational exposure to ionising radiation leading to illness and death by
malignancies in x-ray workers and women who painted dials with radium to produce “glow in the
dark clocks” and watch dials (Carnes et al., 1997).
Increased risks of several types of cancer have been reported in Japanese atomic bomb survivors
as a late effect of exposure to radiation (Preston et al., 2007, Preston et al., 2004). Furthermore the
Chernobyl nuclear power plant accident released huge amounts of ionising radiation into the
environment, leading to a significant increase of several types of cancer (Sarin, 2011,
www.who.int) in thyroid cancer in exposed children and youth (Prisyazhiuk et al., 1991, Kazakov
et al., 1992, Baverstock et al., 1992), and cataracts in clean-up workers. First signs of leukaemia
were observed in exposed children and clean-up workers (Ivanov et al., 1993, Ivanov et al., 2006).
Introduction
6
Further a non-significant trend was observed in the increase of breast cancer in exposed
individuals (Pukkala et al., 2006, Bogdanova et al., 2010).
ii) Vascular diseases
Research on pathological non-cancer effects of ionising radiation is a relatively new field. This
has given the first indications that diseases such as hypertension and myocardial infarction,
digestive and respiratory diseases may accompany radiation exposure.
Ionising radiation increases the morbidity and mortality from cardiovascular (CVD) and
cerebrovascular diseases (CBVD) (Azizova et al., 2010b, Azizova et al., 2010a, Preston et al.,
2003). According to Shimizu et al. an increased risk of CVD was seen in atomic bomb survivors.
They showed that doses above 0.5 Gy lead to an increased risk of heart diseases in A-bomb
survivors. (Shimizu et al., 2010).
Therapeutic use of radiation has also been associated with an increased risk for CVD. Darby et al.
showed an increased mortality from heart diseases after radiation therapy in breast cancer patients
of the 1970’s and early 1980’s (Darby et al., 2005). A comparative study between the general
population and a cohort of 7033 Hodgkin’s disease patients treated with radiation therapy
revealed an increased risk of mortality risk by myocardial infraction(Swerdlow et al., 2007).
Increased risk for mortality from coronary heart diseases was also observed in patients treated
with radiation therapy for peptic ulcer (Carr et al., 2005) and in childhood cancer patients who had
received a dose of > 5 Gy to the heart (Tukenova et al., 2010).
The damaging effects of high-dose radiation (> 5 Gy) on the vasculature of the heart was
demonstrated histopathologically by Hoving et al. (Hoving et al., 2008). High doses of ionising
radiation causes damage to the coronary arteries and cardiac microvasculature and diffused
fibrotic injury to the pericardium and myocardium; endothelial damage was also observed in all
these cases (Demirci et al., 2009, Adams et al., 2003). Even though there are no ideal
radiobiological models for local heart irradiation a few animal model studies have been carried
out in the recent past. Alterations in the bovine and rat aortic endothelial cells and mouse cardiac
endothelial cells after irradiation have been observed (Jelonek et al., 2011, Gajdusek et al., 2001).
Studies using mouse models by Stewart et al. (Stewart et al., 2006) suggest that high doses of
radiation (> 8 Gy) accelerate the formation of inflammatory, macrophage rich atherosclerotic
plaques in the carotid arteries of atherosclerotic prone ApoE (- / -) mice. Further, Stewart et al.
(Stewart et al., 2010) showed that in a C57B1 / 6 mouse model, local heart irradiation ranging
from 2-16 Gy induced progressive structural damage to the myocardium and the

Introduction
7
microvasculature. Although local irradiation of the heart with 16 Gy was lethal only modest
changes in the cardiac function were observed before animals succumbed.
The blood vessels of the cardiovascular system are lined with thin continuous monolayer of
ovaloid endothelial cells. This thin layer of endothelial cells lining the blood vessels is called the
vascular endothelium. The vascular endothelium plays an essential role in the normal functioning
of the circulatory system.
Endothelial cell biology
The endothelium secretes products such as antithrombotic factors, clotting agents, growth factors,
and vasodilators that function as mediators of endothelial functioning (Michiels, 2003). The
endothelium regulates homeostasis, is responsible for the smooth blood flow inside the lumen and
functions as a barrier between the circulating blood and the subendothelial matrix (Marsden et al.,
1991). It also plays a major role in vascular wall remodelling, inflammation, thrombosis,
vasodilatation and vasoconstriction (Michiels, 2003, Luscher et al., 1990, Furchgott and
Zawadzki, 1980).
Upon endothelial injury for example during physiological stress condition some of its vital
functions such as fibrinolysis, angiogenesis, and synthesis of enzymes and cytokines are either
inhibited or nullified (Fajardo, 2008). Endothelial dysfunction (a condition where in an imbalance
in the vasodilatory and vasoconstricting products of the endothelium are observed), as an end
point for several conditions such as alterations in inflammatory mediators, vasodilatory factors
and matrix products, has been observed in several vascular disorders (Forgione et al., 2000).
Figure 1 represents the alterations in the endothelial cell functions seen under pathological
conditions or injury.

Introduction
8
Figure 1: Pattern of functions of vascular endothelium under normal and pathological conditions. Under normal conditions endothelial cells produce substances which control constriction or dilation of blood vessels, anti-thrombotic and anti-inflammatory substances. These substances regulate permeability, adhesion and proliferation (top right). In pathological conditions endothelial dysfunction leads to alteration of the modulators produced by endothelial cells, thus resulting in increased inflammation, vasoconstriction, coagulation etc. (bottom right). Modified source: (Rodriguez-Feo and Pasterkamp, 2007).

Introduction
9
Biological data indicate that the vascular endothelium is very sensitive to ionising radiation.
Endothelial cells produce excessive amounts of eicosanoids (prostaglandins, prostacyclins,
thromboxanes and leukotrienes) after exposure to radiation. This may further contribute to the
prothrombotic status and vascular disruption (Stewart et al., 2010, Michalowski, 1994). Oxidative
stress triggered by ionising radiation may also lead to additional endothelial cell damage and
vascular diseases, leading further to cardiovascular damage (Coyle and Kader, 2007).
Even though the molecular and biological mechanisms of the endothelial cell response to high and
low doses of ionising radiation may differ, it has been shown that radiation, irrespective of dose
causes alterations that may damage the vasculature. In the case of injury or stress to cells the
damage may occur at different molecular levels, including damages to the proteins. Nylund et al.
and Pluder et al. have shown significant alterations at the proteomic level in endothelial cells after
exposure to ionising radiation (Nylund and Leszczynski, 2006, Pluder et al., 2011).
Proteins and ionising radiation
Proteins are macromolecular and building blocks that are essential for normal cellular function.
Based on their biological activity proteins can be classified into several functional classes such as
enzymes, structural or support proteins, transport proteins, antibodies, peptide hormones,
metabolic, mechanical and contractile proteins (Jeremy M Berg, 2002).
Ionising radiation causes structural and chemical alterations in proteins such as alterations in
amino acids, changes in the formation and breakage of disulfide bonds, fragmentation and
decarboxylation have all been observed (Chapelier et al., 2001, Weik et al., 2002). Expression
level changes of proteins involved in cell cycle regulation, cytoskeleton maintenance, stress
response, and tumor metastasis have been observed in irradiated human liver cells (Zuo et al.,
2010). In a literature review Marchetti et al. reported 173 proteins that were found to be altered
either in an immediate or late response to high doses of ionising radiation. They reported that the
most common radiation influenced changes seen in multiple primary cell lines, primary cells and
tissues were in proteins involved in apoptosis and DNA repair, oxidative stress, cell signalling,
metabolism, signal-transduction, post-translational modifications and degradation (Marchetti et
al., 2006).
Oxidative stress caused by ionising radiation due to the impaired respiration results in elevated
levels of reactive oxygen species (ROS), especially in the mitochondria (Durovic and Spasic-
Jokic, 2008, Barjaktarovic et al., 2011, Azimzadeh et al., 2011). This leads to DNA damage,
protein oxidation, genomic instability, and mitochondrial dysfunctioning of the cell.

Introduction
10
ROS are highly reactive radicals that include organic and inorganic oxygen ions, peroxides and
free radicals. ROS are produced during normal oxygen metabolism and play a significant role in
several cell signalling pathways. Oxidation by ROS can cause degenerative effects to amino acids,
proteins, lipids and DNA thereby affecting the normal functioning of the cell (Shacter, 2000).
ROS disturbs the redox reactions that are relevant in metabolic pathways and homeostasis (Galli
et al., 2005). In unstable hamster fibroblast cell lines exposed to 10 Gy irradiation, Miller et al.
observed increased ROS production along with alterations in the expression levels of acetyl-CoA-
acetyltransferase as well as proteins involved in the tricarboxylic acid (TCA) cycle and oxidative
phosphorylation (Miller et al., 2008). Alterations in the expression levels of acetyl-CoA-
acetyltransferase, cofilin, and Rho GDP dissociation inhibitor factor were observed in a human
endothelial cell line after exposure to a low gamma dose of 200 mGy (Pluder et al., 2011).
Other important proteins influenced by ROS are pro-apoptotic proteins such as cytochrome c and
apoptosis-inducing factors. Increased levels of ROS have also been associated with activation of
NF-κB (Luscher et al., 1990). Further, there are evidences for radiation-induced alterations in
proteins of the metabolic pathways such as glycolysis / gluconeogenesis, fatty acid metabolism,
and ketogenesis but the exact mechanisms are unclear (Sriharshan et al., 2012).
miRNA and ionising radiation
Among the regulators of protein expression are microRNAs (miRNAs), a class of small 22
nucleotide long non-coding RNAs. The discovery of their role in the modification of the protein
expression levels has given a completely new insight into the regulatory processes of the cell
(Victor, 2001). So far, 1527 putative human miRNA sequences have been discovered
(www.mirbase.org). They are important components of the post-transcriptional regulation of gene
expression and play a significant role in several signalling pathways as well as in cell
proliferation, homeostasis, and cell death (Ambros, 2004).
Only recently the field of miRNA research has elucidated the role of these molecules as
responsive targets to external and internal stimuli. Dickey et al. (Dickey et al., 2011) showed that
miRNAs play a critical role in human artificial 3D tissue systems (with close resemblance to
epithelial tissues). The human artificial 3D tissue systems were irradiated with doses ranging from
200 mGy-2 Gy (Dickey et al., 2011). In this study the let-7 microRNA family, miR-21, miR-20a,
miR 24, miR-26b, miR-29a, miR-29c, miR-103, miR-223, and miR-663 were shown to be altered
and radiation responsive.

Introduction
11
In Jurkat and TK6 cells the expression levels of miRNAs belonging to the let-7 family were found
to be deregulated by ionising radiation (Chaudhry, 2009). Studies on primary human dermal
microvascular endothelial cells showed alterations in the expression levels of 11 miRNAs after
exposure to a gamma dose of 2 Gy. A functional analysis on the biological function of miR-189,
let-7g and miR-20a revealed that alterations influenced the cell survival, proliferation, endothelial
cell radiosensitivity and angiogenesis (Wagner-Ecker et al., 2010). Kraemer et al. (Kraemer et al.,
2011) established a functional correlation between miRNAs, apoptosis and cell cycle checkpoint
activation in the endothelial cell line EA.hy926 after exposure to a gamma dose of 2.5 Gy ionising
radiation. Vincenti et al. showed that HUVECs (human umbilical vein endothelial cells) after
exposure to an x-ray dose of 1 Gy exhibited deregulation of the miR-17-92 cluster and miR-221 /
222. The expression levels of the micro RNAs in the miR-17-92 cluster were correlated with a
transient increase in c-Myc-mRNA accumulation and an increase of the transcription factor c-Myc
in the nucleus (Vincenti et al., 2011).
MiRNAs are further known to be key players in the regulation of vascular diseases, cancer,
neurological diseases and inflammatory diseases (Esteller, 2011). Urbich et al. (Urbich et al.,
2008) in a review showed that miR-21, miR-155, miR-126 and miR-17-92 cluster might play an
important role in modulation of vascular diseases. They also reported miR-17-92 cluster, miR-
150, miR-424, miR-17-5p, miR- 20a, miR-106a and miR-146 as important candidates for
inflammatory responses that occur during vascular diseases.
Objectives
Even though there is some knowledge on ionising radiation-induced alterations in protein
expression, the research has so far been limited to only particular groups of proteins (Zuo et al.,
2010, Marchetti et al., 2006, Durovic and Spasic-Jokic, 2008). Furthermore, only some biological
mechanisms are well understood. In order to gain deeper understanding of the molecular
mechanisms of radiation-induced alterations it is necessary to analyse changes in the total
proteome. Proteomic studies include information on global expression and modification changes
of proteins and their functions, protein networks and interactions with one another and with other
molecules.
Several techniques have been established for proteomic studies. One of the earliest and most
popular methods is 2DE (two dimensional gel electrophoresis), developed in the 1950’s with
continuous improvement of the technique until the invention of 2D-DIGE (two dimensional
differential gel electrophoresis) in the 1970’s (Miller et al., 2008, O'Farrell, 1975). The
development of mass spectrometry (MS) based proteome analysis has enabled the generation of
Introduction
12
large amounts of data, with information about the interactions and functions of the proteins.
Recently developed proteomic studies are based on differential protein or peptide labelling.
Different strategies that were used for MS based proteomic analysis are Isotope-Coded Protein
Label (ICPL) (Preston et al., 2004), Isobaric Tags for Relative and Absolute Quantitation
(ITRAQ) (Chaudhry, 2009) and Stable Isotope Labelling with Amino Acids in Cell Culture
(SILAC) (Ong et al., 2002).
The goal of this study was to elucidate response of endothelial cells high and low dose ionising
radiation, the interaction of proteins and miRNAs in this response and their role in the aetiology
of cardiovascular diseases. In this thesis, the human endothelial cell line EA.hy926 was used as an
in vitro model for radiation induced proteome alterations. The cellular proteome was investigated
to identify radiation-regulated proteins using 2D-DIGE and SILAC strategies. SILAC is a mass
spectrometry based method used to analyse the proteome of a cell (Ong et al., 2002, Soufi et al.,
2010, Ong et al., 2003, Zhang et al., 2008). SILAC technique uses heavy isotopes of carbon and
nitrogen of lysine and arginine amino acids to label cellular proteins biosynthetically in one pair
of cell culture either control or treated. By comparing the abundance of isotopically labelled
proteins with unlabelled proteins it is possible to identify and quantify regulated proteins. The
proteomes were analysed post irradiation to a clinically relevant gamma dose of 2.5 Gy and a
lower gamma dose of 200 mGy at 4 and 24 h. MiRNA profiling was also done for the low dose
(200 mGy) at 4 and 24 h post irradiation.
Materials and Methods
13
4. Materials
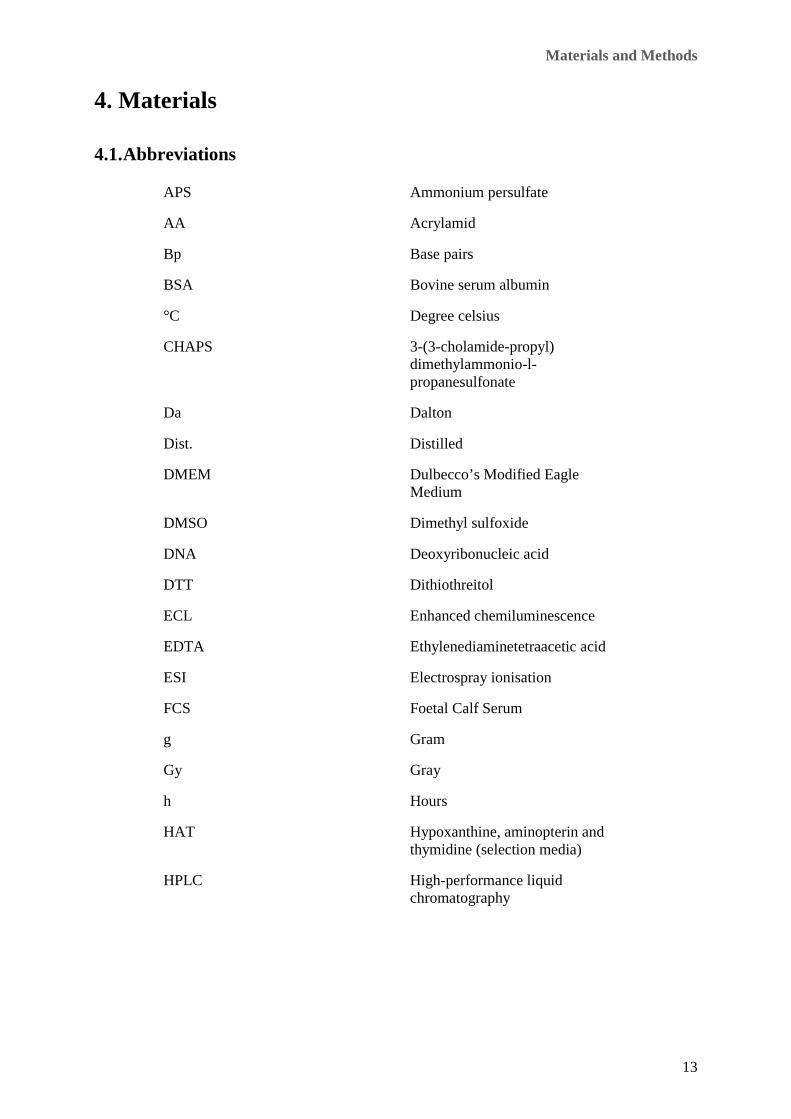
4.1. Abbreviations
APS Ammonium persulfate
AA Acrylamid
Bp Base pairs
BSA Bovine serum albumin
°C Degree celsius
CHAPS 3-(3-cholamide-propyl) dimethylammonio-l-propanesulfonate
Da Dalton
Dist. Distilled
DMEM Dulbecco’s Modified Eagle Medium
DMSO Dimethyl sulfoxide
DNA Deoxyribonucleic acid
DTT Dithiothreitol
ECL Enhanced chemiluminescence
EDTA Ethylenediaminetetraacetic acid
ESI Electrospray ionisation
FCS Foetal Calf Serum
g Gram
Gy Gray
h Hours
HAT Hypoxanthine, aminopterin and thymidine (selection media)
HPLC High-performance liquid chromatography

Materials and Methods
14
IPG Immobilised pH-Gradient
IR Ionising radiation
Kg Kilogram
kDa Kilo Dalton
l Liter
M Molar
m Milli (10-3)
min Minutes
miRNA microRNA
NHEJ Non-homologous end joining
PAGE Polyacrylamide gel electrophoresis
PBS Phosphate buffered saline
PCR Polymerase chain reaction
PI Propidiumiodide
PMSF Phenylmethylsulfonyl fluoride
RNA Ribonucleic acid
RNase Ribonuclease
rpm Revolutions per min
RT Room temperature
RT-PCR Real-time PCR
SDS Sodium dodecyl sulfate
sec Seconds
Ser Serine
SILAC Stable isotope labelling by amino acids in cell culture
snoRNAs Small nucleolar RNAs
SSB Single strand break

Materials and Methods
15
TEMED Tetramethylethylenediamine
Thr Threonine
Tris Tris(hydroxymethyl)aminomethane
Triton X-100 2-[4-(2,4,4-trimethylpentan-2-yl)phenoxy]ethanol
Tween 20 2,3-dihydroxypropyl octanoate
Tyr Tyrosine
UV Ultraviolet
V Volt
vol Volume
v / v Volume per volume
W Watt
wt Weight
w / v Weight per volume
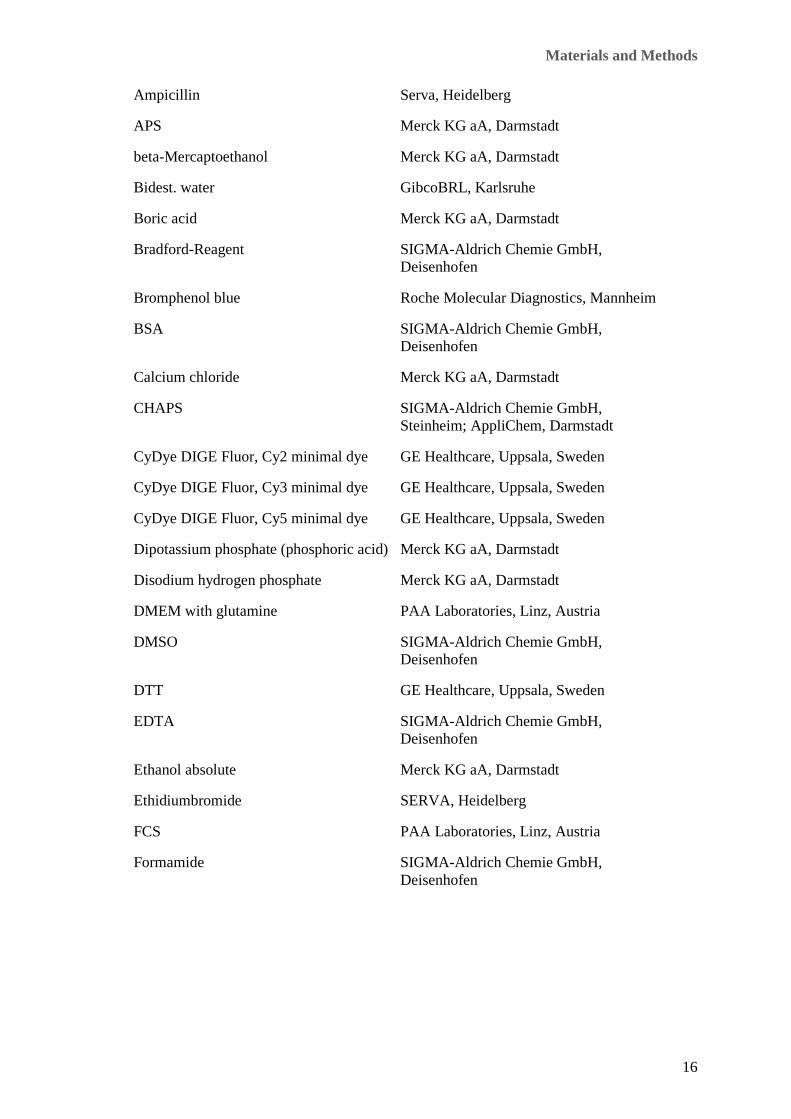
4.2. Chemicals
10x Roti Block ROTH GmbH, Karlsruhe 13C6 15N4 L-Arginine-HCl Thermo scientific, Pierce research
products, USA
2-Mercaptoethanol Merck KG aA, Darmstadt
Acetic acid Merck KG aA, Darmstadt
Acrylamid / BisAA 30 % / 0.8 % (ProtogelTM), National Diagnostics, Atlanta, USA
40 % / 19:1, Biozym, Hess. Oldendorf
Agarose Biozym, Hess. Oldendorf
Ammonium acetate Merck KG aA, Darmstadt
Ammonium chloride SIGMA-Aldrich Chemie GmbH, Deisenhofen
Ammonium sulphate Carl Roth GmbH & Co. KG, Karlsruhe
Materials and Methods
16
Ampicillin Serva, Heidelberg
APS Merck KG aA, Darmstadt
beta-Mercaptoethanol Merck KG aA, Darmstadt
Bidest. water GibcoBRL, Karlsruhe
Boric acid Merck KG aA, Darmstadt
Bradford-Reagent SIGMA-Aldrich Chemie GmbH, Deisenhofen
Bromphenol blue Roche Molecular Diagnostics, Mannheim
BSA SIGMA-Aldrich Chemie GmbH, Deisenhofen
Calcium chloride Merck KG aA, Darmstadt
CHAPS SIGMA-Aldrich Chemie GmbH, Steinheim; AppliChem, Darmstadt
CyDye DIGE Fluor, Cy2 minimal dye GE Healthcare, Uppsala, Sweden
CyDye DIGE Fluor, Cy3 minimal dye GE Healthcare, Uppsala, Sweden
CyDye DIGE Fluor, Cy5 minimal dye GE Healthcare, Uppsala, Sweden
Dipotassium phosphate (phosphoric acid) Merck KG aA, Darmstadt
Disodium hydrogen phosphate Merck KG aA, Darmstadt
DMEM with glutamine PAA Laboratories, Linz, Austria
DMSO SIGMA-Aldrich Chemie GmbH, Deisenhofen
DTT GE Healthcare, Uppsala, Sweden
EDTA SIGMA-Aldrich Chemie GmbH, Deisenhofen
Ethanol absolute Merck KG aA, Darmstadt
Ethidiumbromide SERVA, Heidelberg
FCS PAA Laboratories, Linz, Austria
Formamide SIGMA-Aldrich Chemie GmbH, Deisenhofen

Materials and Methods
17
Glucose Merck KG aA, Darmstadt
Glycerine SIGMA-Aldrich Chemie GmbH, Deisenhofen
HAT (50x) Biochrom AG, Berlin
HEPES SIGMA-Aldrich Chemie GmbH, Deisenhofen
Hydrochloric acid Merck KG aA, Darmstadt
Imidazole AppliChem, Darmstadt
Immobiline Dry Strip pH 3-11 NL, 24 cm GE Healthcare, Uppsala, Sweden
Iodoacetamide GE Healthcare, Uppsala, Sweden
Isopropanol Merck KG aA, Darmstadt
Lipofectamine™ 2000 Invitrogen, Karlsruhe
Lipofectamine™ RNAiMax Invitrogen, Karlsruhe
Magnesium chloride SIGMA-Aldrich Chemie GmbH, Deisenhofen
Magnesium sulphate Merck KG aA, Darmstadt
Methanol Merck KG aA, Darmstadt
Nonidet-P40 Roche, Basel, Switzerland
NOV SIGMA-Aldrich Chemie GmbH, Deisenhofen
Phenol / Chloroform SIGMA-Aldrich Chemie GmbH, Deisenhofen
Phosphatase Inhibitor Cocktail Roche, Basel, Switzerland
Phosphate buffered saline (PBS Dulbecco Ca2+ and Mg2+free)
Biochrom
PMSF SIGMA-Aldrich Chemie GmbH, Deisenhofen
Ponceau-S-Red SIGMA-Aldrich Chemie GmbH, Deisenhofen
Potassium chloride Merck KG aA, Darmstadt

Materials and Methods
18
Potassium dihydrogen phosphate Merck KG aA, Darmstadt
Potassium hydroxide Merck KG aA, Darmstadt
Propidiumiodide SIGMA-Aldrich Chemie GmbH, Deisenhofen
Protease Inhibitor Cocktail 1 Roche, Basel, Switzerland
Protease Inhibitor Cocktail 2 Roche, Basel, Switzerland
ProtoGel® 30 % National Diagnostics, Atlanta, Georgia
Restore™ Western Stripping Buffer Pierce, Rockford, USA
RNaseA SIGMA-Aldrich Chemie GmbH, Deisenhofen
Roti®-Blue ROTH, Karlsruhe
SDS Serva, Heidelberg; GE Healthcare, Uppsala, Sweden
Silver nitrate AppliChem, Darmstadt
Skimmed milk powder ROTH GmbH, Karlsruhe
Sodium acetate Merck KG aA, Darmstadt
Sodium chloride Merck KG aA, Darmstadt
Sodium citrate ROTH GmbH, Karlsruhe
Sodium thiosulphate AppliChem, Darmstadt
Sucrose Merck KG aA, Darmstadt
TEMED Pharmacia Biotech GmbH, Freiburg
Thiourea SIGMA-Aldrich Chemie GmbH, Deisenhofen
Trichloroacetic acid Merck KG aA, Darmstadt
Tris Merck KG aA, Darmstadt
Trisodium citrate Merck KG aA, Darmstadt
Triton X-100 Merck KG aA, Darmstadt
Trypan Blue Stain 0,4 % GibcoBRL, Karlsruhe

Materials and Methods
19
TrypLE™ Express GibcoBRL, Karlsruhe
Trypsin GibcoBRL, Karlsruhe
Urea Merck KG aA, Darmstadt; GE Healthcare, Uppsala, Sweden
4.3. Instruments and lab wares
137Cs-γ-source HWM-D 2000, Waelischmüller,
Germany
7900HT Fast Real-Time PCR System Applied Biosystems, Darmstadt
Alpha Innotech FluorChem HD2 Alpha Innotech
Cell culture flasks Greiner Labortechnik GmbH, Frickenhausen
Centrifuges Biofuge pico, Heraeus, Hanau; Eppendorf Centrifuge 5415R, Eppendorf, Hamburg; Minifuge RF, Heraeus, Hanau; Multifuge 3SR, Heraeus, Hanau Sigma 1K15, Sigma Laborzentrifugen GmbH, Osterode am Harz
Centrifuge tubes (15 ml and 50 ml) BD FalconTM, Heidelberg
Countess™ automated cell counter Invitrogen, Karlsruhe
Countess™ cell counting chamber slide Invitrogen, Karlsruhe
Cuvette Brand, Wertheim
Cryotube™ vials (1 ml) Nunc A / S, Langenselbold
Disposable plastic gel Cassettes (1.5mm) Invitrogen, Karlsruhe
Ettan Dalt II system Amersham Pharmacia, Freiburg
Incubation chamber Heraeus, Hanau
Invert-Microscope IMT2 Olympus, Hamburg
Laminar airflow cabinet, Laminair® HBB 2472S
Heraeus, Hanau
Liquid Nitrogen tank biostor 5 Statebourne, Washington Tyne & Wear
Petri dishes Greiner Labortechnik GmbH, Frickenhausen
pH-Meter InoLab pH Level 1, UK

Materials and Methods
20
Photometer BioPhotometer, Eppendorf, Hamburg
4700 Proteomics Analyser (MALDI-TOF / TOF)
Applied Biosystems, Darmstadt
Scanner Umax, PowerLook 1000, Willich
Shaker Thermomixer comfort, Eppendorf, Hamburg; Infors AG, Bottmingen, Schweiz
StepOnePlus™ Real-Time PCR System Applied Biosystems, Darmstadt
Typhoon Trio™ Scanner GE Healthcare, Freiburg
Voltage source Biorad, München
Water bath GFL, Großburgwedel
Z1 Coulter Particle Counter tubes Beckman Coulter, Fullerton, CA
Z1 Coulter Particle Counter Beckman Coulter, Fullerton, CA
4.4. Cell culture
4.4.1 Cryopreservation medium
DMEM / DMEM heavy / DMEM Light 25 ml
FCS / DFBS 2.5 ml (10 %) (v / v)
DMSO 2.5 ml (10 %)
HAT medium (50x) [Biochrom AG] 10 ml
4.4.2 DMEM medium
DMEM [PAA Laboratories] 500 ml
Foetal calf serum [PAA Laboratories] 50 ml (10 %)
HAT medium (50x) [Biochrom AG] 10 ml (1x)

Materials and Methods
21
4.4.3 SILAC media
Light medium
DMEM medium [Fischer Scientific] 500 ml
Dialysed foetal bovine serum [Fischer Scientific] 50 ml (10 %) 12C6 L-lysine-2HCl [Fischer Scientific] 50 mg 12C6 14N4 L- arginine-HCl [Fischer Scientific] 50 mg
HAT medium (50x) [Biochrom AG] 10 ml (1x)
Heavy medium
DMEM medium [Fischer Scientific] 500 ml
Dialysed foetal bovine serum [Fischer Scientific] 50 ml (10 %) 13C6 L-lysine-2HCl [Fischer Scientific] 50 mg 13C6
15N4 L-arginine [Fischer Scientific] 50 mg
HAT medium (50x) [Biochrom AG] 10 ml (1x)
4.4.4 Buffers & solutions
0.5 % Agarose (2D-DIGE)
Agarose 0.5 g
1x Running buffer 100 ml
Microwave until the agarose is fully dissolved
Blocking buffer (Western blotting)
Skimmed milk powder 8 % Dissolve in 1x TBST
Materials and Methods
22
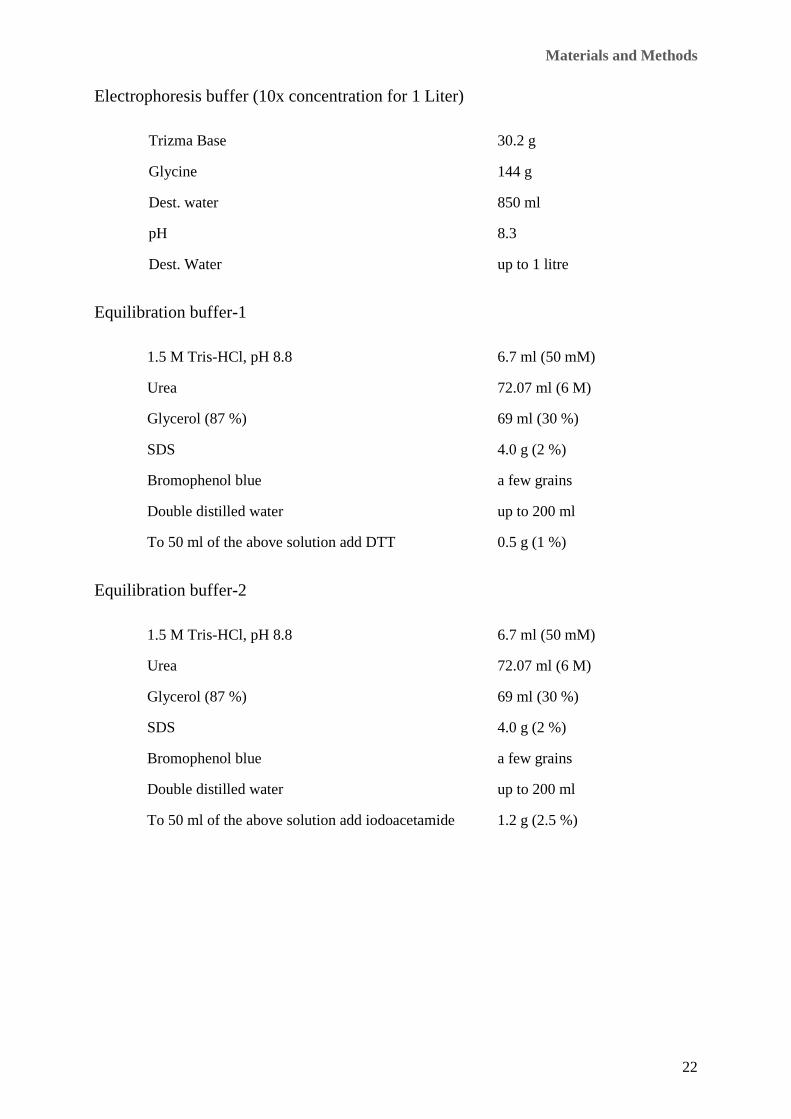
Electrophoresis buffer (10x concentration for 1 Liter)
Trizma Base 30.2 g
Glycine 144 g
Dest. water 850 ml
pH 8.3
Dest. Water up to 1 litre
Equilibration buffer-1
1.5 M Tris-HCl, pH 8.8 6.7 ml (50 mM)
Urea 72.07 ml (6 M)
Glycerol (87 %) 69 ml (30 %)
SDS 4.0 g (2 %)
Bromophenol blue a few grains
Double distilled water up to 200 ml
To 50 ml of the above solution add DTT 0.5 g (1 %)
Equilibration buffer-2
1.5 M Tris-HCl, pH 8.8 6.7 ml (50 mM)
Urea 72.07 ml (6 M)
Glycerol (87 %) 69 ml (30 %)
SDS 4.0 g (2 %)
Bromophenol blue a few grains
Double distilled water up to 200 ml
To 50 ml of the above solution add iodoacetamide 1.2 g (2.5 %)

Materials and Methods
23
Laemlli buffer (4x)
Tris-HCL, pH 6.8 240 mM
SDS 8 %
Glycerine 40 %
Bromphenolblue 0.08 %
beta-Mercaptoethanol 20 %
Lysis buffer I (SILAC)
(W / V) SDS 4 %
Tris HCL, pH 7.6 100 mM (0.1 M)
DTT 100 mM (0.1 M)
Protease inhibitor cocktail tablets 1 per 10 ml
Phosphatase inhibitor cocktail tablet 1 per 10 ml
Phosphatase inhibitor cocktail 2 1 per 10 ml
Lysis buffer II (2D-DIGE)
Tris HCL, pH 7.6 25 mM
NaCl 120 mM
Triton X-100 0.3 %
Protease inhibitor cocktail tablets 1 per 10 ml
Phosphatase inhibitor cocktail tablets 1 per 10 ml
PBS
NaCl 9 g
Bidest. Water Add 10000 ml
Autoclave
Materials and Methods
24
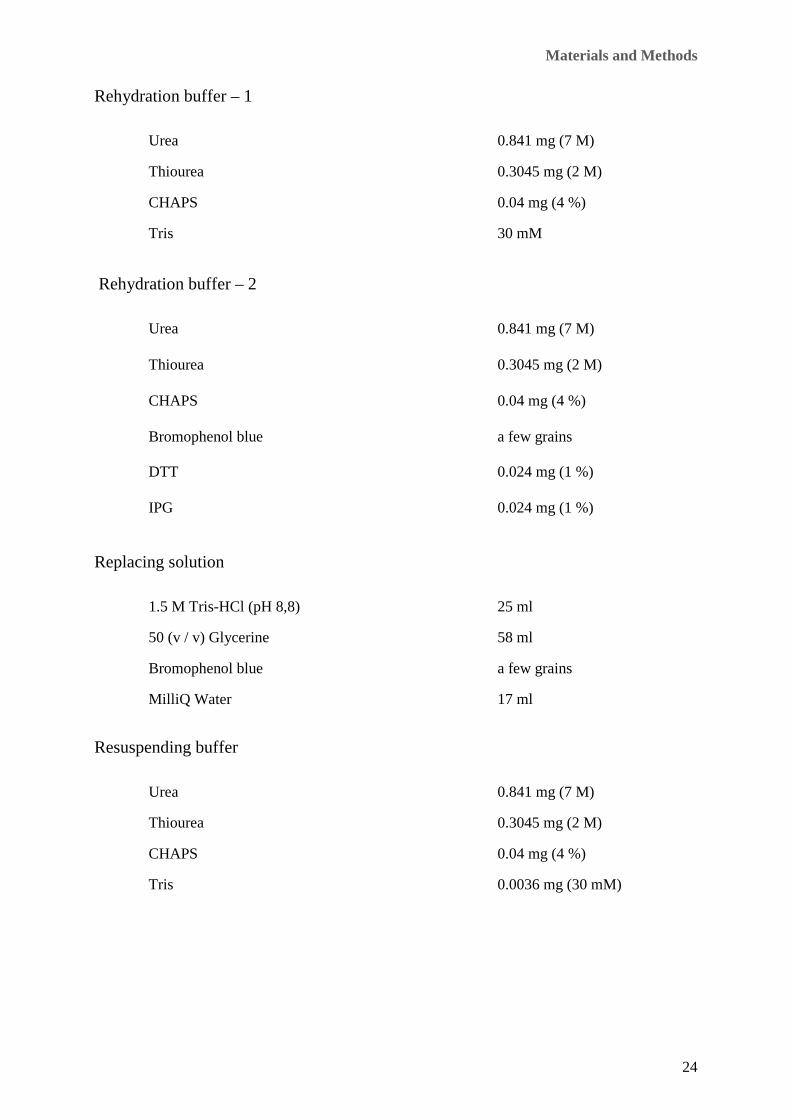
Rehydration buffer – 1
Urea 0.841 mg (7 M)
Thiourea 0.3045 mg (2 M)
CHAPS 0.04 mg (4 %)
Tris 30 mM
Rehydration buffer – 2
Urea 0.841 mg (7 M)
Thiourea 0.3045 mg (2 M)
CHAPS 0.04 mg (4 %)
Bromophenol blue a few grains
DTT 0.024 mg (1 %)
IPG 0.024 mg (1 %)
Replacing solution
1.5 M Tris-HCl (pH 8,8) 25 ml
50 (v / v) Glycerine 58 ml
Bromophenol blue a few grains
MilliQ Water 17 ml
Resuspending buffer
Urea 0.841 mg (7 M)
Thiourea 0.3045 mg (2 M)
CHAPS 0.04 mg (4 %)
Tris 0.0036 mg (30 mM)

Materials and Methods
25
Separating gel (12 %) (For 1D-SDS PAGE x 5 gels)
Acrylamide / Bisacrylamide 30 / 1 40.0 ml
1.5 M Tris-HCl, pH 8.8 25.0 ml
MilliQ water 32.9 ml
SDS (10 %) 1.0 ml
APS (10 %) 1.0 ml
TEMED (0.1 %) 0.1 ml
Separating gel (12 %) (for 2D-DIGE x 10 gels)
Acrylamide / Bisacrylamide 30 / 1 400 ml
1.5 M Tris-HCl, pH 8.8 250 ml
MilliQ water 329 ml
SDS (10 %) 10 ml
APS (10 %) 5.0 ml
TEMED (0.1 %) 0.5 ml
Stacking gel (4 %)
Acrylamide / Bisacrylamide 30 / 1 1.3 ml
0.5M Tris-HCl, pH 6,8 2.24 ml
MilliQ water 6.1 ml
SDS (0.1 %) 0.1 ml
APS (10 %) 0.05 ml
TEMED (0.01 %) 0.01 ml
Materials and Methods
26
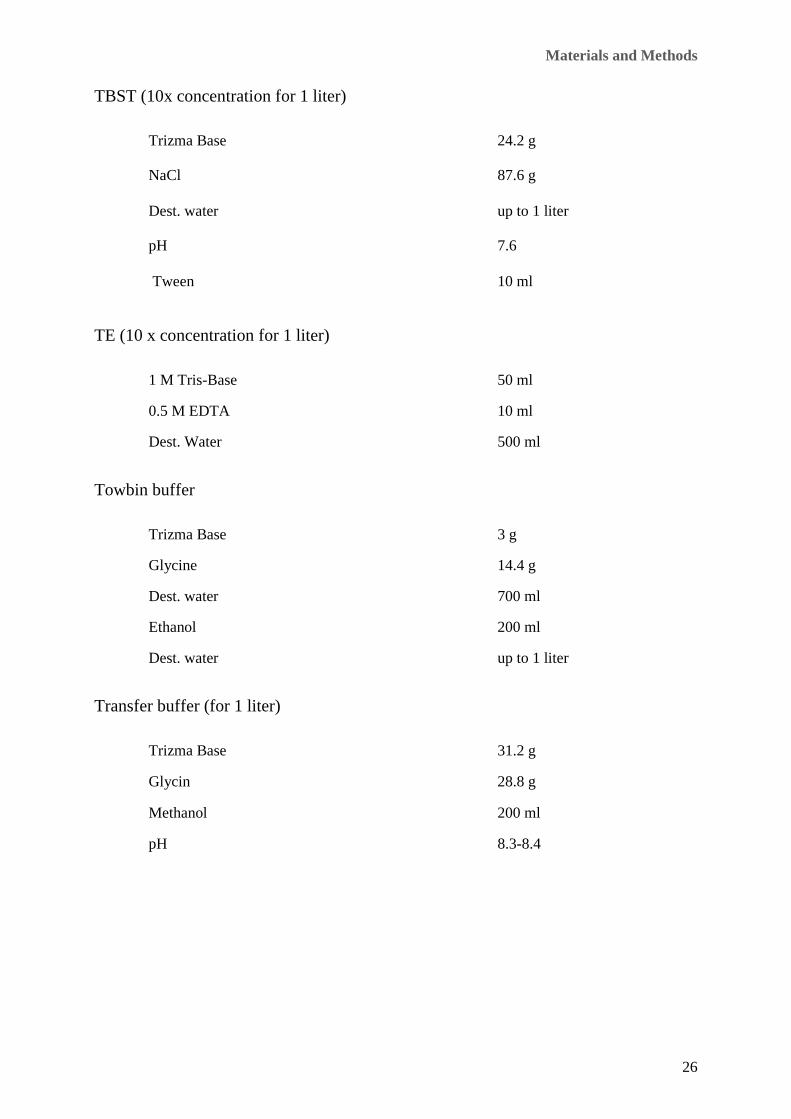
TBST (10x concentration for 1 liter)
Trizma Base 24.2 g
NaCl 87.6 g
Dest. water up to 1 liter
pH 7.6
Tween 10 ml
TE (10 x concentration for 1 liter)
1 M Tris-Base 50 ml
0.5 M EDTA 10 ml
Dest. Water 500 ml
Towbin buffer
Trizma Base 3 g
Glycine 14.4 g
Dest. water 700 ml
Ethanol 200 ml
Dest. water up to 1 liter
Transfer buffer (for 1 liter)
Trizma Base 31.2 g
Glycin 28.8 g
Methanol 200 ml
pH 8.3-8.4

Materials and Methods
27
Tris (1 M)
Trizma Base 121.1 g
Dest. water up to 1 liter
Adjust the pH with HCl
Wash solution for colloidal Coomassie blue staining per gel
Methanol 99,8 % 25 ml
Dest. water 75 ml
4.4.5 Experimental kits
2D-Clean-Up-Kit Roche Molecular Diagnostics, Mannheim
ECL™ Advance Western-Blotting Detection Kit Amersham Biosciences, USA
Megaplex RT Primer Human Pool A V 2.1 Applied Biosystems, New Jersey, USA
Megaplex RT Primer Human Pool B V 2.0 Applied Biosystems, New Jersey, USA
SILAC Protein Quantitation Kit Thermo scientific, Pierce research products, USA
TaqMan® Micro RNA Assay Applied Biosystems, New Jersey, USA
TaqMan® MicroRNA Reverse Transcription Kit Applied Biosystems, Foster City, CA
TaqMan® Universal PCR Master Mix, AmpErase® UNG
Applied Biosystems, New Jersey, USA
Restore™ Plus Western-Blot Stripping Buffer Thermo Scientific, Rockford, USA
High Molecular Weight Protein Standard Biorad, München
Precision Plus Protein™ Dual Colour Standard Biorad, München
Materials and Methods
28
4.4.6 Human endothelial cell line (EA.hy926)
The EA.hy926 is a continuous cell line. This cell line was derived by PEG mediated fusion of a
thioguanine-resistant clone of A549 (human alveolar type II-like epithelial) cells with primary
HUVEC (human umbilical vein endothelial cells). These cells are maintained in HAT medium
(Edgell et al., 1983)
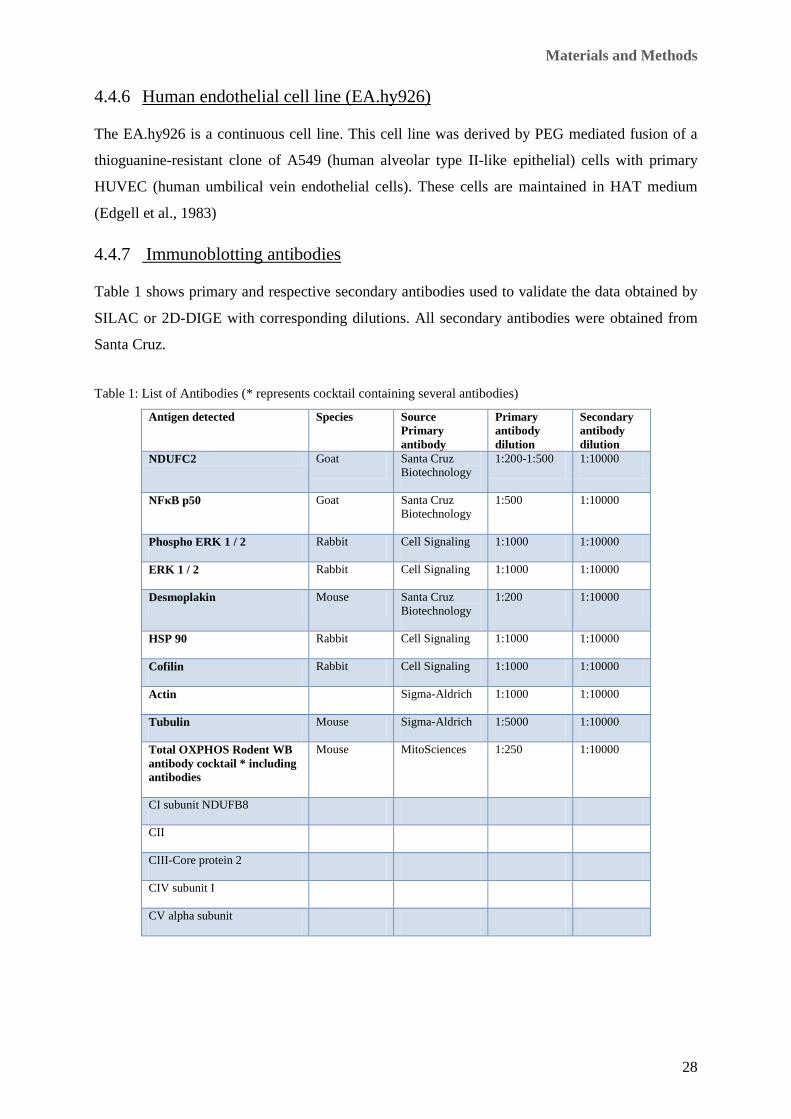
4.4.7 Immunoblotting antibodies
Table 1 shows primary and respective secondary antibodies used to validate the data obtained by
SILAC or 2D-DIGE with corresponding dilutions. All secondary antibodies were obtained from
Santa Cruz.
Table 1: List of Antibodies (* represents cocktail containing several antibodies)
Antigen detected Species Source Primary antibody
Primary antibody dilution
Secondary antibody dilution
NDUFC2 Goat Santa Cruz Biotechnology
1:200-1:500 1:10000
NFκB p50 Goat Santa Cruz Biotechnology
1:500 1:10000
Phospho ERK 1 / 2 Rabbit Cell Signaling 1:1000 1:10000
ERK 1 / 2 Rabbit Cell Signaling 1:1000 1:10000
Desmoplakin Mouse Santa Cruz Biotechnology
1:200 1:10000
HSP 90 Rabbit Cell Signaling 1:1000 1:10000
Cofilin Rabbit Cell Signaling 1:1000 1:10000
Actin Sigma-Aldrich 1:1000 1:10000
Tubulin Mouse Sigma-Aldrich 1:5000 1:10000
Total OXPHOS Rodent WB antibody cocktail * including antibodies
Mouse MitoSciences 1:250 1:10000
CI subunit NDUFB8
CII
CIII-Core protein 2
CIV subunit I
CV alpha subunit
Materials and Methods
29
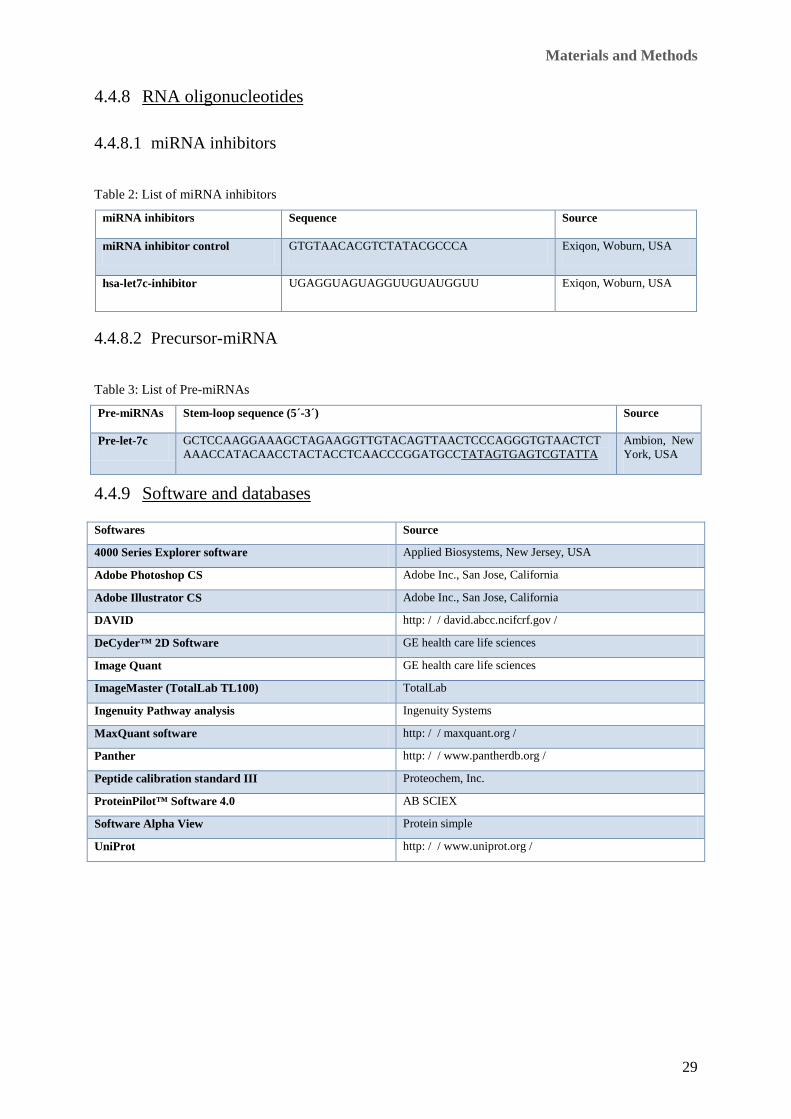
4.4.8 RNA oligonucleotides
4.4.8.1 miRNA inhibitors
Table 2: List of miRNA inhibitors
miRNA inhibitors Sequence Source
miRNA inhibitor control GTGTAACACGTCTATACGCCCA Exiqon, Woburn, USA
hsa-let7c-inhibitor UGAGGUAGUAGGUUGUAUGGUU Exiqon, Woburn, USA
4.4.8.2 Precursor-miRNA
Table 3: List of Pre-miRNAs
Pre-miRNAs Stem-loop sequence (5´-3´) Source
Pre-let-7c GCTCCAAGGAAAGCTAGAAGGTTGTACAGTTAACTCCCAGGGTGTAACTCTAAACCATACAACCTACTACCTCAACCCGGATGCCTATAGTGAGTCGTATTA
Ambion, New York, USA
4.4.9 Software and databases
Softwares Source
4000 Series Explorer software Applied Biosystems, New Jersey, USA
Adobe Photoshop CS Adobe Inc., San Jose, California
Adobe Illustrator CS Adobe Inc., San Jose, California
DAVID http: / / david.abcc.ncifcrf.gov /
DeCyder™ 2D Software GE health care life sciences
Image Quant GE health care life sciences
ImageMaster (TotalLab TL100) TotalLab
Ingenuity Pathway analysis Ingenuity Systems
MaxQuant software http: / / maxquant.org /
Panther http: / / www.pantherdb.org /
Peptide calibration standard III Proteochem, Inc.
ProteinPilot™ Software 4.0 AB SCIEX
Software Alpha View Protein simple
UniProt http: / / www.uniprot.org /

Materials and Methods
30
5. Methods
5.1. Cell culture
5.1.1 Maintenance culture of human endothelial cell line EA.hy926
The cell line EA.hy926 was initially established by fusing primary human umbilical vein
endothelial cells (HUVEC) with the human lung carcinoma cell line A549 (Edgell et al., 1983).
EA.hy926 cells were grown in D-MEM medium supplemented with 10 % dialysed foetal bovine
serum and HAT (1x) and maintained in culture flasks at 37° C with 11 % CO2 in air. Cells were
passaged every 5-7 days when confluence was achieved. Medium was aspirated from cell culture
plates and the monolayer was rinsed with 10 ml PBS (prewarmed at 37o C). The PBS was
aspirated and 2.5 ml Trypsin-EDTA solution was added and incubated at 37o C for 2-5 min.
Culture flasks were observed under the microscope to ensure that all the cells were detached from
the culture plates and no clumps were formed. The trypsinisation reaction was stopped by the
addition of 10 ml complete media (prewarmed at 37o C). Cells were counted with a Coulter
Counter and cell suspension was then gently centrifuged at 1400 g for 5 min at room temperature.
The supernatant was discarded and the pellet resuspended in either 5 ml or 10 ml of fresh media
and seeded into either T 25 or T 75 flasks (T 25 flasks were seeded with 1 x 10⁶ cells and T 75
flasks with 2 x 10⁶ cells), respectively.
5.1.2 In vitro labelling (SILAC)
For SILAC labelling the natural 12C 14N amino acids were replaced with 13C and 15N. EA.hy926
cells were grown in SILAC D-MEM (Fischer Scientific) medium supplemented with 12C6 L-
lysine-2HCl, 12C6 14N4 L-arginine-HCl (light medium-the natural isotope), or in SILAC medium
supplemented with 13C6 L-lysine-2HCl, 13C615N4 L-arginine (heavy medium containing the stable
isotope). The light and heavy lysine and arginine amino acids were added to an amino acid
deficient media to obtain a final concentration of 0.1 mg / ml. Both media (light and heavy
medium) were supplemented with 10 % dialysed foetal bovine serum, HAT (1x) and sterile
filtered. Cells were passaged for at least 6 doublings to achieve maximum labelling. For
experimental studies the cells were placed in culture flasks or in 10 cm Petri dishes (for radiation
experiments) as described in section (5.1.1). A schematic presentation of the labelling protocol is
shown in Figure 2.

Materials and Methods
31
Figure 2: Schematic presentation of in vitro labelling in cell culture
5.1.3 Cryopreservation
Cryopreservation is a process in which cells are preserved in a viable state by slowly cooling and
stored at -196oC in liquid nitrogen. In order to prevent damage during freezing and thawing
(retrieval to room temperature) a cryoprotectant (DMSO) was used. For cryopreservation of the
EA.hy926 cells, ~ 5 x 10⁶ cells in rapid growth phase were harvested by trypsinisation followed
by centrifugation at 1400 g for 5 min. The supernatant was discarded and the cell pellet was
resuspended in cryopreservation media (described in section 5.1.3) to achieve a concentration of 1
x 106 cells / ml. 1 ml aliquot of this cell suspension was transferred to each cryogenic storage vial.
Since the mammalian cells are very sensitive to rapid freezing the vials were placed in a Nalgene
Cryo 1°C Freezing Container (cooling rate = 1oC / min) and stored overnight at -80oC. The vials
were then transferred and stored at -196oC in liquid nitrogen.
5.1.4 Thawing cryopreserved cells
Cells that are cryopreserved are fragile and become highly sensitive to cryoprotectants (DMSO).
Therefore, the cells were thawn quickly and centrifuged gently to remove cryoprotectants prior to
plating. Cryopreserved vials containing EA.hy926 cells were taken out of the liquid nitrogen tank
and placed in to a warm water bath. Complete media was prewarmed at 37oC water bath for about
15 min. The contents of the cryopreservation vials were transferred to 15 ml centrifuge tubes, to
which 5 ml of complete media was added and centrifuged at ~1400 g for 5 min. The supernatant
was discarded and the pellet gently resuspended in 10 ml complete media and transferred to a
medium sized culture flask (T 75).
Materials and Methods
32
5.1.5 Irradiation of cells
Cells grown on Petri dishes as described in 5.1.2 were irradiated using a single γ-ray (Cs-137)
dose of either to 200 mGy or 2.5 Gy. Control cells were sham-irradiated by treating them exactly
in a similar way as irradiated cells, except that the radiation source was not turned on.
5.1.6 Harvesting cells for proteomic studies
Prior to harvesting the culture medium was discarded and the cells were rapidly rinsed once with
PBS (prewarmed at 37oC). Once the PBS was removed by aspiration, cells were harvested by
scraping with a cell scraper with 500 µl of lysis buffer (4.4.4).
5.2. Functional analysis
5.2.1 Cell growth kinetics
For the growth rate analysis (Krueger and Northrop, 1930), cells were harvested, irradiated in
suspension (200 mGy and 2.5 Gy) and immediately seeded in 16 culture flasks. The cells were
harvested and counted after 5 h, 24 h, 29 h, and 48 h and so on up to 250 h.
5.2.2 Clonogenic survival assay
Clonogenic assays were performed to determine the numbers of proliferatively competent cells
after exposing to radiation (Rosenblum et al., 1975, Dahm-Daphi et al., 1994, Dahm-Daphi and
Dikomey, 1994). EA.hy926, as some other mammalian cells, requires a layer of viable and
bioactive cells which are in growth and differentiation arrest (feeder cells) to permit colony
development. The clonogenically in activate feeders were prepared by irradiating the EA.hy926
cells at 50 Gy with γ-rays (Co-60). The feeder cells were plated in T 25 flasks and were placed in
the incubator overnight at 37o C. Cells used for growth rate determination were irradiated with
different doses ranging from 0 – 7 Gy with γ-rays (Cs-137) and plated on the flasks seeded with
feeder cells. Number of irradiated cells, feeder cells and their respective doses are shown in the
Table 4.

Materials and Methods
33
Table 4: Depicts the number of irradiated cells, feeder cells and their respective doses used in clonogenic assays.
Dose Feeder cells / flask Number of irradiated cells / flask
0.0 3.33 x 10⁴ 200
1.0 3.33 x 10⁴ 250
2.0 3.33 x 10⁴ 450
3.0 3.33 x 10⁴ 900
4.0 3.33 x 10⁴ 2000
6.0 3.33 x 10⁴ 5000
The cells were incubated at 37oC for 20 days. The medium was discarded and the dishes were
rinsed twice with PBS. The colonies formed were stained with diluted Giemsa stain (1:20 in
PBS). The cells were then fixed by incubation in 100 % Ethanol for 15 min followed by a 2nd
incubation for 10 min in Giemsa stain. The stained cells were washed with water and the flasks
allowed to dry overnight. The colonies with a minimum of atleast 50 cells were counted under the
binocular microscope.
5.3. Proteomic studies
5.3.1 SILAC
Cells were grown in media containing stable isotopes of lysine and arginine instead of their
natural form (5.1.2). The cells were maintained in culture for ~6-8 doublings and then checked for
complete incorporation of amino acids by mass spectrometry. Completely labelled cells were used
for experiments or for cryopreservation. Two independent biological replicates were used for
analysis. In the first biological replicate, the cells with natural isotopes served as controls and the
heavy labelled cells were irradiated and in the second biological replicate the heavy labelled cells
served as controls and the cells with natural isotopes were irradiated (label swapping). A detailed
description of the experimental procedure follows in 5.3.1.1 and 5.3.1.8. In general for protein
analysis cell lysates of both the experimental and control samples were mixed equally (1:1 wt /
wt) and separated on a 1D polyacrylamide gel. Bands on the polyacrylamide gel were cut out and
tryptic digested. Mass spectrometric identification of the digested bands was carried out.
Quantification of changes in the proteome changes caused by irradiation was based on the
difference in mass between every lysine / arginine peptide that contains either 12C6 L-lysine-2HCl, 12C6 14N4 L-arginine-HCl or 13C6 L-lysine-2HCl, 13C6 15N4 L-arginine-HCl incorporated. A
schematic representation of the SILAC technique is shown in Figure 3.

Materials and Methods
34
5.3.1.1 Lysis
To obtain the protein extract for SILAC analysis cells were prepared as described in section 5.1.6
and the lysate from Petri dishes was transferred to a 1 ml reaction tube and vortexed for 10-15 min
at room temperature. The lysate was then briefly sonicated to reduce DNA viscosity and
centrifuged at 13000 g and 4oC for 10 min. The pellet obtained was discarded and the supernatant
served as protein extract.
For immunoblotting protein extracts were prepared as described above except that the incubation
in lysis buffer (4.4.4) was carried out on ice for 20-30 min and without sonication.
5.3.1.2 Precipitation
Precipitation was carried out using acetone in order to concentrate and purify the protein samples.
Protein extract obtained by lysis was precipitated in acetone (volume 1:5) at -20°C overnight,
followed by centrifugation at 13000 g at 4oC for 5 min. The supernatant was discarded and the
protein pellet was allowed to air dry for 1 min before being resuspended in an appropriate buffer
(4.4.4).
5.3.1.3 Estimation of protein concentration
The concentration of protein in a sample was estimated by the Bradford assay (Bradford, 1976).
The assay is based on the binding of Coomassie Brilliant Blue G-250 dye to proteins in a
stochiometric manner. Under acidic conditions the dye is brownish red in colour and has an
absorbance maximum of 470 nm. On binding of the dye to the proteins, the brownish red colour
of the dye is converted to a deep blue colour with an absorbance maximum of 595 nm. The
absorbance of the sample was measured at 595 nm against a standard curve. A standard curve was
prepared using bovine serum albumin (BSA) at concentrations of 0.1 mg / ml, 0.5 mg / ml, 0.25
mg / ml and 1 mg / ml. Lysis buffer was added to the BSA standard dilutions so that the same
volume of lysis buffer was present in the standards and the samples. MilliQ water with the same
amount of lysis buffer was used as a reagent blank. To the standards and samples 250 µl of
Bradford reagent was added. The reactions were incubated for 5 min at room temperature before
the absorption was measured at 595 nm. The protein concentrations were calculated based on the
standard curve.

Materials and Methods
35
Figure 3: Schematic representation of SILAC workflow starting from labelling till mass spectrometric analysis

Materials and Methods
36
5.3.1.4 Resolving proteins on 1D-SDS-PAGE
For mass spectrometric analysis by SILAC and for immunoblotting of proteins, the protein lysates
were resolved on 1D PAGE gels. Sodium dodecyl sulfate-polyacrylamide gel electrophoresis
(SDS-PAGE) uses the detergent SDS to form a complex with proteins that allows the separation
of protein complexes according to their MW (Laemmli, 1970). In this study a discontinuous SDS-
PAGE system was used. The discontinuous system comprised of a long separating gel overlaid by
a short porous stacking gel. The stacking gel is more acidic when compared to that of the
separating gel and also has less cross-linking due to a lower acrylamide concentration.
Gels were cast in disposable plastic cassettes. The separating gels were cast first using the
volumes of solutions as shown in (4.4.4). Isopropanol was sprayed on top of separating gel and
incubated for 1 h for polymerisation. This was followed by casting of the stacking gel with
volumes of solutions as shown in (4.4.4). A comb of 1 mm thickness with 10 or 15 wells was
placed into the stacking gel. The gel casts were wrapped in wet tissue to prevent dehydration and
stored overnight at 4oC to achieve complete polymerisation. The combs were gently removed and
wells rinsed with electrophoresis buffer. The gels were placed in an electrophoresis chamber with
1x concentrated electrophoresis buffer (4.4.4). 1x Laemmli buffer (4.4.4) was added to the protein
extracts with predetermined concentrations and incubated at 95oC for 15 min to denature proteins.
The protein lysate was resolved on a combination of 4 %: 12 % (stacking gel: separating gel).
5.3.1.5 Electrophoresis
The protein extracts were loaded into wells and submerged in buffer for conductivity. A voltage
of 90 V was applied to the gels for the first ~15 min (until the blue dye moved out of the stacking
gel). Thereafter, the voltage was increase to 120 V. The run was stopped when the blue front
reached the bottom of the gel. For SILAC based mass spectrometric analysis each well with 50 µg
of proteins from both irradiated and sham-irradiated cell lysates was loaded.
5.3.1.6 Colloidal Coomassie staining of protein gels that were used for mass
spectrometric analysis
Colloidal Coomassie staining is a very sensitive staining method, compared to traditional
Coomassie staining. The colloidal Coomassie blue G-250 dye forms microprecipitates (Candiano
et al., 2004, Neuhoff et al., 1988) in acidic solutions containing ammonium sulphate, thus
reducing the amount of free dye, available for non specific binding. Colloidal Coomassie Blue G-
250 is five times more sensitive than that of the traditional Coomassie staining. After

Materials and Methods
37
electrophoresis, the 1D PAGE gels were incubated for 2 h in Colloidal Coomassie Blue G-250 on
a shaker. The gels were covered with wash solution (4.4.4) for 5 min on a shaker and transferred
to a clean container and stored in water until further analysis. A representative gel after staining is
as shown in Figure 4.
Figure 4: Representative gel picture showing colloidal coomassie staining
5.3.1.7 Processing of gel-resolved proteins and tryptic digestion
For the identification of proteins, each SDS-PAGE lane was cut into 10 slices. These were
subsequently digested as described previously by Sarioglu et al. (Sarioglu et al., 2008). Briefly,
the gel pieces were destained and rinsed with buffer containing 50 mM NH4HCO3 in 30 %
acetonitrile (ACN). The gel pieces were then equilibrated in 10 mM NH4HCO3 prior to
proteolytic digestion. Gel pieces were shrunk in 100 % v / v ACN and rehydrated in 10 mM
NH4HCO3. This treatment was repeated, followed by the addition of 0.1-0.2 µg of modified
trypsin (Sigma, proteomics grade) per gel piece (1 / 50 µg). Digestions were carried out overnight
at 37° C. The supernatant was collected and combined with the eluates of subsequent elution steps
in 80 % v / v ACN, 1 % v / v TFA. The combined eluates were dried in a SpeedVac centrifuge.
The dried samples were dissolved in 20 µl 5 % v / v ACN, 0.5 % v / v TFA for subsequent high-
performance liquid chromatography (HPLC) separation.
5.3.1.8 Mass spectrometry and data analysis
The trypsin fragmented peptides were separated by reversed phase HPLC (PepMap, 15 cm x 75
µm ID, 3 µm / 100Å pore size, LC Packings) operated on a nano-HPLC (Ultimate 3000, Dionex)
with a nonlinear gradient 170 min using 2 % ACN in 0.1 % formic acid in water and 0.1 % formic
acid in 98% acetonitrile as eluents with a flow rate of 250 nl / min. The gradient settings were, 2
% ACN: 0-140 min: 2-30 %, 140-150 min: 31-98 %, 151-160 min: continually 98 %. The nano-

Materials and Methods
38
LC was connected to a linear quadrupole ion trap (LTQ Orbitrap XL) mass spectrometer
(ThermoFischer, Bremen, Germany) equipped with a nano-ESI source. The mass spectrometer
was operated in the data-dependent mode to automatically switch between Orbitrap-MS and LTQ-
MS / MS acquisition. Survey full scan MS spectra (from m / z 300 to 1500) were acquired in the
Orbitrap with resolution R = 60000 at m / z 400 (after accumulation to a target of 1000000
charges in the Orbitrap). The method used allowed sequential isolation of maximally ten most
intense ions, depending on signal intensity, for fragmentation on the linear ion trap using
collision-induced dissociation at a target value of 100000 ions. High resolution Orbitrap-MS scans
and LTQ-MS / MS scans were performed in parallel. The normalised collision energy for
collision-induced dissociation was set to a value of 35 and the resulting fragments were detected
with normal resolution in the linear ion trap. The lock mass option was activated and the
background signal with a mass of 44512002 was used as lock mass. Every ion selected for
fragmentation was excluded for 30 seconds by dynamic exclusion. For SILAC experiments, all
acquired spectra were processed and analysed using the MaxQuant software 10 (version
1.0.13.13) in combination with Mascot 2.3.02 (Boldt et al., 2011) and the human specific IPI
database version 3.52 date: 29.7.2009 with 34115559 residues and 83947 sequences
(www.maxquant.org/). Cysteine carbamidomethylation was selected as the fixed modification;
methionine oxidation and protein acetylation were allowed as variable modifications. Both the
peptide false discovery rate and the protein false discovery rate were set to 1 %. Contaminants
such as keratins were rejected from the list of deregulated proteins. Only proteins identified and
quantified by at least 2 unique peptides with a variability of less than 50 % were taken into
account. Each SILAC experiment consisted of 2 biological replicates. In the first replicate cells
labelled with heavy isotope were treated with radiation and in the second biological replicate the
cells labelled with light isotope were treated (swapped labelling approach). Proteins were
considered to be significantly deregulated if the fold change in protein expression between sham-
and irradiated samples was ≥ ± 1.3 and p ≤ 0.01.
5.3.2 2D-DIGE
2D-DIGE is a gel based method used to analyse complex protein mixtures (O'Farrell, 1975, Klose,
1975). In this technique proteins are separated in two consecutive steps, first dimensional
isoelectric focussing (IEF) followed by a second dimensional SDS-PAGE. In IEF proteins are
separated based on the isoelectric points and in SDS-PAGE by molecular weights. A schematic
representation of the 2D-DIGE workflow is shown in Figure 5.
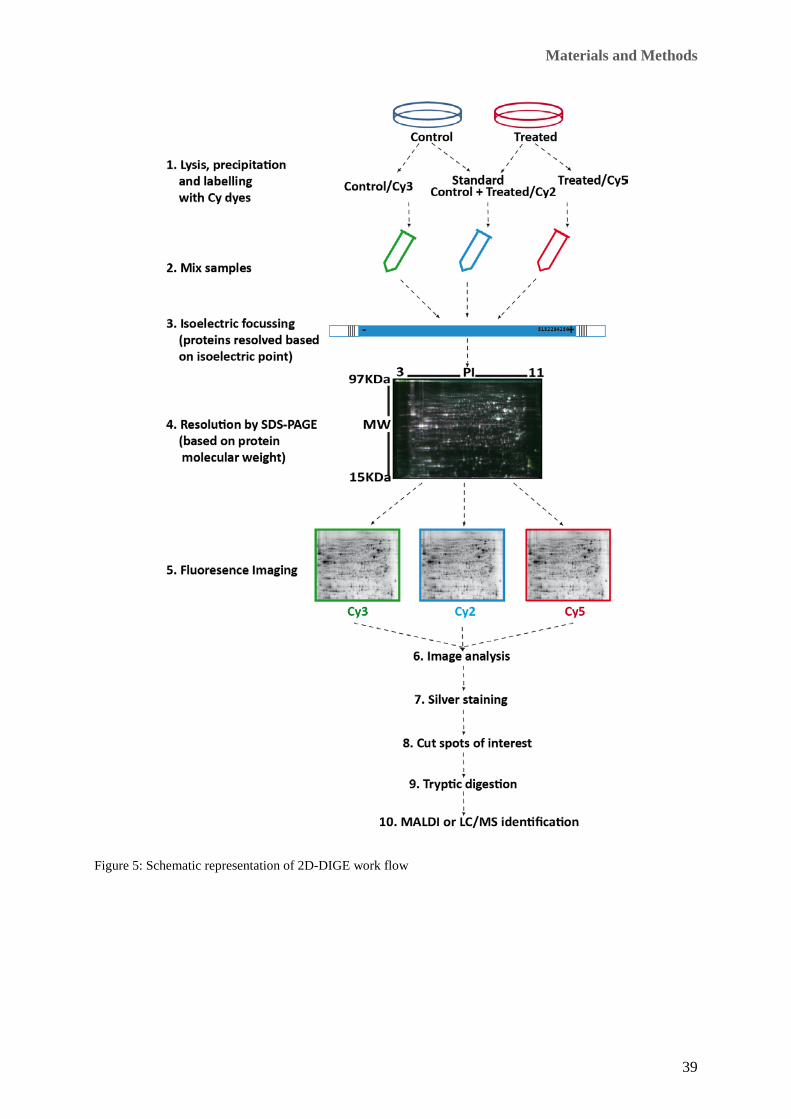
Materials and Methods
39
Figure 5: Schematic representation of 2D-DIGE work flow
Materials and Methods
40
5.3.2.1 Lysis for 2D-DIGE
For 2D-DIGE protein extract was prepared as described in section 5.3.1.1 except that the cells
were incubated in lysis buffer (4.4.4) on ice for 20-30 min with no sonication.
5.3.2.2 Precipitation for 2D-DIGE
Protein precipitation for 2D-DIGE protein extracts was carried out with the 2D Clean-up Kit. 250
µl of protein extract was transferred to a 1.5 ml reaction tube and 750 µl of precipitating agent 1
was added. Samples were mixed well by vortexing and incubated on ice for 15 min. To this 300
µl precipitating agent 2 was added, samples were vortexed again and incubated on ice for 15 min.
The tubes were then centrifuged at 13000 g for 5 min to form a tight pellet. The supernatant was
gently removed with a micro pipette and discarded. The pellet was centrifuged again and residual
liquid was carefully removed with a micro pipette. To the pellet 40 µl of wash reagent 1 was
added and the suspension was mixed and centrifuged at 13000 g for 5 min. Supernatant was
discarded and 25 µl of MilliQ water was added to the pellet. The tubes were vortexed for 10–20 s.
1 ml of wash reagent 2 (prechilled at -20° C) and 5 µl of wash 2 additive was added and the
solution was vortexed for 1 min. The tubes were incubated at -20o C for 2 h with vortexing at 10
min intervals. After incubation the tubes were centrifuged at 13000 g at 4o C for 5 min.
Supernatant was discarded and the protein pellet was allowed to air dry for 1 min and was
resuspended in a compatible buffer (4.4.4). The resuspended protein extract was used directly for
IEF in IPG strips. Remaining protein sample was stored at -80° C for later analysis. Protein
concentrations were determined in triplicate by Bradford assay using bovine serum albumin as
standard (see 5.3.1.3)
5.3.2.3 Labelling and rehydration
Labelling is done with three dyes Cy 3-control, Cy 5 – treated and Cy 2 – internal standard, a
mixture of control and treated (O'Farrell, 1975, Klose, 1975). The optimal pH range for DIGE
labelling is 8.5, hence pH levels of the samples were checked and adjusted to 8.5. The CyDye’s
which are in powder form were reconstituted in dimethylformamide (DMF) yielding a final
concentration of the 1 nmol / µl. The reconstituted dyes were stored at -20o C. Just before
labelling the CyDye’s were taken out of the -20o C freezer. For every 50 µg of protein extract 333
pmol of reconstituted Cy3 (control) or Cy5 (treated) labelling reagent was added. An internal
standard was prepared by mixing 25 µg of treated and control protein extracts and labelled using
333 pmol of Cy2 fluorescence dye. After addition of dyes, each sample was incubated in the dark
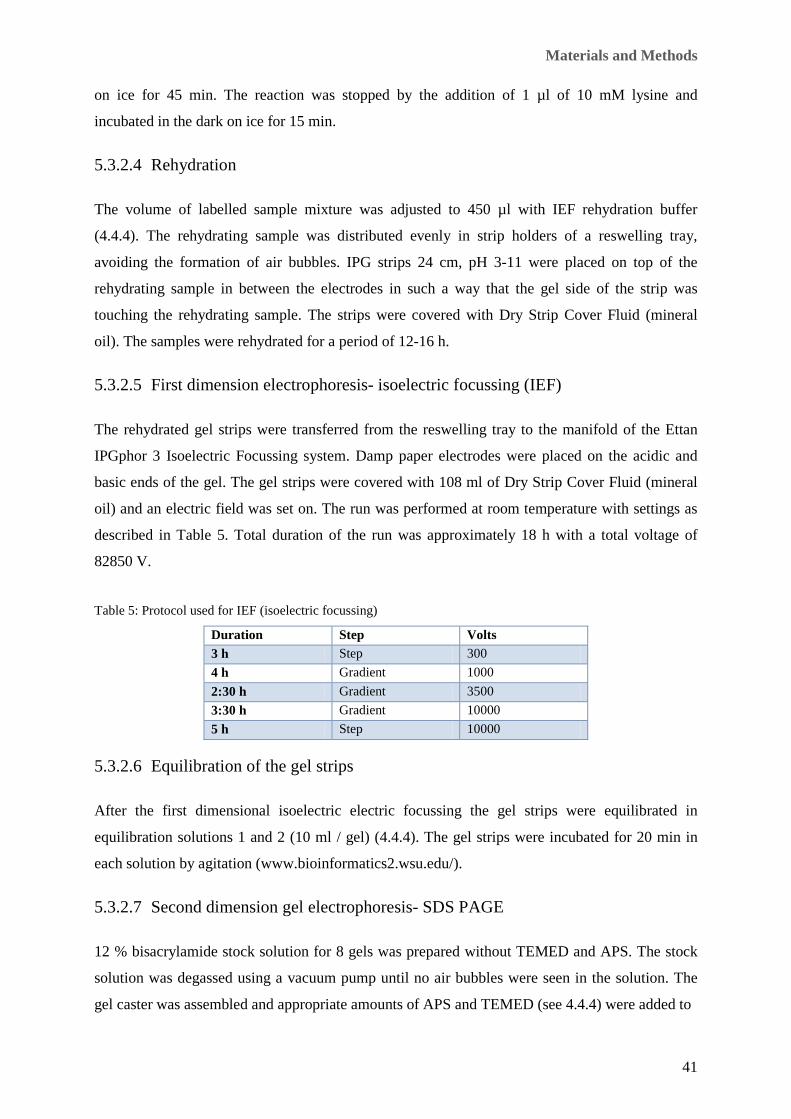
Materials and Methods
41
on ice for 45 min. The reaction was stopped by the addition of 1 µl of 10 mM lysine and
incubated in the dark on ice for 15 min.
5.3.2.4 Rehydration
The volume of labelled sample mixture was adjusted to 450 µl with IEF rehydration buffer
(4.4.4). The rehydrating sample was distributed evenly in strip holders of a reswelling tray,
avoiding the formation of air bubbles. IPG strips 24 cm, pH 3-11 were placed on top of the
rehydrating sample in between the electrodes in such a way that the gel side of the strip was
touching the rehydrating sample. The strips were covered with Dry Strip Cover Fluid (mineral
oil). The samples were rehydrated for a period of 12-16 h.
5.3.2.5 First dimension electrophoresis- isoelectric focussing (IEF)
The rehydrated gel strips were transferred from the reswelling tray to the manifold of the Ettan
IPGphor 3 Isoelectric Focussing system. Damp paper electrodes were placed on the acidic and
basic ends of the gel. The gel strips were covered with 108 ml of Dry Strip Cover Fluid (mineral
oil) and an electric field was set on. The run was performed at room temperature with settings as
described in Table 5. Total duration of the run was approximately 18 h with a total voltage of
82850 V.
Table 5: Protocol used for IEF (isoelectric focussing)
Duration Step Volts 3 h Step 300 4 h Gradient 1000 2:30 h Gradient 3500 3:30 h Gradient 10000 5 h Step 10000
5.3.2.6 Equilibration of the gel strips
After the first dimensional isoelectric electric focussing the gel strips were equilibrated in
equilibration solutions 1 and 2 (10 ml / gel) (4.4.4). The gel strips were incubated for 20 min in
each solution by agitation (www.bioinformatics2.wsu.edu/).
5.3.2.7 Second dimension gel electrophoresis- SDS PAGE
12 % bisacrylamide stock solution for 8 gels was prepared without TEMED and APS. The stock
solution was degassed using a vacuum pump until no air bubbles were seen in the solution. The
gel caster was assembled and appropriate amounts of APS and TEMED (see 4.4.4) were added to
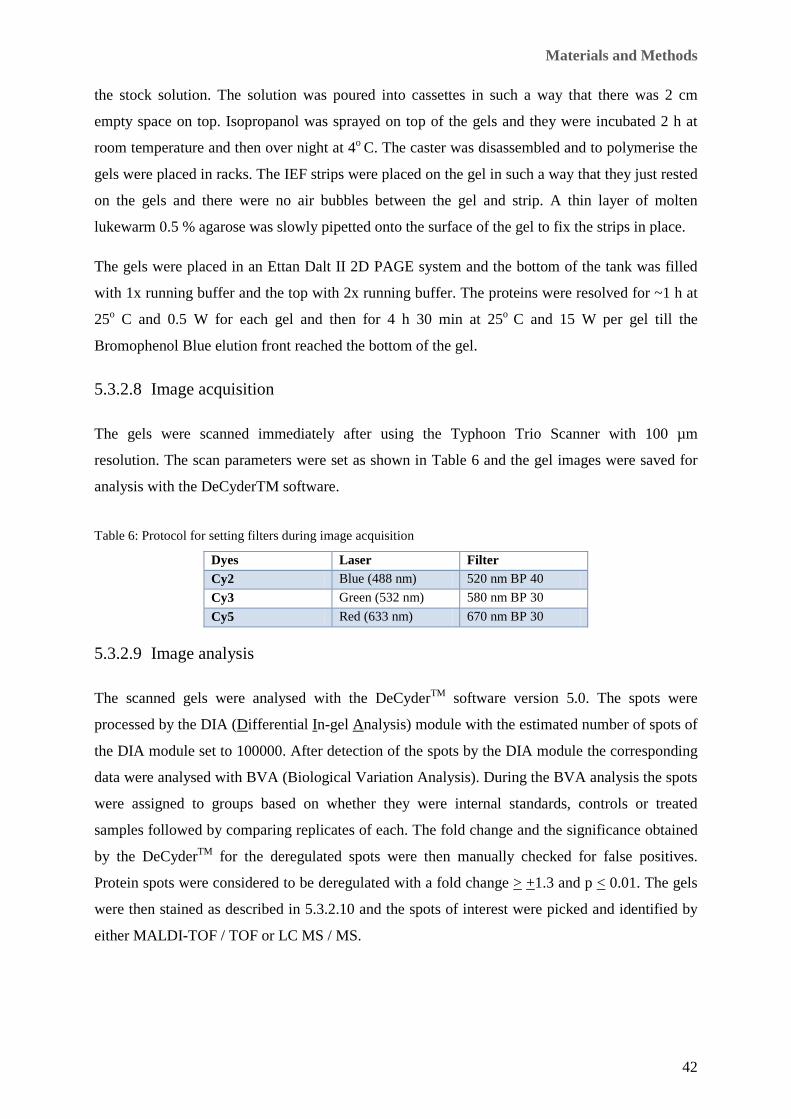
Materials and Methods
42
the stock solution. The solution was poured into cassettes in such a way that there was 2 cm
empty space on top. Isopropanol was sprayed on top of the gels and they were incubated 2 h at
room temperature and then over night at 4o C. The caster was disassembled and to polymerise the
gels were placed in racks. The IEF strips were placed on the gel in such a way that they just rested
on the gels and there were no air bubbles between the gel and strip. A thin layer of molten
lukewarm 0.5 % agarose was slowly pipetted onto the surface of the gel to fix the strips in place.
The gels were placed in an Ettan Dalt II 2D PAGE system and the bottom of the tank was filled
with 1x running buffer and the top with 2x running buffer. The proteins were resolved for ~1 h at
25o C and 0.5 W for each gel and then for 4 h 30 min at 25o C and 15 W per gel till the
Bromophenol Blue elution front reached the bottom of the gel.
5.3.2.8 Image acquisition
The gels were scanned immediately after using the Typhoon Trio Scanner with 100 µm
resolution. The scan parameters were set as shown in Table 6 and the gel images were saved for
analysis with the DeCyderTM software.
Table 6: Protocol for setting filters during image acquisition
Dyes Laser Filter Cy2 Blue (488 nm) 520 nm BP 40 Cy3 Green (532 nm) 580 nm BP 30 Cy5 Red (633 nm) 670 nm BP 30
5.3.2.9 Image analysis
The scanned gels were analysed with the DeCyderTM software version 5.0. The spots were
processed by the DIA (Differential In-gel Analysis) module with the estimated number of spots of
the DIA module set to 100000. After detection of the spots by the DIA module the corresponding
data were analysed with BVA (Biological Variation Analysis). During the BVA analysis the spots
were assigned to groups based on whether they were internal standards, controls or treated
samples followed by comparing replicates of each. The fold change and the significance obtained
by the DeCyderTM for the deregulated spots were then manually checked for false positives.
Protein spots were considered to be deregulated with a fold change > +1.3 and p < 0.01. The gels
were then stained as described in 5.3.2.10 and the spots of interest were picked and identified by
either MALDI-TOF / TOF or LC MS / MS.

Materials and Methods
43
5.3.2.10 Silver staining for 2D-DIGE
Silver staining is one of the most sensitive protein staining techniques. The principle of this
technique is that the silver ions bind to proteins and form complexes with proteins enabling the
visualisation of proteins (Chevallet et al., 2006). The staining was carried out as described in the
Table 7. After staining the spots of interest were manually and individually excised from the gels
with 1000 µl pipette tips and stored in 1 ml reaction tubes containing double distilled water until
further analysis.
Table 7: Represents the steps involved in silver staining
Composition for 2 gels Duration
Fix 50 % Methanol 12 % Acetic acid
100 ml Methanol 24 ml Acetic acid 76 ml double distilled water
1 h / Over night
Wash 50 % Ethanol 150 ml Ethanol 150 ml double distilled. water
3 x 20 min
Sensitize 0.2 g / l Sodium thiosulphate (Na2S2O3)
20 mg Na2S2O3 100 ml double distilled water
1 min
Wash 100 % double dist.Water 1 min
Silver stain
2 g / l Silver nitrate (AgNO3) 200 mg AgNO3 100 ml water
30 min -1 h
Wash 100 % double dist. Water 1 min
Develop 30 g / l Sodium carbonate (Na2CO3) 1.25 mg / l Sodium thiosulphate (Na2S2O3) 0.025 % Formaldehyde (37%)
30 g Na2CO3 999.625 ml double distilled water 125µl of 10% Na2S2O3 solution
Till visible (> 10 min)
Stop 50 % Methanol 12 % Acetic acid
100 ml Methanol 24 ml Acetic acid 76 ml double distilled water
10 min
Store 1 % Acetic acid 10 ml Acetic acid 1990 ml double distilled water
> 20 min
Materials and Methods
44
5.3.2.12 Mass spectrometric analysis
The spots were digested as described in section 5.3.1.6. After tryptic digestion the samples were
analysed by either LC MS / MS or MALDI-TOF / TOF.
MALDI-TOF / TOF
After digestion the mass spectra were acquired using a 4700 Proteomics Analyser (MALDI-TOF /
TOF) with a 355 nm Nb: YAG laser in positive reflector mode and a 20 kV acceleration voltage.
Mass range (m / z 900−4000) calibration was done externally using peptide calibration standard
III (Applied Biosystems). 3000 laser shots were aggregated for every MS and MS / MS spectrum.
Tandem mass spectrometry was performed by CID with air as the collision gas. Precursor masses
were selected in a data-dependent manner using the 8 most abundant ions excluding trypsin
autolytic and common keratin peptide masses. Two missed tryptic cleavages per peptide were
allowed and a mass accuracy of 65 ppm was used for the searches and within 0.3 Dalton for MS /
MS. Spectra acquisition and processing was done automatically with the 4000 Series Explorer
software (version 3.6, Applied Biosystems).
The acquired MS / MSMS spectra were analysed with Protein Pilot 3.0 software. Database
searches were performed with MASCOT (version: 2.2.06) using the human UniRef100 version
from 20090718 (selected for Homo sapiens) and Swiss-Prot databases (Swiss-Prot version from
20090212) (Sarioglu et al., 2008, Pluder et al., 2011, Azimzadeh et al., 2010).
LC-MS / MS
The spots which could not be identified with MALDI-TOF / TOF due to the low abundance were
analysed with LTQ Orbitrap as described in 5.3.1.8.
5.3.3 Immunoblotting
For immunoblot analysis 20 µg-30 µg protein extracts were loaded onto the wells. Different
concentrations of gels were used depending on the molecular weight of the proteins to be
resolved. Either 8 % or 12 % gels were used to detect the antibody depending on the molecular
weight. Electrophoresis was carried out as described in 5.3.1.5. The proteins resolved on the gel
were transferred onto a nitrocellulose membrane using the blotter XCell II™ Blot Systems
(Towbin et al., 1992).

Materials and Methods
45
5.3.3.1 Processing of SDS-PAGE gels before transfer
The gel cassette was carefully opened and the stacking gel was excised from separating gel. The
stacking gel, nitrocellulose membrane and 4 Whatman filter papers were equilibrated in 1 x
Towbin buffer (4.4.4) for a period of 20 min. Figure 6 depicts the arrangement of the blot
aperture. The transfer was carried out for 60-90 min at 15 V.
Figure 6: Schematic representation of immunoblot aperture (modified from Bio-Rad website).
5.3.3.2 Staining of the nitrocellulose membrane
After the proteins were transferred onto the nitrocellulose membrane, they were stained with
Ponceau-S for 5 min and the membranes were rinsed with double dist. water to remove all the
excess stain.
5.3.3.3 Blocking of the membrane
In order to prevent non-specific binding of the antibodies, the membranes were blocked either
with Roti block solution or 8 % skimmed milk for a minimum of 1 h under room temperature with
light agitation.

Materials and Methods
46
5.3.3.4 Antibody detection and tissue epitopes
Primary antibodies were diluted either in Roti block or 8 % skimmed milk as shown in. After
blocking, the membranes were incubated with primary antibodies over night at 4o C. During over
night incubation the membranes were continuously agitated. Following this incubation the
membranes were rinsed with TBST for 15 min. This step was repeated three times to remove all
the unbound primary antibody.
5.3.3.5 Secondary antibody
Secondary antibodies were diluted either in Roti block or 8 % skimmed milk as shown in. The
membranes were incubated with the secondary antibody for a minimum of 1 h and again rinsed
with TBST for 15 min; this was repeated twice.
5.3.3.6 Chemiluminescent detection
To visualise the probes that were labelled and bound to the protein of interest we used
chemiluminescence detection. For this, the membranes were incubated for 1 min in a mixture of
Luminogen A and Luminogen B (ratio 1:1) solutions and the chemiluminescence was detected
using the Alpha Innotech FluorChem HD2 and the Software Alpha View.
5.3.3.7 Analysis / quantification of the protein of interest
The quantification of the protein bands obtained was carried out using ImageQuant 5.2 software
or ImageMaster (TotalLab TL100). The ratio between the loading control and the protein of
interest was calculated and used as a normalisation factor. Finally the fold change of the protein of
interest was calculated by comparing the control vs. treated.
5.3.3.8 Stripping
In order to reuse a nitrocellulose membrane for detection of a different primary antibody the
membranes were stripped. Stripping was done by incubating the membrane in 10-15 ml of the
stripping buffer for 15-20 min at room temperature. The membranes were then rinsed several
times in TBST to remove the entire stripping buffer and blocked as described above.
Materials and Methods
47
5.4. microRNA analysis
5.4.1 Total RNA isolation
Extraction of total RNA from cells was done using the mirVana isolation kit. The cells were
trypsinised and pellets obtained as described in 5.1.1. The pellets were resuspended in lysis buffer,
and homogenous lysates were obtained. 1 / 10 volume of miRNA homogenate additive was adder
to the lysate and incubated on ice for 10 min. In order to extract the organic phase, acid-phenol
chloroform equal to the volume of lysate was added and vortexed for 30-60 seconds followed by
centrifugation at 10,000 x g for 10 min. The aqueous upper phase was transferred to a new tube
without disturbing the lower phase. Equal volumes of 100 % ethanol were added to the aqueous
phase to precipitate the RNA that was transferred to a filter cartridge and centrifuged at 10000 x g
for ~20 seconds. The flow-through was discarded and the filter was washed with 700 µl miRNA
wash solution 1 and centrifuged ~20 seconds. The flow-through was discarded and the filter was
washed twice with 500 µl wash solution 2 / 3. Each time the filter cartridges were centrifuged ~20
seconds and flow through discarded. The filter cartridge was transferred to a fresh collection tube
and the RNA was eluted with 40-50 µl of nuclease free water (preheated at 95oC).
5.4.2 Estimation of purity and concentration of RNA
Concentration of RNA in a sample corresponds to the absorbance at 260 nm
spectrophotometrically (A260) and that of proteins to 280 nm (A280). Purity of RNA was
measured by calculating the ratio between A260:A280. A pure RNA extract has a ratio between
1.8 and 2 whereas a lower ratio indicates protein contaminants.
5.4.3 microRNA profiling
i) Reverse transcription (RT)
Expression analysis of miRNA was carried out using TaqMan Low Density Array® (TLDA)
Human MicroRNA Panel A v2.1 and TaqMan® Array Human MicroRNA B Card v2.0 containing
378 and 384 miRNA assays, respectively. Four endogenous controls, namely snoRNA, U6,
RNU44, and RNU48 were also included in the assays for normalisation purposes. The cDNA
required for the PCR amplification was prepared using 300 ng of the total RNA with specific
Multiplex reverse transcriptase stem-loop primer as described in the manufacturer’s protocol. The
multiplex reverse transcription was carried out using TaqMan® microRNA reverse transcription
kit and RT-primers from the primer pool Megaplex RT Primer Human Pool A V 2.1 and Pool B V
2.0. The RT- reaction mixture was prepared as described in Table 8 and the reaction settings as
described in Table 9. The cDNA obtained was used for RT PCR or stored under -20o C.

Materials and Methods
48
Table 8: Composition of the reaction mixture for a RT-PCR
Composition volume 100mM dNTPs (with dTTP) 0.2 µl
MultiScribe™ Reverse Transcriptase, 50 U / µl 1.5 µl 10 X Reverse Transcription Buffer 0.8 µl RNase Inhibitor, 20 U / µl 0.1 µl Nuclease-free water 0.2 µl Primer 0.8 µl
RNA (200 ng / µl) 3.0 µl Total volume 7.5 µl
Table 9: Experimental setup for the RT-PCR reaction
Cycles Time in min Temperature in oC 40 2 16 40 1 42 40 1 50 1 5 85
ii) Quantitative real time PCR
Quantitative real time PCR is a method in which small quantities of RNA samples are measured.
This was done by mixing 6 µl cDNA and 444 µl RNase free water with 450 µl TaqMan 2 x
Universal PCR Master Mix. The solution was loaded onto Multi Fluidic Cards. The measurement
of the gene expression was carried out with ABI Prism 7900HT Systems.
The miRNA-expression was quantified using the ∆∆Ct-method, also known as Ct method,
(threshold cycles). Ct represents the number of cycles after which the fluorescence developed in
the reaction pass over the threshold at a statistically significant point above the baseline. The
∆∆Ct-method was used to quantify the miRNA-expression values as it helped to perform data
analysis by considering individual amplification efficiencies. Normalisation was done using RNA
RNU 6b and RNU 44 endogenous control. The following steps were used to calculate the
miRNA-expression value:
ΔCt (control) = Ct (miRNA) – Ct (snoRNA)
ΔCt (irradiated) = Ct (miRNA) – Ct (snoRNA)
∆∆Ct = ΔCt (irradiated)-ΔCt (control)
Expression value = 2-(ΔCt (irradiated)-(ΔC
t (Control) = 2-(∆∆Ct)

Materials and Methods
49
5.4.4 Transfection of cells with Pre-miRTM and Anti-miRTM
1.5 x 10⁵ cells were seeded into 6 cm Petri dishes 24 h prior to transfection. This was followed by
adding 2 ml of fresh media into the Petri dishes. 10 µM stock solution of miR control, Pre-miRTM
and Anti-miRTM were diluted in 500 µl of DMEM media without FCS. 5 µl of the transfection
reagent LipofectamineTM RNAiMax was diluted in 500 µl of DMEM media without FCS. The
transfection reagent was combined with the control, Pre – miRTM or Anti – miRTM and the
solutions were incubated at room temperature for 20 min. To each Petri dish 2 µl miR control or
Pre-miRTM or Anti- miRTM was added.
The cells were incubated at 37o C for 4 h followed by removal of medium from Petri dishes and
addition of fresh complete medium. The Petri dishes were incubated at 37o C and cells harvested
after 24 h for further experiments.
5.5. Bioinformatic analysis
5.5.1 Identification of protein interactions and biological pathways
Ingenuity Pathway Analysis (IPA) is a knowledge database generated from peer-reviewed
scientific publications that enables discovery of highly represented functions and pathways (p <
0.001) from large, quantitative data sets. To obtain information of relationships, biological
mechanisms, functions and pathways all differentially regulated proteins (focus molecules) with
their corresponding Swiss-Prot accession numbers and fold change were imported into the IPA
(www.Ingenuity.com, Mayburd et al., 2006).
Network analysis
A network generated by ingenuity software represents the interactions of the focus molecules (the
deregulated molecules are called focus molecules). The networks generated after analysis was
considered significant based on the score generated for each network. The significance of a
biological function or network according to IPA is determined by calculating the p-value using
Fischer’s exact test (p < 0.05). The p-value thus calculated is used to generate a significance score
for each network. The score is displayed as the negative log of the p-value and implies that the
assignment of a set of molecules to a particular network is by random chance. A score of 2
represents that there exists a 1 in 100 chance that a set of focus molecules are in a network due to
random chance. A score of > 2 indicates a confidence of 99% and that the network is not being
generated by a random chance alone (Prisyazhiuk et al., 1991). In other words the score is a
numerical value to approximate the degree of relevance and size of a network to the molecules in
the given dataset. In this work a network was considered to be significant if the score was > 10

Materials and Methods
50
this indicates that the focus molecules were assigned to a particular network randomly by
approximately a chance of 10-10. In the network analysis the molecules which were not identified
by proteomic studies but were found in the network analysis by IPA to be either potential targets
or molecules related to the identified molecules are called nodal molecules.
Canonical pathway generation
Generation of a detailed signalling cascade of the focus molecules (molecules found to be
deregulated after irradiation in this study) in a network is enabled by the canonical pathways of
the Ingenuity Pathway system (Prisyazhiuk et al., 1991). The canonical pathway generated was
considered significant if a particular pathway (signalling cascade) had a p-value < 0.05 (Fischer’s
exact test).
5.5.2 Functional classification:
To classify the proteins based on their biological functions, the set of differentially expressed
proteins were imported in to the PANTHER (Protein ANalysis THrough Evolutionary
Relationships) classification system (www.pantherdb.org/). PANTHER was unable to classify
some proteins due to database limitations. In such cases UniProt knowledge database
(www.uniprot.org) was used to assign functional classification. The deregulated proteins and the
functions to which they were assigned to, were imported into the Microsoft excel and a pie chart
was generated. Each part of the pie chart represents the number of proteins found to be
deregulated in a particular biological function.
5.5.3 miRNA target search analysis
To find the potential targets of the miRNAs found to be deregulated after irradiation a target
search was performed. Potential targets of miRNAs were found by searching either the target scan
(www.targetscan.org) and microRNA.org (www.microrna.org) databanks. One of the criterions to
choose a plausible target was that the mature mRNA transcript of this target was highly conserved
in either the 5´ untranslated region (UTR) or 3´ UTR regions

Results
51
6. Results
6.1. Effects of irradiation on the growth of the cell line EA.hy926
6.1.1 Colony forming ability after exposure to ionising radiation
In general endothelial cells are very sensitive to high doses of ionising radiation. In order to
establish the radiosensitivity of the endothelial cell line EA.hy926 the colony forming assay was
performed by exposing the cells to 0, 1, 2, 3, 4, and 6 Gy of ionising radiation (Cs137 γ-rays). The
colonies were analysed after 16 days. A dose versus survival rate curve was plotted and the values
of D10, and was calculated to be 5.54 Gy. D10 represents the dose at which 10 % of the cells
survive. The values were calculated using the curve equation SF = e (-0.078*D -0.061*D2) (Figure
7). A clear change in colony forming was observed even at the lowest dose of 1 Gy. The survival
rate of the EA.hy926 cells started dipping at a dose of less than 1 Gy indicating the high
sensitivity of the cells to radiation.
Figure 7: Survival curve of EA.hy926 cells after 0, 1, 2, 3, 4 and 6 Gy of γ-irradiation. The colonies were counted after 16 days.
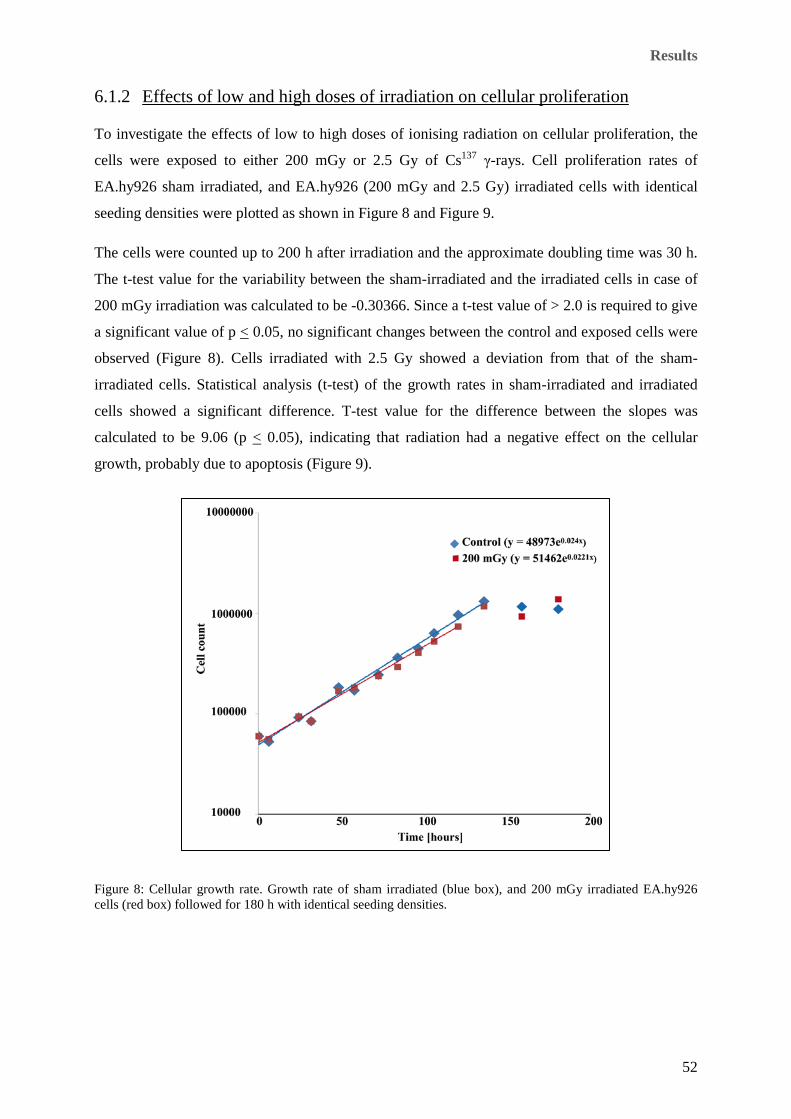
Results
52
6.1.2 Effects of low and high doses of irradiation on cellular proliferation
To investigate the effects of low to high doses of ionising radiation on cellular proliferation, the
cells were exposed to either 200 mGy or 2.5 Gy of Cs137 γ-rays. Cell proliferation rates of
EA.hy926 sham irradiated, and EA.hy926 (200 mGy and 2.5 Gy) irradiated cells with identical
seeding densities were plotted as shown in Figure 8 and Figure 9.
The cells were counted up to 200 h after irradiation and the approximate doubling time was 30 h.
The t-test value for the variability between the sham-irradiated and the irradiated cells in case of
200 mGy irradiation was calculated to be -0.30366. Since a t-test value of > 2.0 is required to give
a significant value of p < 0.05, no significant changes between the control and exposed cells were
observed (Figure 8). Cells irradiated with 2.5 Gy showed a deviation from that of the sham-
irradiated cells. Statistical analysis (t-test) of the growth rates in sham-irradiated and irradiated
cells showed a significant difference. T-test value for the difference between the slopes was
calculated to be 9.06 (p < 0.05), indicating that radiation had a negative effect on the cellular
growth, probably due to apoptosis (Figure 9).
Figure 8: Cellular growth rate. Growth rate of sham irradiated (blue box), and 200 mGy irradiated EA.hy926 cells (red box) followed for 180 h with identical seeding densities.

Results
53
Figure 9: Cellular growth rate. Growth rate of sham irradiated (blue box), and 2.5 Gy irradiated EA.hy926 cells (red box) followed for 240 h using identical seeding densities.
6.2. Proteomic alterations in EA.hy926 observed after exposure to 2.5 Gy
ionising radiation
To evaluate the proteomic alterations in the endothelial cells after exposure to Cs137 γ-irradiation
two proteomic strategies, namely SILAC and 2D-DIGE were used. The cells were exposed to a
clinically relevant dose of 2.5 Gy ionising radiation followed by harvesting at 4 and 24 hours after
irradiation. The harvested cells were lysed and processed further as described in section 5.3.
At 2.5 Gy the proteomic alterations were observed using both SILAC and 2D-DIGE strategies.
Two biological SILAC replicates were analysed. In the first replicate the sham-irradiated cells
were labelled with light isotopes and the irradiated cells with heavy isotopes. In the second
replicate the labelling was done in the opposite way (sham-irradiated carried the heavy label and
irradiated the light label) (“label swap”) were analysed at two time points (4 h and 24 h) post
irradiation. For 2D-DIGE the analysis of four replicates (3 biological replicates and one technical
replicate of the 3rd biological replicate) at both time points (4 h and 24 h) was carried out. For both
techniques the analysis was performed as described in the materials and methods section 5.3.
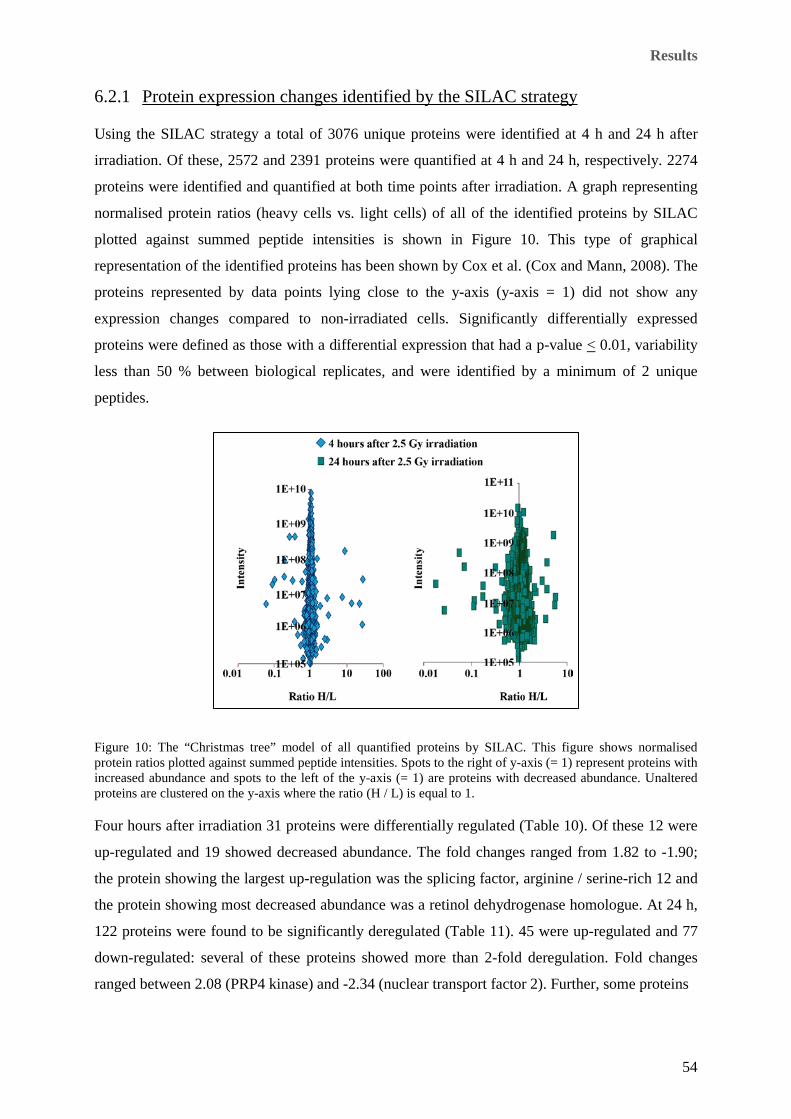
Results
54
6.2.1 Protein expression changes identified by the SILAC strategy
Using the SILAC strategy a total of 3076 unique proteins were identified at 4 h and 24 h after
irradiation. Of these, 2572 and 2391 proteins were quantified at 4 h and 24 h, respectively. 2274
proteins were identified and quantified at both time points after irradiation. A graph representing
normalised protein ratios (heavy cells vs. light cells) of all of the identified proteins by SILAC
plotted against summed peptide intensities is shown in Figure 10. This type of graphical
representation of the identified proteins has been shown by Cox et al. (Cox and Mann, 2008). The
proteins represented by data points lying close to the y-axis (y-axis = 1) did not show any
expression changes compared to non-irradiated cells. Significantly differentially expressed
proteins were defined as those with a differential expression that had a p-value < 0.01, variability
less than 50 % between biological replicates, and were identified by a minimum of 2 unique
peptides.
Figure 10: The “Christmas tree” model of all quantified proteins by SILAC. This figure shows normalised protein ratios plotted against summed peptide intensities. Spots to the right of y-axis (= 1) represent proteins with increased abundance and spots to the left of the y-axis (= 1) are proteins with decreased abundance. Unaltered proteins are clustered on the y-axis where the ratio (H / L) is equal to 1.
Four hours after irradiation 31 proteins were differentially regulated (Table 10). Of these 12 were
up-regulated and 19 showed decreased abundance. The fold changes ranged from 1.82 to -1.90;
the protein showing the largest up-regulation was the splicing factor, arginine / serine-rich 12 and
the protein showing most decreased abundance was a retinol dehydrogenase homologue. At 24 h,
122 proteins were found to be significantly deregulated (Table 11). 45 were up-regulated and 77
down-regulated: several of these proteins showed more than 2-fold deregulation. Fold changes
ranged between 2.08 (PRP4 kinase) and -2.34 (nuclear transport factor 2). Further, some proteins

Results
55
showed a non-significant deregulation at the 4 h time point that became significant at 24 h or vice
versa, examples being MHC class I antigen (4 h: 1.32**; 24 h: 1.20), death-associated
transcription factor 1 (4 h: 1.38**; 24 h: 1.436), toll interacting protein (4 h: 2.84; 24 h: 1.704**)
and phosphohexokinase (4 h: 1.22; 24 h: 2.04**)(** = p ≤ 0.01). This suggests that the radiation-
induced response of some proteins was rapid and transient, whereas that of others was slow and
persistent.
Table 10: List of deregulated proteins 4 h after 2.5 Gy irradiation identified and quantified by SILAC with significance.
Proteins UniProt Fold change
Functions
Retinol dehydrogenase homologue RDHL Q9Y2P9 -1.9** Oxidation reduction Alpha actinin 4 short isoform D6PXK4 -1.7** Apoptosis, Hypoxia
Protein AATF Apoptosis-antagonizing transcription f t
Q9NY61 -1.63** Cell cycle, Progression Glucosamine-fructose-6-phosphate aminotransferase 2
O94808 -1.61** Metabolism RNA-binding protein 7 Q9Y580 -1.52** Cell cycle, progression Ubiquinone biosynthesis protein COQ4 homologue Q9Y3A0 -1.52** Metabolism Alpha-N-acetylgalactosaminidase B P17050 -1.47** Metabolism Plectin-1 Q15149-3 -1.46** Apoptosis Lin-7 homologue C Q9NUP9 -1.42** Exocytosis Phosphatidate cytidylyltransferase 2 O95674-1 -1.42** Metabolism AMP deaminase 2 Q01433-1 -1.41** Metabolism Glutathione peroxidase 1 P07203 -1.4** Apoptosis Histone RNA hairpin-binding protein Q14493 -1.4** Replication Lymphocyte antigen 6K Q17RY6 -1.4** Cell growth 3-ketoacyl-CoA thiolase Acetyl-CoA acyltransferase P09110 -1.39** Metabolism Tripeptidyl-peptidase 1 O14773-1 -1.39** Apoptosis, Metabolism ATP-dependent RNA helicase DDX54 Q8TDD1 -1.34** Transcription Ras-related protein Rab-23 Q9ULC3 -1.33** Signalling All-trans-retinol 13,14-reductase Q6NUM9 -1.32** Metabolism Death-inducer obliterator 1 Q9BTC0-4 1.32** Apoptosis, Transcription Zyxin Q15942 1.33 Signal transduction 5'(3')-deoxyribonucleotidase, Cytosolic type Q8TCD5-1 1.34** Metabolism Ubiquinone biosynthesis methyl-transferase COQ5 Q5HYK3-1 1.34** Metabolism Hematopoietic lineage cell-specific protein P14317 1.35** Signalling,Cell
proliferation Ribonucleoside-diphosphate reductase subunit M2 P31350 1.37** DNA replication Golgi reassembly-stacking protein 2 Q9H8Y8-1 1.38** Golgi organisation MHC class I antigen Leucocyte antigen A A5I8L1 1.38** Immune response Hydroxymethylglutaryl-CoA synthase Q01581 1.44** Metabolism Epidermal growth factor receptor substrate 15 P42566 1.49** Cell proliferation Coiled-coil-domain-containing protein 137 Q6PK04 1.51** Hypothetical protein Retinol dehydrogenase homologue RDHL Q8WXA9-2 1.82** Transcription
* = p ≤ 0.05, ** = p ≤ 0.01 (p = significance calculated as described by Cox et al. (Cox and Mann, 2008)).
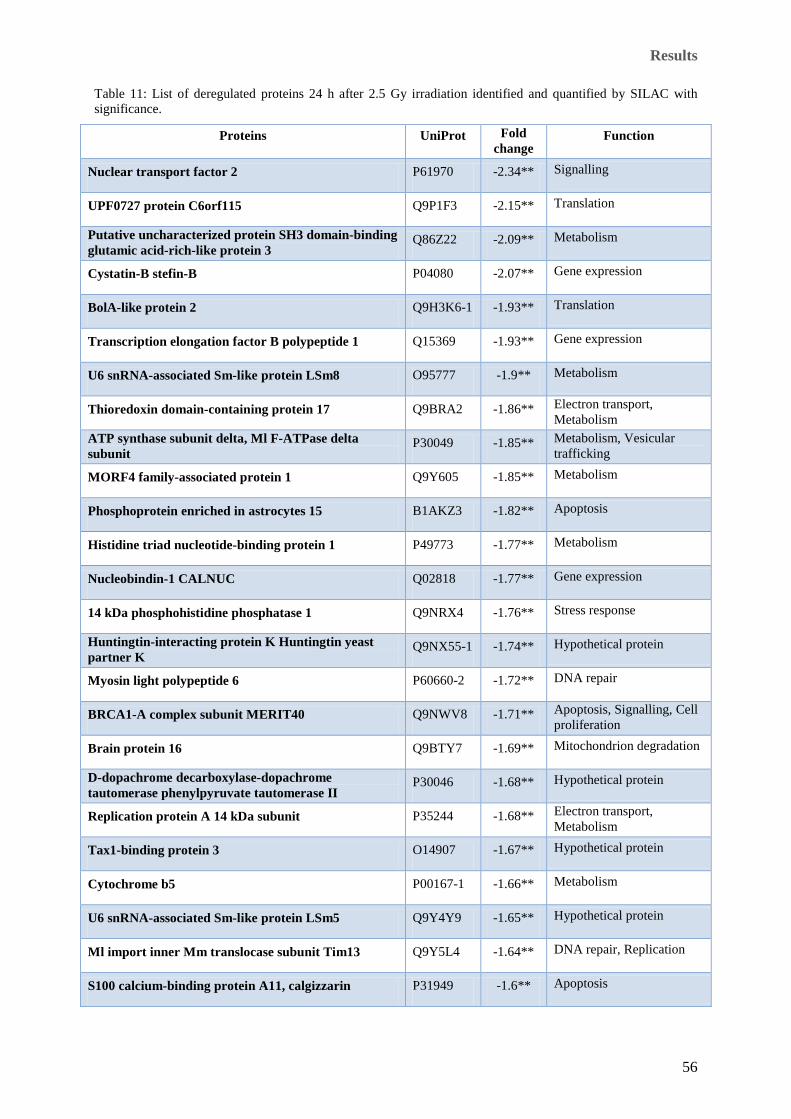
Results
56
Table 11: List of deregulated proteins 24 h after 2.5 Gy irradiation identified and quantified by SILAC with significance.
Proteins UniProt Fold change
Function
Nuclear transport factor 2 P61970 -2.34** Signalling
UPF0727 protein C6orf115 Q9P1F3 -2.15** Translation
Putative uncharacterized protein SH3 domain-binding glutamic acid-rich-like protein 3
Q86Z22 -2.09** Metabolism
Cystatin-B stefin-B P04080 -2.07** Gene expression
BolA-like protein 2 Q9H3K6-1 -1.93** Translation
Transcription elongation factor B polypeptide 1 Q15369 -1.93** Gene expression
U6 snRNA-associated Sm-like protein LSm8 O95777 -1.9** Metabolism
Thioredoxin domain-containing protein 17 Q9BRA2 -1.86** Electron transport, Metabolism
ATP synthase subunit delta, Ml F-ATPase delta subunit
P30049 -1.85** Metabolism, Vesicular trafficking
MORF4 family-associated protein 1 Q9Y605 -1.85** Metabolism
Phosphoprotein enriched in astrocytes 15 B1AKZ3 -1.82** Apoptosis
Histidine triad nucleotide-binding protein 1 P49773 -1.77** Metabolism
Nucleobindin-1 CALNUC Q02818 -1.77** Gene expression
14 kDa phosphohistidine phosphatase 1 Q9NRX4 -1.76** Stress response
Huntingtin-interacting protein K Huntingtin yeast partner K
Q9NX55-1 -1.74** Hypothetical protein
Myosin light polypeptide 6 P60660-2 -1.72** DNA repair
BRCA1-A complex subunit MERIT40 Q9NWV8 -1.71** Apoptosis, Signalling, Cell proliferation
Brain protein 16 Q9BTY7 -1.69** Mitochondrion degradation
D-dopachrome decarboxylase-dopachrome tautomerase phenylpyruvate tautomerase II
P30046 -1.68** Hypothetical protein
Replication protein A 14 kDa subunit P35244 -1.68** Electron transport, Metabolism
Tax1-binding protein 3 O14907 -1.67** Hypothetical protein
Cytochrome b5 P00167-1 -1.66** Metabolism
U6 snRNA-associated Sm-like protein LSm5 Q9Y4Y9 -1.65** Hypothetical protein
Ml import inner Mm translocase subunit Tim13 Q9Y5L4 -1.64** DNA repair, Replication
S100 calcium-binding protein A11, calgizzarin P31949 -1.6** Apoptosis

Results
57
Proteins UniProt Fold change
Function
S100 calcium-binding protein A6, calcyclin P06703 -1.6** Electron transport
TRM112-like protein Q9UI30 -1.6** Electron transport
Acyl-CoA-binding protein diazepam-binding inhibitor P07108-2 -1.59** Metabolism
Ubiquilin-1; Protein linking IAP with cytoskeleton 1 Q9UMX0-1
-1.58** Metabolism
Prefoldin subunit 5 C-myc-binding protein Mm-1 Q99471 -1.57** DNA repair, Replication Apoptosis Transcription
60S acidic ribosomal protein P2 P05387 -1.56** DNA repair Transcription
SH3 domain-binding glutamic acid-rich-like protein O75368 -1.56** Post- translational modification, Metabolism
Transgelin smooth muscle protein 22-alpha Q01995 -1.55** Apoptosis, Transcription regulation
7-dehydrocholesterol reductase Sterol Delta(7) SR-2 Q9UBM7 -1.54** Metabolism, Gene expression
cDNA FLJ75174, highly similar to Homo sapiens calmodulin 1, mRNA Calmodulin
A8K1M2 -1.54** Stress response, Translation
Barrier-to-autointegration factor O75531 -1.53** Gene expression
40S ribosomal protein S21ribosomal protein S21 P63220 -1.52** Apoptosis, Translation, Cell proliferation
Superoxide dismutase [Cu-Zn] P00441 -1.52** Post-translational modification
Translationally-controlled tumor protein P13693 -1.52** Gene expression
Programmed cell death protein 5 O14737 -1.51** Stress response, Signalling, Apoptosis
Elongation factor 1-beta P24534 -1.5** Hypothetical protein
Histidine triad nucleotide-binding protein 2 Q9BX68 -1.5** Metabolism
Nuclear pore complex protein Nup107 P57740 -1.5** Gene expression
Putative uncharacterized protein UBE2D3 † A6NJB1 -1.5** Metabolism Apoptosis
Eukaryotic translation initiation factor 1 P41567 -1.49** Apoptosis, Transcription regulation
Prefoldin subunit 1 O60925 -1.49** Signalling
Putative uncharacterized protein COMMD8 COMM domain-containing protein 8
A8MQB6 -1.49** Apoptosis, Metabolism
Eukaryotic translation initiation factor 3 subunit F O00303 -1.48** Metabolism
Nuclear pore glycoprotein p62 P37198 -1.48** DNA Repair Replication
Small glutamine-rich tetratricopeptide repeat-containing protein alpha
O43765 -1.48** Transcription regulation, DNA repair, replication
Peptidyl-prolyl cis-trans isomerase-like 3; cyclophilin J
Q9H2H8-1 -1.47** Hypothetical protein

Results
58
Proteins UniProt Fold change
Function
V-type proton ATPase subunit F Q16864 -1.47** Apoptosis
Tyrosine-protein kinase receptor UFO P30530-1 -1.46** Apoptosis
Deoxyuridine 5'-triphosphate nucleotidohydrolase, Ml dUTP pyrophosphatase
P33316-1 -1.45** Protein Translocation
RING finger protein 114; Zinc finger protein 313 Q9Y508 -1.45** Protein Translocation
Transgelin-2 SM22-alpha homologue P37802 -1.45** Protein Translocation
Glutaredoxin-related protein 5 Q86SX6 -1.44** Cell cycle
Ml import inner Mm translocase subunit Tim9 Q9Y5J7 -1.44** Regulatory
Acyl carrier protein, Ml O14561 -1.43** Transcription
Ml import receptor subunit TOM22 homologue Q9NS69 -1.43** Electron transport
Stathmin P16949 -1.43** Electron transport
Ubiquitin-conjugating enzyme E2 A P49459 -1.43** DNA Replication, Cell cycle, Proliferation
Dynein light chain 1 P63167 -1.41** Cell cycle regulation, Metabolism
Acyl-protein thioesterase 2; lysophospholipase II O95372 -1.4** Apoptosis, Signalling, Metabolism
Signal recognition particle 9 kDa protein P49458 -1.4** Protein Translocation
Nuclear autoantigenic sperm protein isoform 2 variant Q53H03 -1.39** Gene expression
Haloacid dehalogenase-like hydrolase domain-containing protein 1A Protein GS1
Q08623 -1.38** Metabolism
cDNA FLJ33995 fis, clone DFNES2008160, highly similar to Monoglyceride lipase
B3KRC2 -1.37** Transcription
Eukaryotic translation initiation factor 5A-1 P63241-2 -1.37** Metabolism
Ubiquitin-conjugating enzyme E2 variant 1 Q13404-1 -1.37** Apoptosis
Galectin-1 P09382 -1.36** Cell progression
Profilin-1 P07737 -1.36** Transcription
S-phase kinase-associated protein 1 Transcription elongation factor B
P63208-1 -1.35** Chaperone
UPF0404 protein C11orf59 Q6IAA8 -1.35** Signalling
DNA-directed RNA polymerases I, II, and III subunit, DNA-directed RNA polymerase II subunit H
P52434 -1.34** Transcription
Zinc finger protein ZPR1 O75312 -1.33** Apoptosis
UDP-N-acetylhexosamine pyrophosphorylase Q16222-1 -1.3** Hypothetical protein

Results
59
Proteins UniProt Fold change
Function
Tumor protein D54 O43399 -1.25** Signalling
Catenin alpha-1 cadherin-associated protein P35221-1 1.31** Signalling
Polymerase I and transcript release factor Q6NZI2-1 1.31** Hypothetical protein
Transforming protein RhoA P61586 1.32** Signalling, Apoptosis, Metabolism
Core histone macro-H2A.1 H2A.y O75367-1 1.34** Oxidation reduction
High mobility group protein B1 P09429 1.34** Signalling, Metabolism
cDNA FLJ53329, highly similar to NADPH: adrenodoxin oxidoreductase, Ml
B4DHX5 1.35** Signalling, Endocytosis, Metabolism
Histone H4 P62805 1.35** Metabolism
FK506-binding protein 3Peptidyl-prolyl cis-trans isomerase
Q00688 1.36** Signalling
Heterogeneous nuclear ribonucleoprotein G P38159 1.36** DNA repair, Replication, Cell cycle regulation
Apoptosis inhibitor 5 Q9BZZ5-2 1.38** Cell cycle
Histone H3 Q5TEC6 1.38** Transcription
U2 small nuclear ribonucleoprotein A' SNRPA1 protein
P09661 1.38** Hypothetical protein
Dolichyl-phosphate mannosyltransferase polypeptide 1, catalytic subunit
Q5QPK0 1.4** Hypothetical protein
Ras-related protein Rab-1A P62820-1 1.4** Transcription, Signalling, Translation
Ras-related protein Rab-7a P51149 1.41** Chaperone
Squalene synthetase Farnesyl-diphosphate farnesyltransferase FPP
P37268 1.41** Cell cycle, progression, Signalling, Transcription
Endothelial plasminogen activator inhibitor 1 P05121 1.42** Metabolism
Inhibitor of nuclear factor kappa-B kinase-interacting protein
Q70UQ0-1 1.43** Signalling, Cell cycle
40S ribosomal protein S540S, ribosomal protein S5 P46782 1.45** Apoptosis Metabolism
Lamin-A / C; 70 kDa lamin P02545-2 1.48** Signalling
Protein NipSnap homologue 1 Q9BPW8 1.5** Signalling
Cytochrome b-c1 complex subunit 8 O14949 1.51** Inflammatory response Signalling
UBX domain-containing protein 4UBX domain-containing protein 2; Erasin
Q92575 1.51** Transcription Gene expression
3-hydroxyisobutyryl-CoA hydrolase, Ml 3-hydroxyisobutyryl-coenzyme A hydrolase
Q6NVY1-1
1.52** Signalling
Hexokinase-2 P52789 1.55** Hypothetical protein

Results
60
Proteins UniProt Fold change
Function
DNA topoisomerase 2-alpha P11388-4 1.56** Protein Translocation
Myosin-Ic Myosin I beta Q4LE56 1.56** Signalling
Ras-related protein R-Ras p23 P10301 1.56** Hypothetical protein
Ras-related protein Rap-1b P61224 1.59** Cell proliferation, cell-cycle regulation
Cleavage signal-1 protein Ki-ras-induced actin-interacting protein
P28290-1 1.61** Signalling
Histone H1x Q92522 1.61** Gene expression
Nucleolar protein 7; nucleolar protein of 27 kDa Q9UMY1-1
1.64** Transcription
NADH dehydrogenase ubiquinone 1 alpha subcomplex
Q8WXC9 1.68** Transcription
Toll interacting protein variant Toll-interacting protein
Q59FB9 1.7** Apoptosis
Chitinase domain-containing protein 1 stabilin-1-interacting chitinase-like protein
Q9BWS9-1
1.74** DNA repair
SERPINE2 Protease inhibitor 7 B2R6A4 1.75** Signalling
39S ribosomal protein L22, Ml MRP-L25 Q9NWU5-1
1.76** Hypothetical protein
FAS-associated factor 2 UBX domain-containing protein 3B
Q96CS3 1.82** Metabolism, Post translational modification
CDGSH iron sulfur domain-containing protein 2 ER inter membrane small protein
Q8N5K1 1.9** Metabolism, Signalling, Cell growth
Phosphohexokinase; phosphofructo-1-kinase isozyme A
Q6ZTT1 2.05** Hypothetical protein
NADH dehydrogenase [ubiquinone] 1 subunit C2 O95298 2.06** Protein translocation
Serine / threonine-protein kinase PRP4 homologue PRP4 kinase
Q13523 2.08** Signalling, Cell proliferation
* = p ≤ 0.05, ** = p ≤ 0.01 (p = significance calculated as described by Cox et al. (Cox and Mann, 2008)).
Hypothetical protein: A protein whose in vivo function and expression have not been predicted.

Results
61
6.2.2 Protein expression changes identified by 2D-DIGE strategy
Protein extracts obtained from the EA.hy926 cells 4 hours and 24 hours after exposure to 2.5 Gy
ionising radiation were analysed with 2D-DIGE strategy as described in the section 5.3.2. All
deregulated spots identified by DeCyderTM software (p-value < 0.01, variability < 50 % between
biological replicates, identification based on at least 2 unique peptides) are shown in Figure 11.
All corresponding proteins were identified with MALDI-TOF / TOF (abundant) and or ESI LC
MS / MS (non-abundant). Twenty seven proteins were found to be differentially regulated at 4 h
after irradiation (Table 12), all 27 proteins showed decreased abundance. The protein with
maximum fold change was cDNA FLJ54776, highly similar to cell division control protein 42
homologue with -3.24 fold down-regulation. At 24 h after irradiation 18 proteins were found to be
significantly deregulated (Table 13). Of these 10 were up-regulated and 8 down-regulated, fold
changes ranging from 1.71 to -2.06. The protein showing largest deregulation was cofilin1 (-2.06).
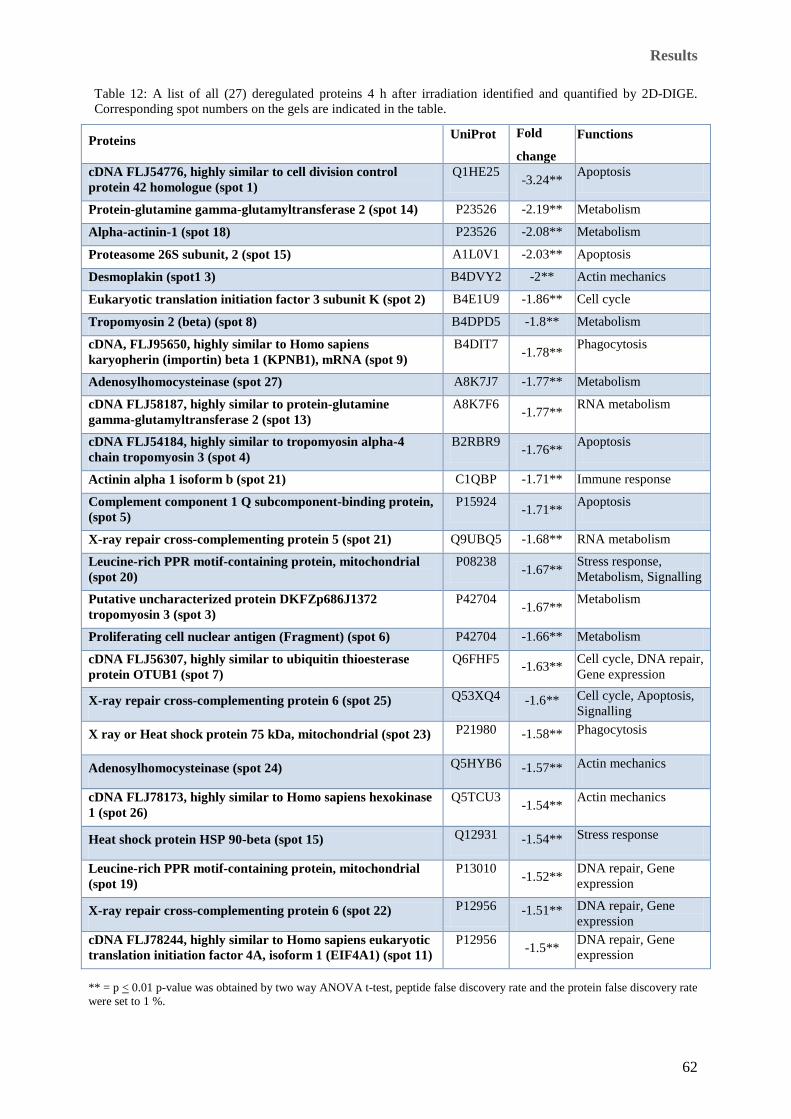
Results
62
Table 12: A list of all (27) deregulated proteins 4 h after irradiation identified and quantified by 2D-DIGE. Corresponding spot numbers on the gels are indicated in the table.
Proteins UniProt Fold
change
Functions
cDNA FLJ54776, highly similar to cell division control protein 42 homologue (spot 1)
Q1HE25 -3.24** Apoptosis
Protein-glutamine gamma-glutamyltransferase 2 (spot 14) P23526 -2.19** Metabolism
Alpha-actinin-1 (spot 18) P23526 -2.08** Metabolism
Proteasome 26S subunit, 2 (spot 15) A1L0V1 -2.03** Apoptosis
Desmoplakin (spot1 3) B4DVY2 -2** Actin mechanics
Eukaryotic translation initiation factor 3 subunit K (spot 2) B4E1U9 -1.86** Cell cycle
Tropomyosin 2 (beta) (spot 8) B4DPD5 -1.8** Metabolism
cDNA, FLJ95650, highly similar to Homo sapiens karyopherin (importin) beta 1 (KPNB1), mRNA (spot 9)
B4DIT7 -1.78** Phagocytosis
Adenosylhomocysteinase (spot 27) A8K7J7 -1.77** Metabolism
cDNA FLJ58187, highly similar to protein-glutamine gamma-glutamyltransferase 2 (spot 13)
A8K7F6 -1.77** RNA metabolism
cDNA FLJ54184, highly similar to tropomyosin alpha-4 chain tropomyosin 3 (spot 4)
B2RBR9 -1.76** Apoptosis
Actinin alpha 1 isoform b (spot 21) C1QBP -1.71** Immune response
Complement component 1 Q subcomponent-binding protein, (spot 5)
P15924 -1.71** Apoptosis
X-ray repair cross-complementing protein 5 (spot 21) Q9UBQ5 -1.68** RNA metabolism
Leucine-rich PPR motif-containing protein, mitochondrial (spot 20)
P08238 -1.67** Stress response, Metabolism, Signalling
Putative uncharacterized protein DKFZp686J1372 tropomyosin 3 (spot 3)
P42704 -1.67** Metabolism
Proliferating cell nuclear antigen (Fragment) (spot 6) P42704 -1.66** Metabolism
cDNA FLJ56307, highly similar to ubiquitin thioesterase protein OTUB1 (spot 7)
Q6FHF5 -1.63** Cell cycle, DNA repair, Gene expression
X-ray repair cross-complementing protein 6 (spot 25) Q53XQ4 -1.6** Cell cycle, Apoptosis, Signalling
X ray or Heat shock protein 75 kDa, mitochondrial (spot 23) P21980 -1.58** Phagocytosis
Adenosylhomocysteinase (spot 24) Q5HYB6 -1.57** Actin mechanics
cDNA FLJ78173, highly similar to Homo sapiens hexokinase 1 (spot 26)
Q5TCU3 -1.54** Actin mechanics
Heat shock protein HSP 90-beta (spot 15) Q12931 -1.54** Stress response
Leucine-rich PPR motif-containing protein, mitochondrial (spot 19)
P13010 -1.52** DNA repair, Gene expression
X-ray repair cross-complementing protein 6 (spot 22) P12956 -1.51** DNA repair, Gene expression
cDNA FLJ78244, highly similar to Homo sapiens eukaryotic translation initiation factor 4A, isoform 1 (EIF4A1) (spot 11)
P12956 -1.5** DNA repair, Gene expression
** = p < 0.01 p-value was obtained by two way ANOVA t-test, peptide false discovery rate and the protein false discovery rate were set to 1 %.
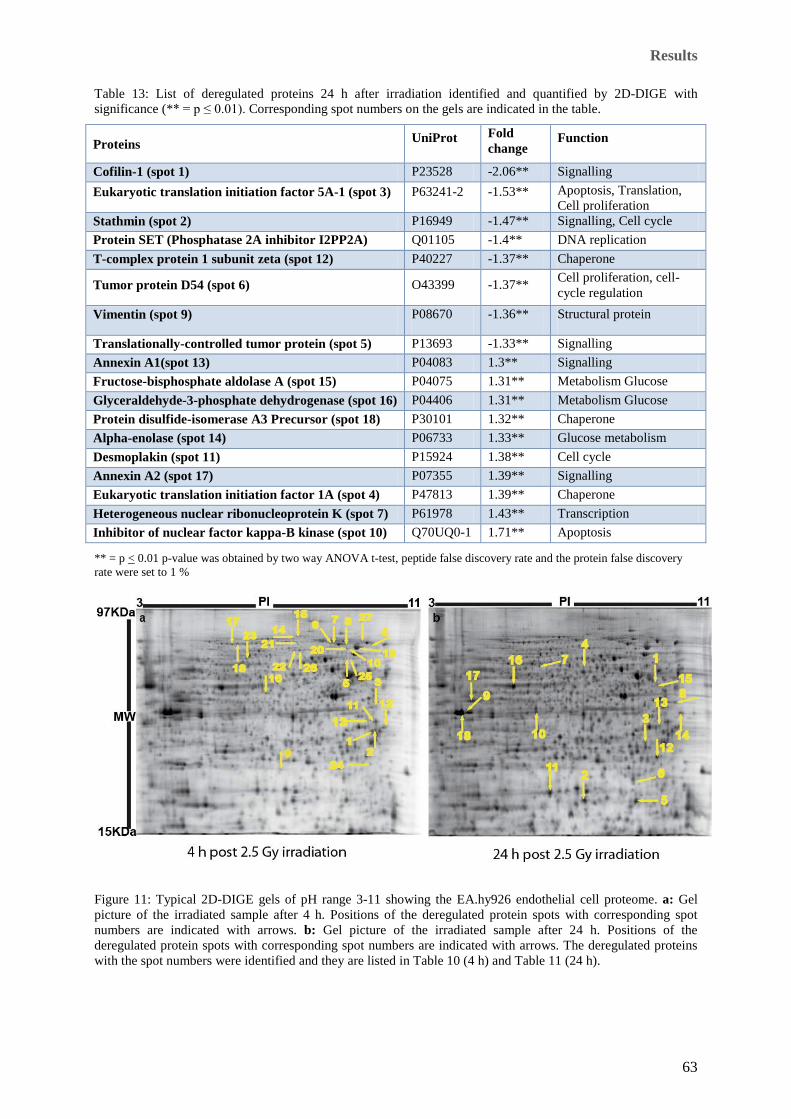
Results
63
Table 13: List of deregulated proteins 24 h after irradiation identified and quantified by 2D-DIGE with significance (** = p ≤ 0.01). Corresponding spot numbers on the gels are indicated in the table.
Proteins UniProt Fold change
Function
Cofilin-1 (spot 1) P23528 -2.06** Signalling Eukaryotic translation initiation factor 5A-1 (spot 3) P63241-2 -1.53** Apoptosis, Translation,
Cell proliferation Stathmin (spot 2) P16949 -1.47** Signalling, Cell cycle Protein SET (Phosphatase 2A inhibitor I2PP2A)
Q01105 -1.4** DNA replication
T-complex protein 1 subunit zeta (spot 12) P40227 -1.37** Chaperone
Tumor protein D54 (spot 6) O43399 -1.37** Cell proliferation, cell-cycle regulation
Vimentin (spot 9) P08670 -1.36** Structural protein
Translationally-controlled tumor protein (spot 5) P13693 -1.33** Signalling Annexin A1(spot 13) P04083 1.3** Signalling Fructose-bisphosphate aldolase A (spot 15) P04075 1.31** Metabolism Glucose Glyceraldehyde-3-phosphate dehydrogenase (spot 16) P04406 1.31** Metabolism Glucose Protein disulfide-isomerase A3 Precursor (spot 18) P30101 1.32** Chaperone Alpha-enolase (spot 14) P06733 1.33** Glucose metabolism Desmoplakin (spot 11) P15924 1.38** Cell cycle Annexin A2 (spot 17) P07355 1.39** Signalling Eukaryotic translation initiation factor 1A (spot 4) P47813 1.39** Chaperone Heterogeneous nuclear ribonucleoprotein K (spot 7) P61978 1.43** Transcription Inhibitor of nuclear factor kappa-B kinase (spot 10) Q70UQ0-1 1.71** Apoptosis
** = p < 0.01 p-value was obtained by two way ANOVA t-test, peptide false discovery rate and the protein false discovery rate were set to 1 %
Figure 11: Typical 2D-DIGE gels of pH range 3-11 showing the EA.hy926 endothelial cell proteome. a: Gel picture of the irradiated sample after 4 h. Positions of the deregulated protein spots with corresponding spot numbers are indicated with arrows. b: Gel picture of the irradiated sample after 24 h. Positions of the deregulated protein spots with corresponding spot numbers are indicated with arrows. The deregulated proteins with the spot numbers were identified and they are listed in Table 10 (4 h) and Table 11 (24 h).

Results
64
6.2.3 Functional correlation of the affected proteins
To categorise the proteins according to their biological functions, all deregulated proteins at 4 h
and 24 h after 2.5 Gy irradiation, obtained from SILAC and 2D-DIGE corresponding to either 4 h
or 24 h time points were analysed by a database search using UniProt, Swiss-Prot and PANTHER.
The analysis revealed several radiation-induced biological processes (Figure 12 and Figure 13).
At 4 h after 2.5 Gy irradiation 16 processes and at 24 h after irradiation 20 processes were found
to be affected. Of these 8 were affected at both time points. At 4 h, changes in DNA repair and
replication, cell cycle and proliferation, stress response, apoptosis and general metabolic activity
were more pronounced than at the 24 h time point; whereas alterations in cellular signalling and
transcriptional activity were more pronounced at 24 h than that at 4 h. The red and green arrows in
the Figure 13 (functions of proteins at 24 h after 2.5 Gy irradiation) represent either increase or
decrease (in the number of proteins involved in a particular function) respectively compared to the
4 h time point functions. Some functions were time dependent i.e. the immune response and
alteration of the Golgi proteome were altered only at 4 h. In contrast glucose metabolism,
inflammatory response, mitochondrial degradation and electron transport, protein translocation,
posttranslational modification and translational activation were processes found to be altered only
at 24 h.
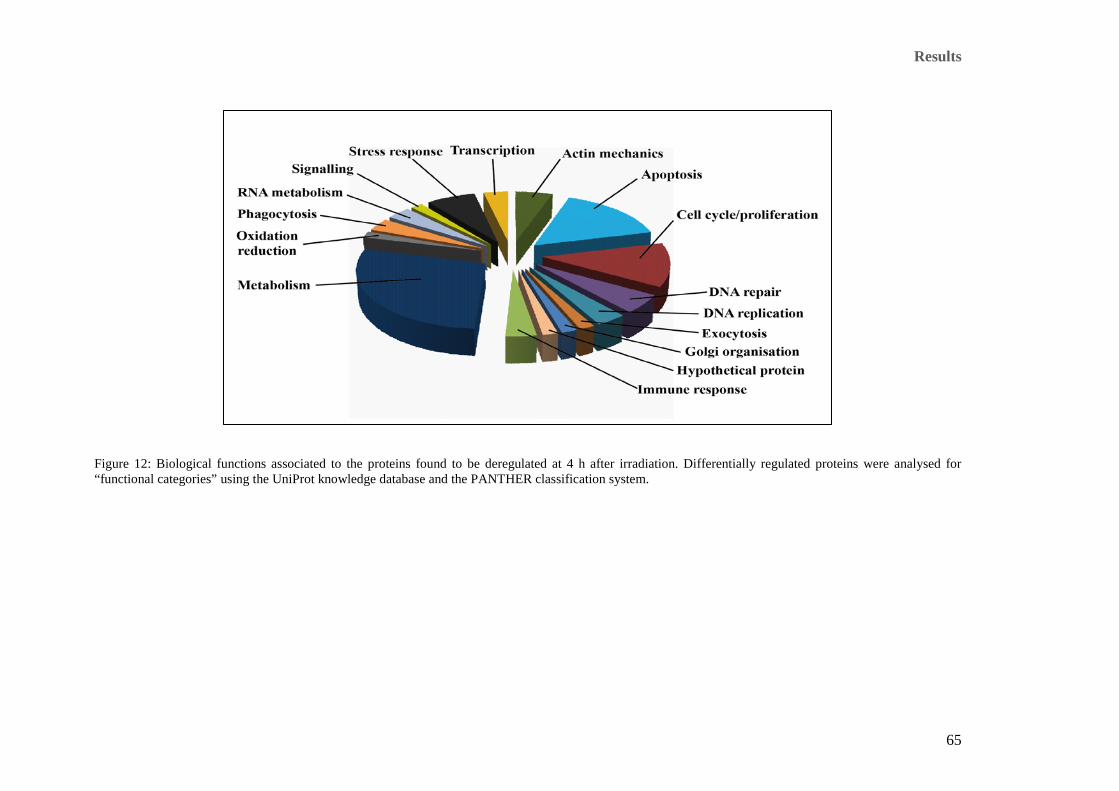
Results
65
Figure 12: Biological functions associated to the proteins found to be deregulated at 4 h after irradiation. Differentially regulated proteins were analysed for “functional categories” using the UniProt knowledge database and the PANTHER classification system.

Results
66
Figure 13: Functional classification of differentially expressed proteins at 24 h after irradiation. Categorisation according to the biological functions of deregulated proteins was done using the UniProt knowledge database and the PANTHER classification system. Red and green arrows in the figure represent increase or decrease of the functions in comparison to that of the 4 h time point respectively.

Results
67
6.2.4 Deciphering affected biological pathways by bioinformatic analysis
In order to analyse protein-protein interactions, protein networks and the biological pathways
involved in the radiation response, significantly differentially expressed proteins at 4 h and 24 h
were separately imported into the Ingenuity Pathway Analysis (IPA) software. The top scoring
networks (as described in section 5.5.1) with most significant p-values and their respective
biological pathways were considered to be radiation responsive.
i) Early-response biological networks and pathways
A total of 59 proteins were identified as being significantly differentially expressed using both
SILAC and 2D-DIGE at the 4-hour time point. All these proteins were loaded into the IPA and the
biological networks and pathways were analysed. The top network functions associated with the
proteins found to be deregulated at 4 h after irradiation are shown in Table 14. The top 2
significant networks affected were “cell morphology, cellular function and maintenance, DNA
replication, recombination and repair” (Figure 14) and “cellular compromise, cell morphology,
cell death” (Figure 15) with highly significant score (as defined in section 5.5.1) of 56 and 23
respectively. The definition and calculation of the score and p-value of a network are as described
in section 5.5.1. A network score of 10 would have the probability of occurring 10-10 randomly
and hence a score of 10 and above was considered to be significant (Prisyazhiuk et al., 1991). The
first network represents 23 and the second 13 focus molecules (focus molecules are proteins
showing altered expression levels in our study). The proteins involved in these networks are
indicated with their IPA names and fold changes in Table 15. Some pre-eminent nodal molecules,
i.e. proteins that were not found to be altered but were either targets or interacting with focus
molecules of the radiation-responsive networks include nuclear factor NF-kappa-B (NF-κB)
complex, histone 4 (H4), caspase 3, Rho GDI and retinoblastoma (pRB tumour suppressor). All of
which are thematically radiation responsive.
Top biological pathways found to be associated with the differentially expressed proteins were
DNA repair by non-homologous end joining (NHEJ) and synthesis / degradation of ketone bodies
as depicted in Table 16. The Ku-heterodimers were both found to be down-regulated (Ku70, = -
1.68** and Ku80 = -1.60**) thus affecting DNA repair by NHEJ pathway (Figure 16). Further, a
differential expression of two proteins of the ketone body synthesis: HMG-CoA synthase (1.44**)
and acetyl-CoA-acetyltransferase (ACAT 1) (-1.39**) (Figure 17) were significantly deregulated
at 4 h after irradiation. (** = p < 0.01).
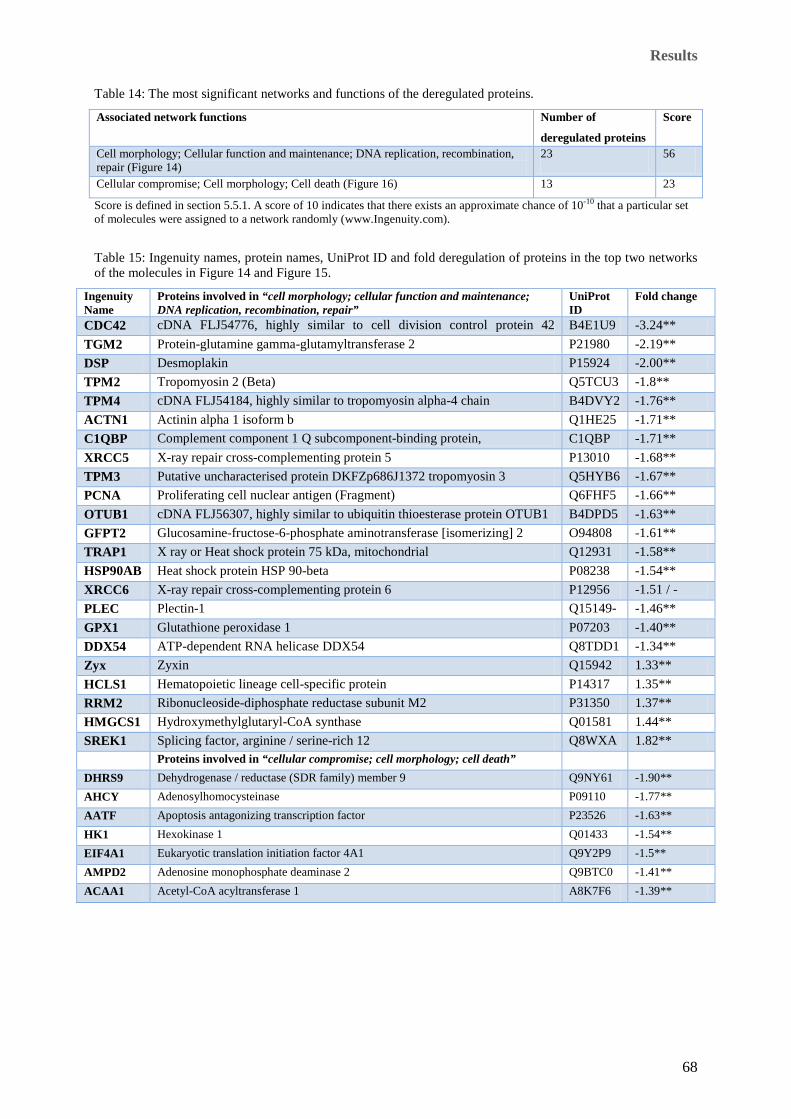
Results
68
Table 14: The most significant networks and functions of the deregulated proteins.
Associated network functions Number of
deregulated proteins
Score
Cell morphology; Cellular function and maintenance; DNA replication, recombination, repair (Figure 14)
23 56
Cellular compromise; Cell morphology; Cell death (Figure 16) 13 23
Score is defined in section 5.5.1. A score of 10 indicates that there exists an approximate chance of 10-10 that a particular set of molecules were assigned to a network randomly (www.Ingenuity.com).
Table 15: Ingenuity names, protein names, UniProt ID and fold deregulation of proteins in the top two networks of the molecules in Figure 14 and Figure 15.
Ingenuity Name
Proteins involved in “cell morphology; cellular function and maintenance; DNA replication, recombination, repair”
UniProt ID
Fold change
CDC42 cDNA FLJ54776, highly similar to cell division control protein 42
B4E1U9 -3.24** TGM2 Protein-glutamine gamma-glutamyltransferase 2 P21980 -2.19** DSP Desmoplakin P15924 -2.00** TPM2 Tropomyosin 2 (Beta) Q5TCU3 -1.8** TPM4 cDNA FLJ54184, highly similar to tropomyosin alpha-4 chain
i B4DVY2 -1.76**
ACTN1 Actinin alpha 1 isoform b Q1HE25 -1.71** C1QBP Complement component 1 Q subcomponent-binding protein,
i h d i l C1QBP -1.71**
XRCC5 X-ray repair cross-complementing protein 5 P13010 -1.68** TPM3 Putative uncharacterised protein DKFZp686J1372 tropomyosin 3 Q5HYB6 -1.67** PCNA Proliferating cell nuclear antigen (Fragment) Q6FHF5 -1.66** OTUB1 cDNA FLJ56307, highly similar to ubiquitin thioesterase protein OTUB1 B4DPD5 -1.63** GFPT2 Glucosamine-fructose-6-phosphate aminotransferase [isomerizing] 2 O94808 -1.61** TRAP1 X ray or Heat shock protein 75 kDa, mitochondrial Q12931 -1.58** HSP90AB
Heat shock protein HSP 90-beta P08238 -1.54**
XRCC6 X-ray repair cross-complementing protein 6 P12956 -1.51 / -** PLEC Plectin-1 Q15149-
-1.46**
GPX1 Glutathione peroxidase 1 P07203 -1.40** DDX54 ATP-dependent RNA helicase DDX54 Q8TDD1 -1.34** Zyx Zyxin Q15942 1.33** HCLS1 Hematopoietic lineage cell-specific protein P14317 1.35** RRM2 Ribonucleoside-diphosphate reductase subunit M2 P31350 1.37** HMGCS1 Hydroxymethylglutaryl-CoA synthase Q01581 1.44** SREK1 Splicing factor, arginine / serine-rich 12 Q8WXA
1.82**
Proteins involved in “cellular compromise; cell morphology; cell death” DHRS9 Dehydrogenase / reductase (SDR family) member 9 Q9NY61 -1.90** AHCY Adenosylhomocysteinase P09110 -1.77** AATF Apoptosis antagonizing transcription factor P23526 -1.63** HK1 Hexokinase 1 Q01433 -1.54** EIF4A1 Eukaryotic translation initiation factor 4A1 Q9Y2P9 -1.5** AMPD2 Adenosine monophosphate deaminase 2 Q9BTC0 -1.41** ACAA1 Acetyl-CoA acyltransferase 1 A8K7F6 -1.39**

Results
69
Ingenuity Name
Proteins involved in “cellular compromise; cell morphology; cell death” UniProt ID
Fold change
TPP1 Tripeptidyl peptidase I P42566 -1.39** RETSAT Retinol saturase (all-trans-retinol 13,14-reductase) A8K7J7 -1.32** DIDO1 Death inducer-obliterator 1 A5I8L1 1.32** HLA-A Major histocompatibility complex, class I, A Q6NUM9 1.38** EPS15 Epidermal growth factor receptor pathway substrate 15 O14773 1.49**
** = p ≤ 0.01.
For SILAC (p = significance calculated as described by Cox et al. (Cox and Mann, 2008)).
For 2D-DIGE p-value was obtained by two way ANOVA t-test, peptide false discovery rate and the protein false discovery rate were set to 1 %.
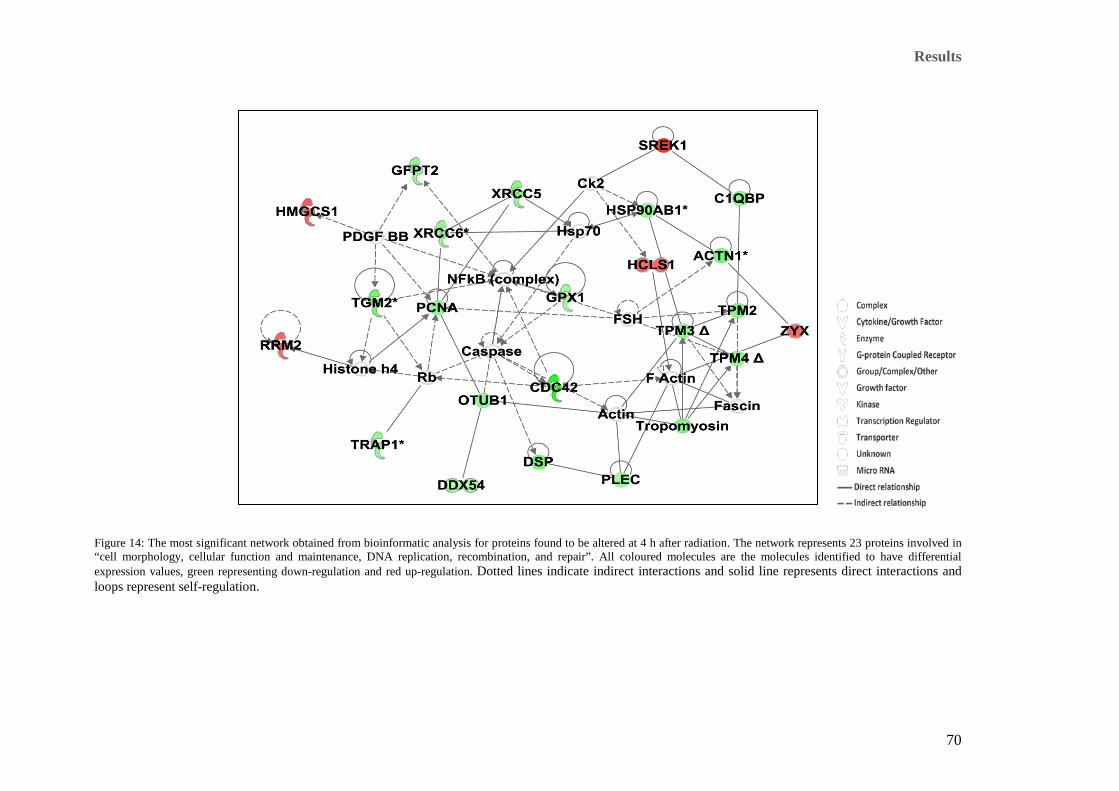
Results
70
Figure 14: The most significant network obtained from bioinformatic analysis for proteins found to be altered at 4 h after radiation. The network represents 23 proteins involved in “cell morphology, cellular function and maintenance, DNA replication, recombination, and repair”. All coloured molecules are the molecules identified to have differential expression values, green representing down-regulation and red up-regulation. Dotted lines indicate indirect interactions and solid line represents direct interactions and loops represent self-regulation.
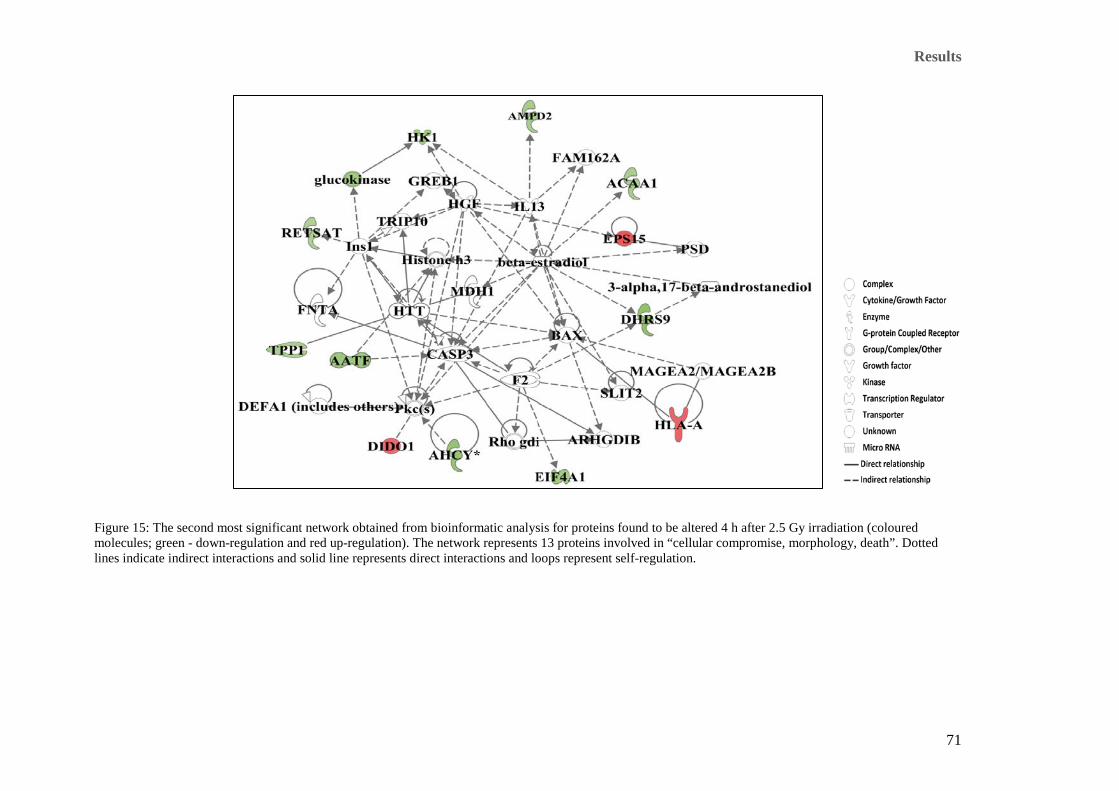
Results
71
Figure 15: The second most significant network obtained from bioinformatic analysis for proteins found to be altered 4 h after 2.5 Gy irradiation (coloured molecules; green - down-regulation and red up-regulation). The network represents 13 proteins involved in “cellular compromise, morphology, death”. Dotted lines indicate indirect interactions and solid line represents direct interactions and loops represent self-regulation.
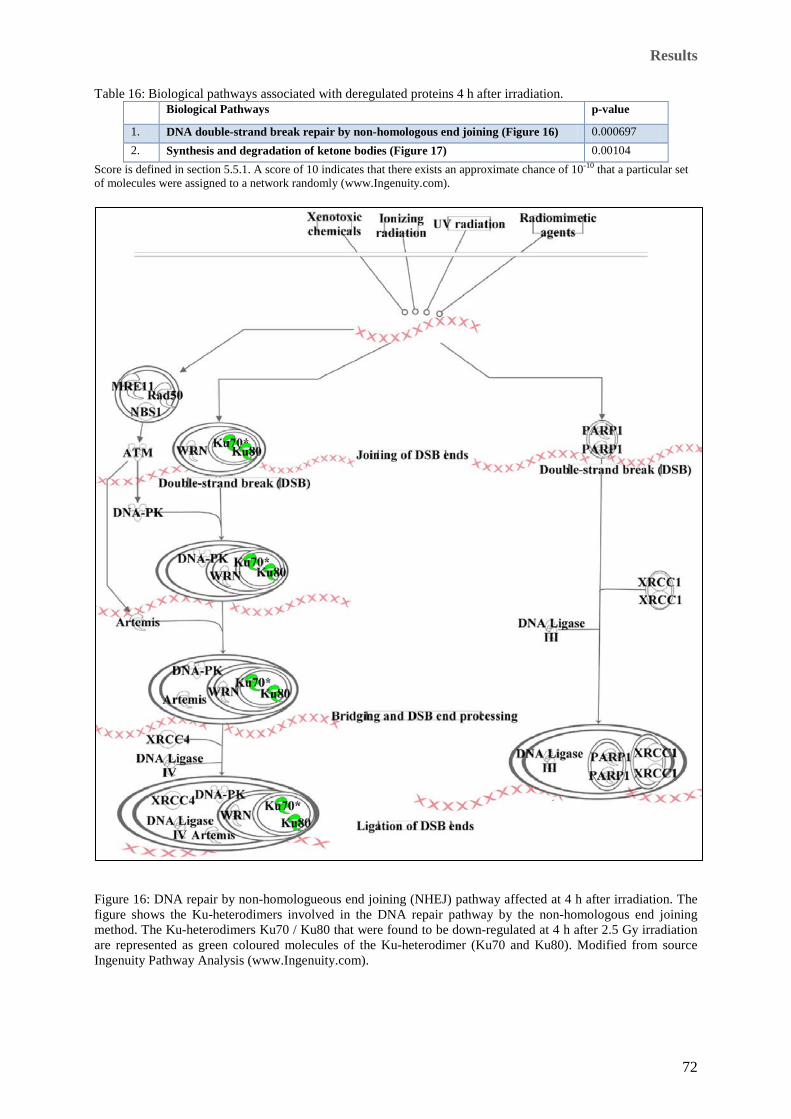
Results
72
Table 16: Biological pathways associated with deregulated proteins 4 h after irradiation. Biological Pathways p-value
1. DNA double-strand break repair by non-homologous end joining (Figure 16) 0.000697
2. Synthesis and degradation of ketone bodies (Figure 17) 0.00104 Score is defined in section 5.5.1. A score of 10 indicates that there exists an approximate chance of 10-10 that a particular set of molecules were assigned to a network randomly (www.Ingenuity.com).
Figure 16: DNA repair by non-homologueous end joining (NHEJ) pathway affected at 4 h after irradiation. The figure shows the Ku-heterodimers involved in the DNA repair pathway by the non-homologous end joining method. The Ku-heterodimers Ku70 / Ku80 that were found to be down-regulated at 4 h after 2.5 Gy irradiation are represented as green coloured molecules of the Ku-heterodimer (Ku70 and Ku80). Modified from source Ingenuity Pathway Analysis (www.Ingenuity.com).

Results
73
Figure 17: Synthesis and degradation of ketone bodies affected at 4 h after irradiation. The figure shows the synthesis and degradation of ketone bodies, representing the two proteins from this pathway the ACAT-1 down-regulated (green-2.3.1.9) and the up-regulated HMG-CoA synthase (red-2.3.3.10) found to be differentially expressed at 4 h after 2.5 Gy irradiation. Modified from source Ingenuity Pathway Analysis (www.Ingenuity.com).
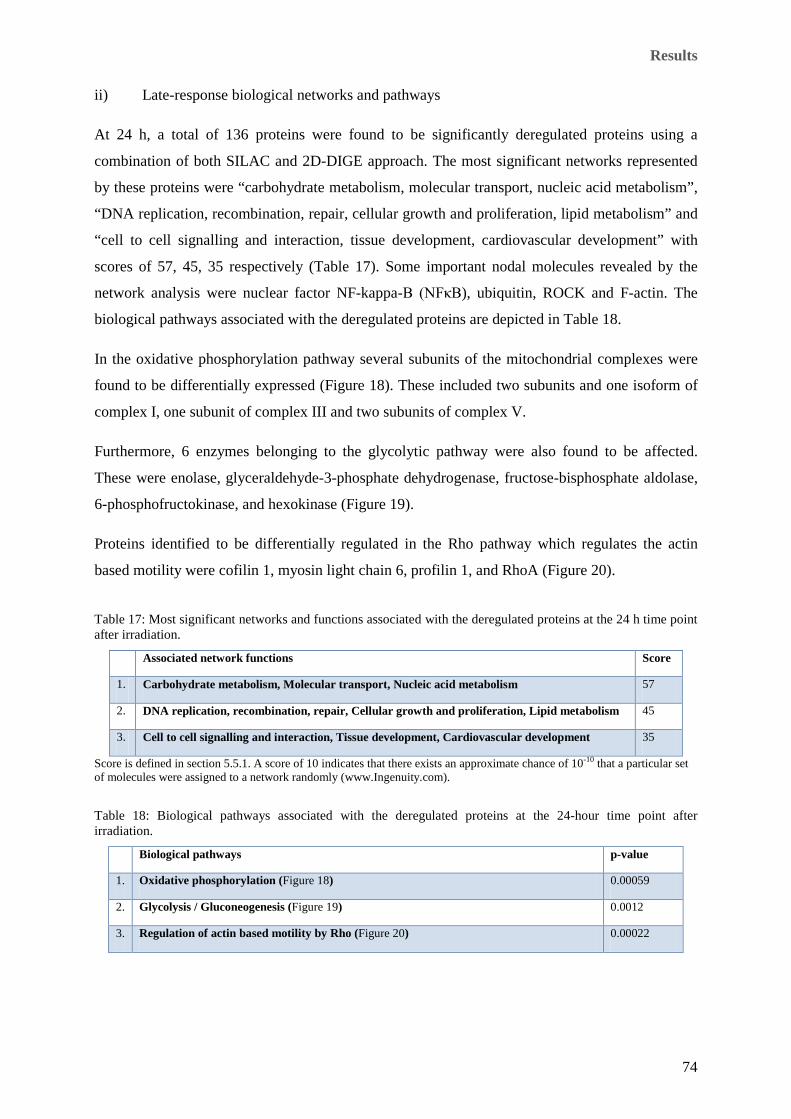
Results
74
ii) Late-response biological networks and pathways
At 24 h, a total of 136 proteins were found to be significantly deregulated proteins using a
combination of both SILAC and 2D-DIGE approach. The most significant networks represented
by these proteins were “carbohydrate metabolism, molecular transport, nucleic acid metabolism”,
“DNA replication, recombination, repair, cellular growth and proliferation, lipid metabolism” and
“cell to cell signalling and interaction, tissue development, cardiovascular development” with
scores of 57, 45, 35 respectively (Table 17). Some important nodal molecules revealed by the
network analysis were nuclear factor NF-kappa-B (NFκB), ubiquitin, ROCK and F-actin. The
biological pathways associated with the deregulated proteins are depicted in Table 18.
In the oxidative phosphorylation pathway several subunits of the mitochondrial complexes were
found to be differentially expressed (Figure 18). These included two subunits and one isoform of
complex I, one subunit of complex III and two subunits of complex V.
Furthermore, 6 enzymes belonging to the glycolytic pathway were also found to be affected.
These were enolase, glyceraldehyde-3-phosphate dehydrogenase, fructose-bisphosphate aldolase,
6-phosphofructokinase, and hexokinase (Figure 19).
Proteins identified to be differentially regulated in the Rho pathway which regulates the actin
based motility were cofilin 1, myosin light chain 6, profilin 1, and RhoA (Figure 20).
Table 17: Most significant networks and functions associated with the deregulated proteins at the 24 h time point after irradiation.
Associated network functions Score
1. Carbohydrate metabolism, Molecular transport, Nucleic acid metabolism 57
2. DNA replication, recombination, repair, Cellular growth and proliferation, Lipid metabolism 45
3. Cell to cell signalling and interaction, Tissue development, Cardiovascular development 35
Score is defined in section 5.5.1. A score of 10 indicates that there exists an approximate chance of 10-10 that a particular set of molecules were assigned to a network randomly (www.Ingenuity.com).
Table 18: Biological pathways associated with the deregulated proteins at the 24-hour time point after irradiation.
Biological pathways p-value
1. Oxidative phosphorylation (Figure 18) 0.00059
2. Glycolysis / Gluconeogenesis (Figure 19) 0.0012
3. Regulation of actin based motility by Rho (Figure 20) 0.00022
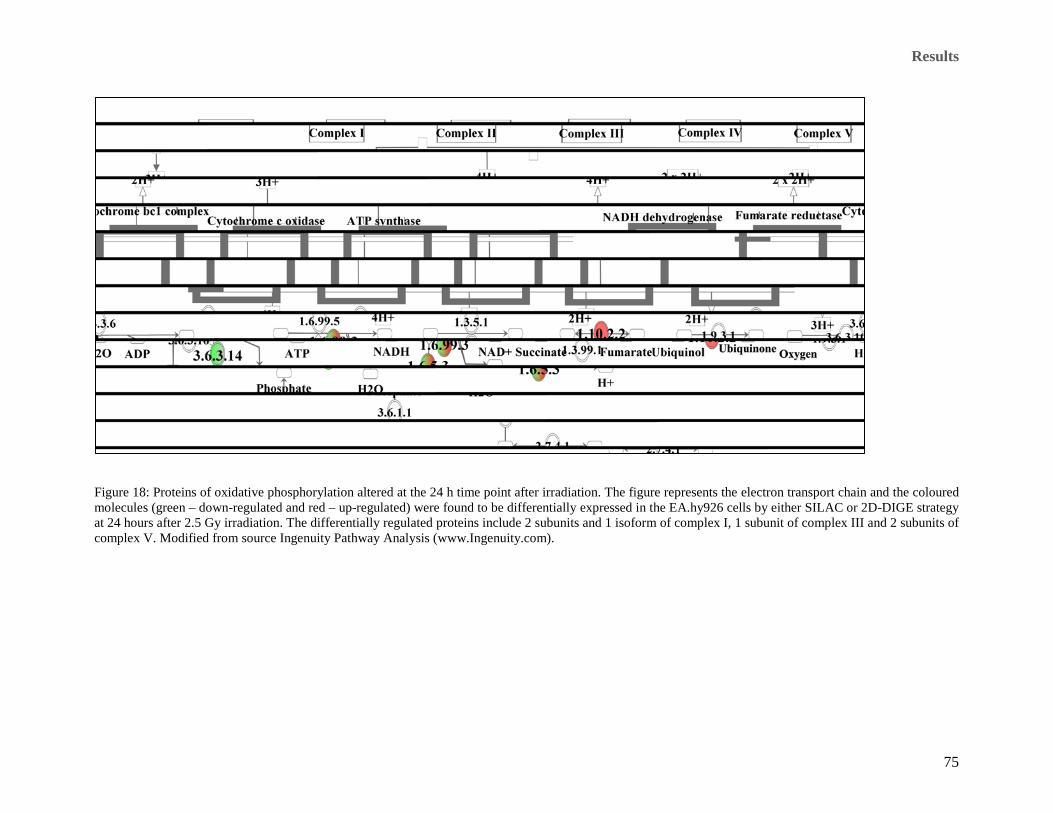
Results
75
Figure 18: Proteins of oxidative phosphorylation altered at the 24 h time point after irradiation. The figure represents the electron transport chain and the coloured molecules (green – down-regulated and red – up-regulated) were found to be differentially expressed in the EA.hy926 cells by either SILAC or 2D-DIGE strategy at 24 hours after 2.5 Gy irradiation. The differentially regulated proteins include 2 subunits and 1 isoform of complex I, 1 subunit of complex III and 2 subunits of complex V. Modified from source Ingenuity Pathway Analysis (www.Ingenuity.com).
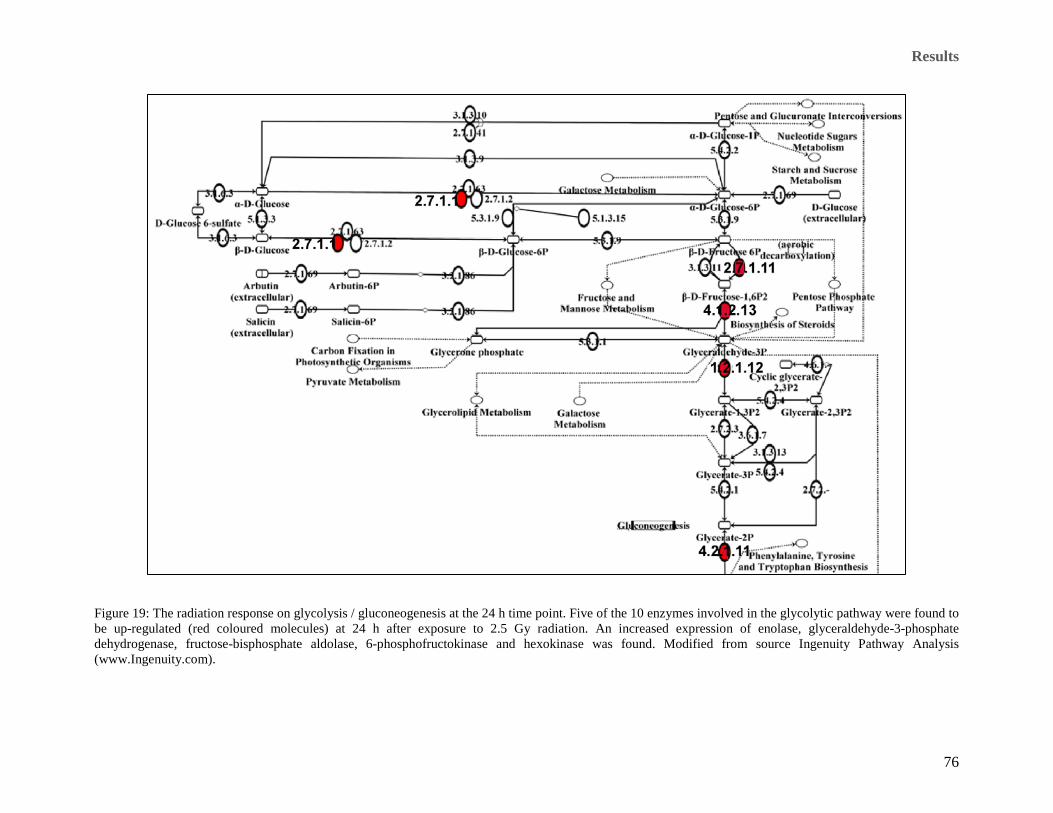
Results
76
Figure 19: The radiation response on glycolysis / gluconeogenesis at the 24 h time point. Five of the 10 enzymes involved in the glycolytic pathway were found to be up-regulated (red coloured molecules) at 24 h after exposure to 2.5 Gy radiation. An increased expression of enolase, glyceraldehyde-3-phosphate dehydrogenase, fructose-bisphosphate aldolase, 6-phosphofructokinase and hexokinase was found. Modified from source Ingenuity Pathway Analysis (www.Ingenuity.com).

Results
77
Figure 20: Actin-based mobility by Rho related proteins. The figure shows proteins that were differentially expressed in the Actin-based mobility pathway. Differentially regulated proteins (green: down-regulated and red: up-regulated) are cofilin 1, myosin light chain 6 (MLC), profilin 1, and RhoA. Modified from source Ingenuity Pathway Analysis (www.Ingenuity.com).
Results
78
6.2.5 In Silico analysis to establish the relationship between deregulated
microRNAs and proteins
To analyse the effect of 2.5 Gy irradiation on regulation of the EA.hy926 cell where miRNA may
be involved, our lab (Kraemer et al., 2011) carried out miRNA expression profiling using TLDA
Human MicroRNA Panel A v2.1. Alterations in the expression of 22 miRNAs each at 4 and 24 h
after exposure to a radiation dose of 2.5 Gy were reported. At 4 hours 8 miRNAs were up-
regulated and 14 down-regulated and at 24 hours 4 were up-regulated and 18 down-regulated in
the endothelial cell line EA.hy926. Two of the 22 miRNAs were common to both time points.
In order to establish a potential association between these differentially expressed miRNAs and
the proteins found in this study to be altered after irradiation (2.5 Gy), all deregulated molecules
were imported and analysed with the ingenuity software. The ingenuity software delivers the
possible targets of the miRNAs based on the TarBase, TargetScan, and miRecords databases. In
the analysis the interactions showing an increase in the miRNA expression level and decrease in
proteins and vice versa were considered as plausible targets, whereas interactions containing the
miRNAs and proteins with similar expression patterns were excluded. Figure 21 and Figure 22
represent the correlation between the changes observed in deregulated miRNAs and differentially
expressed proteins at 4 h and 24 h respectively. The networks indicate possible interactions
between the miRNAs and proteins.
At 4 h, of the 22 miRNAs and 59 proteins that were examined in networks, interactions were
predicted between 10 microRNAs and 6 proteins. Examples of miRNA protein interactions
predicted include interaction between:
a) hsa-miR-146a () and LIN7C ()
b) hsa-let-7c (), and hsa-miR-331 () with RRM2 ()
c) hsa-miR-101 () with DIDO1 ()
d) hsa-miR-515 (), hsa-miR-526a (), and hsa-miR-515 () with RAB23 ()
e) hsa-miR-124 () with SREK1 ()
f) hsa-miR-323 () with HMGCS1 ()
() () represent down- and up-regulation, respectively.
At 24 hours, all the deregulated miRNAs and proteins the predicted network indicates plausible
interaction between 4 miRNAs and 23 proteins. In Figure 22 (deregulated molecules of 24 hours
after irradiation) the hsa-miR-105-5p, hsa-miR-323 and hsa-miR-539-3p formed central nodes

Results
79
and the deregulated proteins branched out of these central nodes. The predicted interactions are as
follows:
a) hsa-miR-105-5p () with FDFT1, HMGB1, MRLP22, AP15, FAF2, CISD2, HK2,
PRPF4B (all)
b) hsa-miR-323 () with PRPF4B, IKBIP, RAP1B, CTNNA1, HK2 (all)
c) hsa-miR-539-3p () with RAP1B and RHOA (both)
d) hsa-miR-628-5p () with CALM1, MYL 6 (both)
() () represent down- and up-regulation respectively.
Both the networks showed that in all of these cases the miRNAs with a predicted direct
interaction and the corresponding protein showed opposite regulation i.e. if the miRNA was up-
regulated the protein interacting with it was down-regulated and vice versa.

Results
80
Figure 21: Association of deregulated miRNAs and differentially expressed proteins 4 hours after the exposure to irradiation. MiRNA data obtained from the study by Kraemer et al. (Kraemer et al., 2011) were combined with proteomic alterations found in this study either by SILAC or 2D-DIGE technology to analyse putative regulation and association between the miRNAs and proteins. Molecules coloured in green indicate down-regulation and red colour represents up-regulation of expression. Solid line arrows represent direct interactions.

Results
81
Figure 22: Correlation between deregulated miRNAs and differentially expressed proteins at 24 hours after the exposure to irradiation. The network represents the correlation between the deregulated miRNAs and proteins, miRNA data obtained from the Kraemer et al. (Kraemer et al., 2011) study. Molecules coloured in green indicate down-regulation and red colour represents up-regulation of expression. Solid line arrows represent direct interactions.
Results
82
6.3. Effect of low dose (200 mGy) ionising radiation on the endothelial cell
line EA.hy926
EA.hy926 cells were exposed to 200 mGy γ (Cs137) radiation and alterations in the proteome
using and miRNAome were analysed after 4 h and 24 h. This allows comparison of high and low
doses.
6.3.1 Proteomic alterations
Proteomic alterations in the EA.hy926 cell line were analysed in three biological replicates using
the SILAC strategy 4 and 24 hours after the exposure to a single acute radiation dose of 200 mGy
(Cs137 γ). Proteins were considered to be significantly deregulated if they were quantified with at
least 2 peptides; the p-value for replicates was < 0.05 and variability less than 50 % in at least two
of the three biological replicates.
At the 4 hour time point, 15 proteins were found to be differentially expressed when compared to
the sham-irradiated cells. Table 19 shows the proteins deregulated at this time point. The
maximum deregulated low-dose radiation-responsive proteins were mitochondrial 3-
hydroxyisobutyrate dehydrogenase (-1.329 *), and survival-promoting peptide protein (-5.94**)
(* represents p < 0.05 and ** represents p < 0.01).
Twenty-four hours after irradiation only 4 proteins were found to be differentially regulated as
represented in Table 20. Three of the 4 proteins found to be differentially regulated, namely 40S
ribosomal protein S11 (1.904*), 40S ribosomal protein S13 (3.128*) and glutamine-hydrolysing
asparagine synthetase or cell cycle control protein TS11 (1.470*) showed an increase in
abundance (* represents p < 0.05 and ** represents p < 0.01). Nicotinamide N-methyltransferase
was down-regulated (-1.453). Consistent with the results at 2.5 Gy there was no overlap between
the deregulated proteins between the two time points. Gelsolin, which was significantly down-
regulated at the 4-hour time point, was also down-regulated 24 hours after irradiation but this did
not reach the significance cut off.
Prominent functions of the 15 proteins found to be deregulated at 4 hour time point were
oxidoreductase activity, translation regulation, stress response, apoptotic process and immune
response. Further, the differentially expressed proteins were classified using the UniProt and
PANTHER databases. Figure 23 represents the functional classification of the deregulated
proteins Due to the small number of differentially expressed proteins at the 24 hour time point
functional classification of the proteins was difficult. However, 2 of the 4 proteins were
translation regulators.

Results
83
Proteins involved in the protein translational were found to be up-regulated at both time points
based on this analysis
Table 19: List of the significantly deregulated proteins 4 hours after irradiation with the 200 mGy dose identified and quantified by SILAC.
Proteins UniProt Fold change Functions
Preproteolysin; Survival-promoting peptide P81605 -5.94** Defense response Transmembrane protein 205 Q6UW68 -1.536* Hypothetical protein
Gelsolin P06396-1 -1.475* Apoptotic process; Actin polymerisation; Signalling;
Transmembrane and coiled-coil domain-containing protein 1 Q9UM00-1 -1.439* Hypothetical protein NADH dehydrogenase [ubiquinone] 1 alpha subcomplex subunit 7
O95182 -1.414* Electron transport; Respiratory chain
Putative uncharacterised protein GLIPR2; Glioma pathogenesis-related protein 2
A8MWQ4 -1.396** Hypothetical protein
Uncharacterized protein C9orf142 Q9BUH6-1 -1.365* Hypothetical protein 3-hydroxyisobutyrate dehydrogenase, mitochondrial P31937 -1.329* Oxidoreductase Ubiquitin / ISG15-conjugating enzyme E2 L6; Retinoic acid-induced gene B protein
O14933-1 -1.303* Immune response, Ligase activity
Calcineurin-like phosphoesterase domain-containing protein 1 Q9BRF8-1 1.375** Hydrolase activity; Metal ion binding
60S ribosomal protein L22-like 1 Q6P5R6 1.377* Translation
Small nuclear ribonucleoprotein polypeptide C variant Q53G33 1.426* Protein, nucleic acid, mRNA and zinc ion binding
Leucine-rich repeat-containing protein 20 Q8TCA0-1 1.463** Hypothetical protein
40S ribosomal protein S18;Ke-3 P62269 1.604* Translation; RNA binding; Metabolism
40S ribosomal protein S25 P62851 1.743* Translation; RNA binding; Metabolism
* = p ≤ 0.05, ** = p ≤ 0.01 (p = significance calculated as described by Cox et al. (Cox and Mann, 2008)).
Hypothetical protein: A protein whose in vivo function and expression have not been predicted.
Table 20: List of significantly deregulated proteins 24 h after irradiation with a 200 mGy dose identified and quantified by SILAC.
Proteins UniProt Fold change
Functions
Nicotinamide N-methyltransferase P40261 -1.453* Xenobiotic metabolic process
Asparagine synthetase [glutamine-hydrolysing]; Cell cycle control protein TS11
P08243 1.470* Negative regulation of apoptosis; Glucose starvation response; metabolic process
40S ribosomal protein S11 P62280 1.904* Translation; RNA binding; Metabolism
40S ribosomal protein S13 P62277 3.128* Translation; RNA binding; Metabolism
* = p ≤ 0.05 (p = significance calculated as described by Cox et al. (Cox and Mann, 2008)).
Hypothetical protein: A protein whose in vivo function and expression have not been predicted.
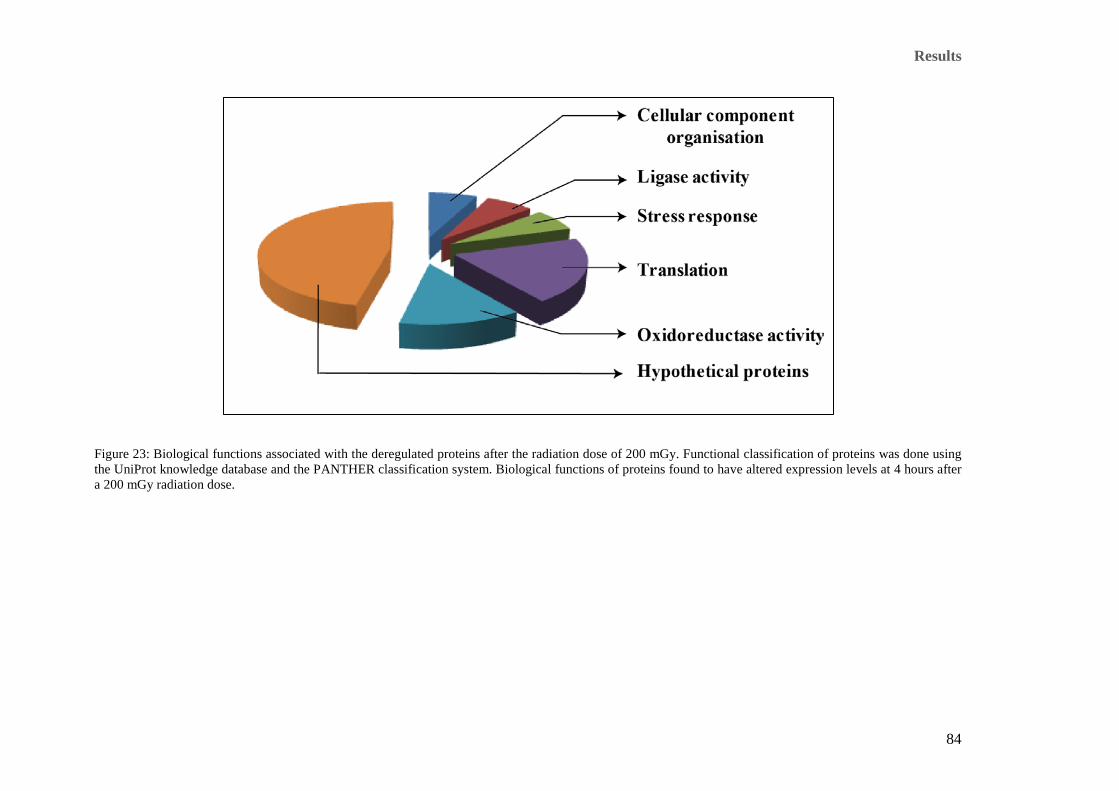
Results
84
Figure 23: Biological functions associated with the deregulated proteins after the radiation dose of 200 mGy. Functional classification of proteins was done using the UniProt knowledge database and the PANTHER classification system. Biological functions of proteins found to have altered expression levels at 4 hours after a 200 mGy radiation dose.
Results
85
6.3.2 Analysis of miRNAome of the EA.hy926 cells in response to 200 mGy
irradiation
In order to understand the effect of irradiation on the miRNA profile, alterations in the expression
levels of miRNAs were analysed using TLDA Human MicroRNA Panel A v2.1 and TaqMan®
Array Human MicroRNA B Card v2.0 at 4 h and 24 h after 200 mGy irradiation. To identify the
potential protein targets of the candidate miRNAs in silico analysis was performed followed by
either inhibition or over-expression of the candidate miRNAs and validating the protein
expression by immunoblotting.
6.3.2.1 Analysis of miRNA expression levels after low dose radiation (200 mGy)
The cells were irradiated with a γ dose of 200 mGy and harvested 4 h and 24 hours after
irradiation. At each time point 3 biological replicates were analysed, both treated and control
miRNA values were normalised using an endogenous control RNU 6 a small nucleolar RNA
(snoRNA). After normalisation, changes in the expression levels of miRNAs were calculated by
comparing them to the sham-irradiated control cells (as described in 5.4.3.). Expression level
changes were considered to be significant if the fold-change was + 1.5 in at least 2 of the three
biological replicates at each time point.
At 4 hours, a total of 24 miRNAs were found to be deregulated. Eighteen of the 24 deregulated
miRNAs were up-regulated and 6 down-regulated Figure 24. Consistent with the much lower
number of differentially expressed proteins at 24 h after 200 mGy irradiation, at 24 h after
irradiation only 6 miRNAs showed an increased and 9 a decreased abundance, resulting in a total
of 15 deregulated miRNAs (Figure 25). Two miRNAs, miR-7 and miR-923, were found to be
differentially expressed at both time point. MiR-7 was 4- and 12-fold up-regulated at the 4-hour
and 24-hour time points, respectively. MiR-923 was 4.15-fold up-regulated 4 hours after
irradiation and -6.67 fold down-regulated at the 24-hour time point. A Venn diagram showing the
total number of deregulated miRNAs and their overlap at the two time points analysed is shown in
Figure 26.
.
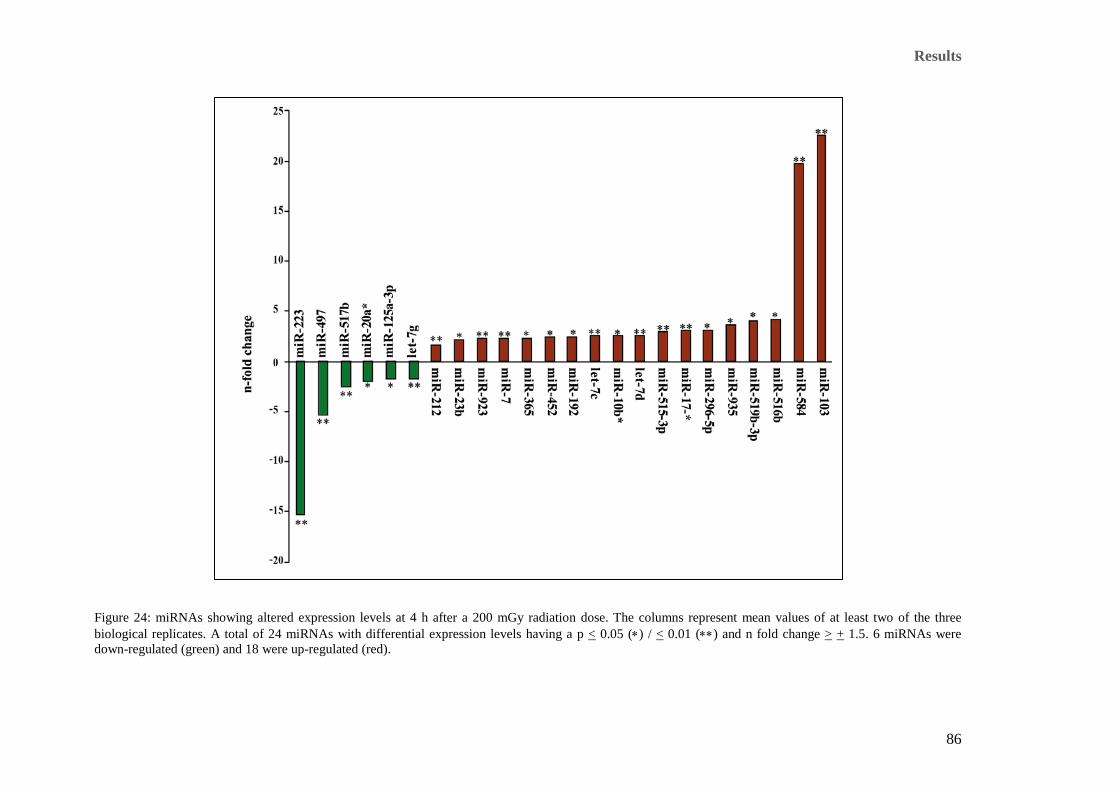
Results
86
Figure 24: miRNAs showing altered expression levels at 4 h after a 200 mGy radiation dose. The columns represent mean values of at least two of the three biological replicates. A total of 24 miRNAs with differential expression levels having a p < 0.05 (∗) / < 0.01 (∗∗) and n fold change > + 1.5. 6 miRNAs were down-regulated (green) and 18 were up-regulated (red).

Results
87
Figure 25: All deregulated miRNAs 24 hours after a 200 mGy radiation dose. The columns represent mean values of at least two of the three biological replicates. Of the 15 deregulated miRNA 9 were up-regulated (red) and 6 down-regulated (green) with a significance of p < 0.05 (*) / < 0.01 ( **) and a fold change > + 1.5.
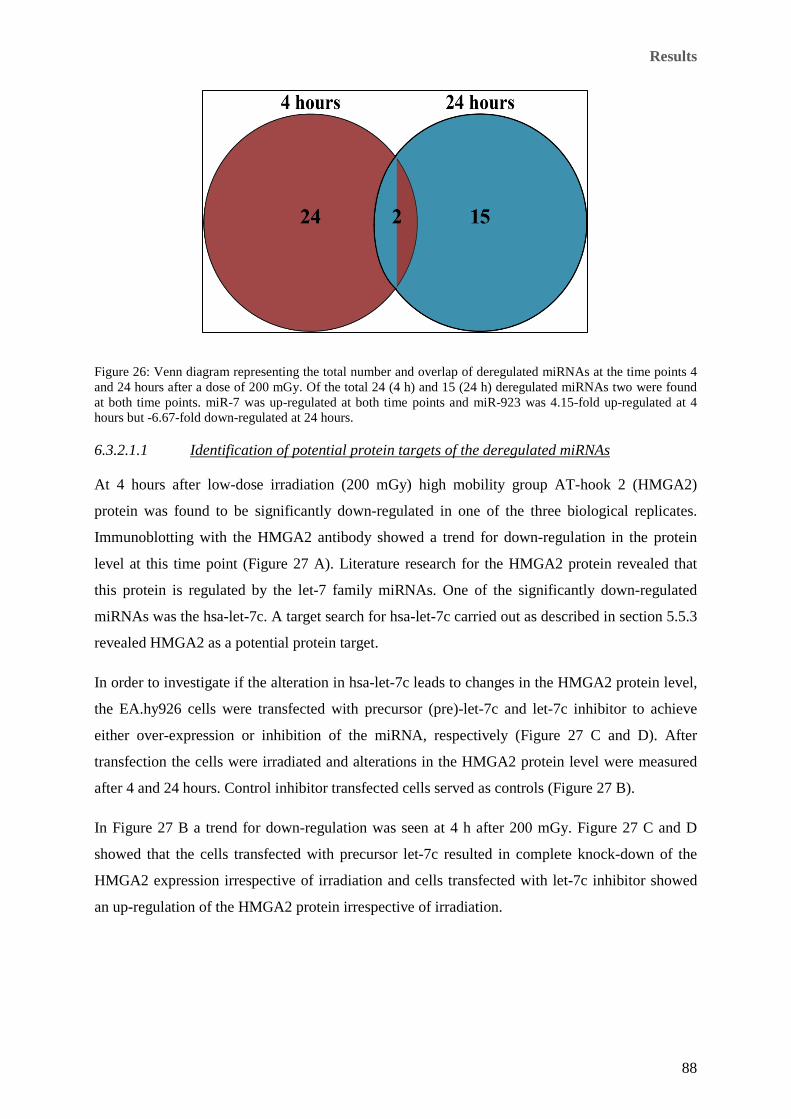
Results
88
Figure 26: Venn diagram representing the total number and overlap of deregulated miRNAs at the time points 4 and 24 hours after a dose of 200 mGy. Of the total 24 (4 h) and 15 (24 h) deregulated miRNAs two were found at both time points. miR-7 was up-regulated at both time points and miR-923 was 4.15-fold up-regulated at 4 hours but -6.67-fold down-regulated at 24 hours.
6.3.2.1.1 Identification of potential protein targets of the deregulated miRNAs
At 4 hours after low-dose irradiation (200 mGy) high mobility group AT-hook 2 (HMGA2)
protein was found to be significantly down-regulated in one of the three biological replicates.
Immunoblotting with the HMGA2 antibody showed a trend for down-regulation in the protein
level at this time point (Figure 27 A). Literature research for the HMGA2 protein revealed that
this protein is regulated by the let-7 family miRNAs. One of the significantly down-regulated
miRNAs was the hsa-let-7c. A target search for hsa-let-7c carried out as described in section 5.5.3
revealed HMGA2 as a potential protein target.
In order to investigate if the alteration in hsa-let-7c leads to changes in the HMGA2 protein level,
the EA.hy926 cells were transfected with precursor (pre)-let-7c and let-7c inhibitor to achieve
either over-expression or inhibition of the miRNA, respectively (Figure 27 C and D). After
transfection the cells were irradiated and alterations in the HMGA2 protein level were measured
after 4 and 24 hours. Control inhibitor transfected cells served as controls (Figure 27 B).
In Figure 27 B a trend for down-regulation was seen at 4 h after 200 mGy. Figure 27 C and D
showed that the cells transfected with precursor let-7c resulted in complete knock-down of the
HMGA2 expression irrespective of irradiation and cells transfected with let-7c inhibitor showed
an up-regulation of the HMGA2 protein irrespective of irradiation.

Results
89
Figure 27: Alterations in the HMGA2 protein level as a function of mir-let-7c expression. Immunoblot analysis using the HMGA2 antibody in cells exposed to 0 Gy or 200 mGy, 1 and 4 hours after irradiation. A. Non-transfected cells showed a slight down-regulation of the HMGA 2 expression 1and4 hours after irradiation. B. Immunoblot analysis of control inhibitor transfected cells exposed 0 Gy or 200 mGy 1 h or 4 hours post-irradiation. A trend for down-regulation is seen at 4 h after 200 mGy. C. Cells transfected with precursor let-7c resulted in complete knock-down of the HMGA2 expression irrespective of irradiation. D. Cells transfected with let-7c inhibitor showed an up-regulation of the HMGA2 protein irrespective of irradiation.
Note: The un-transfected (A) and the transfected (C) were loaded on the same gel, similarly the scrambled B, and the transfected let-7c inhibitor (D) were loaded on the same gel.
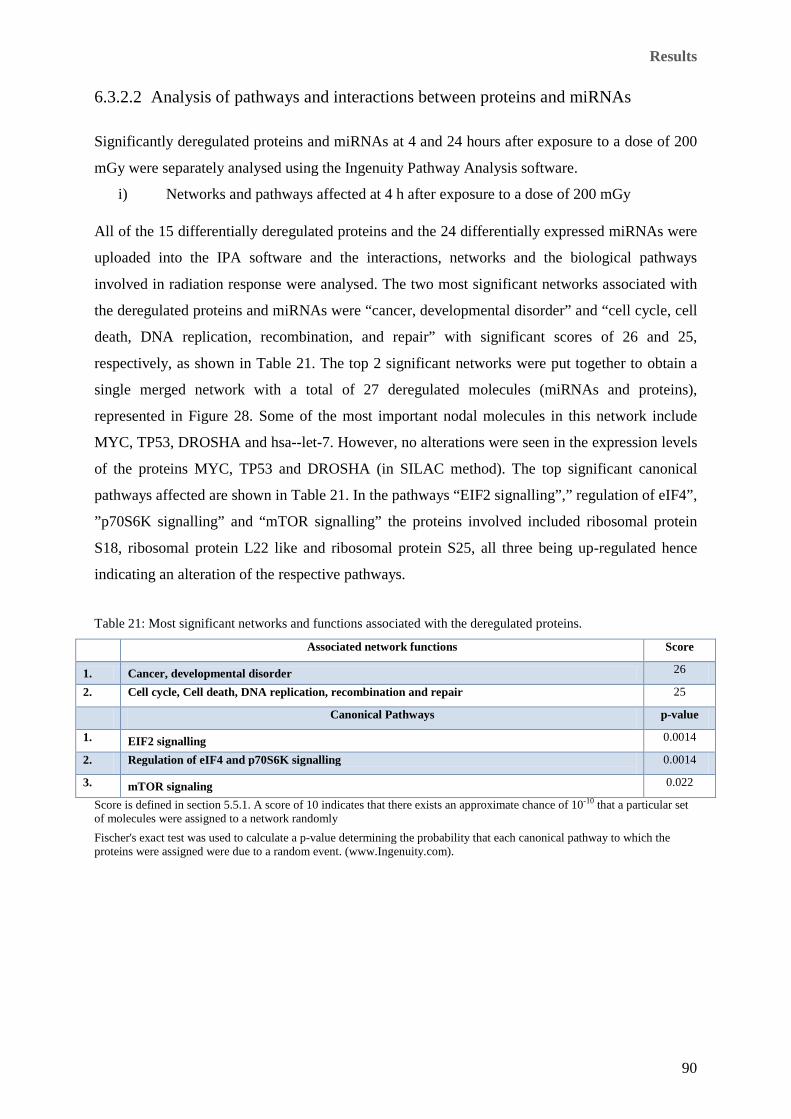
Results
90
6.3.2.2 Analysis of pathways and interactions between proteins and miRNAs
Significantly deregulated proteins and miRNAs at 4 and 24 hours after exposure to a dose of 200
mGy were separately analysed using the Ingenuity Pathway Analysis software.
i) Networks and pathways affected at 4 h after exposure to a dose of 200 mGy
All of the 15 differentially deregulated proteins and the 24 differentially expressed miRNAs were
uploaded into the IPA software and the interactions, networks and the biological pathways
involved in radiation response were analysed. The two most significant networks associated with
the deregulated proteins and miRNAs were “cancer, developmental disorder” and “cell cycle, cell
death, DNA replication, recombination, and repair” with significant scores of 26 and 25,
respectively, as shown in Table 21. The top 2 significant networks were put together to obtain a
single merged network with a total of 27 deregulated molecules (miRNAs and proteins),
represented in Figure 28. Some of the most important nodal molecules in this network include
MYC, TP53, DROSHA and hsa--let-7. However, no alterations were seen in the expression levels
of the proteins MYC, TP53 and DROSHA (in SILAC method). The top significant canonical
pathways affected are shown in Table 21. In the pathways “EIF2 signalling”,” regulation of eIF4”,
”p70S6K signalling” and “mTOR signalling” the proteins involved included ribosomal protein
S18, ribosomal protein L22 like and ribosomal protein S25, all three being up-regulated hence
indicating an alteration of the respective pathways.
Table 21: Most significant networks and functions associated with the deregulated proteins.
Associated network functions Score
1. Cancer, developmental disorder 26
2. Cell cycle, Cell death, DNA replication, recombination and repair 25
Canonical Pathways p-value
1. EIF2 signalling 0.0014
2. Regulation of eIF4 and p70S6K signalling
0.0014
3. mTOR signaling 0.022
Score is defined in section 5.5.1. A score of 10 indicates that there exists an approximate chance of 10-10 that a particular set of molecules were assigned to a network randomly Fischer's exact test was used to calculate a p-value determining the probability that each canonical pathway to which the proteins were assigned were due to a random event. (www.Ingenuity.com).

Results
91
ii) Networks and pathways affected at 24 h after exposure to a dose of 200 mGy
Four deregulated proteins and 15 differentially expressed miRNAs were analysed by the IPA
software to understand the interactions, networks and the biological pathways involved in
radiation response. The networks associated with the deregulated proteins and miRNAs were
“cancer, cell death, necrosis” and “cancer, hematological disease” with significant scores of 25
and 11, respectively, as shown in Table 22. The two most significant networks are shown in
Figure 29. The important nodal molecules in these networks included TNF, MYC, BCL6, EGFR,
tretinoin and CDK6 which play an important role in differentiation, apoptosis, growth,
proliferation, cell death, cell cycle progression, G1 phase and morphology. Table 22 represents
the most significant canonical pathways affected, namely the “regulation of eIF4 and p70S6K
signalling”, “EIF2 signalling” and “mTOR signalling”. Ribosomal proteins S11 and S13 were
found to be up-regulated indicating an up-regulation of the above mentioned three pathways.
Table 22: Most significant networks and functions associated with the differentially expressed proteins 24 hours after a radiation dose of 200 mGy.
Associated network functions Score
1. Cancer, cell death, Necrosis 25 2. Cancer, hematological disease 11 Canonical Pathways p-value 1. Regulation of eIF4 and p70S6K signaling 0.0067 2. EIF2 signalling
0.0010
3. mTOR signaling 0.010 Score is defined in section 5.5.1. A score of 10 indicates that there exists an approximate chance of 10-10 that a particular set of molecules were assigned to a network randomly Fischer's exact test was used to calculate a p-value determining the probability that each canonical pathway to which the proteins were assigned were due to a random event (www.Ingenuity.com).
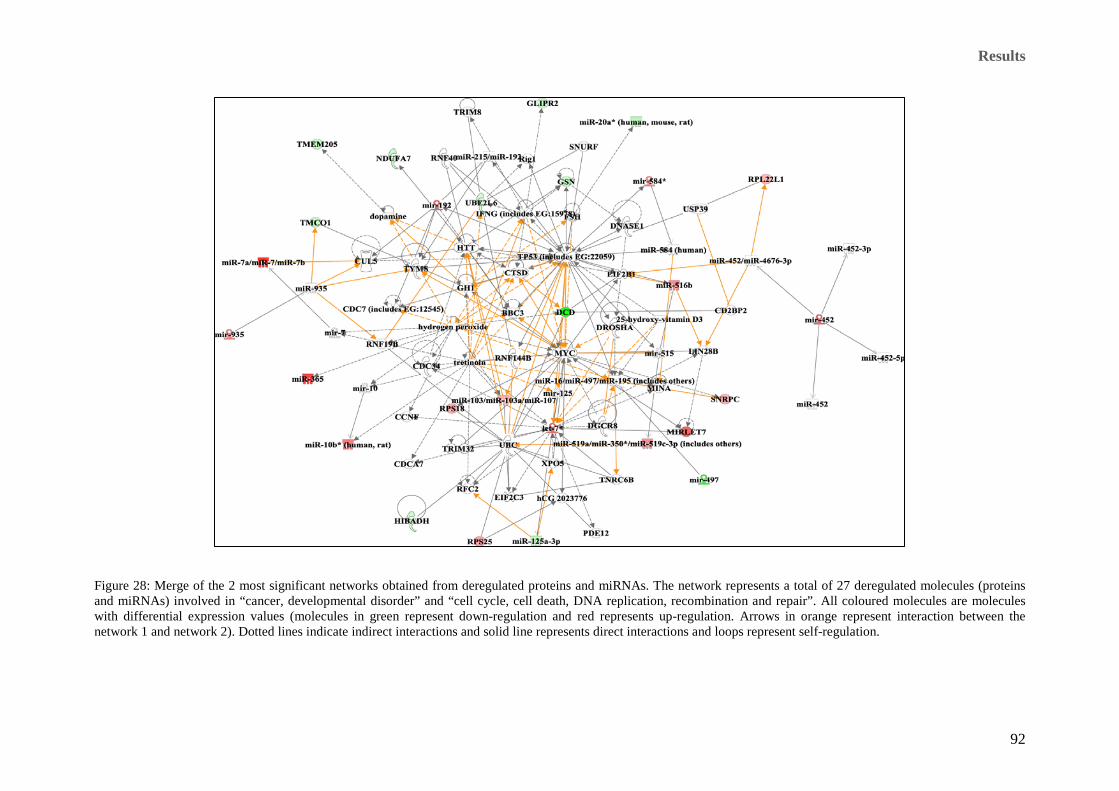
Results
92
Figure 28: Merge of the 2 most significant networks obtained from deregulated proteins and miRNAs. The network represents a total of 27 deregulated molecules (proteins and miRNAs) involved in “cancer, developmental disorder” and “cell cycle, cell death, DNA replication, recombination and repair”. All coloured molecules are molecules with differential expression values (molecules in green represent down-regulation and red represents up-regulation. Arrows in orange represent interaction between the network 1 and network 2). Dotted lines indicate indirect interactions and solid line represents direct interactions and loops represent self-regulation.
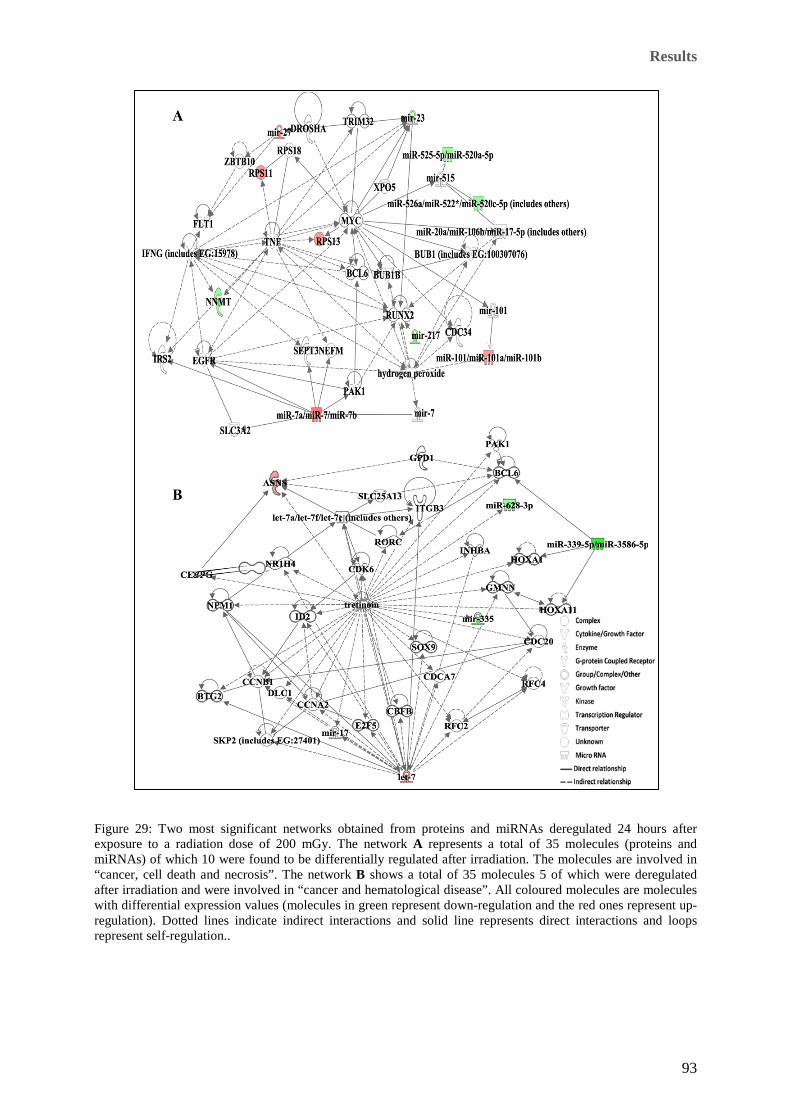
Results
93
Figure 29: Two most significant networks obtained from proteins and miRNAs deregulated 24 hours after exposure to a radiation dose of 200 mGy. The network A represents a total of 35 molecules (proteins and miRNAs) of which 10 were found to be differentially regulated after irradiation. The molecules are involved in “cancer, cell death and necrosis”. The network B shows a total of 35 molecules 5 of which were deregulated after irradiation and were involved in “cancer and hematological disease”. All coloured molecules are molecules with differential expression values (molecules in green represent down-regulation and the red ones represent up-regulation). Dotted lines indicate indirect interactions and solid line represents direct interactions and loops represent self-regulation..
Results
94
6.4. Validation of proteomic and bioinformatic analysis by immunoblotting
From the deregulated proteins obtained at 4 h and 24 h after exposure to a dose of 2.5 Gy, 4
proteins showing significant deregulation (SILAC / 2D-DIGE) of + 2 fold change were chosen for
immunoblotting: HSP90 from the 4 hour time point and NDUFC2, cofilin, and desmoplakin from
the 24 hour time point. Nodal proteins NFκB and Erk 1 / 2 were not identified by SILAC and 2D-
DIGE, but were identified as key participants in the bioinformatic analysis. Therefore the 2
subunits of NFκB (p50, p105) and phosphorylated forms of Erk 1 / 2 proteins were also quantified
by immunoblotting at 4 and 24 h after 2.5 Gy irradiation. To estimate the changes if any in the
phosphorylated form of Erk 1 / 2, the phosphorylated forms were compared with total Erk 1 / 2.
No change was observed in either of the NFκB proteins or the Erk 1 / 2 forms. NDUFC2 showed
a significant up-regulation and desmoplakin showed a trend to same deregulation as in proteomics
studies but this did not reach significance. The expression values of these proteins are represented
in Figure 30 and Table 23. Since there was a deregulation of some of the OXPHOS proteins (24 h
after irradiation) immunoblot analysis of the five OXPHOS complexes was conducted as
described in Materials and Methods. The immunoblotting confirmed a significant down-
regulation of four proteins representing complexes I, III IV, and V of the oxidative
phosphorylation Figure 31.
No significant alterations could be validated with the immunoblot technique for the deregulated
proteins of the 200 mGy dose. This was due to the small number of deregulated proteins and less
pronounced fold changes observed in comparison to that of the alterations found after exposure to
2.5 Gy.
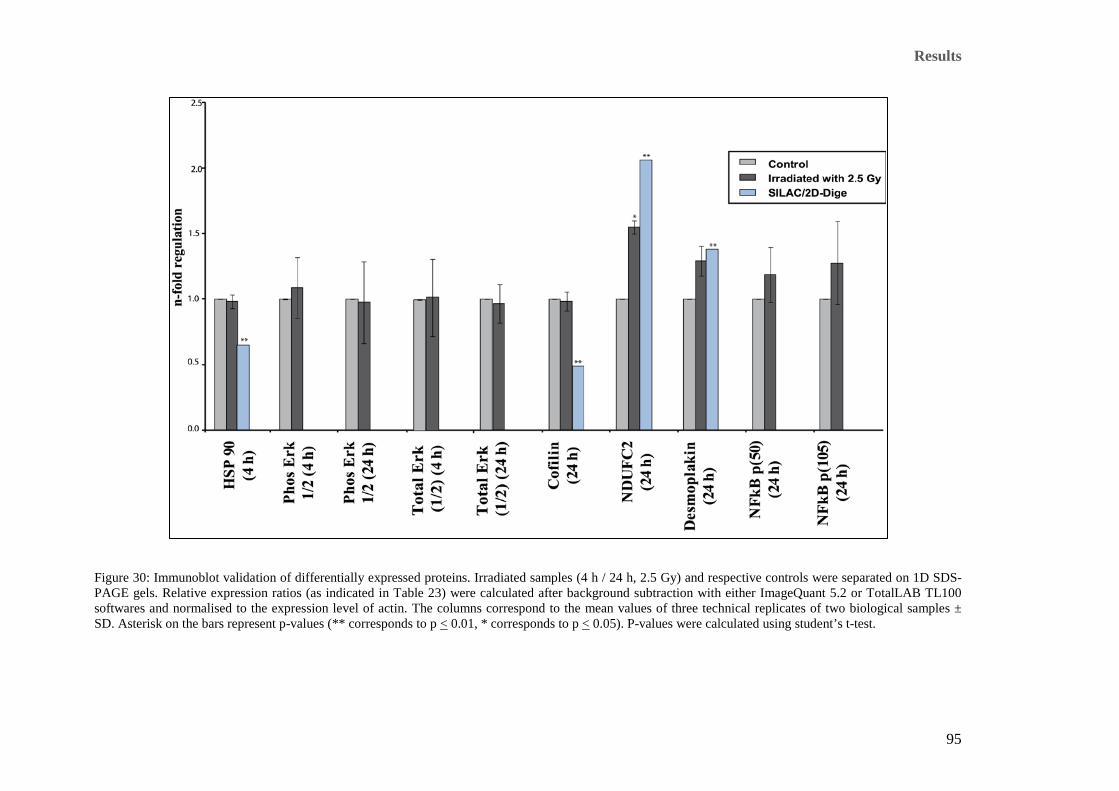
Results
95
Figure 30: Immunoblot validation of differentially expressed proteins. Irradiated samples (4 h / 24 h, 2.5 Gy) and respective controls were separated on 1D SDS-PAGE gels. Relative expression ratios (as indicated in Table 23) were calculated after background subtraction with either ImageQuant 5.2 or TotalLAB TL100 softwares and normalised to the expression level of actin. The columns correspond to the mean values of three technical replicates of two biological samples ± SD. Asterisk on the bars represent p-values (** corresponds to p < 0.01, * corresponds to p < 0.05). P-values were calculated using student’s t-test.

Results
96
Table 23: The relative expression ratios of proteins chosen by immunoblotting
Proteins Fold change (2.5 Gy vs. Control)
Time after Irradiation
p-value
HSP 90 0.98 4 h 0.61
Phospho Erk1 / 2 ; total Erk1 / 2
1.08; 1.022 4 h 0.39
Cofilin 0.98 24 h 0.66
Phospho Erk1 / 2 ; total Erk1 / 2
0.97; 0.962 24 h 0.82
NDUFC2 1.54* 24 h 0.02
Desmoplakin 1.29 24 h 0.06
NFkB (p50) 1.18 24 h 0.38
NFkB (p105) 1.27 24 h 0.16
* = p < 0.05.
P-values were calculated using student’s t-test.

Results
97
Figure 31: Immunoblot analysis of 5 OXPHOS subunits (24 h after irradiation). Analysis using total OXPHOS rodent antibody cocktail revealed a significant
down-regulation of four subunits NDUFB8 (C-I-20), C-III-core2, C-IV-I and C-V-α. 30µg of total cell lysate was loaded in each lane of a 12 % gel (* corresponds
to p < 0.05). A: relative expression change between controls and treated cells. B: Representative images of the blots. C: Fold differences between control and
treated samples normalised to tubulin are indicated in the form of a table; “C” represents control and “T” represents treated samples. P-values were calculated
using student’s t-test.

Discussion
98
7. Discussion
Ionising radiation has a number of medical and non-medical applications. In medicine ionising
radiation is used in the diagnostic and therapeutic fields. For diagnostic purposes relatively low
doses (< 200 mGy) of ionising radiation are applied as opposed to radiotherapy deployed in
cancer treatment. In these conventional radiotherapeutic procedures ionising radiation doses of
40-60 Gy are applied in multiple smaller fractions (doses of approximately 2-3 Gy / day). The
main purpose of the fractionation is to temporally and spatially separate the individual radiation
fields to reduce damage to the normal tissue surrounding the tumour. Tumour hypoxia, a
condition in which tumour cells are deprived of blood supply and hence oxygen, leads to therapy
resistance (Vaupel, 2008, Vaupel and Mayer, 2007). A further benefit of fractionation is the re-
oxygenation of hypoxic tumour cells deep within the tumours, as each fraction of the radiation
exposure destroys a number of normoxic cells, leading to reoxygenation and hence
radiosensitisation. During therapeutic procedures tissues are damaged (Muriel, 2002), in order to
optimise the therapeutic and diagnostic protocols there is an increasing need to understand the
response of cells to low (< 200 mGy) and clinically relevant doses (< 2.5 Gy) of ionising
radiation.
Despite the preventive measures designed to protect normal cells, some cell types may still be
damaged. In particular the vascular endothelial cells are very sensitive to ionising radiation.
Exposing these endothelial cells to radiation have been shown to cause endothelial
dysfunctioning, a condition where in an imbalance in the vasodilatory and vasoconstricting
products of the endothelium are observed (Kazakov et al., 1992). Endothelial cells are important
components of the blood vessels (as described in section 3). They play a crucial role in
maintaining the function of the cardiovascular system by producing several substances (described
in section 3). Hence the aim of this study was to perform a detailed assessment of the response of
endothelial cells to high (2.5 Gy) and low doses (200 mGy) of ionising radiation. To understand
the molecular mechanisms of the endothelial cells in response to ionising radiation, alterations in
the proteome and miRNA expression levels of the endothelial cell line EA.hy926 were studied.
Proteomic alterations in cells and tissues after exposure to ionising radiation have previously been
studied using classical techniques such as 2D-DIGE. The 2D-DIGE technology is a gel-based
analysis which enables detection of proteins as well as of protein isoforms, fragments and
modifications. Even though the 2D-DIGE technique is a well-established technique, it has some
limitations, namely the poor resolution of proteins with a hydrophobic character or with very high
or low molecular weights (Brewis and Brennan, 2010). The SILAC is a straightforward method

Discussion
99
used for differential quantification of two proteomes (Ivanov et al., 1993). In the present study, in
order to obtain a broad perspective of the protein alterations of the human endothelial cell line
EA.hy926, both the SILAC and the 2D-DIGE methods were used.
7.1. Establishment of the in vitro SILAC technique for the EA.hy926 cells
for use with irradiation
The SILAC technique was first established in 2002 by Ong et al (Ong et al., 2002). Over the years
SILAC has become one of the most adaptable methods for both in vivo and in vitro mass
spectrometry based proteomic studies. A major hall mark in the stable isotope labelling was the
production of SILAC mice (Krüger et al., 2008). Mice were completely isotopically labelled by
developing SILAC diet (Krüger et al., 2008) and these SILAC mice have been successfully used
for several in vivo studies (Huang et al., 2012, McGeer and McGeer, 2010, Zanivan et al., 2012).
SILAC has been further used for a number of in vitro comparative studies as it offers accurate and
global proteome quantification (Swa et al., 2012, Gokhale et al., 2012). Recently SILAC has been
used in vitro to understand the biochemical aspects of diseases, for example in the cells of breast
cancer and lymphomas (Deeb et al., 2012, Geiger et al., 2012). Labelling of various B-cell
lymphomas sub-types by Deeb et al. (Deeb et al., 2012) resulted in extraction of 55 signature
proteins that segregated the sub-types. Geiger et al. (Geiger et al., 2012) carried out quantitative
proteomic studies on the breast cancer cells and quantified 7800 proteins. They showed alterations
in adhesive proteins and metabolic proteins (Geiger et al., 2012). SILAC has been used in
combination with transcriptomics (Drexler et al., 2011), metabolomics and gene expression
profiling (Huang et al., 2012) to understand the complete biological process.
The present study is one of the first studies combining SILAC with ionising radition used to study
the effect of ionising radiation on the proteome. The in vitro labelling for proteomic analysis is
described in detail in section 5.1.2 and 5.3.1. Essential amino acids that cannot be synthesised by
cells must normally be supplied in the form of amino acid tissue culture supplements. Natural, as
well as isotopically labelled, analogues of these essential amino acids are commercially available.
The SILAC technique makes use of these amino acids to label the cells. Usage of the essential
amino acids to label the cells ensures that only the added isotopically labelled amino acids are
taken up by the cells as they cannot be produced in the cells (Ivanov et al., 1993). The cell
populations supplemented with amino acids containing either natural isotopes or the isotopically
labelled analogues are expected to behave exactly the same. In this study the EA.hy926 cells were
labelled with arginine and lysine amino acids because they serve as cleavage sites for trypsin,
which is used for digestion of peptides before mass spectrometry. Since this is the first time that
the

Discussion
100
EA.hy926 cells were SILAC labelled it was important to know if the cells were completely
labelled and if the isotopical label caused any unexpected phenotypic alterations. The cells were
checked for completeness of labelling by mass spectrometry by comparing the two populations,
one containing the natural isotope and the other isotopically labelled amino acids, without
irradiation. Once the cells were confirmed to be completely labelled by mass spectrometry, they
were used for further irradiation experiments. The experiments were designed in such a way that
in the first biological replicate cells containing natural isotopes served as the control samples and
their isotopically labelled analogues (biological replicate) were irradiated. In the second biological
replicate the cells containing the natural isotope were irradiated and their labelled isotopic
analogues served as non-irradiated controls (called reverse labelled or swapped replicate). For the
proteins to be significantly quantified as deregulated, the following 4 criterions were considered:
the minimum number of peptides to be identified had to be > 2, the variability between the
identified peptides < 50 %, the p-value < to 0.01, and the fold change of + 1.3. The biological
significance of the cut off of + 1.3 fold change has been shown by Blagoev et al (Blagoev et al.,
2003). The correlation between the two biological replicates was very high confirming that the
reverse labelling (swapping) had no effect.
A major constraint was encountered during estimation of the protein concentration in the lysate.
After the cells were labelled and harvested, in order to lyse the cells a 4 % urea buffer was used
(as described in section 5.3.1) as the urea buffer enabled complete lysis of the EA.hy926 cells.
The 4 % urea buffer was not compatible with the Bradford buffer, used in the estimation of
protein concentration by Bradford technique (described in section 5.3). To overcome the same the
lysate was precipitated with ice cold acetone overnight. Even though this precipitation enabled
removal of some of the urea and precipitate most of the proteins, the precipitant still contained a
huge amount of urea. Therefore the cells were precipitated with the 2D-DIGE-Clean-up-kit
(Roche molecular diagnostics) which allowed removal of most of the urea and concentrated the
proteins.
7.2. Endothelial cellular growth in response to irradiation
Several studies have shown that ionising radiation significantly affects the growth and
proliferation of the endothelial cells. Abdollahi et al. have shown that endothelial cells exhibit
alterations in the cell survival, proliferation and clonogenesis following exposure to ionising
radiation (Abdollahi et al., 2003). Further, Kraemer et al. (Kraemer et al., 2011) showed a
significant increase in apoptosis 48 hours after an acute radiation dose of 2.5 Gy in the EA.hy926
cell line. They were also able to show an increase in the caspase 3 activity 24 h after irradiation.

Discussion
101
Chronic low dose exposure of primary human umbilical vein endothelial cells (HUVECs) is
known to cause the loss of replicative capacity at a cumulative dose of 4 Gy. This is accompanied
by increased expression of the senescence marker senescence-associated beta-galactosidase
(Yentrapalli personal communication).
In the present study the EA.hy926 cells showed a significant alteration in the growth rate after
acute exposure to a dose of 2.5 Gy, resulting in the inhibition of growth of the endothelial cells
starting at ~75 hours after irradiation. On the other hand, the exposure of the EA.hy926 cells to a
relatively low acute dose of 200 mGy resulted in no significant change in the growth rate. This
dose dependency is in accordance with the study by Kantak et al (Kantak et al., 1993). Kantak et
al. showed that doses lower than or equal to 1 Gy had no effect on either the clonogenic or
proliferative ability of the pulmonary microvascular endothelial cells (PMEC).
A prominent influence on the growth rate was observed starting at a dose of 1 Gy (as shown in
section 6.1.1) whereas doses below 1 Gy did not show any significant effect. Taken together, the
cellular survival and proliferation indicate that high-dose radiation leads to a death in the
EA.hy926 cells. The data also indicate that there is a dose, below which no detectable change in
the growth rate of the EA.hy926 can be observed.
7.3. Response of the endothelial cell line EA.hy926 to irradiation
7.3.1 High Dose-exposure at 2.5 Gy
Substantial alterations in the expression levels of number proteins were observed. SILAC was
able to detect 31 and 125 deregulated proteins at 4 and 24 h respectively after irradiation. The 2D-
DIGE detected 27 and 18 differentially expressed proteins at the same 4h and 24 h time points
respectively. Deregulated proteins had differential expression levels between +1.3 and +2 fold at
both time points and doses. As expected the SILAC method was more sensitive, as can be seen by
the number of deregulated proteins identified when compared to the 2D-DIGE method. This is
because the SILAC method allows the identification and quantification of global proteins,
whereas 2D-DIGE allows the detection of protein isoforms, protein fragments and modified
proteins. The anticipated complementarity between the two methods is evident from the nature of
the deregulated proteins identified by the SILAC and the 2D-DIGE techniques. As a result of the
differential detection modalities a large number of proteins were only identified as being regulated
by one method, thus increasing the total number of observed protein alterations. Nevertheless,
some proteins were found to be significantly deregulated by both SILAC and 2D-DIGE at 24 h as
shown in Table 25 and Figure 32. The direction and magnitude of these protein changes were
comparable using both methods.

Discussion
102
Interestingly a comparison of the sets of deregulated proteins between the two time points (4 h
and 24 h after irradiation) showed little overlap. Some proteins did show a similar but non-
significant trend for deregulation at the 4 h time point, which then became significant at the 24 h
time point, suggesting that the expression of these proteins was not a rapid but long time effect
(increased with time after irradiation). A Venn diagram representing the sets of deregulated
proteins identified by the SILAC and 2D-DIGE approach at both time points is shown in Figure
32. At 4 h there was no overlap of differentially expressed proteins between the two techniques.
Twenty-four hours after irradiation, 5 proteins were found to be significantly deregulated by both
SILAC and 2D-DIGE. These 5 proteins showed similar fold changes using both methods, as
shown in table 25. Further, no differentially expressed proteins were common to both the 4 h and
24 h time points. This indicated that the effect on protein expression changes was time-dependent.
Time-dependent effect was observed only in one protein, desmoplakin, which was down-
regulated at 4 h and later at 24 h became up-regulated.
Put together the deregulated proteins detected by both the methods, a significant deregulation of a
total of 58 and 136 proteins was observed at 4 h and 24 h, respectively. A larger number of
proteins were found to be deregulated at the 24-hour time point compared to that of the 4-hour
time point, suggesting that the radiation exposure has a relatively slow and prolonged effect on
the EA.hy926 cells.
Table 24: List of the deregulated proteins found using both 2D-DIGE and SILAC at 24 h after irradiation. Corresponding spot numbers for proteins found to be deregulated by 2D-DIGE are indicated in the table.
Proteins UnipProt Fold change SILAC
Fold change 2D-DIGE
Eukaryotic translation initiation factor 5A-1 (spot 3) P63241-2 -1.37** -1.53*
Inhibitor of nuclear factor kappa-B kinase-interacting protein (spot 10) Q70UQ0-1 1.43** 1.71**
Stathmin (spot 2) P16949 -1.43** -1.47**
Translationally-controlled tumor protein (spot 5) P13693 -1.52** -1.33**
Tumour protein D54 (spot 6) O43399 -1.25** -1.37**
For SILAC * = p ≤ 0.05, ** = p ≤ 0.01 (p = significance B calculated as described by Cox et al. (Cox and Mann, 2008))
For 2D-DIGE * = p < 0.05 ** = p < 0.01 p-value was obtained by two way ANOVA t-test, peptide false discovery rate and the protein false discovery rate were set to 1 %.

Discussion
103
Figure 32: Venn diagram representing deregulated proteins identified with 2D-DIGE and SILAC methods deregulated at 4 h and 24 h after irradiation. Five proteins were shared between the 2D-DIGE and SILAC methods all at 24 h after 2.5 Gy irradiation. No overlap was seen in the deregulated proteins between the two methods. One protein, desmoplakin was found to be differentially expressed at both 4 h (down-regulated) and 24 h (up-regulated) by 2D-DIGE method.
Functions and pathways in which the proteins found to be deregulated at 4 h and 24 h after
irradiation were involved
i) Four hour time point
The 58 proteins found to be deregulated 4 hours after irradiation could be classified into 16 major
groups (as shown in section 6.2.4). In this study, a down-regulation of three proteins involved in
DNA repair was found 4 hours after irradiation, namely the Ku protein complex Ku70 (-1.51) /
Ku80 (-1.68) and the PCNA (-1.66). Bioinformatic studies using Ingenuity pathway analysis
showed that the non-homologous end joining (NHEJ) DNA repair pathway was the most
important pathway affected (shown in section 6.2.5).
The Ku proteins play a very significant role in DNA damage repair by stimulating joining the
DNA end joining (Pukkala et al., 2006). Ionising radiation leads to the damage of DNA by
causing both single and double strand breaks (DSB) (Bogdanova et al., 2010). Since such DNA
damage may be lethal to the cells there is an immediate response to damage leading to the
induction of repair mechanisms (Jackson and Bartek, 2009). The two main repair mechanisms
adopted by mammalian cells are homologous recombination repair (HRR) and non-homologous
end joining mechanisms (NHEJ).

Discussion
104
In the NHEJ repair mechanism the DNA-dependent protein kinase (DNA-PK) is responsible for
sensing the DSB damage and forming the repair complex (Dobbs et al., 2010). The DNA-PK
possesses DNA end-binding capacity and contains two fractions, namely the DNA end-binding
Ku proteins and the DNA-PK catalytic subunit. The proper functioning of DNA-PK requires the
assembly of Ku proteins at DSB ends (Dobbs et al., 2010). The Ku proteins form a heterodimer
consisting the subunits Ku70 and the Ku80 (Gottlieb and Jackson, 1993). Ku-dependent DNA
repair requires the formation of Ku70-Ku80 heterodimer complex. Proliferating cell nuclear
antigen (PCNA) is also known to be involved in the DNA damage repair. Even though the role of
PCNA in base excision repair is established in detail, its role in NHEJ is not fully understood.
Only a few studies give evidence for the mechanism behind the involvement of PCNA in NHEJ.
Balajee et al. (Balajee and Geard, 2001) showed that PCNA is involved in NHEJ and has a tight
interaction with the Ku-heterodimers.
Post-translational modification (ubiquitination) of both Ku70 and Ku80 decreases the non-
ubiquitinated form of Ku70 / Ku80 in favour of the ubiquitinated form (Sawada et al., 2003,
Gama et al., 2006). Down-regulation of the non-ubiquitinated Ku70 and Ku80, and up-regulation
of ubiquitinated Ku70 / 80 was observed by Gama et al. in the drug-induced apoptosis of human
umbilical vein endothelial cells (HUVECs). Further, the Ku proteins have been observed to be
decreased during cellular senescence in fibroblasts (Salminen et al., 1997). The Ku proteins have
also shown to increase the susceptibility to anticancer drug-induced apoptosis (Kim et al., 1999).
Previous study from our group has shown an increase in the apoptosis of the EA.hy926 cells at 48
h after irradiation with 2.5 Gy irradiation (Kraemer et al., 2011). The colony forming assay shows
a decrease in colony forming ability and increase cell death at a radiation dose of 2.5 Gy (shown
in section 6.1.2). This suggests that the EA.hy926 cells were already in apoptotic stress at 4 h after
irradiation and hence explains the decrease in the Ku-heterodimers.
From this it can be conclude that the down-regulation of the Ku-heterodimers could be due to
apoptotic stress. Several studies show that apoptosis of the endothelial cell in the vascular system
leads to cardiovascular diseases (CVD). As per a review by Stoneman et al. (Stoneman and
Bennett, 2004) the endothelial cells of the vascular system produce substances for the survival and
maintenance of other cell types of the vascular system such as the vascular smooth muscle cells.
They stated that increased apoptosis of the endothelial cells may eventually lead to apoptosis of
vascular smooth muscle cells as well. Abnormal levels of endothelial cell apoptosis has been
observed in disease progression of coronary atherosclerosis, myocardial infarction and ischemia-
reperfusion injury (Stoneman and Bennett, 2004). Therefore it can be speculated that ionising
radiation induces apoptotic stress in endothelial cells which could further lead to CVD.

Discussion
105
In addition to the changes in the expression levels of the proteins of the DNA repair, alterations in
the expression levels of HMG-CoA synthase (1.44) and acetyl-CoA-acetyltransferase (ACAT 1)
(-1.39) were observed 4 hours after irradiation. These two enzymes are involved in fatty acid beta-
oxidation. In the mevalonate pathway ACAT 1 converts acetyl-CoA to acetoacetyl CoA whereas
HMG-CoA synthase catalyses the reaction in which 3-hydroxy-3-methylglutaryl-CoA (HMG-
CoA) is formed (Theisen et al., 2004). The HMG-CoA synthase that was found to be up-regulated
at the 4-hour time point was the cytosolic form of the enzyme. Such an up-regulation has also
been observed in CVD. (Chang et al., 2009, Netherland and Thewke, 2010). Inhibition of ACAT
has been suggested to increase atherogenesis process (Nissen et al., 2006). Ischemic hearts show
alterations in both fatty acid beta-oxidation and glycolysis (L.H. Opie, 1996). This shows that
alterations in the proteins of the fatty acid beta-oxidation in the endothelial cells due to ionising
radiation may lead to vascular diseases.
ii) Twenty Four hour time point
One hundred and thirty six (136) proteins found to be differentially expressed at 24 h were
classified into 20 groups (described in section 6.2.4), the oxidative phosphorylation, and
glycolytic pathway were the most important pathways affected (shown in section 6.2.5).
In this study with the SILAC method a differential regulation in the expression levels of proteins
of the oxidative phosphorylation pathway was found at 24 h after 2.5 Gy irradiation. A
deregulation in the Complex I subunits - NADH dehydrogenase (ubiquinone) 1- alpha (-1.41), and
two other isoforms, Complex II subunit - ATP synthase (-1.85), and Complex III subunit -
(ubiquinol) cytochrome c reductase (-1.66) was observed. Immunoblot analysis of the subunits
representing the five OXPHOS complexes NDUFB8 (C-I-20), Fes (C-II-30), C-III-core2, C-IV-I
and C-V-α showed a significant down-regulation of all the complexes except Complex II, this
showed a trend for down-regulation that did not reach the significance cut off. Down-regulation of
the mitochondrial complex subunits is suggested to lead to an impairment of the complex
assembly and subsequently to alterations in the OXPHOS pathway (Azimzadeh et al., 2011,
Barjaktarovic et al., 2011).
Ionising radiation causes damage to the mitochondria by inducing oxidative stress and leads to
alterations in the energy production. Mitochondria play an important role in the oxidative
metabolism. The most important function of the mitochondria is the production of energy in the
form of ATP from Krebs cycle and oxidative phosphorylation (Gibson, 2005). During production
of ATP, electrons from the Krebs cycle pass through the electron transport chain (ETC) and
release energy. This released energy is utilised to generate a proton gradient (Gibson, 2005).

Discussion
106
Oxidative phosphorylation (OXPHOS) is known to be one of the most radiation-responsive
pathways (Azimzadeh et al., 2011, Azimzadeh et al., 2012, Tsai et al., 2009).
In addition, during ischemia the Complex I and Complex III are known to result in the production
of reactive oxygen species (ROS) (Chen et al., 2003) which in its turn may damage the
mitochondria (Heather et al., 2010, Chen et al., 2003). In the present study, superoxide dismutase
[Cu-Zn] was found to be depleted (SILAC) at 24 hours after exposure. Srivastava et al.
(Srivastava et al., 2007) have shown that the depletion of [Cu-Zn] superoxide dismutase results in
oxidative stress in rat hearts.
Increased ROS in the cardiac endothelium leads to oxidation of low density lipoproteins (LDL),
accumulation of lipids into foam cells, growth of vascular wall intima layer and finally
atherosclerotic plaque expansion and rupture (Ross, 1999, Bugger et al., 2010, Falk and
Fernández-Ortiz, 1995). Hatoum et al. (Hatoum et al., 2006) showed that radiation-induced
oxidative stress, resulting from increased ROS production, leads to endothelial dysfunction, a
condition where in an imbalance in the vasodilatory and vasoconstricting products of the
endothelium are observed. In a mouse model Hatoum et al. (Hatoum et al., 2006) demonstrated
loss of vasodilatory capacity resulting from radiation-induced endothelial dysfunction.
Nishiki et al. (Nishiki et al., 1979) demonstrated a co-regulation between oxidative
phosphorylation and glycolytic flux i.e. the rate of oxidative phosphorylation affects the
glycolytic flux rate and vice versa. In our study an increase in the levels of 5 enzymes of the
glycolytic pathway namely, enolase, glyceraldehyde-3-phosphate dehydrogenase, fructose-
bisphosphate (aldolase), 6-phosphofructokinase and hexokinase was observed 24 hours after
irradiation by the SILAC method.
Glycolysis, a metabolic process converting glucose into pyruvate, includes ten sequential steps.
Radiation-induced increase was observed in the levels of enzymes corresponding to most of these
steps: hexokinase, fructose-bisphosphate aldolase, glyceraldehyde-3-phosphate dehydrogenase, 6-
phosphofructokinase, and enolase (section 6.4.1). This indicates a radiation-induced activation of
the glycolytic pathway. This is in accordance with previous data showing that other stressors also
result in an increased rate of glycolytic flux (Ralser et al., 2007, Grant, 2008). This phenomenon
has been associated with accelerated endothelial proliferation (Moreno-Sánchez et al., 2007)
which is a consequential reaction of endothelial cells exposed to and damaged by radiation
(Mothersill et al., 1992). It has been shown that hypertrophied hearts display increased rates of
glycolysis and overall glucose utilisation (Leong et al., 2003). In fact, an alteration in the level of
a single glycolytic enzyme may be sufficient in raising the risk for coronary heart disease (Leyva

Discussion
107
et al., 1998, Liu et al., 1996). This suggests that in the EA.hy926 cells there was an increase in the
activity of the glycolytic pathway at 24 h after exposure.
The expression levels of several proteins belonging to the Rho pathway were also affected by
radiation. These proteins included cofilin 1, myosin light chain 6, profilin 1, and RhoA. Rho
family proteins regulate a broad diversity of cellular functions including cytoskeletal organisation,
membrane trafficking, cytokinesis, cell proliferation, cell motility and transcriptional regulation.
Rho pathway (Kuzelova and Hrkal, 2008) has already been shown to be responsive to low-dose
radiation (200 mGy) (Pluder et al., 2011) and activation of Rho pathway functions as an effective
triggering factor for cardio vascular diseases (CVD) (Seasholtz and Brown, 2004, Monceau et al.,
2010).
Based on these observations a conclusion can be drawn that irradiation of endothelial cells with a
dose of 2.5 Gy can rapidly activate several damage response pathways. Most importantly, a
pronounced shift in the cellular energy metabolism including activation of the glycolytic pathway
and alteration of the mitochondrial OXPHOS balance was observed. An alteration in the proteins
of the DNA repair process was seen as early as 4 hours after irradiation. The activation of the
glycolysis pathway and alterations in the mitochondrial complexes occurred later (24 h). All these
alterations suggest that an immediate biological response occurs that is designed by the
endothelial cells to overcome the radiation-induced stress. This damage may later trigger the
dysfunctioning of the endothelium, resulting in a late vascular injury leading to cardio vascular
diseases (CVD).
7.3.2 Low Dose effects on the proteome after 200 mGy
After exposure to a dose of 200 mGy the total number of proteins found to be deregulated was
lower than that observed at the high dose. The extent of the expression changes of the deregulated
proteins were also subtle in comparison to those observed using the high dose, with the exception
of two proteins that showed more than 3-fold deregulation. In contrast to the high dose treatment,
the majority of the protein changes were found at the earliest time point (4 h) in comparison to
later time point (24h). This may reflect a dose- and time-dependent effect on protein expression,
i.e. lower doses of irradiation cause less alterations and the alterations that are seen due to
immediate stress response subside rapidly with time. Further, there was no overlap between the
high-dose and low-dose induced protein response, suggesting that the changes in protein
expression were dose-dependent. Similarly, there was no overlap between the deregulated
proteins at 4 h and 24 h using the low-dose exposure. However, some deregulated proteins at both
time points belonged to the same functional category, namely translational regulation.
Discussion
108
Three out of 15 and 2 out of 4 differentially regulated proteins at 4 and 24 hours respectively,
were ribosomal proteins. All of the differentially expressed ribosomal proteins at both time points
were up-regulated. At 4 h one large (RPL22) and two small ribosomal protein subunits (RPS18,
RPS25) were deregulated. Twenty-four hours after irradiation two small subunits (RPS11, RPS
13) were found to be up-regulated.
Rapid ribosomal assembly is necessary for an efficient translation (Stelzl et al., 2001). Hence, the
increased expression of ribosomal subunits by a low-dose ionising radiation may lead to an
enhanced translation. This is in accordance with a study showing an up-regulation of several
translational initiation and elongation factors in the primary cardiac-specific endothelial cells, on
exposure to a dose of 200 mGy (Barjaktarovic personal communication). Pluder et al. (Pluder et
al., 2011) showed that the irradiation of EA.hy926 cells also with a dose of 200 mGy (Co-60
gamma) led to an increased expression of the eukaryotic translation initiation factor 5A-1. On the
contrary, the results from the high-dose exposure shown in section (6.2) show that several
proteins involved in translational initiation and elongation are down-regulated, indicating that
high- vs. low-dose endothelial responses are distinct at the level of translational activation. Hence,
it can be speculated that a low-dose exposure of the EA.hy926 cells induces a stress response
which in its turn increases translation.
Gelsolin protein a regulator of actin, was down-regulated at both 4 h after 200 mGy irradiation.
Alterations in the expression level of gelsolin have been demonstrated in prostate epithelial cells
exposed to x-ray irradiation of 2 x 2 Gy (Prasad et al., 1997). Some of the main functions of
gelsolin include regulation of cell motility, apoptosis, and signalling events (Kwiatkowski, 1999).
This indicates that low-dose radiation causes alterations to the actin binding proteins. This is in
accordance with the observations at high-doses where additional proteins involved in actin
mechanics such as profilin, cofilin and transforming protein RhoA were all found to be down-
regulated after 24 hours.
The down-regulation of a mitochondrial complex 1 enzyme NADH dehydrogenase [ubiquinone] 1
alpha subcomplex subunit 7 was observed at 4 h after 200 mGy irradiation. Bearing in mind that
the high-dose radiation also induced a deregulation of some Complex I subunits (by SILAC),
namely the NADH dehydrogenase (ubiquinone) 1- alpha, alpha / beta and an unknown
subcomplex. The immune blot analysis showed a general decrease in Complex I amount. Hence,
the down-regulation of the NADH dehydrogenase [ubiquinone] 1 alpha subcomplex subunit 7 is
an indicative of the decrease in complex I after a low-dose irradiation. Alterations in the
OXPHOS proteins were seen at 4 hours after irradiation. This was a transient phenomenon which
disappeared within 24 hours.
Discussion
109
Pathways in which the proteins found to be deregulated were involved
At 4 h and 24 h after exposure to a radiation dose of 200 mGy the EIF 2 signalling, eIF 4
signalling, and mTOR signalling pathways were the most significantly affected pathways. All the
deregulated proteins in these pathways showed an increased expression level, indicating an
activation of these pathways. It has been shown that activation of the mTOR signalling pathway
in endothelial cells leads to an increased proliferation and angiogenesis (Rafiee et al., 2010).
Rafiee et al. also showed that the human intestinal microvascular endothelial cells (HIMEC)
activated mTOR signalling pathways to survive radiation-induced damage. This indicates that a
dose of 200 mGy increases the activity of proteins involved in the mTOR signalling as a pro-
survival mechanism.
Taken together, the proteomics data confer that the exposure of the endothelial cell line EA.hy926
to a radiation dose of 200 mGy causes only slight changes and the changes are mostly immediate,
observed only 4 hours after radiation. Persistent up-regulation was observed only in the proteins
of the translational processes at both 4 and 24 h after irradiation. From these observations it can
be inferred that the low dose exposure evokes a stress response rather than a damage response.
7.3.3 miRNA expression analysis
Alterations in the expression levels of miRNAs in response to various doses of ionising radiation
in cells and tissues, have been widely studied (Kraemer et al., 2011, Maes et al., 2008, Shin et al.,
2009, Simone et al., 2009, Wagner-Ecker et al., 2010, Weidhaas et al., 2007, Vincenti et al.,
2011). In this study miRNA expression level alterations were analysed in the EA.hy926 cell line 4
and 24 hours after a dose of 200 mGy (γ-irradiation). This dose was used since, in contrast to high
dose exposures, little is known about the low-dose effect on miRNA expression alterations. In
addition, it was important to investigate whether the low dose (200 mGy) exposure would cause
subtle alterations at the miRNA level similar to those seen in protein expression or whether there
would be a strong miRNA effect leading to a broad cellular response.
Twenty-four and 15 miRNAs showed altered expression at 4 h and 24 h, respectively, after a dose
of 200 mGy gamma irradiation (shown in section 6.3.2). At both time points the level of hsa-mir-
7 was up-regulated. The hsa-mir-923 showed a time-dependent effect that is it showed an up-
regulation at 4 h and down-regulation after 24 h after 200 mGy irradiation. No other miRNA was
regulated over the complete 24 h observation.
Discussion
110
A larger number of miRNAs were found to be differentially expressed at the 4-hour time point
when compared to that of the 24-hour time point. This is in agreement with the proteomics data
showing that 15 and 4 proteins were differentially regulated at 4h and 24 h, respectively at the 200
mGy dose used. Four hours after irradiation the number of up-regulated miRNAs was greater than
that of the down-regulated ones. At 24 hours, a majority of the differentially expressed miRNAs
were down-regulated. MiRNAs are negative regulators of gene expression, i.e. when a miRNA is
up-regulated the target gene is generally down-regulated (He and Hannon, 2004). Therefore,
based on the miRNA expression data, a radiation dose of 200 mGy would result in a general
down-regulation of proteins at 4 hours and, conversely, an enhancement of the amount of up-
regulated proteins at 24 hours. The bioinformatic analysis for target search did not reveal any
direct interaction between the deregulated miRNAs and differentially expressed proteins. Indeed,
the proteomics data from the SILAC analysis showed that, at 4 hours, the expression of most
proteins was down-regulated whereas at 24 h most proteins showed up-regulation.
Comparison of the miRNAs deregulated in the EA.hy926 cells after 200mGy irradiation with
other studies investigating radiation induced miRNA response
Several studies show the miRNA response of endothelial cells and cell lines to ionising radiation.
Kraemer et al. (Kraemer et al., 2011) showed expression alterations in 22 miRNAs each at 4 and
24 h in the endothelial cell line EA.hy926 after exposure to a radiation dose of 2.5 Gy. They also
showed expression alterations in 29 and 17 miRNAs at 4 h and 24 h respectively, in the human
umbilical vein cells (HUVECs). Vincenti et al. (Vincenti et al., 2011) showed that a total of 23
miRNAs were differentially expressed at in the HUVECs at 30 min and 1 h after exposure to
radiation dose of 1Gy.
A comparison between the miRNA expression level changes in the EA.hy926 and HUVECs after
exposure to a dose of 2.5 Gy by Kraemer et al. (Kraemer et al., 2011) with data obtained by
exposure of the EA.hy926 cells to a radiation dose of 200 mGy (present study :section) showed
the following. A down-regulation of the hsa-let-7d was observed in both EA.hy926 cells and
HUVECs at 4 h after 2.5 Gy irradiation. The low-dose exposure of the EA.hy926 cells in this
study resulted in the up-regulation of hsa-let-7d. In the EA.hy926 cells hsa-mir-23a and hsa-mir-
339-5p were down-regulated in the present study after 24 h after low-dose exposure, Kraemer et
al.(Kraemer et al., 2011) showed the same in both HUVECS and EA.hy926 cells at 4 h after high
dose exposure. Also in HUVECs the high-dose exposure resulted in down-regulation. The hsa-
mir-636 showed down-regulation in the EA.hy926 cells 24 hours after irradiation independently
of the dose but was up-regulated at 4 hours after a high-dose exposure in HUVECs. Hence the
miRNAs let-7d, 23a, 339-5p and 636 may be considered to be universal radiation-responsive
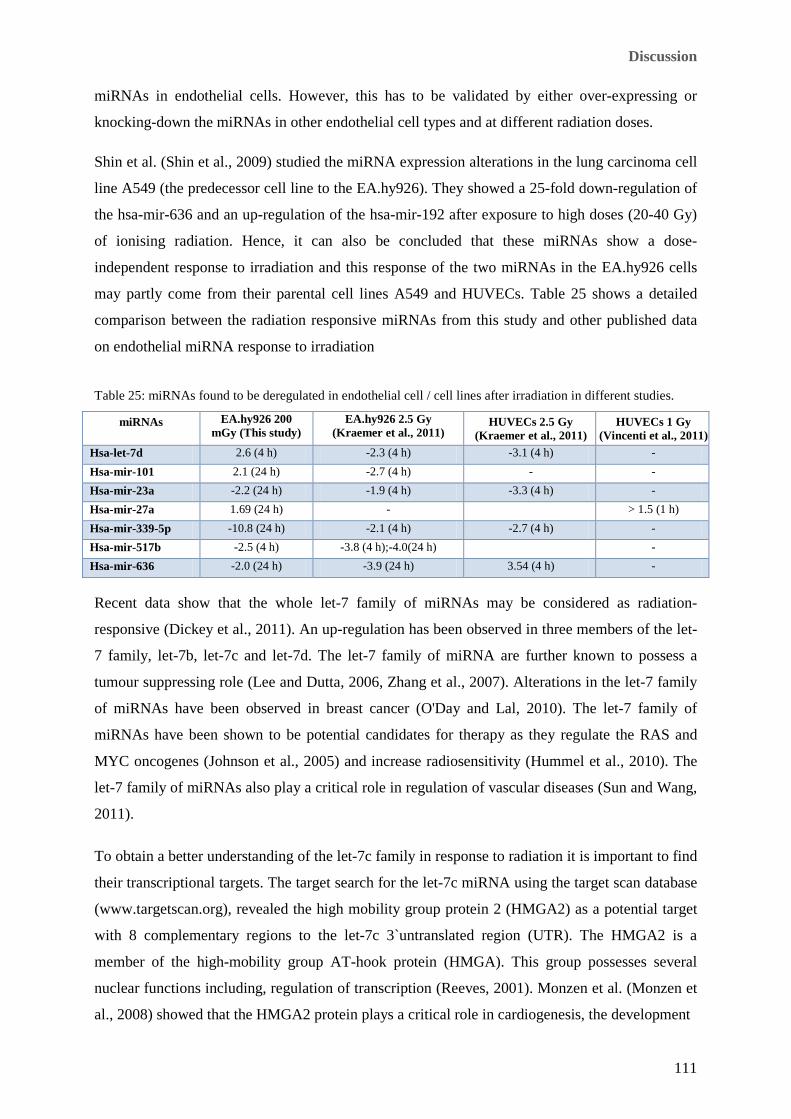
Discussion
111
miRNAs in endothelial cells. However, this has to be validated by either over-expressing or
knocking-down the miRNAs in other endothelial cell types and at different radiation doses.
Shin et al. (Shin et al., 2009) studied the miRNA expression alterations in the lung carcinoma cell
line A549 (the predecessor cell line to the EA.hy926). They showed a 25-fold down-regulation of
the hsa-mir-636 and an up-regulation of the hsa-mir-192 after exposure to high doses (20-40 Gy)
of ionising radiation. Hence, it can also be concluded that these miRNAs show a dose-
independent response to irradiation and this response of the two miRNAs in the EA.hy926 cells
may partly come from their parental cell lines A549 and HUVECs. Table 25 shows a detailed
comparison between the radiation responsive miRNAs from this study and other published data
on endothelial miRNA response to irradiation
Table 25: miRNAs found to be deregulated in endothelial cell / cell lines after irradiation in different studies.
miRNAs EA.hy926 200 mGy (This study)
EA.hy926 2.5 Gy (Kraemer et al., 2011)
HUVECs 2.5 Gy (Kraemer et al., 2011)
HUVECs 1 Gy (Vincenti et al., 2011)
Hsa-let-7d 2.6 (4 h) -2.3 (4 h) -3.1 (4 h) - Hsa-mir-101 2.1 (24 h) -2.7 (4 h) - - Hsa-mir-23a -2.2 (24 h) -1.9 (4 h) -3.3 (4 h) - Hsa-mir-27a 1.69 (24 h) - > 1.5 (1 h) Hsa-mir-339-5p -10.8 (24 h) -2.1 (4 h) -2.7 (4 h) - Hsa-mir-517b -2.5 (4 h) -3.8 (4 h);-4.0(24 h) - Hsa-mir-636 -2.0 (24 h) -3.9 (24 h) 3.54 (4 h) -
Recent data show that the whole let-7 family of miRNAs may be considered as radiation-
responsive (Dickey et al., 2011). An up-regulation has been observed in three members of the let-
7 family, let-7b, let-7c and let-7d. The let-7 family of miRNA are further known to possess a
tumour suppressing role (Lee and Dutta, 2006, Zhang et al., 2007). Alterations in the let-7 family
of miRNAs have been observed in breast cancer (O'Day and Lal, 2010). The let-7 family of
miRNAs have been shown to be potential candidates for therapy as they regulate the RAS and
MYC oncogenes (Johnson et al., 2005) and increase radiosensitivity (Hummel et al., 2010). The
let-7 family of miRNAs also play a critical role in regulation of vascular diseases (Sun and Wang,
2011).
To obtain a better understanding of the let-7c family in response to radiation it is important to find
their transcriptional targets. The target search for the let-7c miRNA using the target scan database
(www.targetscan.org), revealed the high mobility group protein 2 (HMGA2) as a potential target
with 8 complementary regions to the let-7c 3`untranslated region (UTR). The HMGA2 is a
member of the high-mobility group AT-hook protein (HMGA). This group possesses several
nuclear functions including, regulation of transcription (Reeves, 2001). Monzen et al. (Monzen et
al., 2008) showed that the HMGA2 protein plays a critical role in cardiogenesis, the development

Discussion
112
of the heart in the embryo. Alterations in the expression levels of the HMGA2 protein have been
associated with tumour metastasis, abnormal heart development, and diabetes mellitus (Morshedi
et al.).
In several studies it has been shown that the let-7 family regulates the expression of HMGA2
protein (Lee and Dutta, 2007), the hsa-let-7c is a negative regulator of the HMGA2 protein (Tzur
et al., 2009, Shell et al., 2007, Peng et al., 2008). In order to check if the hsa-let-7c had any effect
on the HMGA2 regulation and if this effect was further enhanced by radiation in the EA.hy926
cells, immunoblot analysis of all samples was performed for HMGA2 antibody (shown in section
6.3.2). The results clearly showed that the let-7c miRNA negatively regulated the expression of
HMGA2 protein, confirming that the HMGA2 protein is a target of the let-7c. Further no
significant effect of irradiation on the HMGA 2 protein level in normal cells or cells over-
expressing or under-expressing the hsa-let-7c miRNA was observed. This can be further be
explained by the following: For every miRNA there exists about 200 targets (Lewis et al., 2005,
Carthew, 2006, Krek et al., 2005) similarly the translational of a single product might be regulated
by more than one miRNA (Wu et al., 2010, Bueno et al., 2011). Thus it can be speculated that,
regulation of a particular protein is dependent on if it is regulated by just one or more than one
miRNA. From this we can conclude that even though the HMGA2 protein is a target of the let-7c,
there exist more miRNAs which regulate the HMGA2 protein.
7.3.4 Validation of proteomics data
Validation of the proteomic data was done with immunoblot analysis as described in section 5.3.3.
The validated proteins are shown in section 6.4. Since the immunoblot analysis is less sensitive
method for protein expression changes only proteins with a fold regulation of + 2 were chosen for
validation. Proteins of the OXPHOS pathway could be identified as significantly down-regulated
by immunoblotting at 24 h after 2.5 Gy irradiation this confirmed the deregulation of OXPHOS
proteins by SILAC. Immunoblot analysis allowed validation of the some of the proteins also
found to be deregulated by SILAC in at least two biological replicates. Some proteins showed a
trend for differential expression similar to that of either the SILAC but did not reach significance
cut off, due to less fold change expression. No directional discrepancy was observed in the
expression levels of proteins between SILAC and immunoblot analysis. This confirmed that
SILAC is a robust and accurate method for quantitative of proteins in large scale proteomic
studies.
This was one of the first studies where SILAC was combined with radiation. Therefore it was
important to exclude the possibility that radiation caused any alteration to the available pools of

Discussion
113
isotopically labelled amino acids that were incorporated into the cells, resulting in an artificial
alteration to the proteins. The validation of SILAC identified proteins with immunoblotting
confirmed that the effects seen for radiation was not due to the isotopically labelled amino acids
but due to protein abundance. The validation also confirmed that the alterations in the expression
levels of proteins were solely because of radiation exposure. From this it can be concluded that
the SILAC method can be successfully used for both in vitro and in vivo studies in combination of
radiation. Further combining SILAC, (quantitative proteomic) with other strategies like
transcriptomics, metabolomics to study the effects of ionising radiation, would give a broad
insight of the complex biological response of the cells to ionising radiation.
To summarise, in this study it has been shown that high dose (2.5 Gy) of ionising radiation had a
significant effect on the expression levels of large number of proteins in the endothelial cell line
EA.hy926. Comparatively the low dose (200 mGy) ionising radiation had mild effects on the
proteome of the cells. Prominent alterations were seen in the expression levels of miRNAs.
Further work has to be done to find the potential targets of the other radiation responsive miRNAs
and their effect on these targets have to be checked and validated. Even though all this data
indicate damage to the endothelial cell line EA.hy926, a lot of questions remain unanswered. The
questions that have to be answered yet are: if the effects seen in this endothelial cell line are the
same seen in primary endothelial cells? What happens in vivo?
Bibliography
114
8. Bibliography
ABDOLLAHI, A., LIPSON, K. E., HAN, X., KREMPIEN, R., TRINH, T., WEBER, K. J., HAHNFELDT, P., HLATKY, L., DEBUS, J., HOWLETT, A. R. & HUBER, P. E. 2003. SU5416 and SU6668 Attenuate the Angiogenic Effects of Radiation-induced Tumor Cell Growth Factor Production and Amplify the Direct Anti-endothelial Action of Radiation in Vitro. Cancer Research, 63, 3755-3763.
ADAMS, M. J., HARDENBERGH, P. H., CONSTINE, L. S. & LIPSHULTZ, S. E. 2003. Radiation-associated cardiovascular disease. Critical Reviews in Oncology/Hematology, 45, 55-75.
AMBROS, V. 2004. The functions of animal microRNAs. Nature, 431, 350-355. AZIMZADEH, O., BARJAKTAROVIC, Z., AUBELE, M., CALZADA-WACK, J., SARIOGLU, H., ATKINSON, M. J.
& TAPIO, S. 2010. Formalin-Fixed Paraffin-Embedded (FFPE) Proteome Analysis Using Gel-Free and Gel-Based Proteomics. Journal of Proteome Research, 9, 4710-4720.
AZIMZADEH, O., SCHERTHAN, H., SARIOGLU, H., BARJAKTAROVIC, Z., CONRAD, M., VOGT, A., CALZADA-WACK, J., NEFF, F., AUBELE, M., BUSKE, C., ATKINSON, M. J. & TAPIO, S. 2011. Rapid proteomic remodeling of cardiac tissue caused by total body ionizing radiation. Proteomics, n/a-n/a.
AZIMZADEH, O., SCHERTHAN, H., YENTRAPALLI, R., BARJAKTAROVIC, Z., UEFFING, M., CONRAD, M., NEFF, F., CALZADA-WACK, J., AUBELE, M., BUSKE, C., ATKINSON, M. J., HAUCK, S. M. & TAPIO, S. 2012. Label-free protein profiling of formalin-fixed paraffin-embedded (FFPE) heart tissue reveals immediate mitochondrial impairment after ionising radiation. J Proteomics, 75, 2384-95.
AZIZOVA, T. V., MUIRHEAD, C. R., DRUZHININA, M. B., GRIGORYEVA, E. S., VLASENKO, E. V., SUMINA, M. V., O'HAGAN, J. A., ZHANG, W., HAYLOCK, R. G. & HUNTER, N. 2010a. Cardiovascular diseases in the cohort of workers first employed at Mayak PA in 1948-1958. Radiat Res, 174, 155-68.
AZIZOVA, T. V., MUIRHEAD, C. R., DRUZHININA, M. B., GRIGORYEVA, E. S., VLASENKO, E. V., SUMINA, M. V., O'HAGAN, J. A., ZHANG, W., HAYLOCK, R. G. & HUNTER, N. 2010b. Cerebrovascular diseases in the cohort of workers first employed at Mayak PA in 1948-1958. Radiat Res, 174, 851-64.
BALAJEE, A. S. & GEARD, C. R. 2001. Chromatin-bound PCNA complex formation triggered by DNA damage occurs independent of the ATM gene product in human cells. Nucleic Acids Research, 29, 1341-1351.
BARJAKTAROVIC, Z., SCHMALTZ, D., SHYLA, A., AZIMZADEH, O., SCHULZ, S., HAAGEN, J., DÖRR, W., SARIOGLU, H., SCHÄFER, A., ATKINSON, M. J., ZISCHKA, H. & TAPIO, S. 2011. Radiation–Induced Signaling Results in Mitochondrial Impairment in Mouse Heart at 4 Weeks after Exposure to X-Rays. PLoS ONE, 6, e27811.
BAVERSTOCK, K., EGLOFF, B., PINCHERA, A., RUCHTI, C. & WILLIAMS, D. 1992. Thyroid cancer after Chernobyl. Nature, 359, 21-2.
BEEBE, G. W. 1982. Ionizing Radiation and Health: With the late-appearing effects of exposure to ionizing radiation now well identified, research focuses on the measurement of risk. American Scientist, 70, 35-44.
BLAGOEV, B., KRATCHMAROVA, I., ONG, S.-E., NIELSEN, M., FOSTER, L. J. & MANN, M. 2003. A proteomics strategy to elucidate functional protein-protein interactions applied to EGF signaling. Nat Biotech, 21, 315-318.
BOGDANOVA, N. V., ANTONENKOVA, N. N., ROGOV, Y. I., KARSTENS, J. H., HILLEMANNS, P. & DORK, T. 2010. High frequency and allele-specific differences of BRCA1 founder mutations in breast cancer and ovarian cancer patients from Belarus. Clin Genet, 78, 364-72.
BOLDT, K., MANS, D. A., WON, J., VAN REEUWIJK, J., VOGT, A., KINKL, N., LETTEBOER, S. J. F., HICKS, W. L., HURD, R. E., NAGGERT, J. K., TEXIER, Y., DEN HOLLANDER, A. I., KOENEKOOP, R. K.,

Bibliography
115
BENNETT, J., CREMERS, F. P. M., GLOECKNER, C. J., NISHINA, P. M., ROEPMAN, R. & UEFFING, M. 2011. Disruption of intraflagellar protein transport in photoreceptor cilia causes Leber congenital amaurosis in humans and mice. The Journal of Clinical Investigation, 121, 2169-2180.
BRADFORD, M. M. 1976. A rapid and sensitive method for the quantitation of microgram quantities of protein utilizing the principle of protein-dye binding. Anal Biochem, 72, 248-54.
BREWIS, I. A. & BRENNAN, P. 2010. Proteomics technologies for the global identification and quantification of proteins. Adv Protein Chem Struct Biol, 80, 1-44.
BUENO, M. J., GÓMEZ DE CEDRÓN, M., GÓMEZ-LÓPEZ, G., PÉREZ DE CASTRO, I., DI LISIO, L., MONTES-MORENO, S., MARTÍNEZ, N., GUERRERO, M., SÁNCHEZ-MARTÍNEZ, R., SANTOS, J., PISANO, D. G., PIRIS, M. A., FERNÁNDEZ-PIQUERAS, J. & MALUMBRES, M. 2011. Combinatorial effects of microRNAs to suppress the Myc oncogenic pathway. Blood, 117, 6255-6266.
BUGGER, H., SCHWARZER, M., CHEN, D., SCHREPPER, A., AMORIM, P. A., SCHOEPE, M., NGUYEN, T. D., MOHR, F. W., KHALIMONCHUK, O., WEIMER, B. C. & DOENST, T. 2010. Proteomic remodelling of mitochondrial oxidative pathways in pressure overload-induced heart failure. Cardiovascular Research, 85, 376-384.
CANDIANO, G., BRUSCHI, M., MUSANTE, L., SANTUCCI, L., GHIGGERI, G. M., CARNEMOLLA, B., ORECCHIA, P., ZARDI, L. & RIGHETTI, P. G. 2004. Blue silver: a very sensitive colloidal Coomassie G-250 staining for proteome analysis. ELECTROPHORESIS, 25, 1327-33.
CARNES, A. B., GROER, G. P. & KOTEK, J. T. 1997. Radium Dial Workers: Issues concerning Dose Response and Modeling. Radiation Research Society, 147, No. 6, 707-714
CARR, Z. A., LAND, C. E., KLEINERMAN, R. A., WEINSTOCK, R. W., STOVALL, M., GRIEM, M. L. & MABUCHI, K. 2005. Coronary heart disease after radiotherapy for peptic ulcer disease. Int J Radiat Oncol Biol Phys, 61, 842-50.
CARTHEW, R. W. 2006. Gene regulation by microRNAs. Current Opinion in Genetics & Development, 16, 203-208.
CHANG, T.-Y., LI, B.-L., CHANG, C. C. Y. & URANO, Y. 2009. Acyl-coenzyme A:cholesterol acyltransferases. American Journal of Physiology - Endocrinology And Metabolism, 297, E1-E9.
CHAPELIER, A., DESMADRIL, M. & HOUEE-LEVIN, C. 2001. Gamma radiation effects on alpha-lactalbumin: structural modifications. Can J Physiol Pharmacol, 79, 154-7.
CHAUDHRY, M. A. 2009. Real-time PCR analysis of micro-RNA expression in ionizing radiation-treated cells. Cancer Biother Radiopharm, 24, 49-56.
CHEN, Q., VAZQUEZ, E. J., MOGHADDAS, S., HOPPEL, C. L. & LESNEFSKY, E. J. 2003. Production of Reactive Oxygen Species by Mitochondria. Journal of Biological Chemistry, 278, 36027-36031.
CHEVALLET, M., LUCHE, S. & RABILLOUD, T. 2006. Silver staining of proteins in polyacrylamide gels. Nat. Protocols, 1, 1852-1858.
COX, J. & MANN, M. 2008. MaxQuant enables high peptide identification rates, individualized p.p.b.-range mass accuracies and proteome-wide protein quantification. Nat Biotechnol, 26, 1367-72.
COYLE, C. H. & KADER, K. N. 2007. Mechanisms of H2O2-induced oxidative stress in endothelial cells exposed to physiologic shear stress. ASAIO J, 53, 17-22.
DAHM-DAPHI, J. & DIKOMEY, E. 1994. Non-reparable DNA strand breaks and cell killing studied in CHO cells after X-irradiation at different passage numbers. Int J Radiat Biol, 66, 553-5.
DAHM-DAPHI, J., DIKOMEY, E. & PYTTLIK, C. 1994. Relationship between non-reparable DNA strand breaks and cell survival studied in X-irradiated CHO, CHO K1, xrs1 and xrs5 cells. Int J Radiat Biol, 65, 657-63.
DARBY, S. C., MCGALE, P., TAYLOR, C. W. & PETO, R. 2005. Long-term mortality from heart disease and lung cancer after radiotherapy for early breast cancer: prospective cohort study of about 300,000 women in US SEER cancer registries. Lancet Oncol, 6, 557-65.

Bibliography
116
DEEB, S. J., D'SOUZA, R. C. J., COX, J., SCHMIDT-SUPPRIAN, M. & MANN, M. 2012. Super-SILAC Allows Classification of Diffuse Large B-cell Lymphoma Subtypes by Their Protein Expression Profiles. Molecular & Cellular Proteomics, 11, 77-89.
DEMIRCI, S., NAM, J., HUBBS, J. L., NGUYEN, T. & MARKS, L. B. 2009. Radiation-Induced Cardiac Toxicity After Therapy for Breast Cancer: Interaction Between Treatment Era and Follow-Up Duration. International Journal of Radiation Oncology*Biology*Physics, 73, 980-987.
DICKEY, J., ZEMP, F., MARTIN, O. & KOVALCHUK, O. 2011. The role of miRNA in the direct and indirect effects of ionizing radiation. Radiation and Environmental Biophysics, 50, 491-499.
DOBBS, T. A., TAINER, J. A. & LEES-MILLER, S. P. 2010. A structural model for regulation of NHEJ by DNA-PKcs autophosphorylation. DNA Repair (Amst), 9, 1307-14.
DREXLER, H. C. A., RUHS, A., KONZER, A., MENDLER, L., BRUCKSKOTTEN, M., LOOSO, M., GÜNTHER, S., BOETTGER, T., KRÜGER, M. & BRAUN, T. 2011. On marathons and sprints: an integrated quantitative proteomics and transcriptomics analysis of differences between slow and fast muscle fibers. Molecular & Cellular Proteomics.
DUROVIC, B. & SPASIC-JOKIC, V. 2008. Influence of occupational exposure to low-dose ionizing radiation on the plasma activity of superoxide dismutase and glutathione level. Vojnosanit Pregl, 65, 613-8.
EDGELL, C. J., MCDONALD, C. C. & GRAHAM, J. B. 1983. Permanent cell line expressing human factor VIII-related antigen established by hybridization. Proceedings of the National Academy of Sciences of the United States of America, 80, 3734-7.
ESTELLER, M. 2011. Non-coding RNAs in human disease. Nat Rev Genet, 12, 861-874. FAJARDO, L. F. L. G. 2008. Ionizing Radiation and the Endothelium Late Effects of Cancer Treatment
on Normal Tissues. In: RUBIN, P., CONSTINE, L. S., MARKS, L. B. & OKUNIEFF, P. (eds.). Springer Berlin Heidelberg.
FALK, E. & FERNÁNDEZ-ORTIZ, A. 1995. Role of thrombosis in atherosclerosis and its complications. The American Journal of Cardiology, 75, 5B-11B.
FORGIONE, M. A., LEOPOLD, J. A. & LOSCALZO, J. 2000. Roles of endothelial dysfunction in coronary artery disease. Curr Opin Cardiol, 15, 409-15.
FURCHGOTT, R. F. & ZAWADZKI, J. V. 1980. The obligatory role of endothelial cells in the relaxation of arterial smooth muscle by acetylcholine. Nature, 288, 373-376.
GAJDUSEK, C., ONODA, K., LONDON, S., JOHNSON, M., MORRISON, R. & MAYBERG, M. 2001. Early molecular changes in irradiated aortic endothelium. Journal of Cellular Physiology, 188, 8-23.
GALLI, F., PIRODDI, M., ANNETTI, C., AISA, C., FLORIDI, E. & FLORIDI, A. 2005. Oxidative stress and reactive oxygen species. Contrib Nephrol, 149, 240-60.
GAMA, V., YOSHIDA, T., GOMEZ, J. A., BASILE, D. P., MAYO, L. D., HAAS, A. L. & MATSUYAMA, S. 2006. Involvement of the ubiquitin pathway in decreasing Ku70 levels in response to drug-induced apoptosis. Experimental Cell Research, 312, 488-499.
GEIGER, T., MADDEN, S. F., GALLAGHER, W. M., COX, J. & MANN, M. 2012. Proteomic Portrait of Human Breast Cancer Progression Identifies Novel Prognostic Markers. Cancer Research, 72, 2428-2439.
GIBSON, B. W. 2005. The human mitochondrial proteome: oxidative stress, protein modifications and oxidative phosphorylation. The International Journal of Biochemistry & Cell Biology, 37, 927-934.
GILCHRIST, T. C. 1897. A case of dermatitis due to the x rays. Bulletin Johns Hopkins Hospital, 8, no. 71, 17-22.
GOKHALE, A., LARIMORE, J., WERNER, E., SO, L., MORENO-DE-LUCA, A., LESE-MARTIN, C., LUPASHIN, V. V., SMITH, Y. & FAUNDEZ, V. 2012. Quantitative Proteomic and Genetic Analyses of the Schizophrenia Susceptibility Factor Dysbindin Identify Novel Roles of the Biogenesis of Lysosome-Related Organelles Complex 1. The Journal of Neuroscience, 32, 3697-3711.
GOTTLIEB, T. M. & JACKSON, S. P. 1993. The DNA-dependent protein kinase: Requirement for DNA ends and association with Ku antigen. Cell, 72, 131-142.
GRANT, C. M. 2008. Metabolic reconfiguration is a regulated response to oxidative stress. J Biol, 7, 1.
Bibliography
117
HATOUM, O. A., OTTERSON, M. F., KOPELMAN, D., MIURA, H., SUKHOTNIK, I., LARSEN, B. T., SELLE, R. M., MOULDER, J. E. & GUTTERMAN, D. D. 2006. Radiation Induces Endothelial Dysfunction in Murine Intestinal Arterioles via Enhanced Production of Reactive Oxygen Species. Arteriosclerosis, Thrombosis, and Vascular Biology, 26, 287-294.
HE, L. & HANNON, G. J. 2004. MicroRNAs: small RNAs with a big role in gene regulation. Nat Rev Genet, 5, 522-531.
HEATHER, L. C., CARR, C. A., STUCKEY, D. J., POPE, S., MORTEN, K. J., CARTER, E. E., EDWARDS, L. M. & CLARKE, K. 2010. Critical role of complex III in the early metabolic changes following myocardial infarction. Cardiovasc Res, 85, 127-36.
HERRERA, M. D., MINGORANCE, C., RODRIGUEZ-RODRIGUEZ, R. & ALVAREZ DE SOTOMAYOR, M. 2010. Endothelial dysfunction and aging: an update. Ageing Res Rev, 9, 142-52.
HOVING, S., HEENEMAN, S., GIJBELS, M. J. J., TE POELE, J. A. M., RUSSELL, N. S., DAEMEN, M. J. A. P. & STEWART, F. A. 2008. Single-Dose and Fractionated Irradiation Promote Initiation and Progression of Atherosclerosis and Induce an Inflammatory Plaque Phenotype in ApoE-/- Mice. International Journal of Radiation Oncology*Biology*Physics, 71, 848-857.
HUANG, T.-C., SAHASRABUDDHE, N. A., KIM, M.-S., GETNET, D., YANG, Y., PETERSON, J. M., GHOSH, B., CHAERKADY, R., LEACH, S. D., MARCHIONNI, L., WONG, G. W. & PANDEY, A. 2012. Regulation of Lipid Metabolism by Dicer Revealed through SILAC Mice. Journal of Proteome Research, 11, 2193-2205.
HUMMEL, R., HUSSEY, D. J. & HAIER, J. 2010. MicroRNAs: Predictors and modifiers of chemo- and radiotherapy in different tumour types. European Journal of Cancer, 46, 298-311.
IVANOV, E. P., TOLOCHKO, G., LAZAREV, V. S. & SHUVAEVA, L. 1993. Child leukaemia after Chernobyl. Nature, 365, 702.
IVANOV, V. K., MAKSIOUTOV, M. A., CHEKIN, S. Y., PETROV, A. V., BIRYUKOV, A. P., KRUGLOVA, Z. G., MATYASH, V. A., TSYB, A. F., MANTON, K. G. & KRAVCHENKO, J. S. 2006. The risk of radiation-induced cerebrovascular disease in Chernobyl emergency workers. Health Phys, 90, 199-207.
JACKSON, S. P. & BARTEK, J. 2009. The DNA-damage response in human biology and disease. Nature, 461, 1071-1078.
JELONEK, K., WALASZCZYK, A., GABRYS, D., PIETROWSKA, M., KANTHOU, C. & WIDLAK, P. 2011. Cardiac endothelial cells isolated from mouse heart - a novel model for radiobiology. Acta Biochim Pol, 58, 397-404.
JEREMY M BERG, J. L. T., AND LUBERT STRYER 2002. Biochemistry. New York: W H Freeman;, ISBN-10: 0-7167-3051-0.
JOHNSON, S. R., ANDERSON, P. A., EDWARDS, P. P., GAMESON, I., PRENDERGAST, J. W., AL-MAMOURI, M., BOOK, D., HARRIS, I. R., SPEIGHT, J. D. & WALTON, A. 2005. Chemical Activation of MgH2; a New Route to Superior Hydrogen Storage Materials. ChemInform, 36, no-no.
KANTAK, S. S., DIGLIO, C. A. & ONODA, J. M. 1993. Low dose radiation-induced endothelial cell retraction. Int J Radiat Biol, 64, 319-28.
KAZAKOV, V. S., DEMIDCHIK, E. P. & ASTAKHOVA, L. N. 1992. Thyroid cancer after Chernobyl. Nature, 359, 21.
KIM, S. H., KIM, D., HAN, J. S., JEONG, C. S., CHUNG, B. S., KANG, C. D. & LI, G. C. 1999. Ku Autoantigen Affects the Susceptibility to Anticancer Drugs. Cancer Research, 59, 4012-4017.
KLOSE, J. 1975. Protein mapping by combined isoelectric focusing and electrophoresis of mouse tissues. A novel approach to testing for induced point mutations in mammals. Humangenetik, 26, 231-43.
KRAEMER, A., ANASTASOV, N., ANGERMEIER, M., WINKLER, K., ATKINSON, M. J. & MOERTL, S. 2011. MicroRNA-Mediated Processes are Essential for the Cellular Radiation Response. Radiat Res.
KREK, A., GRUN, D., POY, M. N., WOLF, R., ROSENBERG, L., EPSTEIN, E. J., MACMENAMIN, P., DA PIEDADE, I., GUNSALUS, K. C., STOFFEL, M. & RAJEWSKY, N. 2005. Combinatorial microRNA target predictions. Nat Genet, 37, 495-500.

Bibliography
118
KRUEGER, A. P. & NORTHROP, J. H. 1930. THE KINETICS OF THE BACTERIUM-BACTERIOPHAGE REACTION. J Gen Physiol, 14, 223-54.
KRÜGER, M., MOSER, M., USSAR, S., THIEVESSEN, I., LUBER, C. A., FORNER, F., SCHMIDT, S., ZANIVAN, S., FÄSSLER, R. & MANN, M. 2008. SILAC Mouse for Quantitative Proteomics Uncovers Kindlin-3 as an Essential Factor for Red Blood Cell Function. Cell, 134, 353-364.
KUZELOVA, K. & HRKAL, Z. 2008. Rho-signaling pathways in chronic myelogenous leukemia. Cardiovasc Hematol Disord Drug Targets, 8, 261-7.
L.H. OPIE, M., DPHIL, DSC 1996. Metabolic perturbations in ischemic heart disease. Dialogues in Cardiovascular Medicine Vol 1 . .
LAEMMLI 1970. Cleavage of structural proteins during the of the head of bacteriophage T4. Nature 227(259);, 680–685.
LEE, Y. S. & DUTTA, A. 2006. MicroRNAs: small but potent oncogenes or tumor suppressors. Curr Opin Investig Drugs, 7, 560-4.
LEE, Y. S. & DUTTA, A. 2007. The tumor suppressor microRNA let-7 represses the HMGA2 oncogene. Genes Dev, 21, 1025-30.
LEONG, H. S., BROWNSEY, R. W., KULPA, J. E. & ALLARD, M. F. 2003. Glycolysis and pyruvate oxidation in cardiac hypertrophy--Why so unbalanced? Comparative Biochemistry and Physiology - Part A: Molecular & Integrative Physiology, 135, 499-513.
LEWIS, B. P., BURGE, C. B. & BARTEL, D. P. 2005. Conserved Seed Pairing, Often Flanked by Adenosines, Indicates that Thousands of Human Genes are MicroRNA Targets. Cell, 120, 15-20.
LEYVA, F., WINGROVE, C. S., GODSLAND, I. F. & STEVENSON, J. C. 1998. The glycolytic pathway to coronary heart disease: A hypothesis. Metabolism, 47, 657-662.
LIU, B., CLANACHAN, A. S., SCHULZ, R. & LOPASCHUK, G. D. 1996. Cardiac efficiency is improved after ischemia by altering both the source and fate of protons. Circ Res, 79, 940-8.
LUSCHER, T. F., RICHARD, V., TSCHUDI, M., YANG, Z. H. & BOULANGER, C. 1990. Endothelial control of vascular tone in large and small coronary arteries. J Am Coll Cardiol, 15, 519-27.
MAES, O. C., AN, J., SAROJINI, H., WU, H. & WANG, E. 2008. Changes in MicroRNA expression patterns in human fibroblasts after low-LET radiation. Journal of Cellular Biochemistry, 105, 824-834.
MARCHETTI, F., COLEMAN, M. A., JONES, I. M. & WYROBEK, A. J. 2006. Candidate protein biodosimeters of human exposure to ionizing radiation. International Journal of Radiation Biology, 82, 605-639.
MARSDEN, P. A., GOLIGORSKY, M. S. & BRENNER, B. M. 1991. Endothelial cell biology in relation to current concepts of vessel wall structure and function. J Am Soc Nephrol, 1, 931-48.
MAYBURD, A. L., MARTLINEZ, A., SACKETT, D., LIU, H., SHIH, J., TAULER, J., AVIS, I. & MULSHINE, J. L. 2006. Ingenuity network-assisted transcription profiling: Identification of a new pharmacologic mechanism for MK886. Clin Cancer Res, 12, 1820-7.
MCGEER, E. G. & MCGEER, P. L. 2010. Neuroinflammation in Alzheimer's disease and mild cognitive impairment: a field in its infancy. J Alzheimers Dis, 19, 355-61.
MICHALOWSKI, A. S. 1994. On radiation damage to normal tissues and its treatment. II. Anti-inflammatory drugs. Acta Oncol, 33, 139-57.
MICHIELS, C. 2003. Endothelial cell functions. J Cell Physiol, 196, 430-43. MILLER, J. H., JIN, S., MORGAN, W. F., YANG, A., WAN, Y., AYPAR, U., PETERS, J. S. & SPRINGER, D. L.
2008. Profiling Mitochondrial Proteins in Radiation-Induced Genome-Unstable Cell Lines with Persistent Oxidative Stress by Mass Spectrometry. Radiation Research, 169, 700-706.
MONCEAU, V., PASINETTI, N., SCHUPP, C., POUZOULET, F., OPOLON, P. & VOZENIN, M. C. 2010. Modulation of the Rho/ROCK pathway in heart and lung after thorax irradiation reveals targets to improve normal tissue toxicity. Curr Drug Targets, 11, 1395-404.
MONZEN, K., ITO, Y., NAITO, A. T., KASAI, H., HIROI, Y., HAYASHI, D., SHIOJIMA, I., YAMAZAKI, T., MIYAZONO, K., ASASHIMA, M., NAGAI, R. & KOMURO, I. 2008. A crucial role of a high mobility group protein HMGA2 in cardiogenesis. Nat Cell Biol, 10, 567-574.

Bibliography
119
MORENO-SÁNCHEZ, R., RODRÍGUEZ-ENRÍQUEZ, S., MARÍN-HERNÁNDEZ, A. & SAAVEDRA, E. 2007. Energy metabolism in tumor cells. FEBS Journal, 274, 1393-1418.
MORSHEDI, A., REN, Z., LI, J. & DRÖGE, P. Probing into the Biological Processes Influenced by ESC Factor and Oncoprotein HMGA2 Using iPSCs. Stem Cell Reviews and Reports, 1-9.
MOTHERSILL, C., SEYMOUR, C. B., MULVIN, D. & HENNESSY, T. P. 1992. Endothelial cell proliferation is induced by radiation in cultured explants of human urothelium and oesophageal mucosa. EXS, 61, 407-10.
MURIEL, V. 2002. The biological basis of fractionation in radiotherapy. Clinical and Translational Oncology, 4, 161-166.
NETHERLAND, C. & THEWKE, D. P. 2010. Rimonabant is a dual inhibitor of acyl CoA:cholesterol acyltransferases 1 and 2. Biochemical and Biophysical Research Communications, 398, 671-676.
NEUHOFF, V., AROLD, N., TAUBE, D. & EHRHARDT, W. 1988. Improved staining of proteins in polyacrylamide gels including isoelectric focusing gels with clear background at nanogram sensitivity using Coomassie Brilliant Blue G-250 and R-250. ELECTROPHORESIS, 9, 255-62.
NISHIKI, K., ERECINSKA, M. & WILSON, D. F. 1979. Effect of Amytal on metabolism of perfused rat heart: relationship between glycolysis and oxidative phosphorylation. Am J Physiol, 237, C221-30.
NISSEN, S. E., TUZCU, E. M., BREWER, H. B., SIPAHI, I., NICHOLLS, S. J., GANZ, P., SCHOENHAGEN, P., WATERS, D. D., PEPINE, C. J., CROWE, T. D., DAVIDSON, M. H., DEANFIELD, J. E., WISNIEWSKI, L. M., HANYOK, J. J. & KASSALOW, L. M. 2006. Effect of ACAT Inhibition on the Progression of Coronary Atherosclerosis. New England Journal of Medicine, 354, 1253-1263.
NYLUND, R. & LESZCZYNSKI, D. 2006. Mobile phone radiation causes changes in gene and protein expression in human endothelial cell lines and the response seems to be genome- and proteome-dependent. Proteomics, 6, 4769-80.
O'DAY, E. & LAL, A. 2010. MicroRNAs and their target gene networks in breast cancer. Breast Cancer Res, 12, 201.
O'FARRELL, P. H. 1975. High resolution two-dimensional electrophoresis of proteins. J Biol Chem, 250, 4007-21.
ONG, S. E., BLAGOEV, B., KRATCHMAROVA, I., KRISTENSEN, D. B., STEEN, H., PANDEY, A. & MANN, M. 2002. Stable isotope labeling by amino acids in cell culture, SILAC, as a simple and accurate approach to expression proteomics. Mol Cell Proteomics, 1, 376-86.
ONG, S. E., FOSTER, L. J. & MANN, M. 2003. Mass spectrometric-based approaches in quantitative proteomics. Methods, 29, 124-30.
PENG, Y., LASER, J., SHI, G., MITTAL, K., MELAMED, J., LEE, P. & WEI, J.-J. 2008. Antiproliferative Effects by Let-7 Repression of High-Mobility Group A2 in Uterine Leiomyoma. Molecular Cancer Research, 6, 663-673.
PERLUIGI, M., GIORGI, A., BLARZINO, C., DE MARCO, F., FOPPOLI, C., DI DOMENICO, F., BUTTERFIELD, D. A., SCHININA, M. E., CINI, C. & COCCIA, R. 2009. Proteomics analysis of protein expression and specific protein oxidation in human papillomavirus transformed keratinocytes upon UVB irradiation. J Cell Mol Med, 13, 1809-22.
PLUDER, F., BARJAKTAROVIC, Z., AZIMZADEH, O., MÖRTL, S., KRÄMER, A., STEININGER, S., SARIOGLU, H., LESZCZYNSKI, D., NYLUND, R., HAKANEN, A., SRIHARSHAN, A., ATKINSON, M. & TAPIO, S. 2011. Low-dose irradiation causes rapid alterations to the proteome of the human endothelial cell line EA.hy926. Radiation and Environmental Biophysics, 50, 155-166.
PRASAD, S. C., THRAVES, P. J., DRITSCHILO, A. & KUETTEL, M. R. 1997. Protein expression changes associated with radiation-induced neoplastic progression of human prostate epithelial cells. ELECTROPHORESIS, 18, 629-37.
PRESTON, D. L., PIERCE, D. A., SHIMIZU, Y., CULLINGS, H. M., FUJITA, S., FUNAMOTO, S. & KODAMA, K. 2004. Effect of Recent Changes in Atomic Bomb Survivor Dosimetry on Cancer Mortality Risk Estimates. Radiation Research, 162, 377-389.

Bibliography
120
PRESTON, D. L., RON, E., TOKUOKA, S., FUNAMOTO, S., NISHI, N., SODA, M., MABUCHI, K. & KODAMA, K. 2007. Solid Cancer Incidence in Atomic Bomb Survivors: 1958–1998. Radiation Research, 168, 1-64.
PRESTON, D. L., SHIMIZU, Y., PIERCE, D. A., SUYAMA, A. & MABUCHI, K. 2003. Studies of mortality of atomic bomb survivors. Report 13: Solid cancer and noncancer disease mortality: 1950-1997. Radiat Res, 160, 381-407.
PRESTON L.DALE , S. K., MASAO TOMONAGA, SHIZUE IZUMI, ELAINE RON, ATSUSHI KURAMOTO, NANAO KAMADA, HIROO DOHY, TATSUKI MATSUI, HIROAKI NONAKA, DESMOND E. THOMPSON, MIDORI SODA AND KIYOHIKO MABUCHI 1994. Cancer Incidence in Atomic Bomb Survivors. Part III: Leukemia, Lymphoma and Multiple Myeloma, 1950-1987. Radiation Research, Vol. 137, No. 2, Supplement: Cancer Incidence in Atomic Bomb Survivors. Radiation Effects Research Foundation, Hiroshima and Nagasaki, S68-S97.
PRISYAZHIUK, A., PJATAK, O. A., BUZANOV, V. A., REEVES, G. K. & BERAL, V. 1991. Cancer in the Ukraine, post-Chernobyl. Lancet, 338, 1334-5.
PUKKALA, E., KESMINIENE, A., POLIAKOV, S., RYZHOV, A., DROZDOVITCH, V., KOVGAN, L., KYYRONEN, P., MALAKHOVA, I. V., GULAK, L. & CARDIS, E. 2006. Breast cancer in Belarus and Ukraine after the Chernobyl accident. Int J Cancer, 119, 651-8.
RALSER, M., WAMELINK, M. M., KOWALD, A., GERISCH, B., HEEREN, G., STRUYS, E. A., KLIPP, E., JAKOBS, C., BREITENBACH, M., LEHRACH, H. & KROBITSCH, S. 2007. Dynamic rerouting of the carbohydrate flux is key to counteracting oxidative stress. J Biol, 6, 10.
REEVES, R. 2001. Molecular biology of HMGA proteins: hubs of nuclear function. Gene, 277, 63-81. RODRIGUEZ-FEO, J. A. & PASTERKAMP, G. 2007. Trends in Vascular Biology; Functional Restoration of
Damaged Endothelium, . 13, 1723-1725. ROSENBLUM, M. L., WHEELER, K. T., WILSON, C. B., BARKER, M. & KNEBEL, K. D. 1975. In vitro
evaluation of in vivo brain tumor chemotherapy with 1,3-bis(2-chloroethyl)-1-nitrosourea. Cancer Res, 35, 1387-91.
ROSS, R. 1999. Atherosclerosis--an inflammatory disease. N Engl J Med, 340, 115-26. SALMINEN, A., HELENIUS, M., LAHTINEN, T., KORHONEN, P., TAPIOLA, T., SOININEN, H. & SOLOVYAN,
V. 1997. Down-Regulation of Ku Autoantigen, DNA-Dependent Protein Kinase, and Poly(ADP-ribose) Polymerase during Cellular Senescence. Biochemical and Biophysical Research Communications, 238, 712-716.
SARIN, R. 2011. Chernobyl, Fukushima, and beyond: A health safety perspective. SARIOGLU, H., BRANDNER, S., HABERGER, M., JACOBSEN, C., LICHTMANNEGGER, J., WORMKE, M. &
ANDRAE, U. 2008. Analysis of 2,3,7,8-tetrachlorodibenzo-p-dioxin-induced proteome changes in 5L rat hepatoma cells reveals novel targets of dioxin action including the mitochondrial apoptosis regulator VDAC2. Mol Cell Proteomics, 7, 394-410.
SAWADA, M., SUN, W., HAYES, P., LESKOV, K., BOOTHMAN, D. A. & MATSUYAMA, S. 2003. Ku70 suppresses the apoptotic translocation of Bax to mitochondria. Nat Cell Biol, 5, 320-9.
SEASHOLTZ, T. M. & BROWN, J. H. 2004. RHO SIGNALING in Vascular Diseases. Molecular Interventions, 4, 348-357.
SHACTER, E. 2000. Quantification and significance of protein oxidation in biological samples. Drug Metab Rev, 32, 307-26.
SHELL, S., PARK, S.-M., RADJABI, A. R., SCHICKEL, R., KISTNER, E. O., JEWELL, D. A., FEIG, C., LENGYEL, E. & PETER, M. E. 2007. Let-7 expression defines two differentiation stages of cancer. Proceedings of the National Academy of Sciences, 104, 11400-11405.
SHIMIZU, Y., KODAMA, K., NISHI, N., KASAGI, F., SUYAMA, A., SODA, M., GRANT, E. J., SUGIYAMA, H., SAKATA, R., MORIWAKI, H., HAYASHI, M., KONDA, M. & SHORE, R. E. 2010. Radiation exposure and circulatory disease risk: Hiroshima and Nagasaki atomic bomb survivor data, 1950-2003. Bmj, 340, b5349.
SHIN, S., CHA, H. J., LEE, E. M., LEE, S. J., SEO, S. K., JIN, H. O., PARK, I. C., JIN, Y. W. & AN, S. 2009. Alteration of miRNA profiles by ionizing radiation in A549 human non-small cell lung cancer cells. Int J Oncol, 35, 81-6.

Bibliography
121
SIMONE, N. L., SOULE, B. P., LY, D., SALEH, A. D., SAVAGE, J. E., DEGRAFF, W., COOK, J., HARRIS, C. C., GIUS, D. & MITCHELL, J. B. 2009. Ionizing radiation-induced oxidative stress alters miRNA expression. PLoS ONE, 4, e6377.
SOUFI, B., KUMAR, C., GNAD, F., MANN, M., MIJAKOVIC, I. & MACEK, B. 2010. Stable Isotope Labeling by Amino Acids in Cell Culture (SILAC) Applied to Quantitative Proteomics of Bacillus subtilis. Journal of Proteome Research, 9, 3638-3646.
SRIHARSHAN, A., BOLDT, K., SARIOGLU, H., BARJAKTAROVIC, Z., AZIMZADEH, O., HIEBER, L., ZITZELSBERGER, H., UEFFING, M., ATKINSON, M. J. & TAPIO, S. 2012. PROTEOMIC ANALYSIS BY SILAC AND 2D-DIGE REVEALS RADIATION-INDUCED ENDOTHELIAL RESPONSE: FOUR KEY PATHWAYS. Journal of Proteomics.
SRIVASTAVA, S., CHANDRASEKAR, B., GU, Y., LUO, J., HAMID, T., HILL, B. G. & PRABHU, S. D. 2007. Downregulation of CuZn-superoxide dismutase contributes to beta-adrenergic receptor-mediated oxidative stress in the heart. Cardiovasc Res, 74, 445-55.
STEWART, F. A., HEENEMAN, S., TE POELE, J., KRUSE, J., RUSSELL, N. S., GIJBELS, M. & DAEMEN, M. 2006. Ionizing radiation accelerates the development of atherosclerotic lesions in ApoE-/- mice and predisposes to an inflammatory plaque phenotype prone to hemorrhage. Am J Pathol, 168, 649-58.
STEWART, F. A., HOVING, S. & RUSSELL, N. S. 2010. Vascular Damage as an Underlying Mechanism of Cardiac and Cerebral Toxicity in Irradiated Cancer Patients. Radiation Research, 174, 865-869.
STONEMAN, V. E. & BENNETT, M. R. 2004. Role of apoptosis in atherosclerosis and its therapeutic implications. Clin Sci (Lond), 107, 343-54.
SUN, H. & WANG, Y. 2011. Restriction of Big Hearts by a Small RNA. Circulation Research, 108, 274-276.
SWA, H. L., BLACKSTOCK, W. P., LIM, L. H. & GUNARATNE, J. 2012. Quantitative proteomics profiling of murine mammary gland cells unravels impact of annexin-1 on DNA-damage response, cell adhesion and migration. Mol Cell Proteomics.
SWERDLOW, A. J., HIGGINS, C. D., SMITH, P., CUNNINGHAM, D., HANCOCK, B. W., HORWICH, A., HOSKIN, P. J., LISTER, A., RADFORD, J. A., ROHATINER, A. Z. & LINCH, D. C. 2007. Myocardial infarction mortality risk after treatment for Hodgkin disease: a collaborative British cohort study. J Natl Cancer Inst, 99, 206-14.
TAKAHASHI, S. & KITABATAKE, T. 1965. SKIN AND NECK CANCER FOLLOWING RADIATION THERAPY FOR BENIGN DISEASES. Tohoku J Exp Med, 84, 349-59.
THEISEN, M. J., MISRA, I., SAADAT, D., CAMPOBASSO, N., MIZIORKO, H. M. & HARRISON, D. H. 2004. 3-hydroxy-3-methylglutaryl-CoA synthase intermediate complex observed in "real-time". Proc Natl Acad Sci U S A, 101, 16442-7.
TOWBIN, H., STAEHELIN, T. & GORDON, J. 1992. Electrophoretic transfer of proteins from polyacrylamide gels to nitrocellulose sheets: procedure and some applications. 1979. Biotechnology, 24, 145-9.
TSAI, M. L., CHANG, K. Y., CHIANG, C. S., SHU, W. Y., WENG, T. C., CHEN, C. R., HUANG, C. L., LIN, H. K. & HSU, I. C. 2009. UVB radiation induces persistent activation of ribosome and oxidative phosphorylation pathways. Radiat Res, 171, 716-24.
TUKENOVA, M., GUIBOUT, C., OBERLIN, O., DOYON, F., MOUSANNIF, A., HADDY, N., GUERIN, S., PACQUEMENT, H., AOUBA, A., HAWKINS, M., WINTER, D., BOURHIS, J., LEFKOPOULOS, D., DIALLO, I. & DE VATHAIRE, F. 2010. Role of cancer treatment in long-term overall and cardiovascular mortality after childhood cancer. J Clin Oncol, 28, 1308-15.
TZUR, G., ISRAEL, A., LEVY, A., BENJAMIN, H., MEIRI, E., SHUFARO, Y., MEIR, K., KHVALEVSKY, E., SPECTOR, Y., ROJANSKY, N., BENTWICH, Z., REUBINOFF, B. E. & GALUN, E. 2009. Comprehensive Gene and microRNA Expression Profiling Reveals a Role for microRNAs in Human Liver Development. PLoS ONE, 4, e7511.
URBICH, C., KUEHBACHER, A. & DIMMELER, S. 2008. Role of microRNAs in vascular diseases, inflammation, and angiogenesis. Cardiovascular Research, 79, 581-588.

Bibliography
122
VALENTINI, C. G., FIANCHI, L., VOSO, M. T., CAIRA, M., LEONE, G. & PAGANO, L. 2011. Incidence of acute myeloid leukemia after breast cancer. Mediterr J Hematol Infect Dis, 3, e2011069.
VAUPEL, P. 2008. Hypoxia and Aggressive Tumor Phenotype: Implications for Therapy and Prognosis. The Oncologist, 13, 21-26.
VAUPEL, P. & MAYER, A. 2007. Hypoxia in cancer: significance and impact on clinical outcome. Cancer and Metastasis Reviews, 26, 225-239.
VICTOR, A. 2001. microRNAs: Tiny Regulators with Great Potential. Cell, 107, 823-826. VINCENTI, S., BRILLANTE, N., LANZA, V., BOZZONI, I., PRESUTTI, C., CHIANI, F., ETNA, M. P. & NEGRI,
R. 2011. HUVEC respond to radiation by inducing the expression of pro-angiogenic microRNAs. Radiat Res, 175, 535-46.
WAGNER-ECKER, M., SCHWAGER, C., WIRKNER, U., ABDOLLAHI, A. & HUBER, P. E. 2010. MicroRNA expression after ionizing radiation in human endothelial cells. Radiat Oncol, 5, 25.
WEIDHAAS, J. B., BABAR, I., NALLUR, S. M., TRANG, P., ROUSH, S., BOEHM, M., GILLESPIE, E. & SLACK, F. J. 2007. MicroRNAs as potential agents to alter resistance to cytotoxic anticancer therapy. Cancer Res, 67, 11111-6.
WEIK, M., BERGES, J., RAVES, M. L., GROS, P., MCSWEENEY, S., SILMAN, I., SUSSMAN, J. L., HOUEE-LEVIN, C. & RAVELLI, R. B. 2002. Evidence for the formation of disulfide radicals in protein crystals upon X-ray irradiation. J Synchrotron Radiat, 9, 342-6.
WU, S., HUANG, S., DING, J., ZHAO, Y., LIANG, L., LIU, T., ZHAN, R. & HE, X. 2010. Multiple microRNAs modulate p21Cip1/Waf1 expression by directly targeting its 3[prime] untranslated region. Oncogene, 29, 2302-2308.
WWW.BIOINFORMATICS2.WSU.EDU/. Available: www.bioinformatics2.wsu.edu/RiceRBP/protocols/PolyU2DGelElectrophoresis.pdf.
WWW.INGENUITY.COM. WWW.MAXQUANT.ORG/. WWW.MICRORNA.ORG. WWW.MIRBASE.ORG. Available: http://www.mirbase.org/cgi-bin/mirna_summary.pl?org=hsa. WWW.PANTHERDB.ORG/. WWW.TARGETSCAN.ORG. WWW.UNIPROT.ORG. WWW.WHO.INT. Available: www.who.int/mediacentre/factsheets/fs303/en/index.html. ZANIVAN, S., KRUEGER, M. & MANN, M. 2012. In vivo quantitative proteomics: the SILAC mouse.
Methods Mol Biol, 757, 435-50. ZHANG, B., PAN, X., COBB, G. P. & ANDERSON, T. A. 2007. microRNAs as oncogenes and tumor
suppressors. Developmental Biology, 302, 1-12. ZHANG, G., FENYÖ, D. & NEUBERT, T. A. 2008. Screening for EphB Signaling Effectors Using SILAC
with a Linear Ion Trap-Orbitrap Mass Spectrometer. Journal of Proteome Research, 7, 4715-4726.
ZUO, Y.-H., WANG, X.-L., LI, J.-G., DANG, X.-H., WANG, Z.-W., ZHANG, S.-P. & TONG, J. 2010. Proteomic Alterations in Progeny of Irradiated Human Liver Cells. Journal of Toxicology and Environmental Health, Part A, 73, 520-528.
Curriculum vitae
123
9. Curriculum vitae
Personal details 29 years, born on the 30th of October, 1982, In
Hassan, India
Citizenship Indian
Personal Status Married
Present Position
06 / 08-Present Doctoral research at the Research unit of radiation
cytogenetics, Helmholtz Centre Munich. Enrolled at: the LMU Medizinische Fakültät (Medical faculty) for Dr. rer. hum. biol
09 / 07-06 / 08 Research assistant (Wissenschaftliche Hilfskraft) at the former Institute of Molecular biology, present Research unit of radiation cytogenetics
Higher Education
2004-2006 Post graduate studies, Masters Degree in Science
(M.Sc.), Bangalore University, India Specialisation: Biotechnology
2000-2003 Bachelors Degree of Science (B.Sc.) in, Bangalore
University, India Specialisation: Biotechnology, Chemistry, Botany

Curriculum vitae
124
Schooling and Pre-university
1998-2000 Second year pre-university examination (college
leaving certificate), Department of pre-university education, Government of Karnataka, India
1998-1998 Senior school leaving certificate, Secondary education examination board, Karnataka, India
On Job Trainings
November 2002 National institute of mental health and
neurosciences, Department of human genetics, Bangalore, India
Project brief: Preparation of metaphase plates karyotyping and study of chromosomal aberrations
June 2002 University of agricultural sciences, Department of
horticulture, Bangalore, India Project: Plant tissue culturing
May 2001 Kempegowda institute of medical sciences, hospital and research centre, Departments of clinical biochemistry, microbiology and clinical haematology Bangalore, India
Project: Clinical and biochemical tests in biochemistry microbiology and clinical haematology
Language Skills
Fluency in written and spoken: English, German, Hindi, and Kannada

Curriculum vitae
125
Software Skills
MS Office: Word, Excel, Power Point Adobe: Photoshop, Illustrator MaxQuant DeCyder™ 2D Software ProteinPilot™ Software 4.0 Typhoon Scan control software Papers Presented
Proteomic techniques, SILAC and 2D-DIGE as
complimentary methods. Arundhathi Sriharshan, Randolph Caldwell, Soile Tapio, book chapter in preparation.
Effect of Low-dose irradiation (200 mGy) on the
miRNA profile in the endothelial cell line EA.hy926 cell line. Arundhathi Sriharshan, Anne. Kraemer, Isolde Summerer, Horst Zitzelsberger, Michael J.Atkinson Simone. Moertl and Soile Tapio, Manuscript in preparation.
Integrative proteomic and microRNA analysis of primary human coronary artery endothelial cells exposed to low-dose gamma radiation. Zarko Barjaktarovic, Natasa Anastasov, Omid Azimzadeh, Arundhathi Sriharshan, Hakan Sarioglu, Marius Ueffing, Hanna Tammio, Arvi Hakanen, Dariusz Leszczynski, Michael J.Atkinson and Soile Tapio. Manuscript submitted to Radiat Environ Biophys.
Proteomic analysis by SILAC and 2D-DIGE
reveals radiation-induced endothelial response: Four key pathways. Arundhathi Sriharshan, Karsten Boldt, Hakan Sarioglu, Zarko Barjaktarovic, Omid Azimzadeh, Ludwig Hieber, Horst Zitzelsberger, Marius Ueffing, Michael J. Atkinson, Soile Tapio, J Proteomics. 2012 Apr 18;75(8):2319-30. Epub 2012 Feb 20.
Low-dose irradiation causes rapid alterations to the proteome of the human endothelial cell line EA.hy926. F. Pluder, Z. Barjaktarovic, O. Azimzadeh, S. Moertl, A. Kraemer, S. Steininger, H. Sarioglu, D. Leszczynski, R. Nylund, A. Hakanen, A. Sriharshan, M. J. Atkinson, S. Tapio, Radiat Environ Biophys. 2011 Mar; 50(1):155-66.

Curriculum vitae
126
Posters Presented
2011 Radiation-induced proteome alterations in the human endothelial cell line EA.hy926. Arundhathi Sriharshan, Karsten Boldt, Ludwig Hieber, Zarko Barjaktarovic, Azimzadeh Omid, Marius Ueffing, Hakan Sarioglu, Horst Zitzelsberger, Michael J. Atkinson, Soile Tapio, HUPO Congress Geneva
2011 Radiation-induced alterations in the proteome of a human endothelial cell line after exposure to 200mGy ionizing radiation. A. Sriharshan, A. Kraemer, K. Boldt, Z. Barjaktarovic, H. Sarioglu, O. Azimadeh, L. Hieber, H. Zitzelsberger, M. Ueffig, M. J. Atkinson, S. Moertl, S. Tapio, 14th International Congress of Radiation Research, Poland
2009 Radiation-induced proteome alterations in a human endothelial cell line. Arundhathi Sriharshan, Karsten Boldt, Ludwig Hieber, Zarko Barjaktarovic, Azimzadeh Omid, Marius Ueffing, Hakan Sarioglu, Horst Zitzelsberger, Michael J. Atkinson, Soile Tapio, ARR Congress Oxford
2009 Analyzing the acute responses of cells to low dose irradiation through proteomic studies. Arundhathi Sriharshan, Karsten Boldt, Ludwig Hieber, Zarko Barjaktarovic, Azimzadeh Omid, Marius Ueffing, Hakan Sarioglu, Horst Zitzelsberger, Michael J. Atkinson, Soile Tapio, Women in radiation Sciences
Additional Courses
02 / 07 / 2007 German language course for Zertifikat deutsch
(level B1) 07-18 / 07 / 2008 Protection of humans and their environment
against ionising radiation, at the International Wilhelm and Else Heraeus physics school, Bad Honnef
13-18 June 2010 MaxQuant summer school, at the Max-Planck
institute for biochemistry, Martinsried 10th-11th May 2010 Ingenuity Pathways Analysis on-site certification
program, Heidelberg

Curriculum vitae
127
17th May 2010 Protection and commercialisation of intellectual
property, Helmholtz centre Munich, Neuherberg 10th -11th October 2010 REMAT (project and time management course), Helmholtz centre Munich, Neuherberg

Acknowledgements
128
10. Acknowledgements
I would like to express my special gratitude to my PhD supervisor Prof. Dr. Horst Zitzelsberger
for giving me an opportunity to do my PhD in his lab, work in such a stimulating research
context, for always being there and providing encouragement.
I am grateful to my internal supervisors Dr. Soile Tapio and Prof. Dr. Michael. J. Atkinson for
their great efforts to explain things, for their enthusiasm, inspiration, sound advice, and lots of
good ideas. I thank them for their help to make this project a success. I am further grateful for
their tremendous support in all other aspects that are involved in writing a thesis.
I would like to specially thank Zarko Barjaktarovic and Omid Azimzadeh for all their help, advice
and support, to Zarko for doing 2D-DIGE experiments with me till late evenings, to Omid for
reminding me of the 3 x P’s and to Stefanie Winkler for providing all the technical assistance in
immunoblotting.
Dr. Hakan Sarioglu, Dr. Karsten Boldt and Sandra Helm for performing all the mass spectrometry
based analysis. Dr. Ludwig Hieber for guidance in the cell culture related work.
I am grateful to Dr. Simone Mörtl, Dr. Natasa Anastasov, Dr. Anne Krämer and Klaudia Winkler
in guiding and assisting me in the miRNA analysis, to Dr. Kristian Unger and Randolph Caldwell
for their constructive critics.
Lakshmi Sriharshan, Isolde Summerer, Julia Heß, Ulrike Schötz and Steffen Heuer, people whom
I cannot express enough gratitude for everything they did.
Finally for the understanding, motivation and continuous support during the entire period of my
doctoral research I would like to thank my friends, family, and my husband Partha.

Erklärung
129
Erklärung
Ich habe die vorliegende Dissertation selbständig angefertigt und mich außer der angegebenen
keiner weiteren Hilfsmittel bedient. Alle Erkenntnisse, die aus dem Schrifttum ganz oder
annähernd übernommen wurden, sind als solche kenntlich gemacht und nach ihrer Herkunft unter
Bezeichnung der Fundstelle einzeln nachgewiesen.
Ich erkläre, dass ich mich weder ohne noch mit Erfolg anderweitig einer Doktorprüfung
unterzogen habe und dass die hier vorgelegte Dissertation nicht in gleicher oder in ähnlicher Form
bei einer anderen Stelle zur Erlangung eines akademischen Grades eingereicht wurde.
München, im Mai 2012
Arundhathi Sriharshan