identification of protective actions to reduce the
TRANSCRIPT

HAL Id: hal-01270677https://hal.archives-ouvertes.fr/hal-01270677
Submitted on 8 Feb 2016
HAL is a multi-disciplinary open accessarchive for the deposit and dissemination of sci-entific research documents, whether they are pub-lished or not. The documents may come fromteaching and research institutions in France orabroad, or from public or private research centers.
L’archive ouverte pluridisciplinaire HAL, estdestinée au dépôt et à la diffusion de documentsscientifiques de niveau recherche, publiés ou non,émanant des établissements d’enseignement et derecherche français ou étrangers, des laboratoirespublics ou privés.
Identification of protective actions to reduce thevulnerability of safety-critical systems to malevolentacts: a sensitivity-based decision-making approach
Tairan Wang, Nicola Pedroni, Enrico Zio
To cite this version:Tairan Wang, Nicola Pedroni, Enrico Zio. Identification of protective actions to reduce the vulner-ability of safety-critical systems to malevolent acts: a sensitivity-based decision-making approach.Reliability Engineering and System Safety, Elsevier, 2016, 147, pp.9-18. �10.1016/j.ress.2015.09.005�.�hal-01270677�

1
Identification of protective actions to reduce the
vulnerability of safety-critical systems to malevolent acts: a
sensitivity-based decision-making approach
Tai-Ran WANGa, Nicola PEDRONIa, Enrico ZIOa,b
a Chair on Systems Science and the Energy challenge, Fondation EDF, Ecole Centrale Paris and
Supelec, Grande Voie des Vignes, F92-295, Chatenay Malabry Cedex
b Politecnico di Milano, Energy Department, Nuclear Section, c/o Cesnef, via Ponzio 33/A , 20133,
Milan, Italy, Fax: 39-02-2399.6309, Phone: 39-02-2399.6340, [email protected]
ABSTRACT
A classification model based on the Majority Rule Sorting method has been previously
proposed by the authors to evaluate the vulnerability of safety-critical systems (e.g., nuclear
power plants) with respect to malevolent intentional acts.
In this paper, we consider a classification model previously proposed by the authors based on
the Majority Rule Sorting method to evaluate the vulnerability of safety-critical systems (e.g.,
nuclear power plants) with respect to malevolent intentional acts. The model is here used as
the basis for solving an inverse classification problem aimed at determining a set of protective
actions to reduce the level of vulnerability of the safety-critical system under consideration.
To guide the choice of the set of protective actions, sensitivity indicators are originally
introduced as measures of the variation in the vulnerability class that a safety-critical system
is expected to undergo after the application of a given set of protective actions. These
indicators form the basis of an algorithm to rank different combinations of actions according
to their effectiveness in reducing the safety-critical systems vulnerability. Results obtained
using these indicators are presented with regard to the application of: (i) one identified action

2
at a time, (ii) all identified actions at the same time or (iii) a random combination of identified
actions. The results are presented with reference to a fictitious example considering nuclear
power plants as the safety-critical systems object of the analysis.
KEYWORDS: safety-critical system, malevolent intentional attacks, vulnerability analysis,
protective actions, Majority Rule Sorting (MR-Sort), classification model, inverse
classification problem, sensitivity indicator
Notations
subcriterion j
main criterion i
Nuclear power plant i
vulnerability category i
protective action k
weight of the influence of action k on attribute j
after action subcriterion j
limited budget
number of NPPs that are improved after the action(s)
estimate of the percentage of new NPPs that can be
expected to be improved
number of NPPs that are expected to be deteriorated after
the action(s)
estimate of the percentage of new NPPs that can be
expected to be deteriorated
expected “net” amount of ameliorated NPPs
total variation of category underwent by the ameliorated

3
NPPs
variation in vulnerability category that a new ameliorated
plant is expected to undergo
total variation of category underwent by the deteriorated
NPPs
variation in vulnerability category that a new deteriorated
plant is expected to undergo
“net” variation in vulnerability category that a newly
analyzed NPP is expected to undergo.
ratio between the sums of the variations of vulnerability
category underwent by the ameliorated NPPs and the sum of
the corresponding maximum possible category variations
level of action j applied on system i
1. INTRODUCTION
The vulnerability of safety-critical systems and infrastructures (e.g., nuclear power plants) is
of great concern, given the multiple and diverse hazards that they are exposed to (e.g.,
intentional, random, natural etc.) [1] and the potential large-scale consequences. This justifies
the increased attention for analyses aimed at (i) the systematic identification of the sources of
system vulnerability, (ii) the qualitative and quantitative assessment of system vulnerability
[2][3] and (iii) the definition of effective actions of vulnerability reduction.
In a previous work [6], we have proposed an empirical classification framework to tackle the
issue (ii) of assessing vulnerability to malevolent intentional acts. Specifically, we have

4
adopted a classification model based on the Majority Rule Sorting (MR-Sort) method [7] to
assign an alternative (i.e., a safety-critical system) to a given (vulnerability) class (or
category). The MR-Sort classification model contains a group of (adjustable) parameters that
are calibrated by means of a set of empirical classification examples (also called training set),
i.e., a set of alternatives with the corresponding pre-assigned vulnerability classes [6][7]. For
further details on this method, the interested reader can refer to the Appendix A at the end of
the paper. It is worth mentioning that other majority rule voting methods are widely used in
technical decision making problems for vulnerability analysis of systems, see, e.g., [21].
In this paper, we are still only concerned with intentional hazards (i.e., those related to
malevolent acts) and address issue (iii) above (i.e., the definition of the actions to undertake
for reducing the level of system vulnerability). This issue is difficult to be resolved by
traditional risk assessment methods [1][4][5]. On the contrary, the base model developed in
Ref. [6] can be extended to address the problem relates to the problem of optimal risk
reduction, e.g. by optimization of protective measures [29][30][31]. In other words, an
inverse classification problem [8][9][10] of determining a set of protective actions that can
effectively reduce the level of vulnerability of a safety-critical system [11], taking into
account a specified set of constraints (e.g., budget limits) [8].
The present analysis can be considered part of an encompassing business process of safety
management (see, e.g., [22]), where we seek for the best compromise among risks, costs and
benefits in allocating investments in safety-critical systems in the presence of uncertainties
[28]. Correspondingly, the presented algorithms can be considered part of an encompassing
business process of safety management [22]. Mathematically speaking, the aim is to identify
how to modify some features of the input patterns (i.e., the attributes of the safety-critical
system under analysis) such that the resulting class is changed as desired (i.e., the
vulnerability category is reduced to a desired level). To achieve this objective, novel
sensitivity indicators [12] are introduced for quantifying the variation in the vulnerability
class of a safety-critical system resulting from the application of a given set of protective
actions [13]. Using these indicators as the basis for a ranking algorithm, changes in system

5
vulnerability can be achieved considering: (i) one identified action at a time, (ii) all identified
actions at the same time or (iii) a random combination of identified actions. The proposed
indicators also allow different combinations of actions to be ranked and their effectiveness in
reducing the vulnerability under specified budget constraints can be evaluated on a new (test)
set of (unknown) safety-critical systems (i.e., systems not used before to calibrate/train the
classification model). In this context, it is known that existing risk assessment methodologies
may fail to account for unknown and emergent risks that are typical of large-scale
infrastructure investment allocation problems. On the other hand, in modern portfolio theory,
it is well known that a diversified portfolio can be very effective to reduce non-systematic
risks. The approach of diversification is equally important in choosing robust portfolios of
infrastructure projects that may be subject to emergent and unknown risks [27]. The proposed
methodology is expected to contribute also in this direction of optimal classification of
options/investments and combinations of the same.
The remainder of the paper is structured as follows. Section 2 recalls the modeling framework
for the analysis of vulnerability to intentional hazards. With reference to that, Section 3
introduces the problem of inverse classification. Section 4 describes the sensitivity analysis
indicators introduced to tackle the inverse classification problem of Section 3. Section 5
illustrates their use for the identification of protective actions. In Section 6, a case study is
proposed to show the application of the method. Finally, Section 7 gives the discussion and
conclusions of this research.
2 THE CLASSIFICATION MODEL FOR THE ASSESSMENT OF
VULNERABILITY TO INTENTIONAL HAZARDS
We limit the vulnerability analysis of a system to the evaluation of the susceptibility to
intentional hazards and adopt the three-layers hierarchical model developed in [6] (Figure 1).
The susceptibility to intentional hazards (level 1 in Figure 1) is characterized in terms of
attractiveness and accessibility (level 2 in Figure 1). These attributes are hierarchically broken

6
down into factors which influence them, including resilience interpreted as pre-attack
protection (which influences on accessibility) and post-attack recovery (which influences on
attractiveness). The disaggregation is made in 6 criteria (level 3 in Figure 1): physical
characteristics (x1), social criticality (x2), possibility of cascading failures (x3), recovery
means (x4), human preparedness (x5) and level of protection (x6). These six criteria are
further decomposed into a layer of m=16 basic subcriteria { }(level 4 in
Figure 1), for which data and information are collected in terms of quantitative values or
linguistic terms depending on the nature of the subcriterion. The descriptive terms and/ or
values of the fourth layer subcriteria are, then, scaled to numerical categories. The criteria
included in the layers are defined and assigned “preference directions” for treatment in the
decision-making process. The preference direction for a given criterion (e.g., a physical
characteristic or parameter of the system) indicates the state towards which it is desirable to
“move the parameter” in order to reduce system susceptibility: in other words, the preference
direction is assigned from the point of view of a “defender” who is concerned with protecting
the system from an attack [16]. Finally, to get the value of the six third-layer criteria
, (i) we assign weights to each subcriterion to indicate its importance and (ii)
we apply a simple weighted sum to the categorical values of the constituent subcriteria
. These m=16 criteria are evaluated to
assess the vulnerability of a given safety-critical system of interest (e.g., a nuclear power
plant – NPP).
For the purposes of the present analysis, M = 4 levels (or categories) of system vulnerability
are considered: 1 = satisfactory, 2 = acceptable, 3 = problematic and 4 = serious. Then, the assessment of vulnerability corresponds to a classification problem: given the
definition of the characteristics of a critical system in terms of the sixteen criteria above,
assign the vulnerability category (or class) to which the system belongs.
The classification model is based on the Majority Rule Sorting (MR-Sort) method
[7][14][15]; the model contains a group of (adjustable) parameters that have to be calibrated

7
by means of a set of empirical classification examples (the training set), i.e., a set of
alternatives with the corresponding pre-assigned vulnerability classes. Further details about
the classification model are not reported here for brevity: the interested reader is referred to
[16].
Figure 1. Hierarchical model for susceptibility to intentional hazards [16]
3. INVERSE CLASSIFICATION PROBLEM FOR PROTECTIVE
ACTIONS IDENTIFICATION
We define an inverse classification problem aimed at finding a combination of actions
reducing the vulnerability of a (group of) safety-critical system(s) eventually under budget
limitations.
8
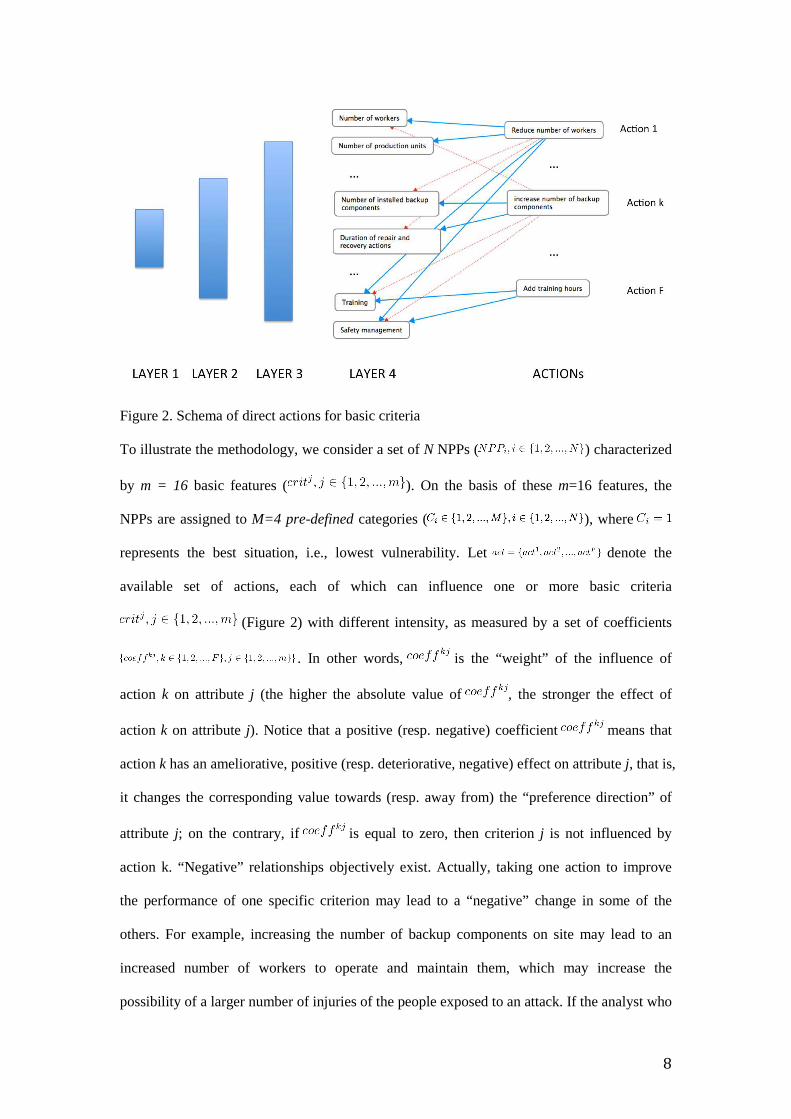
Figure 2. Schema of direct actions for basic criteria
To illustrate the methodology, we consider a set of N NPPs ( ) characterized
by m = 16 basic features ( ). On the basis of these m=16 features, the
NPPs are assigned to M=4 pre-defined categories ( ), where
represents the best situation, i.e., lowest vulnerability. Let denote the
available set of actions, each of which can influence one or more basic criteria
(Figure 2) with different intensity, as measured by a set of coefficients
. In other words, is the “weight” of the influence of
action k on attribute j (the higher the absolute value of , the stronger the effect of
action k on attribute j). Notice that a positive (resp. negative) coefficient means that
action k has an ameliorative, positive (resp. deteriorative, negative) effect on attribute j, that is,
it changes the corresponding value towards (resp. away from) the “preference direction” of
attribute j; on the contrary, if is equal to zero, then criterion j is not influenced by
action k. “Negative” relationships objectively exist. Actually, taking one action to improve
the performance of one specific criterion may lead to a “negative” change in some of the
others. For example, increasing the number of backup components on site may lead to an
increased number of workers to operate and maintain them, which may increase the
possibility of a larger number of injuries of the people exposed to an attack. If the analyst who

9
builds the inverse classification model were not able to identify and quantify these “negative”
connections (i.e., the coefficients ), then the (positive) effect of a given combination of
actions on a system could be overestimated, with serious drawbacks on the process of
resources allocation for system protection.
Significant efforts have been made to assign numerical values to the impacts of actions, in
order to represent the problem as realistically as possible. However in a non-fictitious
situation, the task is expected to be more complex. Actually, the relations between the actions
and the criteria taking into account the dependencies of different attributes and systems are
always difficult to identify: in such cases, resorting to the judgment of real experts and
possibly to real historical data will be mandatory.
The implementation of one or more actions modifies the attribute values
and as a result, the vulnerability of the system (i.e., the assignment by the classification model)
may change. In this paper, we assume that the total effect of the available set of actions
on criterion j is obtained by a linear superposition of the effects of
each action :
(1)
where is the value of attribute j after the identified set of available actions has been
implemented.
Also, let denote the cost of the combination of actions applied to
. The inverse classification problem can then be formulated as follows: identify the set
of actions that improve the vulnerability of the system to a demanded
vulnerability category while minimizing the cost, i.e.,
(2)
Alternatively, if it is known that the budget Bi is limited for each plant NPPi, the formulation
becomes: improve the systems to the best possible vulnerability category

10
, while keeping the cost below the available budget B:
(3)
To address the inverse classification problem, we adopt a pragmatic approach based on
sensitivity analysis [17][18][19], introducing indicators that quantify the variation in the
vulnerability class that a safety-critical system is expected to undergo upon implementation of
a given set of actions.
4 SENSITIVITY INDICATORS FOR DRIVING THE INVERSE
CLASSIFICATION PROBLEM
We consider the group of N’ vulnerability-class labeled known (available) safety-critical
systems (NPPs) used to train the MR-Sort classification model and study the sensitivity of
their categories of vulnerability to the implementation of the available protective actions. We
denote the original categories of these NPPs as and the new
categories resulting from the application of a set of protective actions as
.
Let be the number of NPPs that are improved after the action(s):
(4)
Then, can be interpreted as an estimate of the percentage of new (i.e., different from the
ones of the training set) NPPs that can be expected to be improved after such action(s) is (are)
implemented on them.
Dually, , is the number of NPPs that are expected to be deteriorated after the action(s):

11
(5)
Notice that a “deterioration” (i.e., an increase in the vulnerability category) is possible
because some of the actions may have positive effects on some subcriteria but negative
effects on some others (see Section 3). Then, can be interpreted as an estimate of the
percentage of new NPPs (i.e., different from the ones of the training set) that can be expected
to be deteriorated after such action(s) is (are) implemented on them.
We consider the quantity to combine the effects of both positive and
negative influences of the actions in the expected “net” amount of ameliorated NPPs.
Considering that the evaluation framework is based on M=4 categories, it seems reasonable to
consider not only the number of NPPs that are ameliorated or deteriorated, but also the
amount of variation in category of vulnerability of each of them. To this aim, we introduce
the following indicators to combine the amount of variation in vulnerability with the number
of NPPs whose vulnerability category has changed after the actions.
In particular, is defined as the total variation of category underwent by the ameliorated
NPPs:
(6)
Thus, can be interpreted as the variation in vulnerability category that a new
ameliorated plant is expected to undergo when the chosen combination of actions is applied.
Dually, is defined as:

12
(7)
Thus, can be seen as the variation in vulnerability category that a new deteriorated
plant is expected to undergo when the chosen combination of actions is applied.
Finally, combines the effects of both positive and negative influences
of the actions and it can be seen as the “net” variation in vulnerability category that a newly
analyzed NPP is expected to undergo after the application of the given set of actions.
The net expected variation in vulnerability category quantifies the influence of the
actions upon the NPPs. However, this measure does not take into account the original
category assignment of the NPPs: for example, in practice there is a difference between
taking a NPP from category 4 to 3 and taking it from 2 to 1, even if the category variation is 1
in both cases. To consider this, we introduce the indicator , defined as the ratio between
the sums of the variations of vulnerability category underwent by the ameliorated NPPs and
the sum of the corresponding maximum possible category variations (i.e., the sum of the
category variations that the NPPs would undergo if they were ameliorated to the best possible
vulnerability category):
(8)
The indicator quantifies the influence of the actions on NPPs, relative to their original
categories: the lower is, the higher the influence of the chosen set of actions is on the
NPPs originally of a relatively low category.
Based on the above indicators, an algorithm is proposed to rank different combinations of
actions according to their effectiveness in reducing the vulnerability of safety-critical systems.

13
The actions with positive influences are obviously preferred. On the contrary, concerning the
ones with negative influences, the rationality of being chosen as ameliorative actions should
be reconsidered. The analyst may replace/modify/delete them from the original considered
action set. The algorithm proceeds as follows:
(1) Rank the (combinations of) actions according to the value of (the higher the value of
, the more effective the combination of actions in reducing vulnerability):
• combinations of actions that have a negative value of ( <0) are expected to
increase the vulnerability of a NPP: this is due to the fact that some actions may have
a deteriorated effect on some of the subcriteria that more than counter balances the
positive effects on their subcriteria. The identification of the combination of actions
with <0 allows the analyst to (i) study the mechanisms of influence of the actions
on the basic subcriteria (Layer 4 in Figures 1 and 2) and (ii) if possible, eliminate the
“negative connections”, i.e., the negative dependencies between some actions and
some criteria (e.g., by identifying alternative actions for dealing with these “critical”
subcriteria);
• the actions that have a positive value of ( >0) are expected to reduce the
vulnerability and are assigned higher rankings (the higher , the higher the
ranking);
(2) If several combinations of actions have the same value of , then consider the other
indicators (i.e., and ): depending on the judgment of the DMs, higher importance
may be given to those actions that produce a larger expected number of improved NPPs ( )
or to those that generate a higher “expected class improvement” ( ).
(3) If some combinations still have the same ranking, analyze indicator to check which
actions have stronger impact on the NPPs of low categories.

14
Figure 3. Schema of decision logic for selecting an action
5 CASE STUDY
The sensitivity analysis proposed in Section 4 is applied on a case study concerning the
vulnerability analysis of NPPs [6]. We refer to the n=6 main criteria of the
hierarchical modeling presented in [6] and recalled in Section 2: physical characteristics (x1),
social criticality (x2), possibility of cascading failures (x3), recovery means (x4), human
preparedness (x5) and level of protection (x6); these criteria are numbers scaled in the range
[0,1]. Then, the main criteria are successively broken into a layer of m=16 basic criteria
(Figure 2). Finally, M=4 vulnerability categories are defined as: 1=
satisfactory, 2= acceptable, 3= problematic and 4 = serious (Section 2).
As shown in Figure 2 and anticipated in Section 3, we define F=13 direct actions
, each acting on one or more subcriteria (Table 1). All the actions have
multiple influences on different criteria, with possibly positive or negative effects: for
example, the action “reduce the number of workers” has an obvious direct influence on the
subcriterion “Number of workers”, but may also imply, e.g., (i) reducing the number of
production units, the number of accesses to the plant, the number of installed backup
components and external emergency measures; (ii) increasing the duration of repair and
recovery actions; (iii) enhancing the training; (iv) facilitating the safety management and
15
entrancing control and surveillance. The strengths of the influences of the actions on the
different criteria are quantified by the different weights/coefficients reported in Table 1.
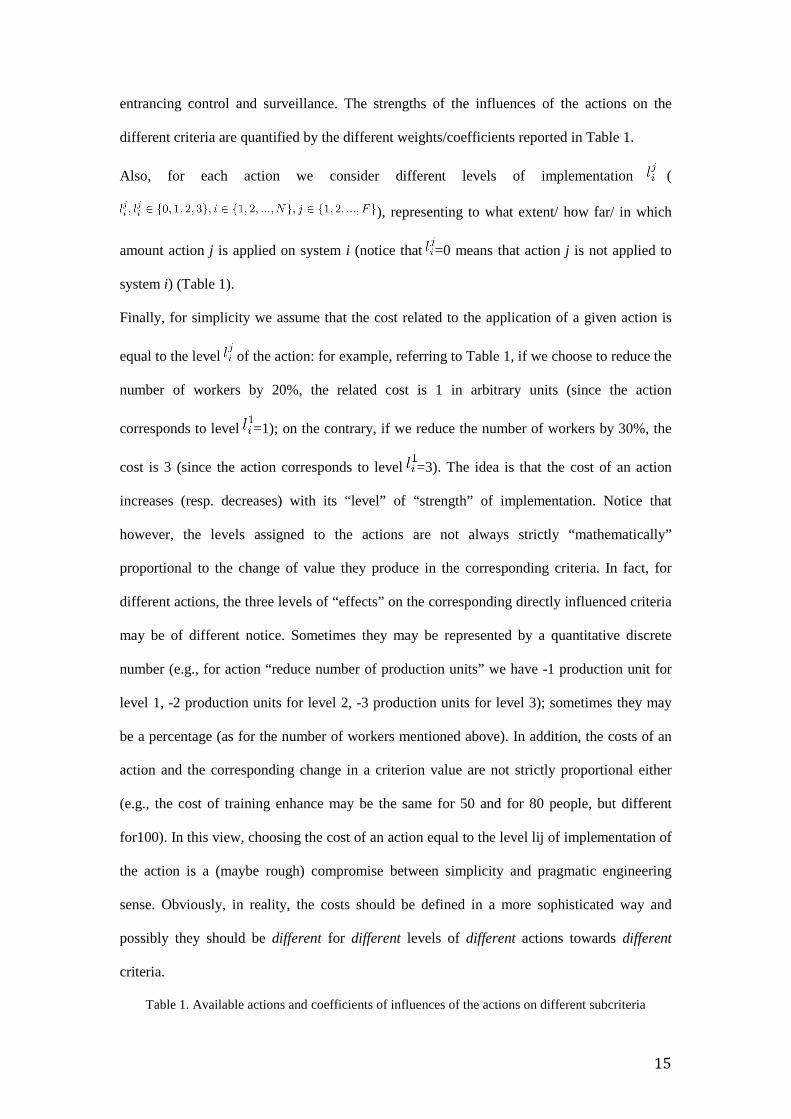
Also, for each action we consider different levels of implementation (
), representing to what extent/ how far/ in which
amount action j is applied on system i (notice that =0 means that action j is not applied to
system i) (Table 1).
Finally, for simplicity we assume that the cost related to the application of a given action is
equal to the level of the action: for example, referring to Table 1, if we choose to reduce the
number of workers by 20%, the related cost is 1 in arbitrary units (since the action
corresponds to level =1); on the contrary, if we reduce the number of workers by 30%, the
cost is 3 (since the action corresponds to level =3). The idea is that the cost of an action
increases (resp. decreases) with its “level” of “strength” of implementation. Notice that
however, the levels assigned to the actions are not always strictly “mathematically”
proportional to the change of value they produce in the corresponding criteria. In fact, for
different actions, the three levels of “effects” on the corresponding directly influenced criteria
may be of different notice. Sometimes they may be represented by a quantitative discrete
number (e.g., for action “reduce number of production units” we have -1 production unit for
level 1, -2 production units for level 2, -3 production units for level 3); sometimes they may
be a percentage (as for the number of workers mentioned above). In addition, the costs of an
action and the corresponding change in a criterion value are not strictly proportional either
(e.g., the cost of training enhance may be the same for 50 and for 80 people, but different
for100). In this view, choosing the cost of an action equal to the level lij of implementation of
the action is a (maybe rough) compromise between simplicity and pragmatic engineering
sense. Obviously, in reality, the costs should be defined in a more sophisticated way and
possibly they should be different for different levels of different actions towards different
criteria.
Table 1. Available actions and coefficients of influences of the actions on different subcriteria

16
No. Action description
act1 Reduce number of workers
act2 Reduce nominal power production
act3 Reduce number of production units
act4 Reduce percentage of contribution to the welfare
act5 Increase number of installed backup components
act6 Increase external emergency measures
act7 Increase duration of backup component
act8 Reduce duration of repair and recovery actions
act9 Enhance training
act10 Enhance safety management
act11 Reduce number of accesses
act12 Enhance entrance control
act13 Enhance surveillance
Number
of
workers
Nominal
power
production
Number
of
production
units
Percentage
of
contribution
to the
welfare
Size
of
served
cities
Connection
distance
Number of
installed
backup
components
External
emergency
measures
Actions Crit1 Crit2 Crit3 Crit4 Crit5 Crit6 Crit7 Crit8
act1 1 0 1 0 0 0 -0.4 -1
act2 0 1 0 1 0 0 0 0
act3 0.7 1 1 0 0 0 0.6 0
act4 0 0 0 1 -1 0 0 0
act5 -0.2 0 0 0 0 0 1 0
act6 -0.1 0 0 0 0 0 0 1
act7 0 0 0 0 0 0 0 0
act8 0 0 0 0 0 0 0 0

17
act9 0 0 0 0 0 0 0 0
act10 0 0 0 0 0 0 0 0
act11 0 0 0 0 0 0 0 0
act12 0 0 0 0 0 0 0 0
act13 0 0 0 0 0 0 0 0
Duration
of backup
component
Duration of
repair and
recovery
actions
Training Safety
management
Physical
size of
the
system
Number of
accesses
Entrance
control Surveillance
Actions Crit9 Crit10 Crit11 Crit12 Crit13 Crit14 Crit15 Crit16
act1 0 -0.2 0.5 0.5 0 1 0.4 0.4
act2 0 0 0 0.2 0 0 0 0
act3 0.2 0.3 0.4 0.2 0.7 0 0 0.3
act4 0 0 0 0.1 0 0 0 0
act5 0.5 0 -0.2 0.1 0 0 0 -0.15
act6 0.3 0 -0.1 0.05 -0.3 0 0 -0.05
act7 1 0 0 0.1 0 0 0 0
act8 0 1 -0.2 0.1 0 0 0 0
act9 0 0.5 1 0.2 0 0 0.2 0
act10 0 0 -0.2 1 0 0 0 0
act11 0 0 -0.1 0.1 0 1 0.4 0.1
act12 0 0 -0.1 0.1 0 0 1 0
act13 0 0 0 0.2 0 0 0 1
No. level1 level2 level3
act1 20% 25% 30%
act2 20% 30% 40%
act3 1 2 3
act4 10% 20% 30%
act5 1 2 3
act6 0.5 1 2
act7 12 24 48
18
act8 6 12 24
act9 1 3 5
act10 1 3 5
act11 1 2 3
act12 1 2 3
act13 1 2 3
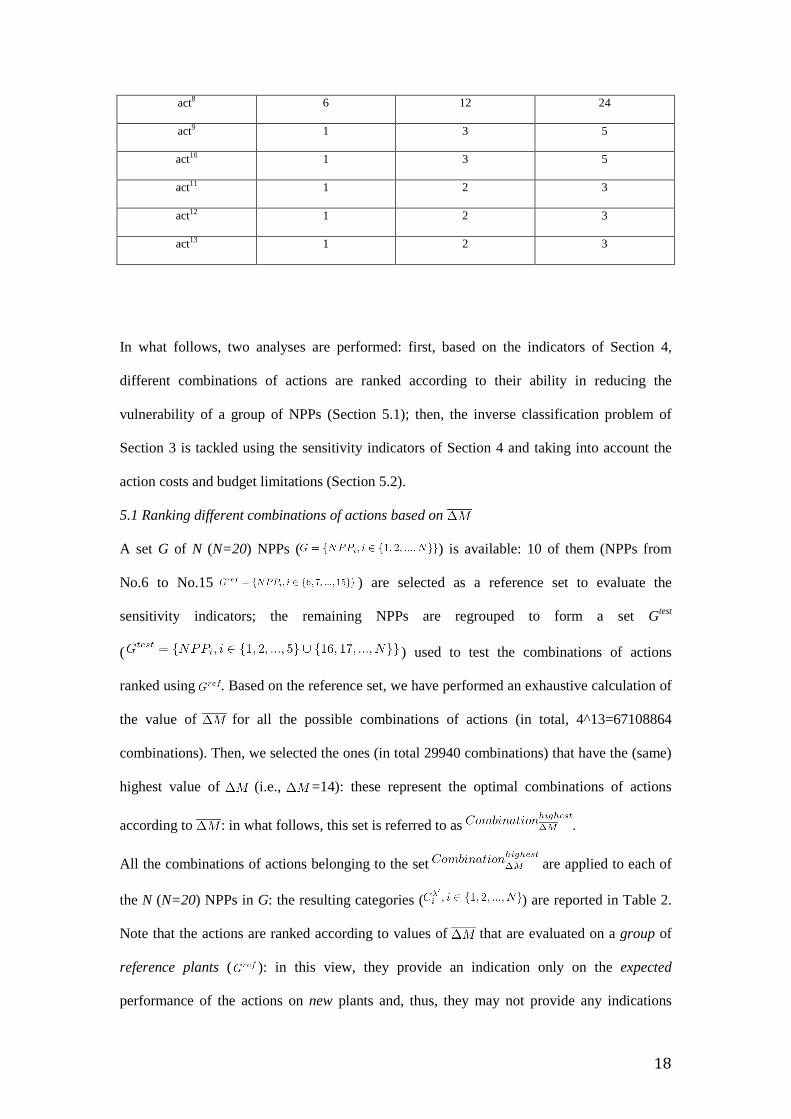
In what follows, two analyses are performed: first, based on the indicators of Section 4,
different combinations of actions are ranked according to their ability in reducing the
vulnerability of a group of NPPs (Section 5.1); then, the inverse classification problem of
Section 3 is tackled using the sensitivity indicators of Section 4 and taking into account the
action costs and budget limitations (Section 5.2).
5.1 Ranking different combinations of actions based on
A set G of N (N=20) NPPs ( ) is available: 10 of them (NPPs from
No.6 to No.15 ) are selected as a reference set to evaluate the
sensitivity indicators; the remaining NPPs are regrouped to form a set Gtest
( ) used to test the combinations of actions
ranked using . Based on the reference set, we have performed an exhaustive calculation of
the value of for all the possible combinations of actions (in total, 4^13=67108864
combinations). Then, we selected the ones (in total 29940 combinations) that have the (same)
highest value of (i.e., =14): these represent the optimal combinations of actions
according to : in what follows, this set is referred to as .
All the combinations of actions belonging to the set are applied to each of
the N (N=20) NPPs in G: the resulting categories ( ) are reported in Table 2.
Note that the actions are ranked according to values of that are evaluated on a group of
reference plants ( ): in this view, they provide an indication only on the expected
performance of the actions on new plants and, thus, they may not provide any indications

19
about the combination of actions that is optimal for one particular plant. Thus, in order to
verify how close these sets of actions are to the combinations that are optimal for a particular
NPP, we compare the assignments (Table 2) with the best category that each NPP may
reach ( ) (in other words, is the category that NPPi reaches after the
application of a combination of actions that is the optimal one for that particular plant). In
order to do so, another exhaustive calculation is done upon the group G with the purpose of
finding the actions that bring each particular NPP to the best category possible (notice that for
some NPPs, reaching category 1 may not be possible). All the possible combinations of
actions are tested on each NPP in order to find the best assignment for each of them. The
results are shown in Table 2. The first column of the results shows the original assignments
for the NPPs in the studied set G. The second column shows the corresponding possibly best
assignments and the third column provides the new assignments after the application
of the combinations of actions included in .
Analyzing the best assignments of the NPPs in the reference set , we
observe that they coincide perfectly (100%) with the assignments obtained
after the application of the actions in . If we take the NPPs in the test set as
new NPPs and compare the assignments obtained by these two methods with the original
assignments , we find that: (i) all the NPPs are stable or
ameliorated after the application of the combinations of actions in ; (ii)
there are 2 out of 10 NPPs that are not ameliorated to the best category (i.e., NPPs 16 and
19): they remain in the same category; instead, 8 out of 10 NPPs are ameliorated to their best
possible categories: then, the probability that the combinations of actions
ameliorate a new NPP to its best possible category is 80%.
Table 2. Comparison of assignments: Best possible Assignment and After action
Assignment listed with NPPs that are differently assigned highlighted (NPP16, NPP19)

20
No. Original Assignment Best possible Assignment
���
After action Assignment
���′
NPP1 1 1 1
NPP2 3 3 3
NPP3 2 2 2
NPP4 3 1 1
NPP5 3 2 2
NPP6 2 1 1
NPP7 2 1 1
NPP8 4 2 2
NPP9 4 2 2
NPP10 4 3 3
NPP11 1 1 1
NPP12 2 1 1
NPP13 3 2 2
NPP14 3 1 1
NPP15 4 1 1
NPP16 3 2 3
NPP17 2 2 2
NPP18 3 2 2
NPP19 3 2 3
NPP20 2 1 1
5.2 Constrained inverse problem: identification of the best combination of actions
considering constraints
In a more realistic case, the cost of the protective actions should be considered. Although in
reality the costs of different actions can be different, and the same action may cost differently
when applied to different NPPs, for simplicity, in this paper we define the of a
combination of actions (in arbitrary units) as the sum of the levels of the actions:

21
(9)
We assume that a budget is allocated for the improvement of the generic power plant
: the budgets allocated for the NPPs of the test set
are shown in Table 3.
Table 3. Budgets available for the NPPs belonging to the test set Gtest
No. Budget ��
NPP1 10
NPP2 25
NPP3 15
NPP4 5
NPP5 16
NPP16 19
NPP17 10
NPP18 23
NPP19 9
NPP20 17
As before, we take the reference set to calculate the value of for
all possible combinations of actions. Then, for each NPP in the test set , we identify the
combination(s) of actions with the highest value of and whose costs
are lower than or equal to the given budgets :
(10)

22
The results are shown in Table 4. Among all the possible combinations of actions, the ones
that present the highest value of ( ) have a minimum cost . So,
all the NPPs in the test set that have a budget higher than or equal to (i.e., NPP2,
NPP16 and NPP18) can be ameliorated to their corresponding best possible categories (as
presented in Section 4). Five of the remaining NPPs (i.e., NPP1, NPP3, NPP17, NPP19 and
NPP20) can still be ameliorated to the same category that would be obtained by the actions in
the set , even though they have a budget, which is lower than,
and a performance lower than .
Table 4. Assignments comparison
No. Original
Assignment
Best possible
Assignment Best Assignment
Limited Budget
Assignment
NPP1 1 1 1 1
NPP2 3 3 3 3
NPP3 2 2 2 2
NPP4 3 1 1 1 or 2
NPP5 3 2 2 2 or 3
NPP16 3 2 3 3
NPP17 2 2 2 2
NPP18 3 2 2 2
NPP19 3 2 3 3
NPP20 2 1 1 1
The situation is different for NPP4 and NPP5 (Table 5). They are originally assigned to
category 3. NPP4 can be ameliorated by any combination of actions belonging to
. Among all the combinations of actions that have the best value of equal
to 7 and cost limited by the given budget, 73.91% can bring NPP4 up to category 2 and 26.09%
can bring it to the best category. Instead, NPP5 cannot be ameliorated to the best category by
any of the combinations: in particular, 18.52% of the actions leave such NPP in category 3
whereas 81.48% bring it up to category 2.

23
Table 5. Assignments for NPP4 and NPP5
Assignment 3 2 1
NPP4 o.oo% 73.91% 26.09%
NPP5 18.52% 81.48% 0.00%
6 CONCLUSIONS
In this paper, we have developed a pragmatic inverse classification framework for identifying
ameliorative action(s) to reduce the vulnerability with respect to intentional hazards of safety-
critical systems (in the example of reference, Nuclear Power Plants-NPPs). An MR-sort
classification model calibrated on a small-sized set of data representing a priori-known
classification examples has been used. Sensitivity indicators have been introduced to evaluate
combinations of actions with respect to their ability to reduce the vulnerability of the safety-
critical systems considered. A case study referring to NPPs vulnerability to intentional attacks
has been worked out. The results show that the actions ranked as best according to the
proposed indicators give a satisfactory performance in terms of reduction of vulnerability in
test NPPs, even in presence of budget constraints: for example, in the case without budget
constraints eight out of ten NPPs are ameliorated to their best possible categories, whereas
two of them remain in the same categories; in the constrained case still six of the ten NPPs are
brought to their best possible vulnerability classes.
The proposed methodological framework provides a powerful tool for systematically and
pragmatically evaluating the safety and vulnerability as well as other characteristics of critical
systems.
For future research, the following issues will be considered. Since one set of weights is
usually an insufficient basis for giving priorities, the sensitivity of investment priorities to the
weights of criteria can be tackle: for example, in [22][23][24] a "scenario" is introduced that
reflects a set of weights for each stakeholder, such as emphasis on particular aspects of safety
in the aftermath of a major nuclear incident.

24
As presented in [25], an influential set of weights can suggest R&D priorities in protection of
energy systems.
Moreover, a set of weights can also be brought by other stakeholders, such as owners,
operators and users etc: each set of weights presumably leads to variation in the preferred
safety investments [26].
In addition, although in this work significant efforts have been made to assign numerical
values to the impacts of actions (in order to represent the problem as realistically as possible),
in a non-fictitious situation the task is expected to be more complex. Actually, the relations
between the actions and the criteria taking into account the dependencies of different
attributes and systems are always difficult to identify: in such cases, resorting to the judgment
of real experts and possibly to real historical data will be mandatory.
Finally, the inverse classification problem could be tackled within an optimization framework.
Proper optimization algorithms could be considered for the optimal selection of protective
actions to apply to each considered safety-critical systems (e.g., NPP). The results can, then,
be compared with the ones obtained by the sensitivity indicators proposed in the present paper.
REFERENCES
1 Kröger W, Zio E. Vulnerable Systems. UK, London: Springer, 2001.�
2 Aven T. Foundations of Risk Analysis. Berlin: Wiley, N.J, 2003.�
3 Aven T. Some reflections on uncertainty analysis and management. Reliability Engineering
and System Safety, 2010; 95, 195-201.�
4 Aven T. Misconceptions of Risk. Chichester: Wiley, 2010.�
5 Aven T, Heide B. Reliability and validity of risk analysis. Reliability Engineering and
System Safety, 2009; 94, 1862–1868.�
6 Wang TR, Mousseau V, Zio E. A Hierarchical Decision Making Framework for
Vulnerability Analysis. Proceedings of ESREL2013, Sep 2013, Amsterdam, Netherlands.
pp.1-8.

25
7 Leroy A, Mousseau V, Pirlot M. Learning the parameters of a multiple criteria sorting
method, The Second International Conference on Algorithmic Decision Theory,Algorithmic
Decision Theory, R.I. Brafman, F. Roberts, and A. Tsoukiàs (Eds.): ADT 2011, LNAI 6992,
pp. 219–233, Germany, Berlin: Springer, 2011
8 Charu C, Chen C, Jiawei H. The Inverse Classification Problem, JOURNAL OF
COMPUTER SCIENCE AND TECHNOLOGY 25(3): 458–468 May 2010
9 Aggarwal CC, Chen C, Jiawei H. On the Inverse Classification Problem and its
Applications. Data Engineering, 2006. ICDE '06. Proceedings of the 22nd International
Conference, 2006. IEEE.
10 Aiguo L, Xin Z, Jiulong Z. Performance Analysis of Quantitative Attributes Inverse
Classification Problem. JOURNAL OF COMPUTERS, Vol.7, No. 5, May 2012.
11. Aven T, Flage R. Use of decision criteria based on expected values to support decision-
making in a production assurance and safety setting. Reliability Engineering and System
Safety, 2009; 94, 1491-1498.
12 Hofmann M, Kjølle G, Gjerde O. Development of indicators to monitor vulnerabilities in
power systems, 2012 International Conference on Probabilistic Safety Assessment and
Management (PSAM 11) & European Safety and RELiability Conference (ESREL 2012);
Helsinki, Finland.
13 NWRA, N. W. R. A. Risk assessment methods for water infrastructure systems, Rhode
Island Water Resources Center, University of Rhode Island, Kingston, RI. 2012.�
14. Roy B. The outranking approach and the foundations of ELECTRE methods. Theory and
Decision 31, 1991, 49- 73.
15. Mousseau V., Slowinski R. Inferring an ELECTRE TRI Model from Assignment
Examples. Journal of Global Optimization, vol. 12, 1998, 157-174.
16 Wang TR, Mousseau V, Pedroni N, Zio E. Assessing the confidence of a classification-
based vulnerability analysis model, Risk Analysis, doi:10.1111/risa. 12305, 2014.
17 Saltelli A, Ratto M, Andres T, Campolongo F, Carboni J, Gatelli D, Saisana M, Tarantola
S. Global sensitivity analysis. The primer. Chichester: Wiley, 2008.�

26
18 Iooss B, Lemaître P. A review on global sensitivity analysis methods. Global sensitivity
analysis, 2014
19 Saltelli A, Tarantola S, Campolongo F, Ratto M. Sensitivity analysis in practice.
Chichester: Wiley, 2004
20 Rocco C, Zio E. Bootstrap-based techiniques for computing confidence intervals in monte
carlo system reliability evaluation. �Reliability and Maintainability Symposium, 2005.
Proceedings. Annual. Page(s): 303 - 307.
21 Levitin, G., Hausken, K., and Ben Haim, H. (2013), "Defending Majority Voting Systems
Against a Strategic Attacker," Reliability Engineering & System Safety 111, 1, 37-44.
22 Thekdi, S.A., and J.H. Lambert 2014. Quantification of scenarios and stakeholders
influencing priorities for risk mitigation in infrastructure systems. ASCE Journal of
Management in Engineering. 30(1):32-40.
23 Karvetski, C.W., and J.H. Lambert 2012. Evaluating deep uncertainties in strategic
priority-setting with an application to facility energy investments. Systems
Engineering. 15(4): 483-493.
24 Martinez, L.J., J.H. Lambert, and C. Karvetski 2011. Scenario-informed multiple criteria
analysis for prioritizing investments in electricity capacity expansion. Reliability Engineering
and System Safety. 96: 883-891.
25 Hamilton, M.C., J.H. Lambert, J.W. Keisler, I. Linkov, and F.M. Holcomb. 2013.
Research and development priorities for energy islanding of military and industrial
installations. ASCE Journal of Infrastructure Systems. 19(3):297-305.
26 Rogerson, E.C. and J.H. Lambert 2012. Prioritizing risk via several expert perspectives
with application to airport runway safety. Reliability Engineering and System Safety. 103: 22-
34.
27 Joshi, N.N. and J.H. Lambert 2011. Diversification of engineering infrastructure
investments for emergent and unknown non-systematic risks. Journal of Risk Research. 14(4):
1466-4461.

27
28 Lambert, J.H. and M.W. Farrington 2007. Cost-benefit functions for the allocation of
security sensors for air contaminants. Reliability Engineering and System Safety. 92(7):930-
946.
29 Zio E. An Introduction to the Basics of Reliability and Risk Analysis. World Scientific Publishing Co, 2007.
30 Larsson, J.E. Knowledge-based methods for control systems. PhD dissertation, Lund Institute of Technology, Department of Automatic Control, 1992.
31 Doumpos, M. and C. Zopounidis 2002. Multricriteria Decision Aid Classification Methods, Kluwer Academic Publishers, Netherlands. �2002, ISBN 1- 4020-0805-8.
APPENDIX A CLASSIFICATION MODEL FOR VULNERABILITY
ANALYSIS: THE MAJORITY RULE SORTING (MR-SORT) METHOD
The Majority Rule Sorting Model (MR-Sort) method is a simplified version of ELECTRE Tri,
an outranking sorting procedure in which the assignment of an alternative to a given category
is determined using a complex concordance non-discordance rule (14)(15). We assume that
the alternative to be classified (in this paper, a safety- critical system or infrastructure of
interests, e.g., a nuclear power plant) can be described by an n-tuple of elements x = {x1, x2, ...,
xi, ..., xn}, which represent the evaluation of the alternative with respect to a set of n criteria
(by way of example, in the present paper the criteria used to evaluate the vulnerability of a
safety critical system of interest may include its physical characteristics, social criticality,
level of protection and so on: see Section 2). We denote the set of criteria by N = {1, 2, ...,
i, ..., n} and assume that the values xi of criterion i range in the set Xi (20) (for example, in the
present paper all the criteria range in [0, 1]). The MR-Sort procedure allows assigning any
alternative to a particular
pre-defined category (in this paper, a class of vulnerability), in a given ordered set of
categories, {Ch : h = 1, 2, ..., M}; as mentioned in Section 2, M = 4 categories are considered

28
in this work: A1 = satisfactory, A2 = acceptable, A3 = problematic, A4 = serious.
To this aim, the model is further specialized in the following way:
• We assume that Xi is a subset of for all and the sub-intervals
of are compatible with the order on the real numbers, i.e., for all
, we have . We assume
furthermore that each interval has a smallest element , which implies
that . The vector (containing the lower bounds of in the
intervals of criteria in correspondence of category h) represents the
lower limit profile of category .
• There is a weight associated with each criterion , quantifying the
relative importance of criterion i in the vulnerability assessment process; notice that the
weights are normalized such that .
In this framework, a given alternative is assigned to category
, iff�
(A.1)
where λ is a threshold (0 ≤ λ ≤ 1, e.g., in this paper λ=0.9) chosen by the analyst. Rule
(A.1) is interpreted as follows. An alternative x belongs to category if: 1) its
evaluations in correspondence of the n criteria (i.e., the values ) are at
least as good as ( lower limit of category Ah with respect to criterion i), ,
on a subset of criteria that has sufficient importance (in other words, on a subset of
criteria that has a weight larger than or equal to the threshold λ chosen by the analyst);
and at the same time 2) the weight of the subset of criteria on which the evaluations
are at least as good as (lower limit of the successive category
with respect to criterion i ), , is not sufficient to justify the assignment of x
to the successive category .�
Notice that alternative x is assigned to the best category if and it

29
is assigned to the worst category if . Finally, it is
straightforward to notice that the parameters of such a model are the (M-1) · n lower
limit profiles (n limits for each of the M-1 categories), the n weights of the criteria
, and the threshold λ, for a total of (n·M+1) parameters.