identification of potential ground motion using the hvsr ... · identification of potential ground...
TRANSCRIPT

International Journal of Applied Environmental Sciences
ISSN 0973-6077 Volume 11, Number 6 (2016), pp. 1497-1507
© Research India Publications
http://www.ripublication.com
Identification of Potential Ground Motion Using the
HVSR Ground Shear Strain Approach in Wirogomo
Area, Banyubiru Subdistrict, Semarang Regency
Gatot Yuliyanto1, Udi Harmoko1 and Sugeng Widada2
1 Physics Department, Diponegoro University, Indonesia. 2 Oceanography Study Program, Diponegoro University, Indonesia.
Abstract
Wirogomo area in Semarang regency is made up of steep mountain
morphology that is prone to ground motion. This motion includes rock sliding
and rock fall. In 2009, there were two events of landslides. In 2010, there were
four similar events, and this was also repeated in 2015 with also four events.
On 6 January 2016, there were death casualties due to a landslide there,
despite the installation of an Early Warning System (EWS) by Semarang
regency Regional Disaster Mitigation Board (BPBD). Landslide data reveal
that all parts of Wirogomo area are prone to potential ground motion, and that
the spots, types, and number of installed EWS are not adequate. This is
because no proper zoning and characterization of ground motion is available
yet. Therefore, there needs to be an investigation as to which locations are
really prone to landslide. This means determining points of potential ground
motion, types of ground motion, and implementing mitigation efforts in terms
of both policy and technicalities. The approach used for those purposes is
Ground Shear Strain with HVSR (Horizontal to Vertical Spectrum Ratio)
analysis.Ground Shear Strain calculation that identifies potential land motion
in Banyubiru sub district using HVSR measurement shows that the mechanism
of ground motion in Wirogomo area is caused by landslide that stems from
rock fall. The highest GSS value was obtained in a zone behind SMPN 3
Banyubiru, at 0.018608.In general, it can be concluded that the most prone
zone is located south of Wirogomo (7.33839oS, 110.3819oE). This zone is
visually marked with remnants of earlier landslides. The controlling factors of
ground motion in Wirogomo area include slope (geomorphology), soil
condition (rocks making up the slope), and the slopes’ hydrology. Mitigation
efforts to reduce the risk of probable landslide effects include installation of

1498 Gatot Yuliyanto, Udi Harmoko and Sugeng Widada
ground motion detectors, rainfall detectors, and proper communication with
the local communities.
Keywords: ground motion, HVSR, ground shear strain, mitigation
INTRODUCTION
Wirogomo area in Semarang regency is part of the quarter volcano morphology in
Central Java. This morphology consists of steep mountains with volcanic sediment
making up its lithology. This makes this area prone to ground motion, whether it is
rock sliding or rock fall. Tectonic processes taking place in Central Java are deemed
to directly or indirectly responsible for this ground motion. Structures of faults in the
area cause secondary structures in the form of strikes. These strikes spilt rocks and
weaken inter-fraction bond. They also let rain water sips into the rocks and hence put
more burdens to them. The end results are landslides on steeper slopes.
Wirogomo is now a densely populated area. Therefore, potential landslides may cause
detrimental effects to the community, in terms of both material and even life. Based
on the database available in Banyubiru sub district, there were two events of
landslides in Kenda Duwur and Jeruk Wangi villages respectively. In 2010 there were
four events of landslide in Jeruk Wangi, Pule, Wirogomo Tengah, and Wirogomo Lor,
respectively. In addition, based on data from many sources, there were four events of
landslide in Wirogomo Tengah, Kendal Ngisor, Nlumpak, and Sebakung villages,
respectively. Other than that, on 6 January 2016, there was a landslide that cost a few
lives in Kendal Ngisor village, despite the available EWS (Early Warning System)
instruments set by Semarang regency Regional Disaster Mitigation Board (BPBD).
Landslide data reveal that all parts of Wirogomo area are prone to potential ground
motion, and that the spots, types, and number of installed EWS are not adequate. This
is because no proper zoning and characterization of ground motion is available yet.
Therefore, there needs to be an investigation as to which locations are really prone to
landslide. This means determining points of potential ground motion, types of ground
motion, and implementing mitigation efforts in terms of both policy and technicalities
Based on the elaboration above, this research aims to investigate ground motion in
Wirogomo area using the Ground Shear Strain approach with HVSR analysis
(Horizontal to Vertical Spectrum Ratio). This will in turn be base in determining
mitigation approaches. Mitigation is aimed at dealing with technicalities prior to a
disaster as to prevent any possible ground motion. Involvement of community
members is imperative for the proper use of suitable technology that makes the most
of locally available resources. Training for emergency readiness is also necessary for
the community members. A policy is also needed concerning evacuation routes, and
land use at the disaster scene. These must be integrated with the other mitigation
efforts, and the local government must be involved. Lastly, these measures must be
carried prior to any disaster from taking place.
Identification of Potential Ground Motion Using the HVSR Ground Shear Strain… 1499
GEOLOGY, MORPHOLOGY, AND CLIMATE
Geological conditions in terms of rock formation affect the bed rock and the incoming
sediments. Therefore, physical properties of upper soil cannot really be separated
from their underlying bed rock. Geological condition will also affect slope stability
and the landslide that may take place. Geological structure determines slope
properties. Formation, thickness, and position of the bed rock greatly affect stability
potential. Based on a geological map of Magelang and Semarang sheet (scaled
1:100.000)issued in 1996, the research area belongs to the rock formation of
Gilipetung Volcano. This formation is made of porous lava that is greyish, solid, and
ranges to soft granulation with small mafic phenocryst. It also contains volcanic
alteration rocks, sandy sediments, and a mixture of gravel, sand, and clay that is not
really solid. These rocks easily transform into soil under the process of decay and are
prone to sliding when they are located on steep slope. The soil type in the research
area is of sand with little clay in it. Its thickness in some survey points range from 0-
200 cm. The soil in this zone rests on a layer of volcanic rock. At 60% inclination,
this soil layer is very thin.
Field observations show that the area was formed from denudation. The soil type is
andosol that is grey in color with rough texture. The slopes have >40% inclination,
and some even have >60% inclination. There is no fountain in the area. The rainfall is
at <3000 mm/year. No slope cut off found. There are also no signs of pond and no
slope drainage either. No construction work is seen, and the land is predominantly
covered with bushes, shrubs, and pines.
Landslide is a result of imbalances that cause soil and rock masses to move from
higher to lower ground. These imbalances are due to the existing force in an uneven
land or land with slope. This force that actually holds the soil on the slope is affected
by ground water surface, physical properties of the soil, and the inner angle of the
shear resistance that works along the slope plane (Sutikno,1997).According
toCruden(1991),landslide is the movement of a mass of rocks, soils, and materials that
make up a slope down to the valley. Karnawati(2004)explains that landslides are
caused by factors that trigger and control ground motion. The controlling factors
include geomorphology, soil, geology, hydrogeology, and land use, whereas the
triggering factors include water infiltration into the slope, vibration, human activities or
disruption to the land. The natural factors causing landslides include surface
morphology, land use, lithology, geological structure, rainfall, and quakes. Other than
those factors, human activities also affect the landscape. This includes farming,
ground loading, slope cutting, and mining.
HVSR METHOD
Horizontal to Vertical Spectral Ratio (HVSR) is a method that calculates comparisons
of recorded horizontal seismic records against their vertical counterparts. It was
introduced by Nakamura (1989) to estimate resonance frequency and amplification
factor of local geological conditions from micro seismic data. HVSR was later used in
estimating ground susceptibility index (Nakamura, 1997), estimating
constructionsusceptibility index, (Sato et al., 2004; 2008), localizing areas prone to
1500 Gatot Yuliyanto, Udi Harmoko and Sugeng Widada
damages due to local effects (Panou et al., 2005; 2007), and
liquefaction(HuangandTseng,2002).Researches by Arai and Tokimatsu (1998; 2005),
Asten et al. (2002), Sungkono and Santosa, B.J. (2011), Warnana, (2011), Carlos, et
al (2004), Maksud and Midorikawa, (2006), and Nguyen et al. (2003) using the
HVSR method were able to map sediment material thickness qualitatively.
HVSR is usually used for passive seismic (micro tremor) of three components. The
most important parameters HVSR yield is natural frequency and
amplification.Measured HVSR of the ground is aimed at characterizing the local
geology, natural frequency and amplification, and related physical underground
parameters (Herak, 2008). On the other hand, measuredHVSR of buildings is meant to
figure out a building’s strength and balance(Nakamura, 2000 and Nakamura et
al.,2000). HVSR analysis results in values of maximum ground movement speed,
susceptibility index, and ground shear strain. Soil layer characteristics greatly
influence susceptibility index and ground acceleration at certain spots. Susceptibility
index in an index that describes ground surface susceptibility rate against
deformation. Knowing the maximum ground vibration acceleration and seismic
susceptibility index can help analyze the ground shear strain or soil layer’s ability to
stretch and shift upon receiving elastic wave propagation. Micro zonation of ground
shear strain helps map areas to look out for and figure spots of highest potential
ground movement probability.
MEASUREMENT POINTS
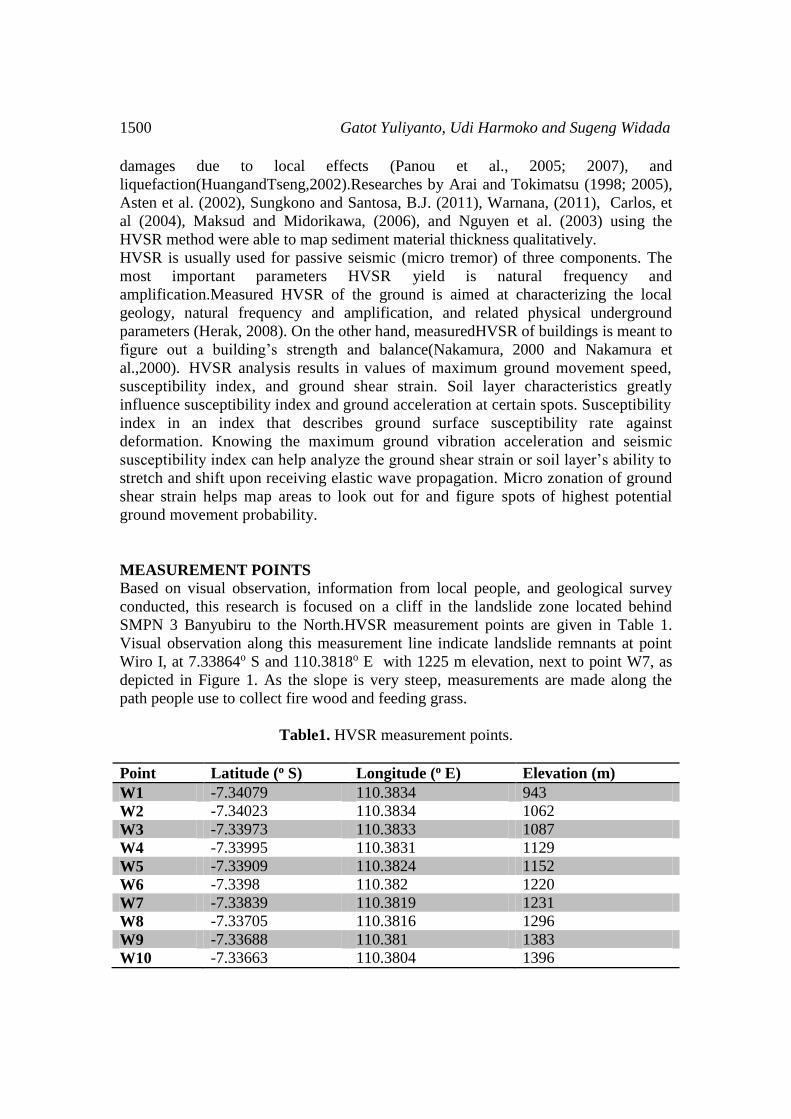
Based on visual observation, information from local people, and geological survey
conducted, this research is focused on a cliff in the landslide zone located behind
SMPN 3 Banyubiru to the North.HVSR measurement points are given in Table 1.
Visual observation along this measurement line indicate landslide remnants at point
Wiro I, at 7.33864o S and 110.3818o E with 1225 m elevation, next to point W7, as
depicted in Figure 1. As the slope is very steep, measurements are made along the
path people use to collect fire wood and feeding grass.
Table1. HVSR measurement points.
Point Latitude (o S) Longitude (o E) Elevation (m)
W1 -7.34079 110.3834 943
W2 -7.34023 110.3834 1062
W3 -7.33973 110.3833 1087
W4 -7.33995 110.3831 1129
W5 -7.33909 110.3824 1152
W6 -7.3398 110.382 1220
W7 -7.33839 110.3819 1231
W8 -7.33705 110.3816 1296
W9 -7.33688 110.381 1383
W10 -7.33663 110.3804 1396

Identification of Potential Ground Motion Using the HVSR Ground Shear Strain… 1501
Figure 1. Observed signs of earlier landslides behind SMPN 3 Banyubiru, at
7.33864o S and 110.3818o E with 1,225 m elevation.
HVSR MEASUREMENT RESULTS
Results of HVSR measurements are given in Table 2. Illustration of HVSR frequency
values from measurement points along observation line are given in Figure 2.
Meanwhile, Graph of frequency profiles against distance of measurement line is
shown in Figure 3.

1502 Gatot Yuliyanto, Udi Harmoko and Sugeng Widada
Table 2.Results of HVSR measurement.
Point Frequency (Hz) Period (s) Amplitude
W1 1.1 0.91 2.16
W2 0.64 1.56 1.98
W3 13.35 0.07 2.45
W4 4.57 0.22 4.36
W5 9.03 0.11 3.91
W6 11 0.09 2.01
W7 13.05 0.08 1.28
W8 12.04 0.08 2.44
W9 3.04 0.33 0.96
W10 6.94 0.14 1.7
Figure 2 Values of HVSR frequency at measurement points in UTM coordinate
It can be seen in Table 2 and Figure 2 that HVSR frequency distribution along
measurement line, which is points from W1 through W4 to the South, and points W8
to W9 to the North, is lower compared to frequency value at the center of the
measurement line. These frequency values show specific site frequency values that
will resonate and have maximum superposition when there are sources of waves with
the same frequency. The southern part of the measurement line is prone to landslide
that may be triggered by a quake wave as the characteristic natural waves are low in
frequency.

Identification of Potential Ground Motion Using the HVSR Ground Shear Strain… 1503
Figure 3 Graph of frequency profile against measurement distance. Black triangles
with W on top of them indicate measurement points
Values of HVSR amplitude describe ground amplification due to vibration sources
with certain frequencies. The greater the amplitude, the higher the sediment on top of
the bed rock is.In can be seen in Figure 3 that points from W1 through W7 have the
highest potential for rock fall the ground amplification is lower than that of points
from W7 to W9. Observations of previous landslides show that the landslides here are
of rock fall type.
Table 3 Results of ground shear strain calculation.
Point Vs30
(m/s) H (m)
Vb
(m/s)
Kg
(cm/s) (gal)
Ground
shear
strain
W1 754 171.4 1628.6 0.000264 58.62213 0.015484
W2 754 294.5 1492.9 0.000416 44.71365 0.018608
W3 754 14.1 1847.3 2.47E-05 204.2103 0.005041
W4 754 41.2 3287.4 0.000128 119.4817 0.015333
W5 753 20.8 2944.2 5.83E-05 167.9446 0.009795
W6 751 17.1 1509.5 2.47E-05 185.3696 0.004574
W7 752 14.4 962.6 1.32E-05 201.8878 0.002671
W8 751 15.6 1832.4 2.74E-05 193.9023 0.005307
W9 750 61.7 720.0 4.27E-05 97.43237 0.004161
W10 749 27.0 1273.3 3.32E-05 147.2113 0.004883
GROUND SHEAR STRAIN
Calculation of ground shear strain of the research area was carried out with the help of
data from Yogyakarta May 27, 2006 quake epicenter. It was located at 110.32o E and
8.03o S, at 11.3 km deep, with a magnitude of 5.9 Mb. The results are shown in Table
3. Ground shear strain distribution of research area and the corresponding value
profile from points W10 to W1are given in Figure 4. The highest values are observed
in points from W1 to W2 located behind SMPN 3 Banyubiru. Therefore, it can be
inferred that the landslide danger zone is just South of W7 (7.33839oS and
110.3819oE). There are also remnants of previous landslides at this site.

1504 Gatot Yuliyanto, Udi Harmoko and Sugeng Widada
Figure 4.Ground shear strain distribution along a measurement line (above) andthe
ground shear strain profile from points W10 to W1 (below). The zone South of W7
has high ground shear strain value.
CONCLUSION
Ground shear strain calculation to identify potential landslide zones in Banyubiru sub
district using HVSR measurementlead to the following conclusion:
1. The mechanism of ground motion that may lead to landslide in Wirogomo
area is of rock fall type.
2. The highest value of ground shear strain was observed in a zone behind SMPN
3 Banyubiru, at0.018608.
Identification of Potential Ground Motion Using the HVSR Ground Shear Strain… 1505
3. It is inferred that the most susceptible zone for landslide is located south of
point W7 (7.33839oS and 110.3819oE). This is elaborated with visually
observed remnants of past landslides.
4. Controlling factors that affect ground motion in Wirogomo area include land
inclination or slope (geomorphology), soil condition or rock make up, and
hydrology of the slope.
Therefore, mitigation efforts to prevent damages should include installment of early
detection systems, installment of rainfall measuring devices, and proper socialization
for the local community.
ACKNOWLEDGEMENT
The authors wish to extend their gratitude to Diponegoro University for the funding
allocated for this research via Sumber Dana PNBP DIPA Universitas Diponegoro No:
SP DIPA-042.01.2.400898/2016, dated 7 December 2015 for Fiscal Year 2016.
REFERENCES
[1] Arai, H. and Tokimatsu, K. 1998. Evaluation of local site effect based on
micro tremor H/V spectra. The Effect of Surface Geology on Seismic Motion,
Balkema, Rotterdam
[2] Arai,H.,andTokimatsu,K. 2005.S-wavevelocityprofilingby jointinversionof
microtremordispersion curveandhorizontal-to-vertical (H/V)spectrum.BSSA,
Vol.95,No.5,pp.1766-1778,October2005,doi:10.1785/0120040243
[3] Asriningrum, W. 2003. Indonesia Tidak Punya Peta Rawan Longsor.
http://www.terranet.or.id/goto_berita.php?id=5426. [14 August 2005]
[4] Asten, M.W. and Dhu, T., 2002. Enhanced interpretation of micro tremor
spectral ratios using multimode Rayleigh-Wave particle-motion computations,
in Total Risk Management in the Privatized Era, edited by M Griffith, D.
Love, P McBean, A McDougall, B. Butler, Proceedings of Conference,
Australian Earthquake Engineering Society. Adelaide, Paper 8.
[5] Carlos, S. et al, 2004. Seismic Vulnerability and Impact Analysis: Elements
for Mitigation Policies, XI Congresso Nazionale “L’ingegneria Sismica in
Italia”, Genova 25-29 gennaio 2004
[6] Carter, W.N. 1992. Disaster Management: A disaster manager’s handbook.
Asian Development Bank. Manila
[7] Cruden. 1991. A simple definition of landslide. Bulletin Int. Assoc. for
Engineering Geology. 43:27-29
[8] Gatot Y and U. Harmoko, 2011, Korelasi puncak frekuensi HVSR dengan
objek terpendam dalam lapisan sedimen. Prosiding Seminar Nasional
Penelitian, Pendidikan dan Penerapan MIPA, Fakultas MIPA, Universitas
Negeri Yogyakarta, 14 Mei 2011
1506 Gatot Yuliyanto, Udi Harmoko and Sugeng Widada
[9] Gatot Y., W. Suryanto, U. Harmoko, SB. Kirbani, and Waluyo, 2012, The
Dynamics of The Ocean Bottom Sediment Beneath OBS 9 MERAMEX
Station in July 2004 Using HVSR Analysis. International Journal of Basic &
Applied Sciences IJBAS-IJENS Vol:12 No:06
[10] Herak,M. . 2008.HVSR Model: aMatlabtooltomodelhorizontal-to-vertical
spectral ratioofambientnoise.ComputersandGeosciences34,1514–1526
[11] Huang, H.C., Tseng, Y.S. 2002. Characteristics of soil liquefaction using H/V
ofmicrotremorsinYuan-Lin Area, Taiwan. TAO, Vol. 13, No. 3, 325-338,
September2002
[12] Karnawati, D. 2004.Bencana Gerakan Massa Tanah/ Batuan di Indonesia;
Evaluasi dan Rekomendasi, Dalam Permasalahan, Kebijakan dan
Penanggulangan Bencana Tanah Longsor di Indonesia. P3-TPSLK BPPT dan
HSF. Jakarta
[13] Maksud , K. A. S. M. and Midorikawa,S., 2006. Geomorphological
Approach For Seismic Micro zoning Within Dhaka City Area, Bangladesh,
IAEG 2006 Paper Number 457, © The Geological Society Of London 2006
[14] Nakamura Y. 1989. A Method for Dynamic Characteristics Estimations of
Subsurface Using Micro tremors on the ground Surface, QR RTRI, 30, pp. 25-
33
[15] Nakamura, Y, 1996. Real-time information systems for seismic hazard
mitigation UrEDAS, HERAS and PIC. Q.R. of R.T.R.I., 37-3, 112-127
[16] Nakamura, Y. 1997. Seismic Vulnerability Indices For Ground And Structures
Using Micro tremor. World Congress on Railway Research, Florence, Nov.
[17] Nakamura,Y.2000.ClearidentificationoffundamentalideaofNakamura'stechniq
ue andits applications.ProcXII WorldConf.EarthquakeEngineering,New
Zealand,2656.
[18] Nakamura,Y.,E.D.Gurler,J.Saita,A.Rovelli,S.Donati.2000.Vulnerability
Investigation Of Roman ColiseumUsing Micro tremor. Prepared for 12th
WCEE2000inAuckland,NZ
[19] Nguyen, F., Van Rompaey, G., Teerlynck, H., Van Camp, M., Jougmans, D.
and Camelbeeck, T. 2003. Use of Micro tremor for Assessing Site Effect in
Northern Belgium-Interpretation of The Observed Intensity During The Mag.
5.0 June 11 1938 Earthquake. Journal of Seismology, Vol. 1-3.
[20] Panou,A.A.,N.Theodulidis,P.Hatzidimitriou,K.Stylianidis,C.B.Papazachos.20
05. Ambientnoisehorizontal-to-vertical spectralratioinsiteeffectsestimationand
correlationwithseismicdamagedistributioninurbanenvironment:thecaseof
thecityof Thessaloniki(NorthernGreece).SoilDynamicsandEarthquake
Engineering,Vol.25,pp:261–274
[21] Panou, A.A. 2007. Use Of Ambient Noise For Micro zonation Studies In
Urban Environment: The City Of Thessa Loniki (N. Greece), 4thInternational
Conference On Earthquake Geotechnical Engineering June 25-28, 2007 Paper
No. 1580
[22] Sato, T., Nakamura, Y., and Saita, J. 2004. Evaluation of The Amplification
Characteristics of Subsurface Using Micro tremor and Strong Motion: The
Identification of Potential Ground Motion Using the HVSR Ground Shear Strain… 1507
Studies at Mexico City.13 th
World Conference on Earthquake Engineering,
Paper No. 862, Vancouver, B.C., Canada
[23] Sato, T., Y. Nakamura, J. Saita. The Change Of The Dynamic Characteristics
Using Micro tremor.The 14t h World Conferenceon Earthquake Engineering
October 12-17, 2008, Beijing, China
[24] Smith, K. 2001. Environmental Hazards :Assessing Risk and Reducing
Disaster. Routledge. London
[25] Sungkono and Santosa B.J. 2011, Karakterisasi Kurva Horizontal-To-
Vertical Spectral Ratio: Kajian Literatur dan Permodelan, Jurnal Neutrino
Vol.4, No.1. October 2011
[26] Sutikno. 1994. Pendekatan Geomorfologi untuk Mitigasi Bencana Alam
Akibat Gerakan Massa Tanah/Batuan. Prosiding Seminar Mitigasi Bencana
Alam 16-17 September 1994. Kerjasama Fakultas Geografi UGM-Bakornas
Penanggulangan Bencana RI. Yogyakarta
[27] Warnana. D. D. 2011, Application of Micro tremor HVSR Method for
Assessing Site Effect in Residual Soil Slope, International Journal of Basic &
Applied Sciences IJBAS-IJENS Vol. 11 No: 04

1508 Gatot Yuliyanto, Udi Harmoko and Sugeng Widada