identification of molecuar interactions between …
TRANSCRIPT

IDENTIFICATION OF MOLECUAR INTERACTIONS BETWEEN SYNTHETIC
DYES AND FOOD MACROMOLECULES BY FLUORESCENCE SPECTROSCOPY
By
ZIQIAN QU
A thesis submitted to the
Graduate School-New Brunswick
Rutgers, The State University of New Jersey
In partial fulfillment of the requirements
For the degree of
Master of Science
Graduate Program in Food Science
Written under the direction of
Richard Ludescher
And approved by
_____________________________________
_____________________________________
_____________________________________
New Brunswick, New Jersey
May, 2017

ii
ABSTRACT OF THE THESIS
Identification of Molecular Interactions between Synthetic Dyes and Food
Macromolecules by Fluorescence Spectroscopy
by ZIQIAN QU
Thesis Director:
Richard Ludescher
Recent studies have demonstrated that in glycerol, glycerol-water, mono and
disaccharide solutions, the fluorescence emission intensity of GRAS synthetic colors
exhibits a strong sensitivity to the physical properties of the medium, for example, as the
viscosity increases, the fluorescence intensity increases. Although molecular mass,
structure and intrinsic rigidity of the macromolecule might play a role in probe sensitivity
in physical properties of the system, other aspects such as molecular interactions between
the probe and the macromolecule may explain these behaviors, such as hydrogen bonding,

iii
electrostatic interactions, hydrophobic interactions, etc. The nature of the effect of
macromolecules on the dye molecules are to be identified by fluorescence spectroscopy.
The fluorescence emission intensity was measured by titrating five carbohydrates
(alginate, amylopectin, carboxymethyl cellulose, chitosan and methylcellulose) and five
proteins (gelatin, gliadin, albumin, whey protein and zein) into three GRAS synthetic
dyes (allura red, sunset yellow and fast green) using a Fluoromax-3 (Horiba Scientific
Inc.). Temperature (20°C) and dye concentration were kept constant throughout the study.
Anisotropy, ionic strength and temperature studies were also carried out to further
explore the nature of the molecular interactions.
Results indicate that the fluorescence intensity of fast green is increased by the
addition of all water soluble proteins, which are BSA, whey protein and gelatin. It is
found that fast green exhibits a very strong binding with the bovine serum albumin
molecule, involving electrostatic interactions, hydrogen bonding and hydrophobic
interactions. Allura red, as an azo dye, shows less sensitivity to water-soluble protein
molecules, while it has hydrophobic interactions with methyl cellulose. Sunset yellow
does not show obvious sensitivity to any of the carbohydrates and proteins studied.
These results provide insights into the molecular interactions between synthetic dyes
and food macromolecules. Therefore, these findings can be used to enhance the
performance of these dyes as intrinsic luminescent probes for the physical state of foods
and can also contribute to the enhanced detection of synthetic dyes in food products.

iv
ACKNOWLEDGEMENTS
This project is supported by the Agriculture and Food Research Initiative Grant
no. 2014-67017-21649 from the USDA National Institute of Food and Agriculture,
Improving Food Quality –A1361.
I would like to show my gratitude to my academic advisor, Dr. Richard Ludescher,
who provided insight and expertise in this research project and guided me through the
thesis writing.
Also I am immensely grateful to Dr. Maria Corradini, for her academic and lab
training on me for two years. Her proficiency and patience has led to great improvements
on my research.
In addition, I have to express my appreciation to all the professors and lab mates in
Department of Food Science who have helped me during my research, including Dr. Paul
Takhistov, Karina Lewerissa, Yan Wang, Sarah Waxman, An Le, Danlei Chen, Haoxin
Chen, etc.
Furthermore, many thanks for all the advice given from Dr. Alan King and Dr. Kit
Yam as my committee members, and Dr. Loredana Quadro and Dr. Thomas Hartman as
chairs of the seminar.
Last but not least, I am very thankful to my parents who have been supporting my
graduate study both financially and mentally for the past three years at Rutgers
University New Brunswick.

v
TABLE OF CONTENTS
ABSTRACT OF THE THESIS ........................................................................................ ii
ACKNOWLEDGEMENTS ............................................................................................ iv
1. INTRODUCTION......................................................................................................... 1
1.1 FLUORESCENCE SPECTROSCOPY ................................................................................. 1
1.2 FOOD DYES ................................................................................................................ 9
1.3 PREVIOUS RESEARCHES ............................................................................................ 17
1.3.1 Food dyes as luminescent probes for physical properties ................................. 17
1.3.2 Interactions between food dyes and proteins .................................................... 19
1.4 OBJECTIVES .............................................................................................................. 21
2. METHODS .................................................................................................................. 23
2.1 MATERIALS ............................................................................................................... 23
2.2 INSTRUMENTS ........................................................................................................... 23
2.3 SAMPLE PREPARATION .............................................................................................. 24
2.4 MEASUREMENTS ....................................................................................................... 25
2.5 DATA ANALYSIS ........................................................................................................ 27
3. RESULTS AND DISCUSSION .................................................................................. 29
3.1 CHOOSING THE APPROPRIATE DYE CONCENTRATION ................................................. 29
3.2 DYE – CARBOHYDRATES FLUORESCENCE INTENSITY STUDY ..................................... 31

vi
3.2.1 Allura red – carbohydrates ................................................................................ 31
3.2.2 Sunset yellow – carbohydrates.......................................................................... 33
3.2.3 Fast green – carbohydrates................................................................................ 38
3.3 DYE – PROTEINS FLUORESCENCE INTENSITY STUDY ................................................. 39
3.3.1 Allura red – water-soluble proteins ................................................................... 40
3.3.2 Sunset yellow – proteins ................................................................................... 42
3.3.3 Fast green – proteins ......................................................................................... 43
3.3.4 Dyes with gliadin and zein ................................................................................ 46
3.4 DYE – MACROMOLECULE ANISOTROPY STUDY ......................................................... 49
3.4.1 Allura red anisotropy......................................................................................... 49
3.4.2 Sunset yellow anisotropy .................................................................................. 50
3.4.3 Fast green anisotropy ........................................................................................ 51
3.5 IONIC STRENGTH STUDY ........................................................................................... 53
3.5.1 Effect of constant salt solution .......................................................................... 53
3.5.2 Effect of varying concentration of salt solution ................................................ 58
3.6 TEMPERATURE STUDY ............................................................................................... 61
3.6.1 Effect of temperature on allura red – protein .................................................... 62
3.6.2 Effect of temperature on fast green – protein ................................................... 64
4. CONCLUSIONS ......................................................................................................... 66
REFERENCES ................................................................................................................ 68

1
Identification of Molecular Interactions between Synthetic
Dyes and Food Macromolecules by Fluorescence Spectroscopy
1. INTRODUCTION
1.1 Fluorescence Spectroscopy
UV-Vis luminescence spectroscopy is a widely-used technique to study the excited
states of molecules. The excited state processes can be illustrated by Jablonski diagram,
which is named after the famous Polish physicist Aleksander Jablonski (1898-1980). The
Jablonski diagram (Figure 1.1.1) is an energy diagram for the electronic transition of
molecules. Firstly, the photons may absorb energy from light, causing the electronic
transition from ground state (lower energy level S0) to excited singlet state (higher energy
levels S1 and S2). Then through vibrational relaxation, the molecule will quickly transit to
the lowest excited state energy level. Internal conversion, which is a similar process with
vibrational relaxation, causes an electron to transit from a higher excited state energy
level to a lower one when there are overlapping of energy levels. Finally, the
de-excitation process will take place either by emission of photons, which is called
fluorescence, or by non-radiative pathways with no photons emitted, called non-radiative
decay. For certain molecules under specific conditions, they will undergo intersystem
crossing from the singlet state S1 to the triplet excited state T1. Then the molecule can

2
also go through vibrational relaxation to its lowest excited triplet state energy level. The
de-excitation will occur either by non-radiative pathways with no photons emitted, or by
the radiative pathway called phosphorescence. The energy of triplet excited states is
lower than that of the singlet excited states.
Figure 1.1.1 Jablonski diagram
The time it takes for the different processes of electronic transitions shown in the
Jablonski diagram also differs. Absorption takes about 10-15 seconds, internal conversion
and vibrational relaxation needs 10-14 to 10-11 seconds, and non-radiative decay takes 10-7
to 10-5 seconds. Fluorescence takes 10-9 to 10-6 seconds, while phosphorescence can take
10-3 to 102 seconds. Usually the faster the transition, the more likely that process will
happen. Therefore fluorescence is a much more common phenomenon than
phosphorescence.

3
Figure 1.1.2 Fluorescence spectra
The fluorescence spectrum (Figure 1.1.2) is a figure that explains the fluorescence
behavior of the sample measured by a spectrofluorometer. X-axis shows the wavelength
in nanometers, while y-axis represents the measured fluorescence intensity in cps (counts
per second). There are two types of spectra, one is excited spectra obtained by scanning
wavelengths at a constant emission wavelength, the other, on the contrary, is emission
spectra obtained by scanning wavelengths at a constant excitation wavelength. The
excitation spectra and the emission spectra are independent of each other. For most
fluorescent molecules, the excitation and emission spectra can be considered as “mirror”
images because they have similar vibrational structures in the excited state and ground
state. The major fluorescence peak represents the properties of the fluorescent molecule,
while the minor peaks may suggest presence of impurities or light scattering. Some
molecules may have two or more peaks on their emission spectra depending on molecular

4
structures. The energy loss of the molecule during the lifetime of the excited state will
lead to a difference between the wavelengths of the excitation maximum and the emission
maximum, which is called Stokes Shift, as a physical constant of a fluorescent molecule.
The basic equation for fluorescence intensity is shown as follows:
𝐹 = Φ𝐼0(1 − 𝑒−𝜀𝑏𝑐)
Where F is the fluorescence intensity, Φ stands for quantum efficiency, I0 is the incident
radiant power, 𝜀 refers to molar absorptivity, b represents the path length of the cell, and
c is the molar concentration. The quantum efficiency depends on wavelength,
temperature and molecule itself. The incident radiant power depends on the light source.
The molar absorptivity is dependent on the molecule itself. Usually, the higher
concentration of the molecule, the intensity becomes higher. However, there is a specific
phenomenon in fluorescence where the intensity will decrease with increasing
concentrations. This is called inner filter effect, which happens when the high
concentration of fluorophore molecules block the light passage. The fluorescent probe
absorbs part of the excitation light (and maybe part of the emitted light as well) so more
light is located at the front of the cuvette than the back of the cuvette, thus reducing the
fluorescence intensity.
Anisotropy, which stands for different properties in different directions, is also an
important concept in fluorescence spectroscopy. If the electric field of the light is oriented
in a particular axis of the excited molecule, the excitation of the molecule by a photon
will occur. Excited molecules are mostly oriented within a range of angles to the

5
polarized light applied on the fluorophores. This phenomena is called photoselection.
With vertical polarization, the molecules will move from vertical polarized configuration
to unpolarized configuration, leading to the loss of fluorescence. With horizontal
polarization, there will be more excited molecules turning depolarized from vertically
polarized. The ratio of the intensity difference and total intensity is defined as
fluorescence anisotropy. The observed anisotropy equation for the relationship between
anisotropy and probe rotation is:
𝑟 =𝑟0
1+𝜏 𝜙⁄
Where r stands for observed anisotropy, r0 is the intrinsic anisotropy only dependent on
the molecule itself, 𝜏 refers to the fluorescence lifetime, and 𝜙 stands for the rotational
time constant. Fluorescence anisotropy can be used to study the interactions of small
probes to large molecules. Given vertically polarized light, a subset of fluorophores will
be excited according to the orientation with the light. The molecular interaction affects
the rotational diffusion of the fluorophore, thus leading to changes in anisotropy.
A spectrofluorometer is the instrument used to measure the fluorescence and
phosphorescence properties of liquid or solid samples. It consists of six parts. The first
part is light source which provides the energy for excitation. Xenon lamp and mercury
lamp are two most common light sources used in the spectrofluorometer. The second part
is the primary monochromator as the excitation wavelength selector, followed by the
sample compartment as the third part. The sample is usually placed in a clear quartz
cuvette which will not interfere with the light path. Then comes the fourth part, which is

6
the second monochromator as the emission wavelength selector. Photomultipliers serve
as the detector and the fifth part of the spectrofluorometer with a good sensitivity in a
wide range of UV-Vis wavelengths. Then the signals will be collected as data through the
sixth part, a computer software. There is a 90° angle between the excitation and emission
monochromators mainly to eliminate the background noise caused by the light source.
Not all organic molecules can fluoresce. The basic structure for a fluorescent
molecule usually contains at least one π-electron system. And within all the fluorescent
molecules the ones with aromatic hydrocarbon structures typically show better
fluorescence sensitivity. That is because the conjugated π-bonding system requires lower
energy for the promotion of an electron from a π-bonding (π) to a π-antibonding (π*)
orbital transition. It is harder for saturated bonds such as σ bonds to fluoresce because
higher energy will be needed for an σ-bonding (σ) to σ-antibonding (σ*) transition.
The substituents on the aromatic hydrocarbon group may either reduce the π→π*
transition, which leads to lower fluorescence sensitivity, or increase the π→π* transition
causing a higher sensitivity. However, energy transfer is not the only factor that
determines the rate of radiative decay. The excited molecule can be de-excited through
various processes which have their own specific rate. When the rates of non-radiative
decays are faster than radiative-decay process, the fluorescence emission will not occur.
When radiative-decay rate is the fastest, it will lead to the fluorescence emission of the
excited molecule.

7
There are a wide variety of organic molecules that exhibit good fluorescence
sensitivity, and they have been well studied for the applications in analytical chemistry.
Listed below are the main categories of fluorescent natural organic molecules. (1) Amino
acids, such as tryptophan (Trp), phenylalanine (Phe) and tyrosine (Tyr). (2) Proteins
containing Phe, Tyr and Trp groups. (3) Coenzymes and vitamins, such as NADH
(nicotinamide adenine dinucleotide), NADPH (NADH phosphate), vitamin A (retinol),
vitamin B2 (riboflavin), vitamin E (tocopherol), and folic acids. (4) Nucleic acid
compounds, such as pyrimidines and purines. (5) Alkaloids, such as indole alkaloids,
quinolone alkaloids, carboline alkaloids, etc. (6) oxygen ring compounds, such as
coumarins and flavonoids. (7) Dyes and pigments, such as porphyrins, chlorophylls,
noncyclic pyrroles, quinoids, etc. (8) Other compounds such as phenols, aldehydes,
ketones, etc. Some of these molecules also exhibit good phosphorescence sensitivity
under certain conditions (usually at low temperature) so that they can be used to study the
molecular mobility of targeted chemical reactions.
When a specific interaction between a fluorescent molecule and another substance or
environment in the system occurs, the excited molecule may prefer to return to ground
state by non-radiative pathways rather than the radiative pathway, leading to the
reduction of fluorescence intensity. This phenomena is defined as quenching. There are
four types of quenching. First is impurities. If other molecules are present at certain
concentrations, they may cause interference by collisional quenching, energy transfer,
electron transfer and heavy-atom effect. Second is temperature. As the temperature

8
increases, the fluorescence intensity decreases due to the increasing molecular motions
and collisions which cause the energy loss. So it is better to keep all the samples at a
constant temperature during the measurements. The third type is oxygen quenching.
Singlet oxygen can easily react with excited molecules and oxidize the chromophore.
Triplet states are more vulnerable to oxygen quenching than singlet excited states at
normal tension. Ideally oxygen should be completely removed for luminescence
measurements. Sometimes inert gas such as nitrogen is bubbled into the sample to
eliminate oxygen quenching. Fourth type is concentration quenching. At dilute
concentrations, the fluorescence intensity increases with increasing concentration.
However, at high concentrations, there are more chances of molecule collisions, leading
to the direct quenching of the excited molecules. In order to avoid inner cell effect, a
pre-measurement of the intensity-concentration relation of the fluorescence molecule
must be conducted. Generally speaking, dilute solutions are preferred in fluorescence
measurements. To sum up, in order to obtain more accurate results of fluorescence
intensity, the four types of quenching must be taken in consideration and be controlled to
have minimum effect on the fluorescent molecules.
There are plenty of advantages of fluorescence spectroscopy which contributes to its
potential as an analytical method to be widely used in the food industry. Firstly and most
importantly, the excellent sensitivity has made it possible to detect concentration as low
as 1 ppb. Secondly, it has high specificity that each fluorescent molecule has its unique
excitation and emission wavelengths. Thirdly, fluorescence spectroscopy has a larger

9
linear range than transmittance spectrophotometric method. In addition, it is highly
efficient and rapid since the scanning usually takes about less than a minute. Furthermore,
this method yields reproducible results with little variation. Last but not least, it is a
non-destructive method as it will not affect the physical and chemical properties of the
samples. On the other hand, there have been obstacles for the development of
fluorescence spectroscopy. For example, low concentration samples and clear solutions
without the effect of light scattering are preferred for fluorescence measurements, while
food systems are usually concentrated mixtures of carbohydrates, proteins and lipids.
Nonetheless, the development of modern techniques of fluorescence spectroscopy will
definitely help both fundamental researches and analytical applications in the field of
food science.
1.2 Food Dyes
Food colorants, or food dyes / pigments, are edible additives in food and drinks
mainly to enhance or change the color of the product and thus making it more appealing
to customers. Food dyes can also be used in other industries such as cosmetics,
pharmaceuticals, plastics, etc. if they are considered safe in these related applications.
From a scientific standpoint, food colorants can make up the loss of natural colors due to
exposure to air, moisture, high temperature, light and extreme storage conditions,
enhance the colors that occur naturally, and correct the natural color variations. From a

10
marketing perspective, food dyes can make the food product more attractive to
consumers and deliver easy identification and vivid information. Therefore food dyes
have been massively used in commercial food and drinks as a functional additive and
they have become an essential part of the food industry.
Table 1.2.1 Typical Natural Food Dyes
Dyes Source type Typical source Color
Annatto plant achiote tree orange
Anthocyanin plant blueberry red, purple, blue
Betanin plant beet red
Caramel plant and animal sugar brown
Carmine animal cochineal insect red
Carotenoid plant, bacteria and fungi carrots yellow, orange, red
Chlorophyll plant leaves green
Lycopene plant tomato red
Paprika plant chili pepper orange, red
Turmeric plant ginger yellow
Food dyes can be divided into two major categories: natural food dyes and synthetic
food dyes. Natural food dyes refer to organic compounds or mixtures extracted mainly
from plant source, some from animal or microbial sources. Examples of typical natural
food dyes are listed in Table 1.2.1. Synthetic food dyes, or artificial colorants, are
produced by means of chemical synthesis from products of the coal and oil industry.
Examples of typical synthetic dyes can be seen from Table 1.2.2.

11
Table 1.2.2 Typical Synthetic Food Dyes
Common name FD&C name Type Color
Brilliant Blue FCF FD&C Blue No.1 triarylmethane dye bright blue
Indigotine FD&C Blue No.2 indigo carmine royal blue
Fast Green FCF FD&C Green No.3 triarylmethane dye sea green
Erythrosine FD&C Red No.3 organoiodine dye cherry red
Allura Red AC FD&C Red No.40 azo dye orange-red
Tartrazine FD&C Yellow No.5 azo dye lemon yellow
Sunset Yellow FCF FD&C Yellow No.6 azo dye orange
Amaranth FD&C Red No.2 azo dye dark red
Scarlet GN FD&C Red No.4 azo dye red
Sudan II FD&C Red No.32 azo dye orange-red
Orange I FD&C Orange No.1 azo dye orange
Orange B / azo dye orange
Citrus Red 2 / azo dye orange-yellow
Brilliant Black / azo dye black
Azorubine / azo dye red
Ponceau 4R / azo dye red
Lithol Rubine BK / azo dye red
Quinoline Yellow / quinophtalone dye greenish yellow
Patent Blue V / triarylmethane dye blue
Green S / triarylmethane dye green
The society has gone through four stages for the usage of food colorants. The first
stage was the application of natural food colorants in ancient times. For instance, ancient
Egyptian candy makers were able to add wine during processing to enhance colors, the
Mayans knew how to extract carmine from female ground bugs, and the Chinese people
acquired the skills to ferment meat and wine by Monascuspurpureus, a fungi with a
characteristic red color. Then the second stage came with the development with a wide
variety of synthetic dyes during the industrial revolution. The low-cost, stability and
easy-production of synthetic food dyes quickly led to the replacement of natural dyes in

12
the food industry. However, problems gradually occurred with the massive use of
synthetic colorants, such as adulteration, heavy metals, toxicity, etc. For the past few
decades we have evolved to the third stage, where natural food dyes are again applied in
the food production, while synthetic dyes still account for the major part of color
additives. With the development of modern analytical techniques, people have begun to
understand the properties and possible adverse effects on health of synthetic dyes. As
several synthetic dyes have become concerns or doubts to the public, plenty of
government regulations have been enforced on the usage of synthetic dyes to ensure food
safety. Finally, the fourth stage may start in the near future when natural colors will
prevail over synthetic ones in the food industry due to the freshness, healthiness, safety
and sustainability people are pursuing nowadays. Though, there is still a long way to go
since natural dyes are not well-studied compared to synthetic ones, and the techniques of
massive production of natural food colorants also need improvements.
The current regulations on food colorants vary from country to country. In the United
States, color additives that are permitted by FDA consist of two parts, one is certified
color additives and the other is exempt from certification color additives. There are 7
certified food colorants in the US, including FD&C Yellow No.6 (Sunset Yellow FCF),
FD&C Yellow No.5 (Tartrazine), FD&C Blue No.1 (Brilliant Blue FCF), FD&C Red
No.40 (Allura Red AC), FD&C Blue No.2 (Indigotine), FD&C Red No.3 (Erythrosine)
and FD&C Green No.3 (Fast Green FCF). Exempt-from-certification color additives refer
to artificial colorants derived from natural sources or are synthetic variations of natural

13
colorants, including astathanxin, caramel, carmine, riboflavin, beta carotene, titanium
dioxide, fruit juice, vegetable juice, etc. These exempt colorants still have certain
limitations, which can be found on 21 CFR Section 73. Each approved colorant has its
usage limits in different kinds of products. All color additives are required to be labeled
by FDA, and it is prohibited to declare the additives as “natural” in the ingredient
statement, although the food industry usually advertise them as natural colors.
The European Union has a different regulation system on food colorants than the US.
All colorants are named by an E-classification system, such as fast green as E143 and
allura red as E129. Colorants are classified into three groups in the EU, which are color
additives, flavors and coloring foods. There are more artificial dyes approved in the EU
than in the US, including Green S (E142), Ponceau 4R (E124), Quinoline yellow (E104),
Patent blue V (E131), Carmoisine (E122), etc. In Canada, the certified colors are the
same with the US, while amaranth is also allowed (amaranth is banned in the US). Color
additives in Mexico follow the regulations of Official Mexican Standard, as well as
Codex, EU or U.S. regulations for certain colorants. China has its own standard for food
additives, which is under GB2760-2011-National Food Safety Standard. Australia and
New Zealand have created the Australia New Zealand Food Standards Code for
regulations of food colorants. Japan and Korea also have regulatory guidance specific to
the use of color additives in their countries. According to global regulations, the food
colors mostly permitted worldwide are allura red, brilliant blue, sunset yellow and
tartrazine, which are commonly added into beverage products (McAvoy, 2014).

14
Figure 1.2.1 Molecular structures of allura red (left), sunset yellow and fast green (right)
Table 1.2.3 General information of allura red, sunset yellow and fast green
Items Allura Red AC Sunset Yellow FCF Fast Green FCF
FD&C name FD&C Red No.40 FD&C Yellow No.6 FD&C Green No.3
Formula C18H14N2Na2O8S2 C16H10N2Na2O7S2 C37H37N2O10S3+
CAS number 25956-17-6 2783-94-0 2353-45-9
EC number 247-368-0 220-491-7 219-091-5
CI 16035 15985 42053
Structure type azo azo triarylmethane
Molecular
weight (g/mol)
496.43 452.37 765.89
Solubility Soluble in water,
slightly soluble in
ethanol
Soluble in water,
slightly soluble in
ethanol
Soluble in water
and ethanol
Appearance dark red powder orange powder green powder
Regulation
status
Approved in the U.S.
and EU
Approved in the U.S.
and EU
Approved in the
U.S., banned in EU
Absorbance
λMax (nm)
506 482 624
Fluorescence
λExc (nm)
540 480 580
Fluorescence
λEmi (nm)
585 565 650
Allura red AC, chemical name disodium
6-hydroxy-5-[(2-methoxy-5-methyl-4-sulfophenyl)azo]-2-naphthalenesulfonate, is an azo

15
dye synthesized from petroleum, and it is also named as Food Red 17, C.I. 16035, FD&C
Red No.40 or E129. As the mostly used red dye in the US, allura red has been gradually
replacing amaranth and erythrosine due to the adverse health effects caused by these two
dyes. Allura red is prevalent in beverages, ice cream, yogurt, cereals and snacks to create
an attracting red color. However, in the 1970s studies have shown that allura red may
cause side effects such as hyperactivity in children so it was once banned in several
countries in Europe (McCann, 2007). While it is approved of use in most countries
worldwide, the safety of allura red still remains controversial.
Sunset yellow FCF, chemical name disodium
6-hydroxy-5-[(4-sulfophenyl)azo]-2-naphthalenesulfonate, is also an azo dye synthesized
from petroleum, and it can be named as Orange Yellow S, FD&C Yellow No.6, or C.I.
15985 or E110. It is often added into confectionary, desserts, sauces and snacks to make
an orange-yellow shade. Tartrazine, another widely used orange-yellow azo dye having a
similar molecular structure with sunset yellow, has been proved to cause allergies and
intolerance reactions among 0.1% of population in the U.S. In comparison with tartrazine,
no toxicity or carcinogenicity has been found for sunset yellow, and the U.S. approves its
use with an ADI (acceptable daily intake) at 3.75 mg/kg (Hashem, 2010).
Fast green FCF, chemical name ethyl - [4 - [ [4 - [ethyl -[(3 - sulfophenyl) methyl]
amino] phenyl] - (4 - hydroxy - 2 - sulfophenyl) methylidene] - 1 - cyclohexa - 2, 5 -
dienylidene] - [(3 - sulfophenyl) methyl] azanium, is classified as a triarylmethane dye
with three aryl methane groups. Other common names for fast green are FD&C Green No.

16
3, Solid Green FCF, Food green 3, C.I. 42053, Green 1724, or E143. Studies have
indicated that fast green may cause mutagenic and tumorigenic effects on experimental
animals (Mali, 2000). It is also not well-absorbed by human intestines. Therefore fast
green is the least used dye among the certified synthetic dyes in the U.S., and it is
prohibited in EU and some other countries. Typical products that contain fast green as a
color additive include salad dressings, candies, cereals, yogurt, etc.
Molecular structures and other basic information of the three synthetic dyes used in
this project are shown in Figure 1.2.1 and Table 1.2.3. Allura red, sunset yellow and fast
green are chosen as luminescent probes in this study for the following reasons. Firstly,
they all exhibit excellent fluorescence sensitivity at very low concentration while they
have different excitation and emission wavelengths. Secondly, they are GRAS (generally
recognized as safe) colorants and are widely used in food production globally. Thirdly,
they are water soluble compounds and have higher light, oxygen and pH stability than
other synthetic and natural dyes. Fourthly, these dyes are inexpensive, allowing them to
become potential probes that can be massively used in fluorescence spectroscopy. Last
but not least, differences in molecular structures of these dyes may lead to different
results of the study of interactions between the dye molecule and food macromolecules.

17
1.3 Previous Researches
1.3.1 Food dyes as luminescent probes for physical properties
Studies indicate that there is a strong connection between the fluorescence behavior
of food dye molecules and the environmental physical properties. For example, in the
excited state, the rotation of the aromatic groups through the azo group (R-N=N-R’) in an
azo dye will be restricted in a high-viscosity solution, causing them to predominantly
decay through a radiative pathway rather than a non-radiative decay. Research has found
that in glycerol-water solution, the fluorescence emission intensity of allura red increases
with viscosity, which follows by an empirical model (Waxman, 2016). The fluorescence
intensity of azo dyes also shows an increase with lower water activity, suggesting the
restriction of rotation of the azo group in rigid environment.
Azo dyes, triarylmethane dyes and anthocyanins all exhibit this kind of behavior as
so-called “molecular rotors”. Studies show that the fluorescence emission intensity of
azorubine, a molecular rotor azo dye, also increases with increasing viscosity of the
solvents. And when using hydrocolloid solutions to modulate the viscosity, the
fluorescence intensity increase is at a lesser extent compared with glycerol solutions
(Kashi, 2015). This result is caused by the penetration of sucrose and glycerol solutions
in the hydration cell of the fluorescent dye, while less molecular crowding occurs around
the fluorescent probe in hydrocolloid such as MC and CMC when they are used to
modulate the bulk viscosity. However, besides from the structure and size of the

18
hydrocolloid molecule, the other factor that may affect the fluorescence sensitivity of the
dye probe is the interactions between the probe and the hydrocolloid, which needs to be
further explored.
Food dyes can also be a probe for the micro viscosity in lipid systems. For instance,
Citrus Red 2, a lipo-soluble azo dye, has been studied to monitor the micro viscosity of
liquid oil entrapped in colloidal fat crystal networks (Du, 2014). Another possible
application of food dyes is to understand the microstructural organization of colloidal
systems. The binding capacity of sunset yellow and a surfactant,
cetyltrimethylammonium bromide, has been studied by fluorescence spectroscopy to
discover the microstructure change during micelle formation (Nazar, 2014). In addition,
food dyes can be applied in phosphorescence as probes for matrix molecular mobility in
solid and semi-solid amorphous foods. One example is that the synthetic pigment
Erythrosine B can be used to monitor the α-relaxations of amorphous sugars and proteins
with its phosphorescence intensity and lifetime (Draganski, 2010). The significance of
food dyes as molecular rotors is that they can be used as probes for measuring bulk and
micro viscosity of food systems, and may someday replace viscometers as a more rapid,
specific and intrinsic analytical method.
Though studies discovered that food dyes can serve as luminescent probes for
monitoring physical properties of foods, further researches still need to focus on the
understanding of the molecular interactions between the dye molecule and the

19
environment which is majorly composed of macromolecules such as carbohydrates,
proteins and lipids.
1.3.2 Interactions between food dyes and proteins
Researches have shown that several synthetic food dyes are capable of binding
macromolecules, especially with protein molecules. For example, using fluorescence
spectroscopy and isothermal titration calorimetry, allura red has been found to have
hydrophobic and hydrogen bonded binding sites with BSA (bovine serum albumin) (Lelis,
2017). Allura red can also bind to HSA (human serum albumin) by similar kinetics with
BSA (Wang, 2014). Electrophoresis studies using SDS-PAGE method indicate that allura
red binds with a variety of proteins at a wide range of temperature and pH, which makes
it a highly sensitive probe in detecting the proteins in food samples, such as peanut, rice
bran and garlic (Abdullah, 2008).
As to sunset yellow, its interactions with DNA molecules have been revealed to be
driven by hydrogen bonding and Van der Waals forces, and the reaction is exothermic and
enthalpy favored (ΔH<0, ΔS<0) (Kashanian, 2012). Tartrazine, a similar azo dye with
sunset yellow, has also been found to have interactions with HSA and BSA, and the
binding affinity of tartrazine with BSA is higher than HSA (Basu, 2015). The binding
kinetics differ with change of ionic strength. In low salt concentration, electrostatic
interactions mainly contribute to the binding, while in high salt concentrations, hydrogen

20
bonding and van der Waals forces dominate (Bolel, 2012). The interactions of three food
colorants, fast green, patent blue V and acid blue 1 with BSA have been compared by
fluorescence quenching studies and results have shown that electrostatic force mainly
contributes to the colorant binding with BSA. Fast green, among these three food dyes,
has the strongest binding ability with BSA (Li, 2016).
However, most fluorescence studies of interactions between food dyes and proteins
are based on fluorescence quenching technique, where the fluorescence emission
intensity of the protein molecule (mainly from the amino acid tryptophan) is measured.
No researches have been carried out focusing on the fluorescence intensity change of
food dyes, which are highly sensitive fluorescent probes themselves.
A computational method called molecular docking has been used in order to identify
the binding sites of food dyes and macromolecules, which can better explain the kinetics
of interactions. The docking analysis is performed by a computer software designed to
predict 3D structures of proteins and score protein-small molecule complexes through
energy calculations. It is found that HSA (human serum albumin) has several
hydrophobic interaction sites and hydrogen bonding sites with allura red, tartrazine, and
some natural dyes, cyanidin-3-glucoside and curcumin. And the binding affinity of
synthetic dye-protein H-bonds are much higher than that of natural dye-protein H-bonds
(Masone, 2015). By molecular docking, the residual amino acids which form the
protein-dye binding site can be identified. For example, allura red is mainly bound to
HSA in site I with Trp214 – Glu250 residues, while allura red can also form two

21
hydrogen bonds with another residual amino acid site in the HSA molecule (Wu, 2015).
These recent studies have provided insights on the binding properties of synthetic dyes
and proteins on a molecular level, thus helping the development of synthetic dyes as
probes in monitoring food safety and quality.
1.4 Objectives
This study aims to see if there are any increases in the fluorescence sensitivity of the
probes due to molecular interactions between synthetic dyes (allura red, sunset yellow
and fast green) and common food macromolecules, and thus identify the molecular
interactions between them. There have been not many related studies on this topic,
especially targeting the fluorescent properties of synthetic food dyes. Five carbohydrate
molecules and five protein molecules are chosen for this research since they are
macromolecules typically existing in food systems, while they have different physical
and chemical properties due to structural differences. The carbohydrates are methyl
cellulose, carboxymethyl cellulose, amylopectin, alginate and chitosan, and the proteins
are bovine serum albumin, whey protein isolate, porcine gelatin, wheat gliadin and corn
zein. By using the technology of luminescence spectroscopy, the fluorescence emission
sensitivity of different food dyes in different macromolecule solutions will be compared.
Therefore, the molecular interactions between food dyes and macromolecules may be
found out according to the corresponding fluorescence behavior. Then by conducting the

22
anisotropy, ionic strength and temperature study, the nature of these molecular
interactions will be further discovered and explained, which will provide a deeper
understanding of the behaviors at a molecular level.
Based upon the achievements of this research, the potential of synthetic food dyes as
luminescent probes in monitoring food quality can be assessed. The findings will also
contribute to the development of novel fluorescence technology which may one day be
massively applied in the food industry as a highly efficient analytical method. Examples
of future applications include rapid detection of food ingredients such as carbohydrates,
proteins and colorants, detection of physical properties such as viscosity and water
activity, detection of chemical adulteration, detection of microbial activity and shelf life
study of food products, automation in food processing, portable fluorometer, etc.

23
2. METHODS
2.1 Materials
Allura red AC (MW 496.43 g/mol), sunset yellow (MW 452.36 g/mol), fast green
FCF (MW 808.85 g/mol), methyl cellulose (viscosity 400cP, 2% in H2O, 20°C), sodium
carboxymethyl cellulose (viscosity 470cP, 2% in H2O, 20°C), sodium alginate, chitosan
(low molecular weight), amylopectin (from corn), albumin (bovine serum, ≥ 98%),
gelatin (type A, from porcine skin), gliadin (from wheat), zein (from corn) and sodium
chloride (≥ 99%) used in the project are from Sigma Aldrich (St. Louis, MO, USA).
BiPro whey protein isolate (≥ 95%) used in the study is provided by Davisco Foods
(Eden Prairie, MN, USA).
Reagent alcohol 90% and Acetic acid (≥ 99.7%) used are from BDH VWR
Analytical (Radnor, PA, USA).
2.2 Instruments
A Fluoromax-3 spectrophotometer (Horiba Scientific Inc., Edison, NJ, USA) is used
to measure fluorescence intensity and anisotropy for all samples. A Cary 60 UV-Vis
spectrophotometer (Agilent Technologies, Santa Clara, CA, USA) is used for absorbance
measurements. 10mm path length quartz cuvettes (NSG Precision Cells, Farmingdale,
NY, USA) are used as the sample holder.

24
2.3 Sample Preparation
Stock solutions of 1mM allura red, 1mM sunset yellow, and 1mM fast green are
prepared in distilled water. After the fluorescence sensitivity – dye concentration study,
the stock solutions are diluted respectively to 20μM allura red, 20μM sunset yellow and
5μM fast green to be used throughout all the following measurements. Stock solutions of
all dyes are stored at 4°C.
Stock solutions of all macromolecules are prepared to be 1%, which is a low
concentration in order to reduce the impact of turbidity and viscosity. Solvents for methyl
cellulose, carboxymethyl cellulose, amylopectin, alginate, gelatin, whey protein and
albumin are distilled water. Amylopectin is gelatinized by heating during the dissolving
process. Chitosan is dissolved in 0.1M acetic acid solution, while zein and gliadin are
dissolved in 80% ethanol solution to achieve complete dissolution. All macromolecule
solutions except gelatin are stored at 4°C. Gelatin solution is stored at room temperature
and is dissolved for 5 minutes in ultrasonic bath before measurements to eliminate any
possible gel formation.

25
2.4 Measurements
Preliminary runs are carried out to choose the optimal excitation wavelength,
emission and excitation slits for each dye. For this study, excitation wavelength used for
allura red is 540nm, sunset yellow 505nm, and fast green 580nm. Both emission and
excitation slits for all dyes are chosen to be 5nm. Scanning emission wavelengths for
allura red is 560-800nm, sunset yellow 525-800nm, and fast green 600-800nm.
Fluorescence excitation spectra of blank and deionized water sample are usually collected
before measurements to check if the light source (xenon lamp) works well, as ~467nm
should be the excitation wavelength of the xenon light source where the peak intensity
occurs.
To choose the appropriate dye concentrations for all the measurements throughout
the study, the fluorescence intensity of dye solutions from 0μM to 100μM are measured
in order to find a linear range on the peak intensity – dye concentration plot and thus
choose the dye concentration for the following studies.
Absorbance measurements are conducted at room temperature to better correct the
fluorescence intensity results and therefore adjust the dye concentration in the samples to
make it constant. Absorbance spectra are collected from 200-800 nm at a scan rate of
300nm/min for all samples. Blanks are subtracted from each spectra.
The fluorescence emission intensity is measured by titrating the macromolecule
solution into the dye solutions (with a constant dye concentration). The starting volume

26
of dye concentration in the quartz cuvette is 1.5mL. The starting macromolecule
concentration is 0, while the ending concentration is 0.5%. Concentrations for
macromolecules: 0, 0.03%, 0.10%, 0.167%, 0.233%, 0.30%, 0.367%, 0.433%, 0.50%.
Also, the dye stock solution will also be added in the sample each time for 4.08μL (the
first addition is 2.04μL) to correct the dilution effect of adding macromolecule solution,
according to concentration calculations and absorbance measurements. Each time the
macromolecule solution is added, the sample will be stirred inside the instrument with a
stir bar for 1 minute and kept still for 1 minute before measurement. Emission spectra are
collected for all samples. Blanks (adding macromolecule solutions to distilled water
without the presence of dye solution) are subtracted from the corresponding sample
spectra. Temperature is kept constant at 20°C by a temperature controller connected to
the spectrophotometer. All samples are run in triplicate.
Anisotropy values of the same sets of dye – macromolecule solutions are also
collected by measuring the single-point anisotropy of the samples. Excitation / emission
wavelengths for allura red are 540nm / 585nm, sunset yellow 480nm / 565nm, and fast
green 580nm / 650nm respectively. Temperature is kept constant at 20°C by a
temperature controller connected to the spectrophotometer. All samples are run in
triplicate. To achieve more accurate results, polarizer alignment is usually conducted with
amylopectin solution (light scatterer), FITC (fluorescein isothiocyanate) in ethanol
solution (with a standard anisotropy value of ~0.02) and FITC in glycerol solution (with a
standard anisotropy value of ~0.35).

27
Ionic strength study is conducted by measuring the fluorescence emission intensity
when titrating sodium chloride solution into a constant concentration of dye –
macromolecule solution, or titrating the macromolecule solution into a constant
concentration of dye – sodium chloride solution. Also, calculated amount of the dye stock
solution will also be added in the sample each time to correct the dilution effect of adding
macromolecule solution. Blanks are subtracted from the corresponding sample spectra.
Temperature is kept constant at 20°C by a temperature controller connected to the
spectrophotometer. All samples are run in triplicate.
Temperature study is carried out by measuring the fluorescence emission intensity of
a constant concentration of dye – macromolecule solution with varying temperatures.
Temperature is set to 20°C, 25°C, 31°C, and 37°C by a temperature controller connected
to the spectrophotometer. Before each measurement, samples are kept still in the
spectrophotometer for 3 minutes after the temperature reaches the desired level. Blanks
are subtracted from the corresponding sample spectra. All samples are run in triplicate.
2.5 Data Analysis
All data in the Horiba Scientific software (Fluor Essence) can be directly exported to
Origin 9.0 software to be further analyzed. Blanks are subtracted from each
corresponding sample data. Then the peak location (peak intensity and emission
wavelength) of each spectra are identified using Microsoft Excel. Normalized maximum

28
intensity is calculated by dividing the peak emission intensity of a sample to the peak
emission intensity of the starting dye solution without macromolecule solutions added.
Then plot the normalized maximum intensity as y-axis and macromolecule concentration
as x-axis. For anisotropy study, plot the anisotropy value as y-axis and macromolecule
concentration as x-axis. For ionic strength study, plot the normalized maximum intensity
value as y-axis and salt concentration or macromolecule concentration as x-axis. For
temperature study, plot the normalized maximum intensity value as y-axis and
temperature as x-axis. All plotting are done by Microsoft Excel.
According to material specifications, the average molecular weight for the following
macromolecules are used in the calculations of thermodynamic parameters in chapter 3.
Methyl cellulose: 40000 g/mol; BSA: 66000 g/mol; whey protein: 5000 g/mol and gelatin:
50000 g/mol.

29
3. RESULTS AND DISCUSSION
3.1 Choosing the appropriate dye concentration
To choose appropriate dye concentrations for this study, fluorescence emission
intensity of water solutions of allura red, sunset yellow and fast green are measured in
different concentrations (Figures 3.1.1, 3.1.2, 3.1.3). The intensity of all dyes exhibit an
increase in low concentrations, then reach a maximum point, and then decrease in higher
concentrations. The concentrations for maximum intensity are allura red (~60μM,
~1.4*105cps), sunset yellow (~40μM, ~5*104cps) and fast green (~15μM, ~2.5*105cps).
The differences in intensity values and concentrations for maximum intensity indicate
that with the same concentration, fast green is the most sensitive fluorescent probe in
water solutions while sunset yellow is the least sensitive. The decrease of fluorescence
intensity can be explained as inner filter effect. At high concentrations, the dye molecules
near the light source absorb more light, thus blocking the light pathway and at the end of
the cuvette there is less light than at the front. Therefore, the intensity-dye concentration
experiment is essential for choosing the appropriate dye concentration to use for the
entire study. The chosen dye concentration must fall into the linear range where the
fluorescence emission intensity can be considered as proportional to concentration.
According to the results, 20μM is chosen for allura red and sunset yellow solution, and
5μM is chosen for fast green solution for the entire study.

30
Figure 3.1.1 Fluorescence intensity of allura red in water
Figure 3.1.2 Fluorescence intensity of allura red in water
0
20000
40000
60000
80000
100000
120000
140000
160000
0 20 40 60 80 100
maxim
um
inte
nsity (
cps)
dye concentration (μM)
Allura red - Water
0
10000
20000
30000
40000
50000
60000
0 20 40 60 80 100
maxim
um
inte
nsity (
cps)
dye concentration (μM)
Sunset yellow - Water

31
Figure 3.1.3 Fluorescence intensity of fast green in water
3.2 Dye – Carbohydrates fluorescence intensity study
In order to compare the fluorescence sensitivity of allura red, sunset yellow and fast
green in different food carbohydrates and thus identify any possible molecular
interactions, the fluorescence emission intensity of three dyes are measured by the
addition of the carbohydrate solutions.
3.2.1 Allura red – carbohydrates
Figure 3.2.1.1 shows the fluorescence emission spectrum of allura red in varying
concentrations of methyl cellulose (MC) and carboxymethyl cellulose (CMC). The
0
50000
100000
150000
200000
250000
300000
0 20 40 60 80 100
maxim
um
inte
nsity (
cps)
dye concentration (μM)
Fast green - Water

32
fluorescence intensity of allura red gradually increases with the addition of MC, while it
does not increase with the addition of CMC.
Figure 3.2.1.1 Fluorescence spectra of allura red in MC and CMC solutions as a function
of added carbohydrate (wt. %)
Previous researches have indicated that both MC and CMC, as viscosity modulating
hydrocolloids, can cause lower fluorescence intensity of dye probe compared to glycerol
or sucrose solutions with the same bulk viscosity, because of more free water and less
molecular crowding around the dye probe (Kashi, 2015). However, according to Figure
3.2.1.1, the fluorescence intensity of allura red is showing a dramatic increase with the
presence of MC rather than CMC. Therefore there should be certain molecular
0
100000
200000
300000
400000
500000
600000
700000
800000
560 660 760
Inte
nsi
ty (
cps)
wavelength (nm)
Allura red - MC
0.00% 0.03% 0.10%
0.17% 0.23% 0.30%
0.37% 0.43% 0.50%
0
100000
200000
300000
400000
500000
600000
700000
800000
560 660 760In
ten
sity
(cp
s)wavelength (nm)
Allura red - CMC
0.00% 0.03% 0.10%
0.17% 0.23% 0.30%
0.37% 0.43% 0.50%

33
interactions between allura red and MC molecules. MC and CMC are both polymer
compounds derived from cellulose. They differ in molecular structure by the substitute
groups, which are methoxy groups and carboxymethyl groups, respectively. Allura red
molecule is able to have hydrophobic interactions with MC while it doesn’t do with CMC,
thus leading to the increase of fluorescence sensitivity of allura red. Another reason that
CMC and allura red do not have molecular interactions is that carboxymethyl group is
negatively charged, so does allura red.
Figure 3.2.1.2 Fluorescence intensity of allura red in carbohydrates
The normalized maximum intensity of allura red in all five carbohydrates are
compared in Figure 3.2.1.2. The intensity of allura red in MC increases by 7 times from
0
1
2
3
4
5
6
7
8
0.0% 0.1% 0.2% 0.3% 0.4% 0.5%
No
rmal
ized
Max
imu
m In
ten
sity
Macromolecule Concentration
Allura Red - Carbohydrates
MC CMC Amylopectin Chitosan Alginate

34
zero to 0.5% MC, increases by 1 time in amylopectin, and does not obviously change
with the addition of CMC, chitosan or alginate. The behavior of allura red in MC is
attributed to the molecular interactions between the two molecules. For amylopectin, the
increase and a larger variation in results indicate the impact of light scattering, majorly
caused by the turbidity of amylopectin solution. Chitosan, which is positively charged, is
not binding with the negatively charged allura red either. This may due to the low pH
level which causes the conformational change of allura red molecules. Therefore only the
interactions between allura red and MC should be further studied.
To determine the binding constant and stoichiometry of the binding interaction
between allura red and methyl cellulose, the modified Stern–Volmer equation below can
be used.
log𝐹−𝐹0
𝐹= log𝐾𝑎 + 𝑛 log[𝑄]
Where F0 is the initial fluorescence intensity without addition of macromolecule solution,
F is the intensity with the addition of macromolecule, Ka stands for the binding constant
(L/mol), n is number of binding sites, which represents the stoichiometry of the complex
(dye molecule : marcomolecule), and [Q] is the macromolecule concentration (mol/L). So
the binding constant can be calculated by plotting the double-logarithm regression curve
of fluorescence emission intensity data.
The Gibbs free energy change of the binding interactions can be calculated by the
following equation:
∆𝐺 = −𝑅𝑇 ln𝐾𝑎

35
Where Ka is the binding constant (L/mol), R is the universal gas constant 8.3145 J/(mol
K), T is the temperature (K), and ΔG means the Gibbs free energy change (kJ/mol).
Table 3.2.1 Binding constants and Gibbs free energy change for allura red and MC
(r2 stands for the correlation coefficient for the linear fit.)
T (K) Ka (L/mol) r2 n ΔG (kJ/mol)
MC 293 76.63±0.02 0.997 0.58±0.01 -10.57±0.01
Table 3.2.1 indicates that at 20°C the interactions between allura red and MC are
spontaneous because ΔG<0. Hydrophobic interactions should serve as the major
molecular interaction between allura red and methyl cellulose.
3.2.2 Sunset yellow – carbohydrates
The normalized maximum intensity of sunset yellow in all five carbohydrates are
compared in Figure 3.2.2.1. With the addition of MC, CMC, chitosan and alginate, the
fluorescence intensity of sunset yellow does not obviously change. However, in the study
of allura red with MC, the intensity increases dramatically, while for sunset yellow, which
has a similar molecular structure with allura red, the addition of MC does not affect its
fluorescence sensitivity. This result also verifies the explanation that there are specific

36
molecular interactions between MC and allura red that leads to the change of
fluorescence behavior.
Figure 3.2.2.1 Fluorescence intensity of sunset yellow in carbohydrates
According to the molecular structure of allura red and sunset yellow, there are two
more methyl groups on the allura red molecule than sunset yellow, The methyl groups are
increasing the hydrophobicity of the allura red molecule and thus make it possible for
allura red to have hydrophobic interactions with MC. Another possible explanation is that
the binding of MC and allura red restricts the rotation of the allura red molecule but not
affects the rotation of sunset yellow molecule.
0
5
10
15
20
25
30
35
0.0% 0.1% 0.2% 0.3% 0.4% 0.5%
No
rmal
ized
Max
imu
m In
ten
sity
Macromolecule Concentration
Sunset Yellow - Carbohydrates
MC CMC Amylopectin Chitosan Alginate

37
Figure 3.2.2.2 Fluorescence intensity of blank amylopectin solutions
For sunset yellow in amylopectin solutions, there is a dramatic increase of
fluorescence intensity by about 33 times in 0.5% gelatinized amylopectin solution.
However, this result can be explained by the fluorescence emission spectrum of
amylopectin solution blank samples (Figure 3.2.2.2). The high intensity levels around
540nm indicate the impact of light scattering of the amylopectin sample. Compared to
sunset yellow, the light scattering of amylopectin is not much effective in allura red, and
there are two reasons. One is that the excitation and emission wavelengths of the two
probes are different (for allura red, excitation wavelength is 540nm and emission
wavelength is 585nm; for sunset yellow, 480nm and 565nm respectively), where the
0
100000
200000
300000
400000
500000
600000
700000
800000
900000
1000000
525 575 625 675
Inte
nsi
ty (
cps)
wavelength (nm)
Blank - amylopectin
0.00% 0.03% 0.10% 0.30% 0.50%

38
wavelengths of sunset yellow are closer to the excitation wavelength of the light source.
The other is that the initial maximum intensity of the two probes are also different. The
maximum intensity of allura red is around 1.5*105cps, while for sunset yellow is around
5*104cps. So sunset yellow is a weaker fluorescent probe than allura red, and the minor
turbidity of the sample solution can cause a greater influence on the fluorescence
behavior of sunset yellow. Therefore the increase of fluorescence intensity in Figure 3.2.2
cannot reflect the binding between amylopectin and sunset yellow. So the molecular
interactions between sunset yellow and the carbohydrates used in this study cannot be
identified.
3.2.3 Fast green – carbohydrates
The normalized maximum intensity of fast green in all five carbohydrates are
compared in Figure 3.2.3. There is no increase in fluorescence intensity of fast green in
MC, CMC and alginate solutions, suggesting no molecular interactions between fast
green and these three carbohydrates. A three time increase of intensity is observed for fast
green in amylopectin solution, which can also be explained by the light scattering effect
caused by the turbidity of the gelatinized amylopectin solution. In addition, there is also a
slight intensity increase of fast green in chitosan solution. T

39
Figure 3.2.3 Fluorescence intensity of fast green in carbohydrates
his result should be caused by the increasing acidity of the sample solution (chitosan
is prepared in 0.1M acetic acid solution) that changes the charge of the fast green
molecule. Therefore fast green is not shown to have any specific molecular interactions
with all five carbohydrate molecules tested.
3.3 Dye – Proteins fluorescence intensity study
In order to compare the fluorescence sensitivity of allura red, sunset yellow and fast
green in different food proteins and thus identify any possible molecular interactions, the
0
1
2
3
4
5
6
7
8
0.0% 0.1% 0.2% 0.3% 0.4% 0.5%
No
rmal
ized
Max
imu
m In
ten
sity
Macromolecule Concentration
Fast Green - Carbohydrates
MC CMC Amylopectin Chitosan Alginate

40
fluorescence emission intensity of three dyes are measured by the addition of the protein
solutions.
3.3.1 Allura red – water-soluble proteins
Figure 3.3.1 Fluorescence intensity of allura red in water-soluble proteins
The normalized maximum intensity of allura red in all three water soluble proteins
are compared in Figure 3.3.1. A ~100% increase of maximum intensity of allura red is
observed with the addition of gelatin and whey protein solutions, suggesting molecular
interactions between the allura red molecule and the protein molecules. The intensity of
0
1
2
3
4
5
6
7
8
9
0.0% 0.1% 0.2% 0.3% 0.4% 0.5%
No
rmal
ized
Max
imu
m In
ten
sity
Macromolecule Concentration
Allura Red - Proteins
Gelatin Albumin Whey protein

41
allura red increases to about 7 times of the initial intensity with the addition of only 0.1%
bovine serum albumin (BSA) solution, and the intensity value tends to become constant
with further addition of albumin. This result not only verifies the previous researches that
allura red is binding with BSA complexes, but also suggests that there are more binding
sites between allura red with albumin than allura red with other proteins such as whey
and gelatin. The rotation of allura red as an azo dye is restricted by its electrostatic
binding or hydrogen binding with protein molecules, thus enhancing its fluorescence
sensitivity. By the addition of ~0.4% albumin, the binding sites are saturated for all allura
red molecules so that its fluorescence activity will not be influenced by the concentration
of albumin. Therefore it can be concluded that allura red, though having molecular
interactions with all three proteins, has the strongest binding with BSA, leading to its
highest fluorescence emission intensity.
Table 3.3.1 Binding constants and Gibbs free energy change for allura red and
water-soluble proteins (r2 stands for the correlation coefficient for the linear fit.)
Protein T (K) Ka (L/mol) r2 n ΔG (kJ/mol)
BSA 293 8453±2.15 0.932 2.45±0.14 -22.03±0.02
Whey protein 293 756±2.57 0.996 1.03±0.07 -16.15±0.01
Gelatin 293 941±3.40 0.998 1.17±0.08 -16.68±0.01

42
The binding constant K and binding sites n are calculated by the modified Stern–
Volmer equation after plotting the double-logarithm regression curve of fluorescence
emission intensity data. And the Gibbs free energy change can be calculated through the
equations mentioned in Chapter 3.2.1.
According to Table 3.3.1, allura red is binding BSA, whey protein and gelatin
spontaneously at 20°C because ΔG<0. However, the nature of these binding cannot be
concluded at this time because enthalpy change ΔH and entropy change ΔS values are not
acquired until temperature studies. This will be discussed in chapter 3.6.
3.3.2 Sunset yellow – proteins
The normalized maximum intensity of sunset yellow in all three water soluble
proteins are compared in Figure 3.3.2. There is no obvious change of fluorescence
emission intensity of sunset yellow with the addition of albumin, whey protein or gelatin
solutions, suggesting no binding interactions between sunset yellow and the protein
complexes. Sunset yellow does not have a methyl group and methoxy group as compared
to the molecular structure of allura red. Since allura red is interacting with all three
proteins, it is indicated that the methyl group and methoxy group on the allura red
molecule tend to bind with protein molecules. Therefore sunset yellow is not shown to
have any molecular interactions with the carbohydrates and proteins studied above, and

43
plus its weak fluorescence intensity compared to allura red and fast green, it is not
considered as a good fluorescent probe for detecting molecular interactions between food
dyes and macromolecules.
Figure 3.3.2 Fluorescence intensity of sunset yellow in water-soluble proteins
3.3.3 Fast green – proteins
The normalized maximum intensity of fast green in all three water soluble proteins
are compared in Figure 3.3.3. An 8 time increase of maximum intensity of fast green is
observed with the addition of gelatin, while a 10 time increase is seen by the addition of
whey protein.
0
1
2
3
4
5
6
7
8
9
0.0% 0.1% 0.2% 0.3% 0.4% 0.5%
No
rmal
ized
Max
imu
m In
ten
sity
Macromolecule Concentration
Sunset Yellow - Proteins
Albumin Whey protein Gelatin

44
Figure 3.3.3 Fluorescence intensity of fast green in water-soluble proteins
These results suggest strong molecular interactions between the fast green molecule
and the protein molecules. In addition, the intensity of fast green increases to about 45
times of the initial intensity with the addition of only 0.03% BSA solution, and the
intensity value tends to decrease and then become constant with further addition of
albumin. This finding verifies previous researches that fast green is capable of binding
multiple protein complexes and also indicates that there are stronger binding sites
between fast green with albumin than with whey and gelatin. By the addition of ~0.03%
albumin, the binding sites are saturated for all fast green molecules so that its
fluorescence activity will not be influenced by the concentration of albumin. A little
0
5
10
15
20
25
30
35
40
45
50
0.0% 0.1% 0.2% 0.3% 0.4% 0.5%
No
rmal
ized
Max
imu
m In
ten
sity
Macromolecule Concentration
Fast Green - Proteins
Albumin Whey protein Gelatin

45
amount of maximum intensity decrease by the addition of more BSA solution suggest
that minor quenching effect takes place when remaining BSA molecules partially disrupts
the strict binding with fast green molecules, or there is redistribution of dye molecules
when BSA increases, leading to fewer binding sites. Therefore fast green shows better
fluorescence sensitivity than allura red and sunset yellow in interacting with proteins
molecules, which makes it a highly potential probe in the quick detection of chemical
properties in food systems.
The binding constant K and binding sites n are calculated by the modified Stern–
Volmer equation after plotting the double-logarithm regression curve of fluorescence
emission intensity data. And the Gibbs free energy change can be calculated through the
equation mentioned in Chapter 3.2.1.
Table 3.3.3 Binding constants and Gibbs free energy change for fast green and
water-soluble proteins (r2 stands for the correlation coefficient for the linear fit.)
Protein T (K) Ka (L/mol) r2 n ΔG (kJ/mol)
Whey protein 293 9563±4.51 0.994 3.43±0.22 -22.33±0.04
Gelatin 293 10741±6.12 0.995 3.22±0.29 -22.61±0.05
As shown in Table 3.3.3, the molecular interactions of fast green-whey protein and
fast green-gelatin are both spontaneous reactions at 20°C because ΔG<0. The Ka value of

46
fast green – BSA cannot be calculated due to the immediate saturation of binding sites at
fairly low concentration of BSA. But it can be deduced that the reaction between fast
green and BSA is also spontaneous (ΔG<0). Further explanation of the rate of binding
will be discussed in chapter 3.6 by calculating the enthalpy changes ΔH and entropy
changes ΔS of the interactions.
3.3.4 Dyes with gliadin and zein
Figure 3.3.4.1 Fluorescence intensity of allura red in gliadin and zein
0
5
10
15
20
25
30
35
40
45
0.0% 0.1% 0.2% 0.3% 0.4% 0.5%
No
rmal
ized
Max
imu
m In
ten
sity
Macromolecule Concentration
Allura Red - Gliadin / Zein (in 80% ethanol)
Zein Gliadin

47
Figure 3.3.4.2 Fluorescence intensity of sunset yellow in gliadin and zein
Figure 3.3.4.3 Fluorescence intensity of fast green in gliadin and zein
0
5
10
15
20
25
30
35
40
0.0% 0.1% 0.2% 0.3% 0.4% 0.5%
No
rmal
ized
Max
imu
m In
ten
sity
Macromolecule Concentration
Sunset Yellow - Gliadin / Zein (in 80% ethanol)
Zein Gliadin
0
10
20
30
40
50
60
70
80
90
100
0.0% 0.1% 0.2% 0.3% 0.4% 0.5%
No
rmal
ized
Max
imu
m In
ten
sity
Macromolecule Concentration
Fast Green - Gliadin / Zein (in 80% ethanol)
Zein Gliadin

48
The normalized maximum intensity of three dyes in zein and gliadin are compared in
Figure 3.3.4.1, 3.3.4.2 and 3.3.4.3. Zein and gliadin are both prepared in 80%
ethanol-water solution to achieve complete dissolution. The same tendency of maximum
intensity of all three dyes are observed with the addition of zein and gliadin, where the
intensity increases dramatically at low concentrations and then dramatically decreases at
higher concentrations. Molecular interactions between food dyes and zein or gliadin
clearly exists, but cannot be identified through these results. Firstly, the intensity values
are higher than the optimal range (105~106cps) of the instrument, which may cause
inaccuracy of the measurement. Secondly, the intensity decrease may be attributed to the
concentration quenching. Higher concentrations of zein/gliadin in ethanol may cause the
dye molecules to self-aggregate and thus not absorbing and emitting enough light,
leading to a decrease of fluorescence sensitivity. Third and most importantly, the
existence of ethanol in the system may alter the structure of the protein and the dye
molecules. Therefore it is difficult to explain the fluorescence behavior of food dyes in
water-insoluble proteins. This experiment also shows that organic solvents may become
an obstacle in studying the molecular interactions between food dyes and
macromolecules.

49
3.4 Dye – Macromolecule anisotropy study
Anisotropy study is carried out to identify if the molecular interactions between food
dyes and macromolecules are having impact on the rotational time of the dye molecule.
The average anisotropy value of the food dyes is measured each time by the addition of
macromolecule solutions.
3.4.1 Allura red anisotropy
Figure 3.4.1 Anisotropy of allura red in macromolecule solutions
0
0.1
0.2
0.3
0.4
0.5
0.6
0.7
0.00% 0.10% 0.20% 0.30% 0.40% 0.50%
An
iso
tro
py
Macromolecule Concentration
Allura Red Anisotropy
MC CMC Amylopectin Chitosan Alginate
Gelatin Whey protein Albumin Zein Gliadin

50
The anisotropy values of allura red in different concentrations of all macromolecule
solutions are shown in Figure 3.4.1. Initial anisotropy value for 20μM allura red in water
is ~0.38. This value is close to the theoretical maximum value 0.4, so it indicates that
allura red molecule is immobile on the fluorescence lifetime in fluid water solution. The
anisotropy of allura red increases with the addition of: amylopectin, MC, alginate;
decreases with the addition of zein (in 80% ethanol); and does not change with the
addition of other macromolecule solutions.
3.4.2 Sunset yellow anisotropy
Figure 3.4.2 Anisotropy of sunset yellow in macromolecule solutions
0
0.1
0.2
0.3
0.4
0.5
0.6
0.7
0.8
0.9
0.00% 0.10% 0.20% 0.30% 0.40% 0.50%
An
iso
tro
py
Macromolecule Concentration
Sunset Yellow Anisotropy
MC CMC Amylopectin Chitosan Alginate
Gelatin Whey protein Albumin Zein Gliadin

51
The anisotropy values of sunset yellow in different concentrations of all
macromolecule solutions are shown in Figure 3.4.2. Initial anisotropy value for 20μM
sunset yellow in water is ~0.43. This is also a high anisotropy value, which exceeds the
theoretical maximum of 0.40. Though alignment and measurements are both done in
correct ways, measuring the anisotropy of sunset yellow molecules is not applicable. The
anisotropy of sunset yellow increases with the addition of: amylopectin, MC, gliadin (in
80% ethanol); and decreases with the addition of zein (in 80% ethanol), chitosan, CMC.
3.4.3 Fast green anisotropy
Figure 3.4.3 Anisotropy of fast green in macromolecule solutions
0
0.05
0.1
0.15
0.2
0.25
0.3
0.35
0.4
0.45
0.5
0.00% 0.10% 0.20% 0.30% 0.40% 0.50%
An
iso
tro
py
Macromolecule Concentration
Fast Green Anisotropy
MC CMC Amylopectin Chitosan Alginate
Gelatin Whey protein Albumin Zein Gliadin

52
The anisotropy values of fast green in different concentrations of all macromolecule
solutions are shown in Figure 3.4.3. Initial anisotropy value for 5μM fast green in water
is ~0.37. This is a possible value but still too high for an ideal anisotropy measurement.
The anisotropy of fast green decreases with the addition of zein, gliadin and does not
change dramatically with the addition of other macromolecule solutions.
According to the equation of observed anisotropy, 𝑟 =𝑟0
1+𝜏 𝜙⁄ the molecular
interactions between food dyes and macromolecules can be deduced from the rotational
time constant (𝜙) if any binding occurs. Firstly, the fluorescence lifetime (𝜏) is also an
important factor that affects anisotropy. When the rotational time constant changes, the
lifetime of the dye probe still remains too short so that 𝜏 𝜙⁄ will not be affected at an
obvious level, thus leading to no changes in observed anisotropy. That explains why the
interacting combinations found in the fluorescence intensity study do not show changes
on anisotropy values with the addition of macromolecules. Secondly, anisotropy
decreases of the dyes with gliadin and zein verifies results from the intensity study that
the molecular structure and fluorescence behavior can be affected by organic solvents
such as ethanol. Thirdly, increases in anisotropy for all three dyes in amylopectin solution
suggests that light scattering has caused the intensity difference of light on different
directions of polarization. Extreme turbid solutions (such as high concentration
un-gelatinized amylopectin) are often used for alignment of the instrument before
anisotropy and polarization measurements. Fourthly, the anisotropy results are mostly

53
around or above the theoretical maximum value 0.4, which suggest that there are
systematic error in the instrument and light scattering in the samples. So it can be
concluded that anisotropy measurement does not serve as an appropriate method to
discover the molecular interactions between synthetic food dyes and macromolecules
because the factors are hard to control. Therefore, to further study the possible
interactions, ionic strength and temperature should be two major factors taken into
consideration.
3.5 Ionic strength study
Ionic strength study aims to decide whether electrostatic interactions are involved in
the molecular interactions between food dyes and macromolecules. Ionic strength study is
needed since electrostatic binding are vulnerable to increasing ionic strength, while
hydrogen bonds and hydrophobic interactions are not. The fluorescence emission
intensity of allura red and fast green are measured in selected macromolecules by the
presence of sodium chloride solution.
3.5.1 Effect of constant salt solution
The fluorescence emission intensity of allura red is measured at various
concentrations of BSA with and without the addition of 0.05M sodium chloride solution.

54
Figure 3.5.1.1 Effect of salt solution in allura red – albumin
Figure 3.5.1.1 shows that with the presence of 0.05M NaCl solution, the fluorescence
maximum intensity of allura red increases up to 50% compared to samples without
addition of salt. This indicates that ionic strength, at relatively low concentration, can
enhance the fluorescence sensitivity of the allura red molecule. Previous research (Lelis,
2017) have suggested that hydrophobic interaction is the major molecular interaction
between allura red and BSA. The hydrophobicity of allura red is caused by its three
benzene rings as a heterocyclic compound, and it tends to bind the Sudlow’s site I on the
BSA complex. Therefore by the addition of low concentration salt solution, the
hydrophobic interaction is insensitive to the increasing ionic strength, and may lead to
restriction of the rotation of allura red molecules, thus causing the fluorescence
sensitivity of allura red to increase.
0
2
4
6
8
10
12
14
0.00% 0.10% 0.20% 0.30% 0.40% 0.50% 0.60%No
rmal
ized
Max
imu
m In
ten
sity
Albumin
Allura red - Albumin
AR AR+0.05M NaCl

55
Figure 3.5.1.2 Effect of salt solution in allura red – MC
The fluorescence emission intensity of allura red is measured at various
concentrations of methyl cellulose with and without the addition of 0.05M sodium
chloride solution. Figure 3.5.1.2 indicates that with the presence of 0.05M NaCl solution,
the fluorescence maximum intensity of allura red does not have an obvious increase or
decrease. This result suggest that low ionic strength is not affecting the molecular
interactions between allura red and methyl cellulose molecules. Different from allura red
and BSA, the molecular interaction between allura red and methyl cellulose cannot be
characterized as hydrophobic interaction. One possible explanation is that there is
hydrophobic interactions between allura red and MC, thus there is no effect of low ionic
0
1
2
3
4
5
0.00% 0.10% 0.20% 0.30% 0.40% 0.50% 0.60%No
rmal
ized
Max
imu
m In
ten
sity
MC
Allura red - MC
AR AR+0.05M NaCl

56
strength on the hydrogen bonds. On the other hand, the influence of local viscosity on the
azo dye is also considered as a minor factor on the increase of its fluorescence sensitivity.
Figure 3.5.1.3 Effect of salt solution in fast green – albumin
The fluorescence emission intensity of fast green is measured at various
concentrations of BSA with and without the addition of 0.05M sodium chloride solution.
Figure 3.5.1.3 indicates that with the presence of 0.05M NaCl solution, the fluorescence
maximum intensity of fast green is decreased by 30-50%, which means that ionic strength
is strongly disrupting the molecular interactions between fast green and BSA, leading to
the tendency of non-radiative decay for fast green molecules. Therefore the molecular
interaction between fast green and BSA involves at least electrostatic interactions because
electrostatic interactions are highly sensitive to ionic strength. The three sulfonate groups
0
10
20
30
40
50
60
0.0% 0.1% 0.2% 0.3% 0.4% 0.5%No
rmal
ize
d M
axim
um
Inte
nsi
ty
Albumin
Fast green - Albumin
FG FG+0.05M NaCl

57
on fast green, which are negatively charged, may have strong interactions with those
amino acid side chains of BSA, which are positively charged. Also, another factor that
causes the decrease of fluorescence intensity decrease is that fast green, having multiple
hydrogen bond acceptor units on its molecular structure, can form strong hydrogen bonds
with BSA complex. This also explains that why the fluorescence intensity is dramatically
increased by increasing albumin concentration. The electrostatic interactions are
vulnerable to ionic strength, so an intensity decrease is expected by the addition of salt
solution.
Figure 3.5.1.4 Effect of salt solution in fast green – whey protein
The fluorescence emission intensity of fast green is measured at various
concentrations of whey protein with and without the addition of 0.05M sodium chloride
0
2
4
6
8
10
12
0.0% 0.1% 0.2% 0.3% 0.4% 0.5%No
rmal
ized
Max
imu
m In
ten
sity
Whey protein
Fast green - Whey protein
FG FG+0.05M NaCl

58
solution. Figure 3.5.1.4 indicates that with the presence of 0.05M NaCl solution, the
fluorescence maximum intensity of fast green does not change obviously. This suggests
that ionic strength, at low concentration, is not affecting the molecular interactions
between fast green and whey protein molecules. In the fluorescence intensity – protein
concentration study, it is suggested that the molecular interaction between fast green and
whey protein is much weaker than that of fast green and albumin. Even though
electrostatic interaction is still the major interaction for both situations, the binding sites
of hydrogen bonds must be lesser in fast green – whey protein. Therefore when fast green
binds to these proteins, there is a more obvious conformational change for the BSA
complex than the whey protein complex. Binding sites of fast green on BSA are
identified by previous molecular docking research (Wang, 2014) verifying the strong
electrostatic interactions between fast green and BSA.
3.5.2 Effect of varying concentration of salt solution
The fluorescence emission intensity of the allura red is measured in 0.50%
macromolecule solution with the presence of sodium chloride solutions at different
concentrations (0, 0.05M, 0.25M, and 0.50M). From Figure 3.5.2.1, for allura red in
methyl cellulose, maximum intensity gradually decreases with increasing salt
concentration.

59
Figure 3.5.2.1 Effect of salt concentration in allura red – macromolecules
For allura red in both whey protein and albumin, the maximum intensity first
increases with the addition of 0.05M NaCl, and then decreases with increasing salt
concentration. All three dyes, shows a ~10% decrease of maximum intensity with the
addition of 0.50M NaCl, compared to its initial maximum intensity without the presence
of salt. This result verifies the ionic strength study for allura red that electrostatic
interaction is the involved in the molecular interaction between allura red and methyl
cellulose. Surprisingly, there is an increase of fluorescence intensity by the addition of
0.05M salt solution in BSA and whey protein. This suggests that besides from
electrostatic interactions, other kinds of interactions may still play a role in the molecular
interactions between allura red and proteins, which is insensitive to ionic strength. But
0.5
0.8
1.1
1.4
1.7
0.00 0.10 0.20 0.30 0.40 0.50 0.60
Max
imu
m In
ten
sity
NaCl (mol/L)
Allura red - NaCl
AR+Whey AR+Albumin AR+MC

60
with further increase of salt concentration, the fluorescence intensity is still decreasing
since the electrostatic interactions are being disrupted by the ionic strength.
Figure 3.5.2.2 Effect of salt concentration in fast green – macromolecules
The fluorescence emission intensity of the fast green is measured in 0.50%
macromolecule solution with the presence of sodium chloride solutions at different
concentrations (0, 0.05M, 0.25M, and 0.50M). From Figure 3.5.2.2, for fast green in
methyl cellulose, maximum intensity does not have an obvious change with increasing
salt concentration, which verifies the fluorescence intensity – macromolecule
concentration study that fast green in not interacting with methyl cellulose. For fast green
in both whey protein and albumin, the maximum intensity decreases with increasing salt
concentration, and shows a 30%-40% decrease of maximum intensity with the addition of
0.3
0.5
0.7
0.9
1.1
1.3
0.00 0.10 0.20 0.30 0.40 0.50 0.60
Max
imu
m In
ten
sity
NaCl (mol/L)
Fast Green - NaCl
FG+Whey FG+Albumin FG+MC

61
0.50M NaCl, compared to its initial maximum intensity without the presence of salt. This
result verifies that electrostatic interaction is a contributor to the fast green – protein
interaction which leads to the increase of its fluorescence sensitivity. At low salt
concentrations the fluorescence intensity of fast green has a higher decrease in BSA
(~30%) than in whey protein (~10%), suggesting that the electrostatic bonds between fast
green and BSA are more susceptible to ionic strength than those between fast green and
whey protein.
3.6 Temperature study
Temperature study is carried out in order to further understand the binding between
allura red, fast green and the water-soluble proteins. Thermodynamic parameters can be
calculated through measurements at multiple temperatures. The fluorescence emission
intensity of allura red and fast green are measured in 0.50% selected macromolecule
solutions at the following temperatures: 20°C, 25°C, 31°C and 37°C. At these
temperatures denaturation of protein or structure changes of dye molecules will not occur,
therefore the binding properties can be better studied.

62
3.6.1 Effect of temperature on allura red – protein
Figure 3.6.1 shows the fluorescence emission intensity of allura red in 0.50%
macromolecule solution with varying temperatures (20°C, 25°C, 31°C and 37°C). For
both albumin and whey, the maximum intensity of allura red decreases significantly with
increasing temperature.
Figure 3.6.1 Effect of temperature in allura red – proteins
Compared to the initial maximum intensity at 20°C, the intensity of allura red at
37°C shows a ~25% decrease in whey protein, and a ~45% decrease in BSA. This
verifies that the theory that hydrogen bonding and hydrophobic interactions are involved
in molecular interactions between allura red and protein complexes, so these interactions
will be disrupted by increasing temperature.
0.4
0.5
0.6
0.7
0.8
0.9
1
1.1
20 25 30 35 40No
rmal
ized
max
imu
m in
ten
sity
Temperature (°C)
Allura red
Albumin Whey

63
Enthalpy change and entropy change of the dye-protein interaction can be calculated
according to van’t Hoff equation:
ln 𝐾𝑎 = −∆𝐻
𝑅𝑇+
∆𝑆
𝑅
Where Ka stands for the binding constant (L/mol), R is the universal gas constant 8.3145
J/(mol K), T is the temperature (K), ΔH refers to enthalpy change (J/mol), and ΔS refers
to entropy change (J/mol). Since the value change of binding sites n in the modified
Stern–Volmer equation can be neglected within small temperature changes, the
approximate values of ΔH and ΔS can be calculated by plotting the InKa – 1/T curve for
linear regression.
Table 3.6.1 Enthalpy and entropy changes for allura red-protein interaction
(r2 stands for the correlation coefficient for the linear fit.)
ΔH (kJ/mol) ΔS (kJ/mol) r2
BSA -58.77±2.45 -0.12±0.01 0.980
Whey protein -45.12±2.06 -0.08±0.01 0.992
From Table 3.6.1, for interactions between allura red and both BSA and whey protein,
the negative ΔH values suggests that the major force of the molecular interactions is
hydrogen bonding. ΔS values are both negative, indicating that hydrophobic interactions
should not be a major contributor to the molecular interactions between allura red and
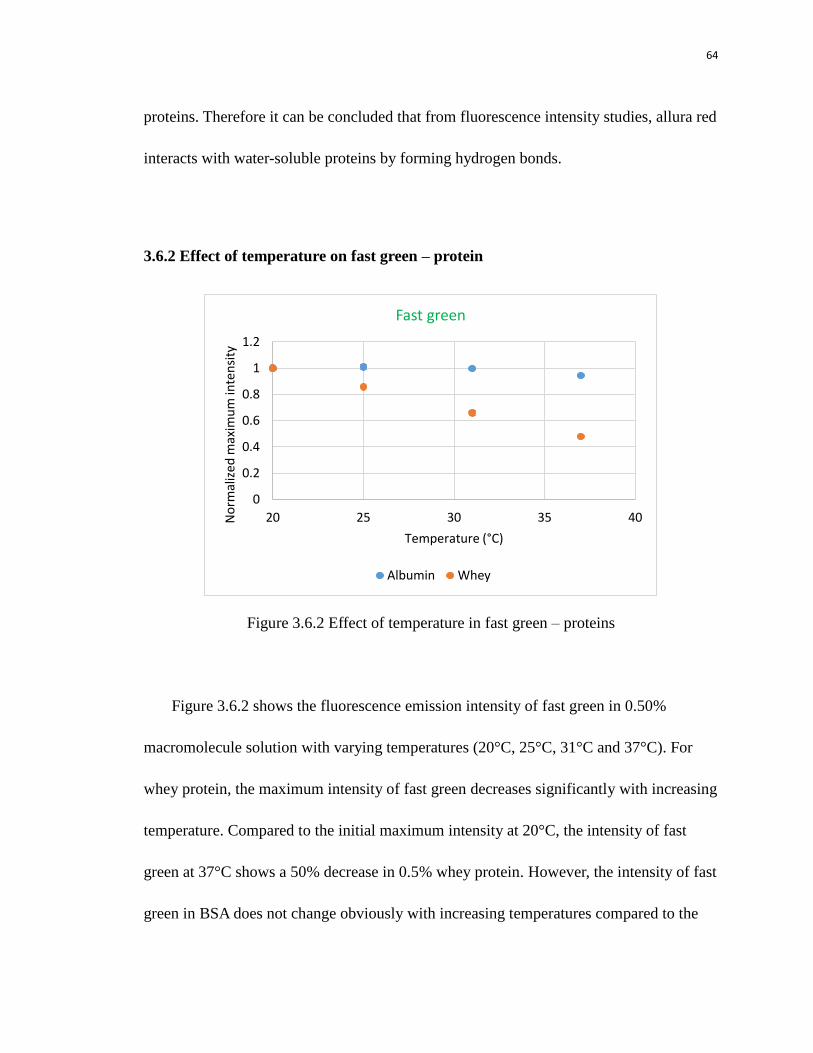
64
proteins. Therefore it can be concluded that from fluorescence intensity studies, allura red
interacts with water-soluble proteins by forming hydrogen bonds.
3.6.2 Effect of temperature on fast green – protein
Figure 3.6.2 Effect of temperature in fast green – proteins
Figure 3.6.2 shows the fluorescence emission intensity of fast green in 0.50%
macromolecule solution with varying temperatures (20°C, 25°C, 31°C and 37°C). For
whey protein, the maximum intensity of fast green decreases significantly with increasing
temperature. Compared to the initial maximum intensity at 20°C, the intensity of fast
green at 37°C shows a 50% decrease in 0.5% whey protein. However, the intensity of fast
green in BSA does not change obviously with increasing temperatures compared to the
0
0.2
0.4
0.6
0.8
1
1.2
20 25 30 35 40No
rmal
ized
max
imu
m in
ten
sity
Temperature (°C)
Fast green
Albumin Whey

65
initial maximum intensity. This result indicate that the molecular interactions between
fast green and BSA are so strong that increasing temperature is not able to disrupt the
specific binding sites.
Table 3.6.2 Enthalpy and entropy changes for fast green-protein interaction
(r2 stands for the correlation coefficient for the linear fit.)
ΔH (kJ/mol) ΔS (kJ/mol) r2
BSA -11.45±0.23 0.16±0.001 0.957
Whey protein -24.07±0.45 -0.005±0.001 0.993
Table 3.6.2 shows the thermodynamic parameters for fast green-BSA interactions
and fast green-whey protein interactions. For fast green and whey protein, the driving
force of the interaction is probably hydrogen bonding because ΔH<0, while the negative
ΔS means hydrophobic interactions is not considered as a contributor to the interaction.
However, for BSA and fast green, ΔH is negative while ΔS is positive, which means that
probably both hydrogen bonding and hydrophobic interactions are playing important
roles in the strong interaction between BSA and fast green. The contribution of
hydrophobic interaction also explains the result that at higher temperatures the
fluorescence intensity of fast green in BSA hardly decreases.

66
4. CONCLUSIONS
The fluorescence sensitivity of three synthetic food dyes (allura red, sunset yellow
and fast green) in ten selected food macromolecule solutions (methyl cellulose,
carboxymethyl cellulose, amylopectin, alginate and chitosan, bovine serum albumin,
whey protein isolate, porcine gelatin, wheat gliadin and corn zein) are studied and
compared by macromolecule concentration effect study, anisotropy measurements, ionic
strength effect study and temperature study.
It is found that sunset yellow, as the weakest fluorescent probe among the three dyes,
barely shows any fluorescence intensity increase in all macromolecule solutions,
suggesting no obvious molecular interactions between sunset yellow and these
carbohydrates and proteins.
The fluorescence intensity of fast green is significantly affected by the addition of all
water-soluble proteins. Fast green exhibits a very strong interaction with BSA involving
electrostatic interactions, hydrogen bonding and hydrophobic interactions, also it
interacts with whey protein and gelatin due to hydrogen bonding and electrostatic
interactions. On the other hand, fast green is not shown to have molecular interactions
with any of the carbohydrates studied.
Allura red, which also has an increase in fluorescence intensity by the addition of all
water-soluble proteins, shows less sensitivity to protein molecules than fast green. Major
molecular interactions between allura red and BSA, whey protein and gelatin involve

67
hydrogen bonding. For carbohydrates, allura red only exhibits sensitivity to methyl
cellulose, due to the effect of hydrophobic interactions.
These results provide insights into the molecular interactions between synthetic dyes
and food macromolecules. It can be concluded that both allura red and fast green have the
potential of being luminescent probes in monitoring food quality, especially considering
their strong molecular interactions with water-soluble proteins. The fluorescent probes
can possibly be used in the future for quick detection of certain food additives or
chemical adulterants, and even microbial activity and shelf life of food products.
Further studies should focus on the fluorescence behavior of lipo-soluble dye
molecules, or use synthetic food dyes to discover interactions between complicated food
systems, such as protein-protein interactions, carbohydrate-protein interactions, effect of
emulsifiers, etc. The findings may contribute to the development of novel fluorescence
technology which may one day be massively applied in the food industry as a highly
efficient analytical method.

68
REFERENCES
Abdullah, S. U., Badaruddin, M., Sayeed, S. A., Ali, R., & Riaz, M. N. (2008).
Binding ability of Allura Red with food proteins and its impact on protein
digestibility. Food chemistry, 110(3), 605-610.
Albrecht, A. C. (1961). Polarizations and assignments of transitions: the method of
photoselection. Journal of Molecular Spectroscopy, 6, 84-108.
Basu, A., & Kumar, G. S. (2015). Thermodynamics of the interaction of the food
additive tartrazine with serum albumins: A microcalorimetric investigation. Food
chemistry, 175, 137-142.
Bokkhim, H., Bansal, N., Grøndahl, L., & Bhandari, B. (2015). Interactions between
different forms of bovine lactoferrin and sodium alginate affect the properties of their
mixtures. Food Hydrocolloids, 48, 38-46.
Bolel, P., Datta, S., Mahapatra, N., & Halder, M. (2012). Spectroscopic Investigation
of the Effect of Salt on Binding of Tartrazine with Two Homologous Serum Albumins:
Quantification by Use of the Debye–Huckel Limiting Law and Observation of Enthalpy–
Entropy Compensation. The Journal of Physical Chemistry B, 116(34), 10195-10204.
Carneiro-da-Cunha, M. G., Cerqueira, M. A., Souza, B. W., Teixeira, J. A., & Vicente,
A. A. (2011). Influence of concentration, ionic strength and pH on zeta potential and
mean hydrodynamic diameter of edible polysaccharide solutions envisaged for
multinanolayered films production. Carbohydrate polymers, 85(3), 522-528.
Corradini, M. G., & Ludescher, R. D. (2015). Making sense of luminescence from
GRAS optical probes. Current Opinion in Food Science, 4, 25-31.
Damodaran, S., Parkin, K. L., & Fennema, O. R. (Eds.). (2007). Fennema's food
chemistry. CRC press.
Draganski, A. R., Tiwari, R. S., Sundaresan, K. V., Nack, T. J., You, Y., & Ludescher,
R. D. (2010). Photophysical probes of the amorphous solid state of proteins. Food
biophysics, 5(4), 337-345.
Du, H., Kim, C., Corradini, M. G., Ludescher, R. D., & Rogers, M. A. (2014).
Micro-viscosity of liquid oil confined in colloidal fat crystal networks. Soft
matter, 10(43), 8652-8658.
Fazeli, S., Sohrabi, B., & Tehrani-Bagha, A. R. (2012). The study of Sunset Yellow
anionic dye interaction with gemini and conventional cationic surfactants in aqueous
solution. Dyes and Pigments, 95(3), 768-775.
Fonin, A. V., Sulatskaya, A. I., Kuznetsova, I. M., & Turoverov, K. K. (2014).
Fluorescence of dyes in solutions with high absorbance. Inner filter effect
correction. PLoS One, 9(7), e103878.
Genovese, D. B., & Lozano, J. E. (2001). The effect of hydrocolloids on the stability
and viscosity of cloudy apple juices. Food Hydrocolloids, 15(1), 1-7.

69
Ghosh, A. K., & Bandyopadhyay, P. (2012). Polysaccharide-protein interactions and
their relevance in food colloids. INTECH Open Access Publisher.
Gijsbers, A., Nishigaki, T., & Sánchez-Puig, N. (2016). Fluorescence Anisotropy as a
Tool to Study Protein-protein Interactions. JoVE (Journal of Visualized Experiments),
(116), e54640-e54640.
Guilbault, G. G. (Ed.). (1990). Practical fluorescence (Vol. 3). CRC Press.
Hashem, M. M., Atta, A. H., Arbid, M. S., Nada, S. A., & Asaad, G. F. (2010).
Immunological studies on Amaranth, Sunset Yellow and Curcumin as food colouring
agents in albino rats. Food and Chemical Toxicology, 48(6), 1581-1586.
Jameson, D. M., & Ross, J. A. (2010). Fluorescence polarization/anisotropy in
diagnostics and imaging. Chemical reviews, 110(5), 2685-2708.
Joye, I. J., Davidov-Pardo, G., Ludescher, R. D., & McClements, D. J. (2015).
Fluorescence quenching study of resveratrol binding to zein and gliadin: towards a more
rational approach to resveratrol encapsulation using water-insoluble proteins. Food
chemistry, 185, 261-267.
Kashanian, S., Zeidali, S. H., Omidfar, K., & Shahabadi, N. (2012).
Multi-spectroscopic DNA interaction studies of sunset yellow food additive.Molecular
biology reports, 39(12), 10045-10051.
Kashi, A., Waxman, S. M., Komaiko, J. S., Draganski, A., Corradini, M. G., &
Ludescher, R. D. (2015). Potential use of food synthetic colors as intrinsic luminescent
probes of the physical state of foods. Chemical Sensory Informatics of Food:
Measurement, Analysis, Integration, 1191.
Lakowicz, J. R. (Ed.). (2013). Principles of fluorescence spectroscopy. Springer
Science & Business Media.
Lelis, C. A., Hudson, E. A., Ferreira, G. M. D., Ferreira, G. M. D., da Silva, L. H. M.,
da Silva, M. D. C. H., ... & dos Santos Pires, A. C. (2017). Binding thermodynamics of
synthetic dye Allura Red with bovine serum albumin.Food Chemistry, 217, 52-58.
Li, T., Cheng, Z., Cao, L., & Jiang, X. (2016). Comparison of interactions between
three food colorants and BSA. Food chemistry, 194, 740-748.
Liu, B. S., Wang, J., Xue, C. L., Yang, C., & Lü, Y. K. (2012). Effects of synthetic
food colorants on the interaction between norfloxacin and bovine serum albumin by
fluorescence spectroscopy. Monatshefte für Chemie-Chemical Monthly, 143(3), 401-408.
Li, Y. F., Huang, C. Z., & Li, M. (2002). A resonance light-scattering determination
of proteins with fast green FCF. Analytical sciences, 18(2), 177-181.
Malhotra, A., & Coupland, J. N. (2004). The effect of surfactants on the solubility,
zeta potential, and viscosity of soy protein isolates. Food Hydrocolloids, 18(1), 101-108.
Mali, P. L., Mahajan, M. M., Patil, D. P., & Kulkarni, M. V. (2000).
Biodecolourisation of members of triphenylmethane and azo group of dyes.
Masone, D., & Chanforan, C. (2015). Study on the interaction of artificial and natural
food colorants with human serum albumin: A computational point of
view. Computational biology and chemistry, 56, 152-158.

70
McAvoy, S. A. (2014). Global Regulations of Food Colors. Manufacturing
Confectioner, 77.
McCann, D., Barrett, A., Cooper, A., Crumpler, D., Dalen, L., Grimshaw, K., ... &
Sonuga-Barke, E. (2007). Food additives and hyperactive behaviour in 3-year-old and
8/9-year-old children in the community: a randomised, double-blinded,
placebo-controlled trial. The lancet, 370(9598), 1560-1567.
McGOWN, L. B., & Nithipatikom, K. (2000). Molecular fluorescence and
phosphorescence.
Mittal, A., Kaur, D., & Mittal, J. (2009). Batch and bulk removal of a triarylmethane
dye, Fast Green FCF, from wastewater by adsorption over waste materials. Journal of
Hazardous Materials, 163(2), 568-577.
Nazar, M. F., & Murtaza, S. (2014). Physicochemical investigation and spectral
properties of Sunset Yellow dye in cetyltrimethylammonium bromide micellar solution
under different pH conditions. Coloration Technology,130(3), 191-199.
Ramazanova, G. R., Tikhomirova, T. I., & Apyari, V. V. (2013). Sorption of food
dyes on polyurethane foam and aluminum oxide. Moscow University Chemistry
Bulletin, 68(4), 175-180.
Ross, P. D., & Subramanian, S. (1981). Thermodynamics of protein association
reactions: forces contributing to stability. Biochemistry, 20(11), 3096-3102.
Valeur, B., & Berberan-Santos, M. N. (2012). Molecular fluorescence: principles and
applications. John Wiley & Sons.
Waxman, S. M., Kashi, A., Karami, A., Patel, M., Corradini, M. G., & Ludescher, R.
(2015). Food Colors as Intrinsic Luminescent Sensors in Edible Products. Biophysical
Journal, 108(2), 623a.
Wang, L., Zhang, G., & Wang, Y. (2014). Binding properties of food colorant allura
red with human serum albumin in vitro. Molecular biology reports,41(5), 3381-3391.
Wolfbeis, O. S. (1985). The fluorescence of organic natural products (pp. 167-370).
Wiley.
Wu, D., Yan, J., Wang, J., Wang, Q., & Li, H. (2015). Characterisation of interaction
between food colourant allura red AC and human serum albumin: Multispectroscopic
analyses and docking simulations. Food chemistry, 170, 423-429.