identification of marine mammal species in food products
TRANSCRIPT

Journal of the Science of Food and Agriculture J Sci Food Agric 80:527±533 (2000)
Identification of marine mammal species in foodproductsIciar Martinez1* and Anna K Danıelsdottir2
1Norwegian Institute of Fisheries and Aquaculture Ltd, N-9291 Tromsø, Norway2The Population Genetic Laboratory, Marine Research Institute, c/o Biotechnology House, Keldnaholt, IS-112 Reykjavik, Iceland
(Rec
* CoCont
# 2
Abstract: Reference samples and processed products (frozen, smoked, salted, dried and gravad meat
and blubber) from harp seal and minke, sei and ®n whales were tested for species-diagnostic molecular
markers by random ampli®cation of polymorphic DNA (RAPD) and single-strand conformational
polymorphism (SSCP) analysis of amplicons obtained using consensus primers for mitochondrial
cytochrome b (mt cytb). RAPD analysis produced clear ®ngerprints of the products analysed from
which the species could be easily identi®ed. The interpretation of the SSCP analysis was less clear,
probably owing to the use of consensus primers and, in ®n whales, to intraspeci®c polymorphism.
Except for one, all the commercial products were correctly labelled, and it was possible to identify the
species in all the products labelled simply as `whale': three of them contained minke whale and two ®n
whale.
# 2000 Society of Chemical Industry
Keywords: species identi®cation; RAPD; SSCP; marine mammals
INTRODUCTIONThe meat and blubber of marine mammals have
traditionally been important constituents of the diet of
countries such as Norway, Iceland, Greenland, Cana-
da and Japan. Other parts of the carcasses were used to
obtain products such as skins, cords, utensils, etc.
Although restrictions have been imposed on whaling
and sealing, this activity is legal for some species in
some countries, and the food products are still appre-
ciated by consumers. Meat and blubber are usually
purchased for human consumption in the form of
fresh, frozen or thawed products, or after preservation
by procedures such as smoking or salting. Identi®ca-
tion of the species used in the manufacture of these
products cannot be done visually, and seal meat has
occasionally been sold as whale meat, which is more
expensive. In addition, some species or stocks of
marine mammals are considered endangered.1 It is
therefore desirable for both consumers and the
authorities to have available methods that permit the
identi®cation of the species used in the manufacture of
a product to preserve consumer rights and current
legislation.
Species identi®cation can be achieved using protein-
and DNA-based methods (see reviews by Leighton
Jones,2 Mackie,3 Meyer and Candrian4 and Sotelo etal5). Protein pro®les are always tissue-dependent,
while species identi®cation using DNA-based
methods is independent of the tissues being compared.
Two DNA-based methods that have been used for
species identi®cation are single-strand conformational
eived 2 September 1999; accepted 8 November 1999)
rrespondence to: Iciar Martinez, Norwegian Institute of Fisheries andract/grant sponsor: Norwegian Research Council; contract/grant num
000 Society of Chemical Industry. J Sci Food Agric 0022±5142/2
polymorphism (SSCP) of polymerase chain reaction
(PCR)-ampli®ed fragments6±8 and random ampli®ca-
tion of polymorphic DNA (RAPD).9±13 For processed
products, such as smoked or salted, in which the DNA
is well preserved or only partially degraded, RAPD has
been shown to produce good ®ngerprints,11 but in
heavily processed products (canning) the DNA is
usually degraded into smaller fragments. In the last
case the preferred techniques are those that target
small DNA fragments. The aim of the present work
was to test the suitability of RAPD and PCR-SSCP
analyses for species identi®cation in meat and blubber
products of marine mammals. It was not our aim to
determine the stock from which the sample originated,
since that would have required a different approach,
including a comprehensive genetic analysis of the
presumed existing stocks for each species with the
techniques used here. Determination of the stock can
be more easily undertaken once the species has been
determined.
MATERIALS AND METHODSSamplesThe samples and their descriptions are shown in Table
1. Samples 1±4, 9, 10±13 and 23±25 were reference
samples of harp seal (Phoca groenlandica), sei whale
(Balaenoptera borealis), minke whale (B acutorostrata)
and ®n whale (B physalus) respectively obtained during
Norwegian14,15 and Icelandic16 commercial and
scienti®c expeditions. Samples 8 and 14 were pur-
Aquaculture Ltd, N-9291 Tromsø, Norwayber: 113918/112
000/$17.50 527

Table 1. Samples analysed, their origin and means of identification
Sample no Processing (preservation) and tissue Species declared a
Species identi®ed by the
analyses
RAPD PCR-SSCP
1±4 Frozen muscle Harp seal (R) Harp seal Harp seal
5 Dried muscle Harp seal Harp seal Harp seal
6, 7 Smoked muscle Harp seal Harp seal Harp seal
8 Salted smoked cooked muscle Harp seal Minke whale Minke whale
9 Ethanol-preserved muscle Sei whale (R) Sei whale Sei whale
10 Ethanol-preserved muscle Minke whale (R) Minke whale Unidenti®ed
11, 12 Ethanol-preserved muscle Minke whale (R) Minke whale Minke whale
13 Dried muscleb Minke whale (R) Minke whale Minke whale
14 Dried muscle Minke whale Minke whale Minke whale
15, 16 Smoked muscle Whale Minke whale Minke whale
17 Gravad muscle Whale Minke whale Minke whale
18 Salted blubber Whale Fin whale Fin whale
19 Gravad muscle Whale Minke whale Minke whale
20 Dried muscle Fin whale Fin whale Fin whale
21, 22 Qiporaq muscle Fin whale Fin whale Fin whale
23±25 Ethanol-preserved muscle Fin whale (R) Fin whale Fin whale
a R, reference sample.b Dried for 2years at the laboratory.
Figure 1. Agarose gel electrophoresis (0.01gmlÿ1) of undiluted DNAextracts. L, standard l DNA (23kb). The sample number is indicated on topof each lane.
I Martinez, AK DanõÂelsdoÂttir
chased at local stores in Tromsù. The shop at which
sample 8 was purchased sold salted smoked cooked
products of both minke whale and harp seal. Sample 8,
which was unlabelled, was claimed to be made of harp
seal. The rest of the products were purchased at local
stores in Greenland.
DNA extractionGenomic DNA extraction was carried out according
to Miller et al17 with the modi®cations described
below. About 50±100mg of muscle samples were
weighed in 2ml Eppendorf tubes and ®nely cut with
scissors. Then 400ml of lysis buffer,17 0.4M NaCl,
10mM Tris-HCl, pH 8.0 and 2mM ethylenediamine-
tetraacetic acid (EDTA), pH 8.0 were added to each
tube, followed by 10ml of 0.2gmlÿ1 SDS and 10ml of
20mg mlÿ1 proteinaseK, which gave ®nal concentra-
tions of 5mg mlÿ1 and 0.5mg mlÿ1 respectively. The
contents of the tubes were mixed by inversion several
times and incubated at 55°C for 3h or overnight with
occasional mixing. After incubation the samples were
cooled on ice, and 360ml of 6M (saturated) NaCl was
added to each tube. The tubes were vortexed for 1min
at maximum speed and centrifuged for 20min at
16000�g in an Eppendorf 5415 C (Hamburg,
Germany) bench centrifuge. The supernatants were
recovered and transferred to new tubes, and isopro-
panol in a 2:1 (v/v, isopropanol/supernatant) ratio was
added to each tube. The tubes were inverted several
times, incubated at ÿ20°C for at least 1h and
centrifuged for 30min at 16000�g. The supernatants
were discarded and the DNA pellets were washed with
70:30 (v/v) ethanol/water. The pellets were dried at
room temperature and resuspended in 200ml of 50mM
Tris-HCl, pH 8.0. The amount and quality of the
DNA were estimated by comparison with known
528
amounts of l DNA after electrophoresis on 0.01g
mlÿ1 agarose gels in 0.5�Tris-boric-EDTA (TBE)
buffer.18 Fig 1 shows the pattern of the DNA extracted
from the samples analysed.
DNA amplificationArbitrarily primed ampli®cations19,20 were performed
in 30ml volumes. For each sample, two dilutions21,22
containing approximately 1 and 5ngmlÿ1 DNA were
ampli®ed as follows. 10ml aliquots of the DNA extracts
containing 10 and 50ng of the template DNA were
added to 20ml of a mixture to give ®nal concentrations
of 1�DNA polymerase buffer (supplied by the
manufacturer), 100mM each dATP, dCTP, dGTP
and dTTP, 0.4mM 10-mer primer (Operon Technol-
ogies Inc, Alameda, CA, USA) and 4mM MgCl2 (®nal
concentration)23 with 0.75 units of Klen Taq1 DNA
polymerase (AB Peptides, St Louis, MO, USA). The
primers used were M-01 (5'-GTT GGT GGC T-3')and T-20 (5'-GAC CAA TGC C-3'). The reaction
mixtures were overlaid with 20ml of Chill Out Wax
(MJ Research Inc, Watertown, MA, USA), and
J Sci Food Agric 80:527±533 (2000)

Species identi®cation of marine mammals
ampli®cation was performed on a PTC-100 program-
mable thermal controller (MJ Research Inc, Water-
town, MA, USA). The thermal programme for
ampli®cation was 94°C for 1min, followed by 40
cycles of 94°C, for 10s (denaturation), 35°C, for 10s
(annealing) and 72°C for 1min (extension). The
programme included a ®nal step of 72°C for 5min,
and the products were maintained at 4±15°C for a few
hours, or at ÿ20°C for longer periods, until ready to
load onto the gels.
Two sequences of the mitochondrial DNA cyto-
chrome b (mt cytb) gene were ampli®ed for SSCP
analysis: a 358bp fragment24 using primer cyt bL1 (5'-CCA TCC AAC ATC TCA GCA TGA TGA AA-3')and primer cyt bH (5'-CCC CTG AGA ATG ATA
TTT GTC CTC A-3'), and a 148bp fragment7 using
primer FB 349 (5'-GTC GAA TGA ATC TGA GGA
GGC TT-3') and primer FB 496 (5'-CCR ATT GGG
TTG TTT GAC CCT GTT TC-3'). Ampli®cations
were performed in 30ml volumes. 10ml aliquots of the
DNA extracts containing approximately 10ng of the
template DNA were added to 20ml of a mixture to give
®nal concentrations of 1�DNA polymerase buffer
(supplied by the manufacturer), 100mM each dATP,
dCTP, dGTP and dTTP and 0.5mM each primer
(Research and Development Systems, UK) with 0.75
units of Klen Taq1 DNA polymerase. The reaction
mixtures were overlaid with 20ml of Chill Out Wax,
and ampli®cation was performed on a PTC-100
programmable thermal controller. The thermal pro-
gramme for ampli®cation was 94°C for 1min,
followed by 40 cycles of 94°C for 10s (denaturation),
55°C for 10s (annealing) and 72°C, for 30s (exten-
sion). The programme included a ®nal step of 72°Cfor 5min, and the products were maintained at 4±
15°C for a few hours, or at ÿ20°C for longer periods,
until ready to load onto the gels.
Agarose gel electrophoresis12ml aliquots of the products obtained after RAPD
were separated in 20cm�10cm, 0.02gmlÿ1 Nusieve/
Seakem LE (1:3) FMC agarose gels (three gels per
chamber). Gel and electrophoresis buffers were
0.5�TBE,18 and electrophoresis took place for about
2h at 4.5Vcmÿ1. After electrophoresis the gels were
stained for 20min in 0.5�TBE buffer containing
0.5mg mlÿ1 ethidium bromide, destained for another
20min in the same buffer without ethidium bromide,
and photographed under ultraviolet light with a
Polaroid camera using ®lm type 55. The presence or
absence of RAPD markers was visually determined on
the photographs.
Single-strand conformational polymorphismanalysisThe Amersham Pharmacia Biotech (Uppsala,
Sweden) ExcelGel DNA Analysis kit was used.
According to the instructions of the manufacturers,
5ml aliquots of the products were denatured with 20ml
of 50mM NaOH and 1mM EDTA at 50°C for 15min
J Sci Food Agric 80:527±533 (2000)
and placed immediately in ice water. 7ml samples were
loaded onto 0.125gmlÿ1 polyacrylamide gels (Excel-
Gel 48S, DNA). Electrophoresis took place in a
horizontal chamber at 20°C for 2h at 600V, 50mA,
30W. The gels were silver stained according to Bassam
et al. 25
RESULTS AND DISCUSSIONEffect of processing on quality of DNAThe type of tissue and history of a sample, including
the time elapsed from the death of the individual until
processing, the processing conditions and the condi-
tions used to preserve the sample, have a major effect
on the amount and quality of DNA that can be
obtained from it. In general, and as expected, old
samples (Fig 1, no 13) and some samples stored in
96:4 (v/v) ethanol/water (Fig 1, nos 10, 24 and 25)
rendered less DNA than samples stored frozen for a
short period of time (Fig 1, nos 3 and 4). However, all
processing conditions tested here (drying, smoking,
salting, cooking and gravad) produced samples from
which high-molecular-weight DNA could be extracted
in suf®cient amounts to perform ®ngerprint analyses
(Fig 1). This means that, in principle, they would have
been suitable for analysis by a variety of DNA-based
methods and not only RAPD or PCR-SSCP.
General considerations about RAPD analysisTo perform RAPD analysis, several variables need to
be standardised. For ampli®cation, the equip-
ment,26,27 the ampli®cation programme,27±29 the
composition of the ampli®cation buffer, the DNA
polymerase used23,26,30 and the amount and quality of
the DNA19,21,27,31 need to be optimised. For electro-
phoresis, the amount and quality of agarose, the
composition of the buffer and the length of the gel28
require standardisation. Once the analysis is standar-
dised in a laboratory, the paÁtterns are usually
reproducible. In our laboratory, for example, three
different persons have carried out RAPD analysis of
over 700 minke whales, using two different thermal
cyclers (one of which is slightly faster than the other),
and the patterns were always similar. For this work,
RAPD analysis was performed using two different
DNA concentrations for each sample to ensure that
the patterns were independent of the amount of DNA
used. Some of the samples of minke and ®n whales and
the sei whale sample have been analysed more than 10
times. However, lab-to-lab variations and variations
(including batch-to-batch variations from the same
supplier) in the quality of the reagents, buffers and
DNA polymerase are to be expected. Therefore, in our
opinion, conclusive species identi®cation should be
carried out by analysing the unidenti®ed sample in the
same PCR and same gel as the reference samples.
Species identification by RAPD analysisIn the present work, and con®rming previous stu-
dies,10,11,13,19,20,32 each sample±primer combination
529
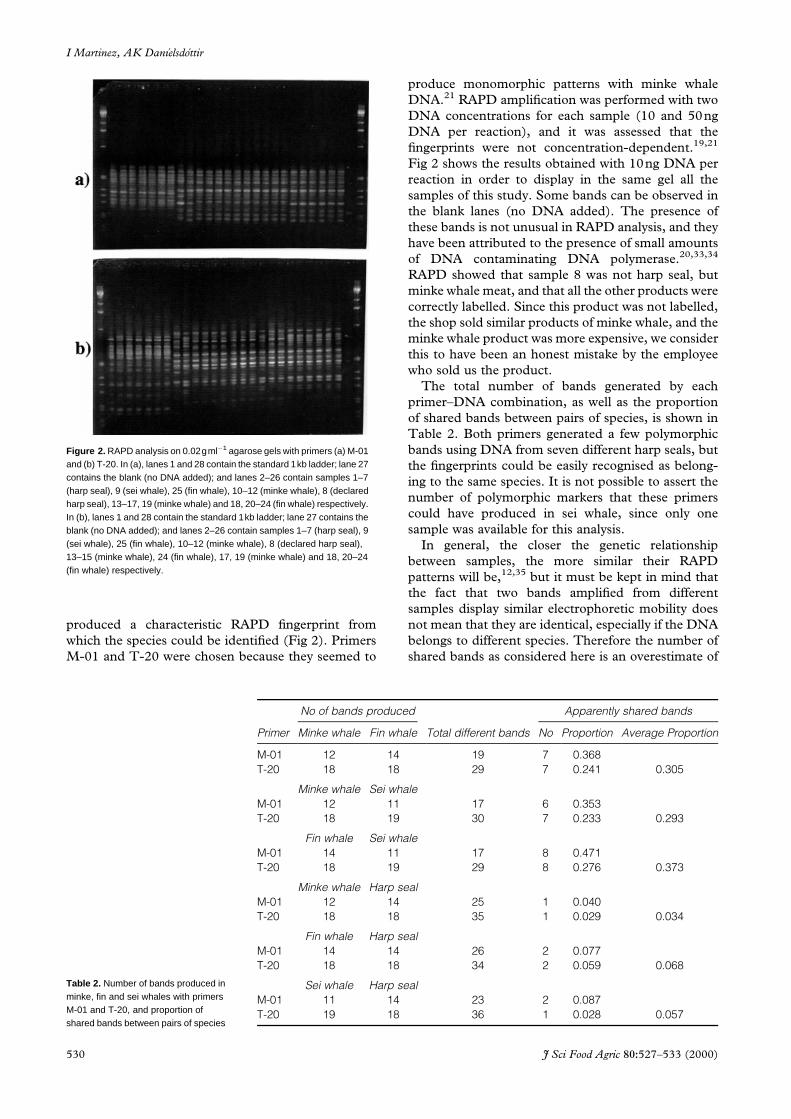
Figure 2. RAPD analysis on 0.02gmlÿ1 agarose gels with primers (a) M-01and (b) T-20. In (a), lanes 1 and 28 contain the standard 1kb ladder; lane 27contains the blank (no DNA added); and lanes 2–26 contain samples 1–7(harp seal), 9 (sei whale), 25 (fin whale), 10–12 (minke whale), 8 (declaredharp seal), 13–17, 19 (minke whale) and 18, 20–24 (fin whale) respectively.In (b), lanes 1 and 28 contain the standard 1kb ladder; lane 27 contains theblank (no DNA added); and lanes 2–26 contain samples 1–7 (harp seal), 9(sei whale), 25 (fin whale), 10–12 (minke whale), 8 (declared harp seal),13–15 (minke whale), 24 (fin whale), 17, 19 (minke whale) and 18, 20–24(fin whale) respectively.
I Martinez, AK DanõÂelsdoÂttir
produced a characteristic RAPD ®ngerprint from
which the species could be identi®ed (Fig 2). Primers
M-01 and T-20 were chosen because they seemed to
Table 2. Number of bands produced inminke, fin and sei whales with primersM-01 and T-20, and proportion ofshared bands between pairs of species
Primer
No of bands produce
Minke whale Fin wha
M-01 12 14
T-20 18 18
Minke whale Sei wha
M-01 12 11
T-20 18 19
Fin whale Sei wha
M-01 14 11
T-20 18 19
Minke whale Harp se
M-01 12 14
T-20 18 18
Fin whale Harp se
M-01 14 14
T-20 18 18
Sei whale Harp se
M-01 11 14
T-20 19 18
530
produce monomorphic patterns with minke whale
DNA.21 RAPD ampli®cation was performed with two
DNA concentrations for each sample (10 and 50ng
DNA per reaction), and it was assessed that the
®ngerprints were not concentration-dependent.19,21
Fig 2 shows the results obtained with 10ng DNA per
reaction in order to display in the same gel all the
samples of this study. Some bands can be observed in
the blank lanes (no DNA added). The presence of
these bands is not unusual in RAPD analysis, and they
have been attributed to the presence of small amounts
of DNA contaminating DNA polymerase.20,33,34
RAPD showed that sample 8 was not harp seal, but
minke whale meat, and that all the other products were
correctly labelled. Since this product was not labelled,
the shop sold similar products of minke whale, and the
minke whale product was more expensive, we consider
this to have been an honest mistake by the employee
who sold us the product.
The total number of bands generated by each
primer±DNA combination, as well as the proportion
of shared bands between pairs of species, is shown in
Table 2. Both primers generated a few polymorphic
bands using DNA from seven different harp seals, but
the ®ngerprints could be easily recognised as belong-
ing to the same species. It is not possible to assert the
number of polymorphic markers that these primers
could have produced in sei whale, since only one
sample was available for this analysis.
In general, the closer the genetic relationship
between samples, the more similar their RAPD
patterns will be,12,35 but it must be kept in mind that
the fact that two bands ampli®ed from different
samples display similar electrophoretic mobility does
not mean that they are identical, especially if the DNA
belongs to different species. Therefore the number of
shared bands as considered here is an overestimate of
d
Total different bands
Apparently shared bands
le No Proportion Average Proportion
19 7 0.368
29 7 0.241 0.305
le
17 6 0.353
30 7 0.233 0.293
le
17 8 0.471
29 8 0.276 0.373
al
25 1 0.040
35 1 0.029 0.034
al
26 2 0.077
34 2 0.059 0.068
al
23 2 0.087
36 1 0.028 0.057
J Sci Food Agric 80:527±533 (2000)
Species identi®cation of marine mammals
similarity between two samples. The discrimination
between harp seal and whale meat was clear: including
the results of both primers, less than seven in 100 of
the markers could be considered as shared bands. The
closely related whale species, on the other hand, had
more markers in common, varying between 29 in 100
between minke and sei whales and 37 in 100 between
®n and sei whales.
The degree of processing to which these samples
had been submitted (drying, smoking, salting, cooking
and gravad) did not affect the RAPD pattern (Fig 2),
con®rming our previous results with ®sh11 and
terrestrial mammalian meat products.12 In our experi-
ence the processing parameters do not per se have a
direct effect on the quality of the RAPD patterns, but
they do have a direct effect on the amount and quality
of extractable DNA. If the DNA is very degraded, it
will be unsuitable for ®ngerprinting.11,12 Thus RAPD
analysis is very likely inadequate to produce reliable
®ngerprints from products subjected to more stringent
procedures that degrade the DNA to small fragments,
such as sterilisation.11,36
Species identification by PCR-SSCP analysisThis analysis involves the ampli®cation of variable
mtDNA sequences in the cytb gene7,24 and requires
the use of consensus primers (to be able to produce
amplicons from a variety of species) that amplify a
variable or hypervariable region of mtDNA. The
ampli®cation product should be only one fragment
corresponding to the targeted region. The amplicons
produced from different species differ in sequence but
often not in their size, which demands additional
analyses such as sequencing,37,38 RFLP with several
restriction enzymes37,39 or SSCP.7,8,40±42
The amplicons obtained are shown in Fig 3.
Figure 3. Agarose gel electrophoresis (0.02gmlÿ1) of amplicons producedwith primer pairs (a) cyt bL1 and cyt bH (358bp fragment) and (b) FB 349and FB 496 (148bp fragment). Samples in (a) are from left to right: blank(no DNA added), 1kb ladder, 2, 6, 9, 10, 12, 13, 15, 18, 1kb ladder, blank(no DNA added), 1kb ladder, 17, 19, 20, 21, 22, 23, 24, 1kb ladder, 1kbladder, 1, 5, 7, 25, 11, 8, 14, 16 and 1kb ladder. Samples in (b) are: lanes 1and 26, 1kb ladder; and lanes 2–25 contain samples 1, 2, 5–7, 9, 25,10–12, 8, 13–17, 19, 18, 20–24 and blank (no DNA added).
J Sci Food Agric 80:527±533 (2000)
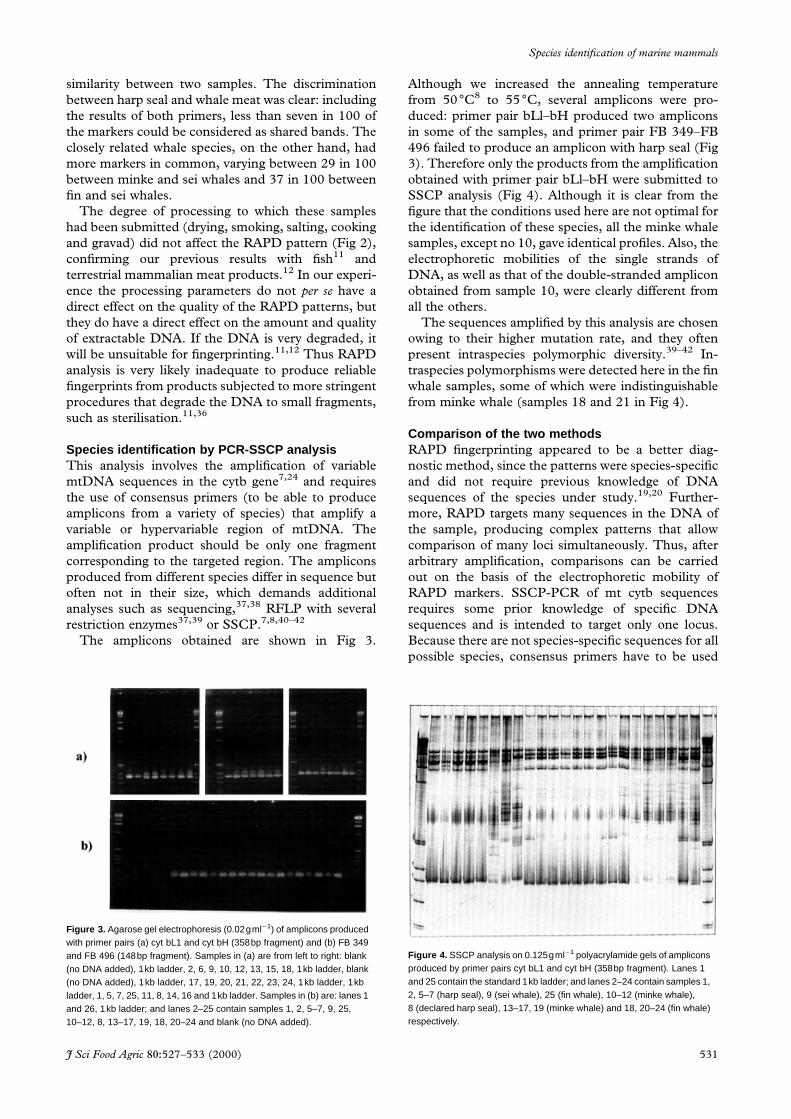
Although we increased the annealing temperature
from 50°C8 to 55°C, several amplicons were pro-
duced: primer pair bLl±bH produced two amplicons
in some of the samples, and primer pair FB 349±FB
496 failed to produce an amplicon with harp seal (Fig
3). Therefore only the products from the ampli®cation
obtained with primer pair bLl±bH were submitted to
SSCP analysis (Fig 4). Although it is clear from the
®gure that the conditions used here are not optimal for
the identi®cation of these species, all the minke whale
samples, except no 10, gave identical pro®les. Also, the
electrophoretic mobilities of the single strands of
DNA, as well as that of the double-stranded amplicon
obtained from sample 10, were clearly different from
all the others.
The sequences ampli®ed by this analysis are chosen
owing to their higher mutation rate, and they often
present intraspecies polymorphic diversity.39±42 In-
traspecies polymorphisms were detected here in the ®n
whale samples, some of which were indistinguishable
from minke whale (samples 18 and 21 in Fig 4).
Comparison of the two methodsRAPD ®ngerprinting appeared to be a better diag-
nostic method, since the patterns were species-speci®c
and did not require previous knowledge of DNA
sequences of the species under study.19,20 Further-
more, RAPD targets many sequences in the DNA of
the sample, producing complex patterns that allow
comparison of many loci simultaneously. Thus, after
arbitrary ampli®cation, comparisons can be carried
out on the basis of the electrophoretic mobility of
RAPD markers. SSCP-PCR of mt cytb sequences
requires some prior knowledge of speci®c DNA
sequences and is intended to target only one locus.
Because there are not species-speci®c sequences for all
possible species, consensus primers have to be used
Figure 4. SSCP analysis on 0.125gmlÿ1 polyacrylamide gels of ampliconsproduced by primer pairs cyt bL1 and cyt bH (358bp fragment). Lanes 1and 25 contain the standard 1kb ladder; and lanes 2–24 contain samples 1,2, 5–7 (harp seal), 9 (sei whale), 25 (fin whale), 10–12 (minke whale),8 (declared harp seal), 13–17, 19 (minke whale) and 18, 20–24 (fin whale)respectively.
531

I Martinez, AK DanõÂelsdoÂttir
which may have some degree of similarity to other
mitochondrial or genomic DNA sequences. This may
result in more than one amplicon, as seems to have
been the case here, requiring optimisation for each
amplicon. It is possible that some of the bands
observed in these gels may be artefacts generated
during electrophoresis. In particular, the running
temperature is critical, and smeared patterns were
obtained when electrophoresis was performed at 4, 8
and 10°C. As a consequence, SSCP analysis and
interpretation may be problematic. Thus, provided
that good-quality DNA can be obtained from a
sample, RAPD seems to be easier, faster and give
more information regarding species identi®cation than
SSCP-PCR analysis.
Based on our results with horse and donkey,12 the
work of Elo et al43 with brown trout and Atlantic
salmon, and the present results with baleen whales, it
seems that species capable of producing hybrids share
about 30 in 100 of their RAPD markers; hybrids and
each of the parental species (as well as 50:50 mixtures
of species) share about 50 in 100 of them,12 and races
or stocks from the same species have more than 50 in
100 of the total number of markers generated by this
analysis in common.12 Therefore RAPD analysis has
the advantage that in one step it is possible to establish
whether the sample corresponds to the species given
on the label (or not) by comparing the ®ngerprints of
the product and the reference samples. In the case of a
mismatch, RAPD can give an indication of whether a
similar species (or a mixture) or a totally different
species has been used.
Identi®cation of the individual species that might
have been included in mixtures in ®nely minced or
comminuted products (pateÂ-type products) would not
be feasible by RAPD, because it would not be possible
to identify which bands come from which species, or
the relative contribution of each species to the total
®ngerprint.11 In coarse mixtures, where it is possible to
take whole pieces of tissue, RAPD typing can simply
be performed on a number of pieces, since it requires
less than 50mg of starting material.
SSCP-PCR, or similar analyses targeting smaller
sequences, may be the only method available if the
product has been submitted to severe conditions such
as canning, where only degraded DNA can be
extracted. The use of consensus primers speci®cally
designed for marine mammals may make this analysis
suitable for these species, but the discriminant
capability of SSCP-PCR, at least as used here and
for the species used in this work, would appear to be
inferior to that of RAPD.
One advantage of the RAPD method is that com-
parison of the RAPD patterns produced by two
samples may immediately give an idea of how closely
related they are. A second advantage is illustrated by
sample 10. Since RAPD targets the total DNA, it
showed sample 10 to be a minke whale. In contrast,
the SSCP-PCR analysis could only indicate that this
sample was different from all the others. Since
532
mtDNA has been shown to be mostly maternally
inherited,40,44 and given the intraspecies polymorph-
isms detected in the SSCP-PCR analysis, the only
conclusion that could be made was that this particular
individual did not share its maternal ancestral line with
any of the others.
ACKNOWLEDGEMENTSWe wish to thank Drs Tore Haug, Kjell T Nilssen and
their co-workers (Norwegian Institute of Fisheries and
Aquaculture Ltd, Tromsù Norway) for organising the
infrastructure for the collection of the Norwegian
samples; Dr Alfred AÂ rnason from the Blood Bank and
the Marine Research Institute, Iceland for the collec-
tion of the Icelandic samples; and the Norwegian
Research Council for ®nancial support (project
113918/112).
REFERENCES1 Baker SC and Palumbi SR, Population structure, molecular
systematics and forensic identi®cation of whale and dolphins,
in Conservation Genetics. Case Histories from Nature, Ed by Avise
JC and Hamrick JL. Chapman and Hall, New York, pp 10±49
(1996).
2 Leighton Jones J, DNA probes: applications in the food industry.
Trends Food Sci Technol 2:28±32 (1991).
3 Mackie IM, Fish speciation. Food Technol Int Eur 1:177±180
(1994).
4 Meyer R and Candrian U, PCR-based DNA analysis for the
identi®cation and characterization of food components.
Lebensm Wiss Technol 29:1±9 (1996).
5 Sotelo CG, Pineiro C, Gallardo JM and Perez-Martin RI, Fish
species identi®cation in seafood products. Trends Food Sci
Technol 4:395±401 (1993).
6 Hara M, Noguchi M, Naito E, Dewa K and Yamanouchi H,
Ribosomal RNA gene typing of ®sh genome using PCR-SSCP
method. Bull Jpn Sea Natl Fish Res Inst 44:131±138 (1994).
7 Rehbein H, Mackie IM, Pryde S, Gonzalez-Sotelo C, Perez-
Martin R, Quinteiro J and Rey-Mendez M, Fish species
identi®cation in canned tuna by DNA analysis (PCR-SSCP).
Info Fischwirtschaft 42:209±212 (1995).
8 Rehbein H, Kress G and Schmidt T, Application of PCR-SSCP
to species identi®cation of ®shery products. J Sci Food Agric
74:35±41 (1997).
9 Appa Rao KBC, Bhat KV and Totey SM, Detection of species-
speci®c genetic markers in farm animals through random
ampli®ed polymorphic DNA (RAPD). Genet Anal: Biomol
Engng 13:135±138 (1996).
10 Dinesh KR, Lim TM, Chan WK and Phang VPE, Genetic
variation inferred from RAPD ®ngerprint in three species of
tilapia. Aqua Int 4:19±30 (1996).
11 Martinez I, DNA typing of ®sh products for species identi®ca-
tion, in Seafood from Producer to Consumer, Integrated Approach
to Quality, Ed by Luten J, Bùrresen T and OehlenschlaÈger J
Elsevier, Amsterdam, pp 497±506 (1997).
12 Martinez I and Malmheden Yman I, Species identi®cation in
meat products by RAPD analysis. Food Res Int 31:459±466
(1999).
13 Partis L and Wells RJ, Identi®cation of ®sh species using random
ampli®ed polymorphic DNA. Mol Cell Probes 10:435±441
(1996).
14 Nilssen KT and LindstroÈm U, Innsamling av biologiske data og
materiale fra grùnlandssel under kommersiell fangst i éstisen
1998. Norwegian Institute of Fisheries and Aquaculture Ltd Rep 3/
1998 (1998).
15 Haug T, Lindstrùm U, Nilssen KT, Rùttingen I and Skaug HJ,
J Sci Food Agric 80:527±533 (2000)

Species identi®cation of marine mammals
Diet and food availability for Northeast Atlantic minke whales,
Balaenoptera acutorostrata. Rep Int Whal Commn 46:371±382
(1996).
16 DanõÂelsdoÂttir AK, Duke EJ, Joyce P and AÂ rnason A, Preliminary
studies on the genetic variation at enzyme loci in ®n whales
(Balaenoptera physalus) and sei whales (Balaenoptera borealis)
from the North Atlantic. Rep Int Whal Commn Special issue
13:115±124 (1991).
17 Miller SA, Dykes DD and Polesky HF, A simple salting out
procedure for extracting DNA from human nucleated cells.
NAR 16:1215 (1988).
18 Sambrook J, Fritsch EF and Maniatis T, Molecular Cloning. A
Laboratory Manual, 2nd edn., Cold Spring Harbor Laboratory
Press, Cold Spring Harbor (1989).
19 Welsh J and McClelland M, Fingerprinting genomes using PCR
with arbitrary primers. NAR 18:7213±7218 (1990).
20 Williams JGK, Kubelik AR, Livak KJ, Rafalski JA and Tingey
SV, DNA polymorphisms ampli®ed by arbitrary primers are
useful as genetic markers. NAR 18:6531±6535 (1990).
21 Martinez I, Elvevoll EO and Haug T, RAPD typing of north-east
Atlantic minke whale (Balaenoptera acutorostrata). ICES J
Marine Sci 54:478±484 (1997).
22 Welsh J, Petersen C and McClelland M, Polymorphisms
generated by arbitrarily primed PCR in the mouse: application
to strain identi®cation and genetic mapping. NAR 19:303±306
(1991).
23 Ellsworth DL, Rittenhouse D and Honeycutt RL, Artifactual
variation in randomly ampli®ed polymorphic DNA banding
patterns. Biotechniques 14:214±218 (1993).
24 Barlett SE and Davidson WS, FINS (forensically informative
nucleotide sequencing)Ða procedure for identifying the
animal origin of biological specimens. Biotechniques 12:408±
411 (1992).
25 Bassam BJ, Caetano-AnolleÂs G and Gresshoff PM, Fast and
sensitive silver staining of DNA in polyacrylamide gels. Anal
Biochem 196:80±83 (1991).
26 Meunier JR and Grimont PAD, Factors affecting reproducibility
of random ampli®ed polymorphic DNA ®ngerprinting. Res
Microbiol 144:373±379 (1993).
27 Williams JGK, Hanafey MK, Rafalski JA and Tingey SV,
Genetic analysis using random ampli®ed polymorphic DNA
markers. Methods Enzymol 218:704±741 (1993).
28 Martinez I and Pastene LA, RAPD-typing of central and eastern
north Atlantic and western north Paci®c minke whales,
Balaenoptera acutorostrata. ICES J Marine Sci 56:640±651
(1999).
29 Yu K and Pauls KP, Optimization of the PCR program for
RAPD analysis. NAR 20:2606 (1992).
30 Park YH and Kohel RJ, Effect of concentration of MgCl2 on
random-ampli®ed DNA polymorphism. Biotechniques 16:652±
655 (1994).
J Sci Food Agric 80:527±533 (2000)
31 Micheli MR, Bova R, Pascale E and D'Ambrosio E, Reprodu-
cible random ampli®ed polymorphic DNA (RAPD) method.
NAR 22:1921±1922 (1994).
32 Dinesh KR, Lim TM, Chua KL, Chan WK and Phang VPE,
RAPD analysis: an ef®cient method of DNA ®ngerprinting in
®shes. Zool Sci 10:849±854 (1993).
33 Hadrys H, Balick M and Schierwater B, Applications of random
ampli®ed polymorphic DNA (RAPD) in molecular ecology.
Mol Ecol 1:55±63 (1992).
34 Klein-Lankhorst RM, Vermunt A, Weide R, Liharska T and
Zabel P, Isolation of molecular markers for tomato Lycopersicon
esculentum using random ampli®ed polymorphic DNA RAPD.
Theor Appl Genet 83:108±114 (1991).
35 Huff DR, Peakall R and Smouse P, RAPD variation within and
among natural populations of outcrossing buffalograss
[BuchloeÈ dactyloides (Nutt.) Engelm.]. Theor Appl Genet
86:927±934 (1993).
36 Buntjer JB, Lamine A, Haagsma N and Lenstra JA, Species
identi®cation by oligonucleotide hybridisation: the in¯uence of
processing of meat products. J Sci Food Agric 79:53±57 (1999).
37 Quinteiro J, Sotelo CG, Rehbein H, Pryde SE, Medina I, Perez-
Martin RI, Rey-Mendez M and Mackie IM, Use of mtDNA
direct polymerase chain reaction (PCR) sequencing and PCR±
restriction fragment length polymorphism methodologies in
species identi®cation of canned tuna. J Agric Food Chem
46:1662±1669 (1998).
38 Unseld M, Beyerman B, Brandt P and Hiesel R, Identi®cation of
the species origin of highly processed meat products by
mitochondrial DNA sequences. PCR Methods Appl 4:241±
243 (1995).
39 Meyer R, HoÈfelein C, LuÈthy J and Candrian U, Polymerase chain
reaction±restriction fragment length polymorphism analysis: a
simple method for species identi®cation in food. J AOAC Int
78:1542±1551 (1995).
40 Marklund S, Chaudhary R, Marklund L, Sandberg K and
Andersson L, Extensive mtDNA diversity in horses revealed by
PCR-SSCP analysis. Anim Genet 26:193±196 (1995).
41 Rea S, Chikuni K and Avellini P, Possibility of using single strand
conformation polymorphism (SSCP) analysis for discriminat-
ing European pig and wild boar meat samples. Ital J Food Sci
3:211±220 (1996).
42 Takeda K, Onishi A, Ishida I, Kawakami K, Komatsu M and
Inumaru S, SSCP analysis of pig mitochondrial DNA-loop
region polymorphism. Anim Genet 26:321±326 (1995).
43 Elo K, Ivanoff S, Vuorinen JA and Piironen J, Inheritance of
RAPD markers and detection of interspeci®c hybridization
with brown trout and Atlantic salmon. Aquaculture 152:55±65
(1997).
44 Gyllensten U, Wharton D, Josefsson A and Wilson AC, Paternal
inheritance of mitochondrial DNA in mice. Nature 352:255±
257 (1991).
533