identification of lipid biomarker from serum in patients
TRANSCRIPT
RESEARCH Open Access
Identification of lipid biomarker from serumin patients with chronic obstructivepulmonary diseaseDing Liu1, Maureen Meister1,2, Shiying Zhang1, Chi-In Vong2, Shuaishuai Wang1, Ruixie Fang3, Lei Li1,Peng George Wang1, Pierre Massion4 and Xiangming Ji1,2*
Abstract
Background: Chronic obstructive pulmonary disease (COPD) is the third leading cause of death in the UnitedStates with no effective treatment. The current diagnostic method, spirometry, does not accurately reflect theseverity of COPD disease status. Therefore, there is a pressing unmet medical need to develop noninvasivemethods and reliable biomarkers to detect early stages of COPD. Lipids are the fundamental components of cellmembranes, and dysregulation of lipids was proven to be associated with COPD. Lipidomics is a comprehensiveapproach to all the pathways and networks of cellular lipids in biological systems. It is widely used for diseasediagnosis, biomarker identification, and pathology disorders detection relating to lipid metabolism.
Methods: In the current study, a total of 25 serum samples were collected from 5 normal control subjects and 20patients with different stages of COPD according to the global initiative for chronic obstructive lung disease (GOLD)(GOLD stages I ~ IV, 5 patients per group). After metabolite extraction, lipidomic analysis was performed usingelectrospray ionization mass spectrometry (ESI-MS) to detect the serum lipid species. Later, the comparisons ofindividual lipids were performed between controls and patients with COPD. Orthogonal projections to latentstructures discriminant analysis (OPLS-DA) and receiver operating characteristic (ROC) analysis were utilized to testthe potential biomarkers. Finally, correlations between the validated lipidomic biomarkers and disease stages, age,FEV1% pack years and BMI were evaluated.
Results: Our results indicate that a panel of 50 lipid metabolites including phospholipids, sphingolipids, glycerolipids,and cholesterol esters can be used to differentiate the presence of COPD. Among them, 10 individual lipid speciesshowed significance (p < 0.05) with a two-fold change. In addition, lipid ratios between every two lipid species werealso evaluated as potential biomarkers. Further multivariate data analysis and receiver operating characteristic (ROC:0.83 ~ 0.99) analysis suggest that four lipid species (AUC:0.86 ~ 0.95) and ten lipid ratios could be potential biomarkersfor COPD (AUC:0.94 ~ 1) with higher sensitivity and specificity. Further correlation analyses indicate these potentialbiomarkers were not affected age, BMI, stages and FEV1%, but were associated with smoking pack years.
(Continued on next page)
© The Author(s). 2020 Open Access This article is licensed under a Creative Commons Attribution 4.0 International License,which permits use, sharing, adaptation, distribution and reproduction in any medium or format, as long as you giveappropriate credit to the original author(s) and the source, provide a link to the Creative Commons licence, and indicate ifchanges were made. The images or other third party material in this article are included in the article's Creative Commonslicence, unless indicated otherwise in a credit line to the material. If material is not included in the article's Creative Commonslicence and your intended use is not permitted by statutory regulation or exceeds the permitted use, you will need to obtainpermission directly from the copyright holder. To view a copy of this licence, visit http://creativecommons.org/licenses/by/4.0/.The Creative Commons Public Domain Dedication waiver (http://creativecommons.org/publicdomain/zero/1.0/) applies to thedata made available in this article, unless otherwise stated in a credit line to the data.
* Correspondence: [email protected] of Chemistry, Georgia State University, Atlanta, GA 30303, USA2Department of Nutrition, Georgia State University, Atlanta 30302, USAFull list of author information is available at the end of the article
Liu et al. Respiratory Research (2020) 21:242 https://doi.org/10.1186/s12931-020-01507-9
(Continued from previous page)
Conclusion: Using lipidomics and statistical methods, we identified unique lipid signatures as potential biomarkers fordiagnosis of COPD. Further validation studies of these potential biomarkers with large population may elucidate theirroles in the development of COPD.
Keywords: Chronic obstructive pulmonary disease (COPD), Lipidomics, Biomarkers, OPLS-DA, Receiver operatingcharacteristic
IntroductionChronic obstructive pulmonary disease (COPD) is achronic lung disease, which is characterized by irreversibleairflow obstruction, mucus hypersecretion, and chronicairway inflammation. It is the third leading cause of deathworldwide, and it was ranked second as disability-adjustedlife-years (DALY) from 1990 to 2010 [1–3]. Previous stud-ies demonstrated that the progressive structural changesin the bronchial epithelium are associated with sub-epithelial fibrous remodeling [4]. Tobacco smoking is theleading cause of COPD although other factors such as airpollution, genetic susceptibility and occupational exposurealso account for COPD [5]. Spirometry is the major clin-ical test used to diagnose patients with COPD by measur-ing the airflow volumes into and out of the lung.Spirometry is clinically utilized to measure the forced ex-piratory volume in one second (FEV1) and forced vitalcapacity (FVC), the ratio of FEV1/FVC as the indicator ofobstructive or restrictive ventilatory defects [6]. However,clinical evidence indicates that spirometry can neither pre-dict the disease activity or the severity nor differentiate thesubtypes of disease. Moreover, symptoms such as bron-chial hyper-responsiveness and frequent exacerbations arealso used as indicators of COPD disease progression.However, these clinical markers have no specificity andcannot be quantified [7]. Until now, there is no effectivetreatment for COPD. Therefore, novel biomarkers are ur-gently needed for early detection of COPD, which holdsthe potential for successful intervention in the progressionof the disease [8].Cellular lipid species play an essential role in various cellu-
lar processes, including membrane integrity, energy sources,and cellular signaling processes such as cell proliferation, me-tabolism, and apoptosis induction. Accumulating studies in-dicate that dysregulation of lipids is associated with thepathogenesis of COPD [9, 10]. Obesity with high composi-tions of triglyceridesis and cholesterol is associated with de-clining lung function and increased morbidity of COPD [11].Meta-analysis shows that the use of statins was associatedwith 38% reduction in all-cause mortality (95% CI 0.52 to0.73) and a 52% reduction in COPD mortality [12]. Inaddition, phospholipid is a significant component of cellmembranes, which consists of a hydrophilic head and twohydrophobic fatty acid tails. Phospholipids account for 85%of pulmonary surfactant mass, and the composition and
concentration of individual phospholipid are critical factorsof functional pulmonary surfactants [13]. The more enhance-ment of phosphatidylcholine (PC)16:0/16:0 occurs within thesurfactants, the surfactants are more resistant to the highpressures generated at the air-liquid interface of the mamma-lian lung [13]. In addition, total surfactant phospholipids arealso known to decrease in patients with COPD, which maycorrelate with pulmonary function [14]. Moreover, dysregula-tion of bioactive lipids such as ceramides, sphingomyelins,and sphingosine-1-phospate (S1P) were associated withsmoking. The amount of sphingolipids was significantlyhigher in smokers with COPD than in smokers withoutCOPD [15, 16]. The S1P promotes acquired immune re-sponses in smoke-induced lung inflammation and lympho-cyte trafficking [17, 18]. Data from COPDGene cohortshowed that three unique sphingolipids found in the plasmaare strongly associated with emphysema and COPD exacer-bation phenotypes, but not with airflow obstruction andchronic bronchitis [19]. Other lipids such as ceramide playsimportant roles in the induction of apoptosis and cellularsenescence, and free fatty acids could cause similar inflam-matory responses [20, 21]. These data suggest that lipids playimportant roles in the development of COPD, and a detailedlipidomic profiling across different stage of COPD for indi-vidual lipids may shed light on the pathogenesis of COPD.Lipidomics is an emerging “omics” approach, which compre-hensively measures the full lipid components of cells, tissues,and organisms [22]. To determine whether lipid metabolitescould be biomarkers for the diagnosis of COPD, globaluntargeted lipidomic analysis was performed to investigateserum samples from patients with different stages of COPD.Subsequently, general statistical analysis, orthogonal partialleast squares discriminant analysis (OPLS-DA), and receiveroperating characteristic (ROC) analysis were performed toassess the quantitative change of lipid metabolites. Finally,the correlation of lipid productions with ages and smokingstatus in patients was also assessed.
Materials and methodsPatient and control serum sample collectionIn this study, 25 serum samples were obtained from theVanderbilt Medical Center and the Nashville VeteranAffairs Medical Center. All procedures performed instudies involving human participants were in accordancewith the ethical standards of the institutional and/or
Liu et al. Respiratory Research (2020) 21:242 Page 2 of 13
national research committee and with the 1964 HelsinkiDeclaration and its later amendments or comparableethical standards. The study was approved by the localinstitutional review board (Vanderbilt University Med-ical Center and Veterans Affairs, Tennessee ValleyHealthcare System, Nashville, Tennessee InstitutionalReview Boards), and informed consents were obtainedfrom all individuals at both institutions. Individuals pro-viding serum samples were grouped based on their FEV1
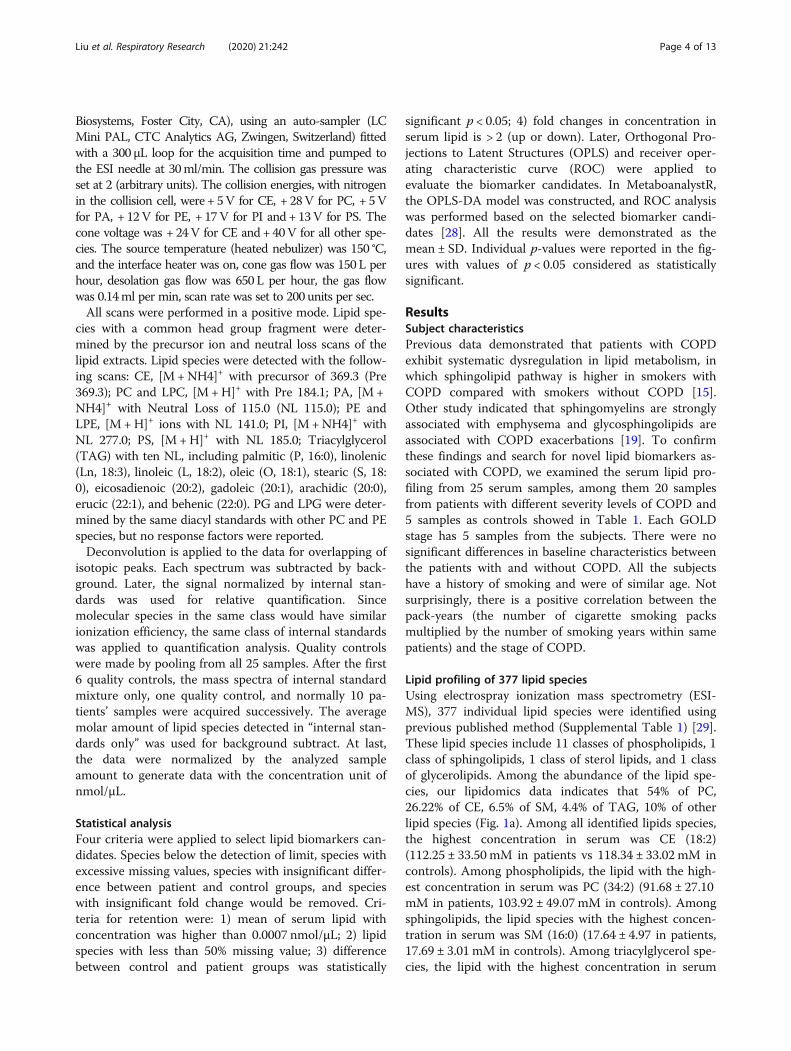
value, each group consisting of 5 individuals. Clinical in-formation, sample size, classification of patients withCOPD based on Global Initiative for Chronic Obstruct-ive Lung Disease Stage [23], and normal control arelisted in Table 1. From each subject, 1 mL of wholeblood was collected into a vacutainer tube without anti-coagulant. Each serum sample was promptly separated(no more than 4 h after collection of whole blood) andstored at − 80 °C immediately.
Lipids extraction from serum samplesSerum metabolite extraction was performed as describedpreviously [24]. Briefly, 50 μL of each serum sample wasmixed with 160 μL of chloroform and 320 μL of metha-nol containing BHT (50 μg/ml). After vortex mixing for20 min, 160 μl of water was added and shook. Later, thesample was centrifuged for 5 min at 2000 g, after thatthe lower layer was retained. Then another 160 μLchloroform was added, shook and centrifuged, and thelower layer was collected and combined with the previ-ous step. The combined lower layers were washed with asmall volume of 1M KCl solution once. For each sam-ple, chloroform was used to dissolve the extracted lipidsfrom serum (chloroform vs serum, 10:1 in volume), then6 μL of the serum extraction lipid in chloroform wasprepared for Waters Xevo instrument infusion in next
step. All extracted samples were transported on dry iceto the Kansas Lipidomics Research Center (KLRC) forlipid analysis. Most of the phospholipid standards werepurchased from Avanti Polar Lipids, Inc. (Alabaster,AL), except for di24:1-PE and di24:1-PG, which wereprepared by transphosphatidylation of di24:1-PC [25].
ESI-MS lipid profilingIn order to profile the lipid species, an automated electro-spray ionization tandem mass spectrometry method was ap-plied. In this method, the ratio of head groups plus total acylcarbons to total double bonds is used to determine theserum lipid species. Data acquisition and analysis were per-formed as described previously with modifications [26]. Inshort, proper amounts of internal standards, obtained andquantified as previously described [27], were added in the fol-lowing quantities: 0.30 nmol lysophosphatidylglycerol—LPG(14:0), 0.30 nmol LPG (18:0), 0.30 nmol phosphatidylgly-cerol— PG (14:0/14:0), 0.30 nmol lysophosphatidylethanola-mine—LPE(14:0), 0.30 nmol LPE(18:0), 0.30 nmolphosphatidylethanolamine—PE(12:0/12:0), 0.30 nmol PE(23:0/23:0), 0.60 nmol lysophosphatidylcholine—LPC(13:0), 0.60nmol LPC(19:0), 0.60 nmol phosphatidylcholine—PC(12:0/12:0), 0.60 nmol PC(24:1/24:1), 0.30 nmol lysophosphatidicacid—LPA(14:0), 0.30 nmol LPA(18:0), 0.30 nmol lysopho-sphatidic acidcPA(20:0/20:0), 0.30 nmol PA(14:0/14:0), 0.20nmol phosphatidylserine—PS(14:0/14:0), 0.29 nmol phos-phatidylinositol—PI (16:0/18:0), 0.11 nmol PI (18:0/18:0), 10nmol cholesterol ester—CE(13:0) and 10 nmol CE(23:0). The6 μL of the serum extraction lipid from the last step wasmixed with the standard internal mixture and finally dis-solved in 1.2ml solvent, which was 300mM ammoniumacetate/chloroform/methanol with the ratio 300/665/35. Themixture was introduced by continuous infusion into the ESIsource on a triple quadrupole MS/MS (API 4000, Applied
Table 1 Characteristics of Patients by Lipidomic Analysis
GOLD Status No I II III IV
N= 5 5 5 5 5
FEV1%
Average + Std 109 ± 3.67 77 ± 1.87 53.4 ± 3.21 47.4 ± 1.14 27.4 ± 3.64
Age
Average + Std 65.81 ± 5.89 67 ± 4.30 72.6 ± 2.97 71.8 ± 8.53 65.8 ± 5.89
Smoking
Yes 5/5 (100%) 5/5 (100%) 5/5 (100%) 5/5 (100%) 5/5 (100%)
Pack-Years
Average + Std 49.4 ± 13.04 63 ± 19.26 65.9 ± 30.40 67.2 ± 29.31 69 ± 21.4
BMI
Average + Std 26.4 ± 4.88 28.3 ± 4.30 26.3 ± 2.97 25.7 ± 8.53 24.6 ± 8.53
Gender
Male 2/5 (40%) 2/5 (40%) 3/5 (60%) 4/5 (80%) 4/5 (80%)
Liu et al. Respiratory Research (2020) 21:242 Page 3 of 13
Biosystems, Foster City, CA), using an auto-sampler (LCMini PAL, CTC Analytics AG, Zwingen, Switzerland) fittedwith a 300 μL loop for the acquisition time and pumped tothe ESI needle at 30ml/min. The collision gas pressure wasset at 2 (arbitrary units). The collision energies, with nitrogenin the collision cell, were + 5V for CE, + 28V for PC, + 5Vfor PA, + 12V for PE, + 17V for PI and + 13V for PS. Thecone voltage was + 24V for CE and + 40V for all other spe-cies. The source temperature (heated nebulizer) was 150 °C,and the interface heater was on, cone gas flow was 150 L perhour, desolation gas flow was 650 L per hour, the gas flowwas 0.14ml per min, scan rate was set to 200 units per sec.All scans were performed in a positive mode. Lipid spe-
cies with a common head group fragment were deter-mined by the precursor ion and neutral loss scans of thelipid extracts. Lipid species were detected with the follow-ing scans: CE, [M+NH4]+ with precursor of 369.3 (Pre369.3); PC and LPC, [M +H]+ with Pre 184.1; PA, [M +NH4]+ with Neutral Loss of 115.0 (NL 115.0); PE andLPE, [M +H]+ ions with NL 141.0; PI, [M+NH4]+ withNL 277.0; PS, [M +H]+ with NL 185.0; Triacylglycerol(TAG) with ten NL, including palmitic (P, 16:0), linolenic(Ln, 18:3), linoleic (L, 18:2), oleic (O, 18:1), stearic (S, 18:0), eicosadienoic (20:2), gadoleic (20:1), arachidic (20:0),erucic (22:1), and behenic (22:0). PG and LPG were deter-mined by the same diacyl standards with other PC and PEspecies, but no response factors were reported.Deconvolution is applied to the data for overlapping of
isotopic peaks. Each spectrum was subtracted by back-ground. Later, the signal normalized by internal stan-dards was used for relative quantification. Sincemolecular species in the same class would have similarionization efficiency, the same class of internal standardswas applied to quantification analysis. Quality controlswere made by pooling from all 25 samples. After the first6 quality controls, the mass spectra of internal standardmixture only, one quality control, and normally 10 pa-tients’ samples were acquired successively. The averagemolar amount of lipid species detected in “internal stan-dards only” was used for background subtract. At last,the data were normalized by the analyzed sampleamount to generate data with the concentration unit ofnmol/μL.
Statistical analysisFour criteria were applied to select lipid biomarkers can-didates. Species below the detection of limit, species withexcessive missing values, species with insignificant differ-ence between patient and control groups, and specieswith insignificant fold change would be removed. Cri-teria for retention were: 1) mean of serum lipid withconcentration was higher than 0.0007 nmol/μL; 2) lipidspecies with less than 50% missing value; 3) differencebetween control and patient groups was statistically
significant p < 0.05; 4) fold changes in concentration inserum lipid is > 2 (up or down). Later, Orthogonal Pro-jections to Latent Structures (OPLS) and receiver oper-ating characteristic curve (ROC) were applied toevaluate the biomarker candidates. In MetaboanalystR,the OPLS-DA model was constructed, and ROC analysiswas performed based on the selected biomarker candi-dates [28]. All the results were demonstrated as themean ± SD. Individual p-values were reported in the fig-ures with values of p < 0.05 considered as statisticallysignificant.
ResultsSubject characteristicsPrevious data demonstrated that patients with COPDexhibit systematic dysregulation in lipid metabolism, inwhich sphingolipid pathway is higher in smokers withCOPD compared with smokers without COPD [15].Other study indicated that sphingomyelins are stronglyassociated with emphysema and glycosphingolipids areassociated with COPD exacerbations [19]. To confirmthese findings and search for novel lipid biomarkers as-sociated with COPD, we examined the serum lipid pro-filing from 25 serum samples, among them 20 samplesfrom patients with different severity levels of COPD and5 samples as controls showed in Table 1. Each GOLDstage has 5 samples from the subjects. There were nosignificant differences in baseline characteristics betweenthe patients with and without COPD. All the subjectshave a history of smoking and were of similar age. Notsurprisingly, there is a positive correlation between thepack-years (the number of cigarette smoking packsmultiplied by the number of smoking years within samepatients) and the stage of COPD.
Lipid profiling of 377 lipid speciesUsing electrospray ionization mass spectrometry (ESI-MS), 377 individual lipid species were identified usingprevious published method (Supplemental Table 1) [29].These lipid species include 11 classes of phospholipids, 1class of sphingolipids, 1 class of sterol lipids, and 1 classof glycerolipids. Among the abundance of the lipid spe-cies, our lipidomics data indicates that 54% of PC,26.22% of CE, 6.5% of SM, 4.4% of TAG, 10% of otherlipid species (Fig. 1a). Among all identified lipids species,the highest concentration in serum was CE (18:2)(112.25 ± 33.50 mM in patients vs 118.34 ± 33.02 mM incontrols). Among phospholipids, the lipid with the high-est concentration in serum was PC (34:2) (91.68 ± 27.10mM in patients, 103.92 ± 49.07 mM in controls). Amongsphingolipids, the lipid species with the highest concen-tration in serum was SM (16:0) (17.64 ± 4.97 in patients,17.69 ± 3.01 mM in controls). Among triacylglycerol spe-cies, the lipid with the highest concentration in serum
Liu et al. Respiratory Research (2020) 21:242 Page 4 of 13
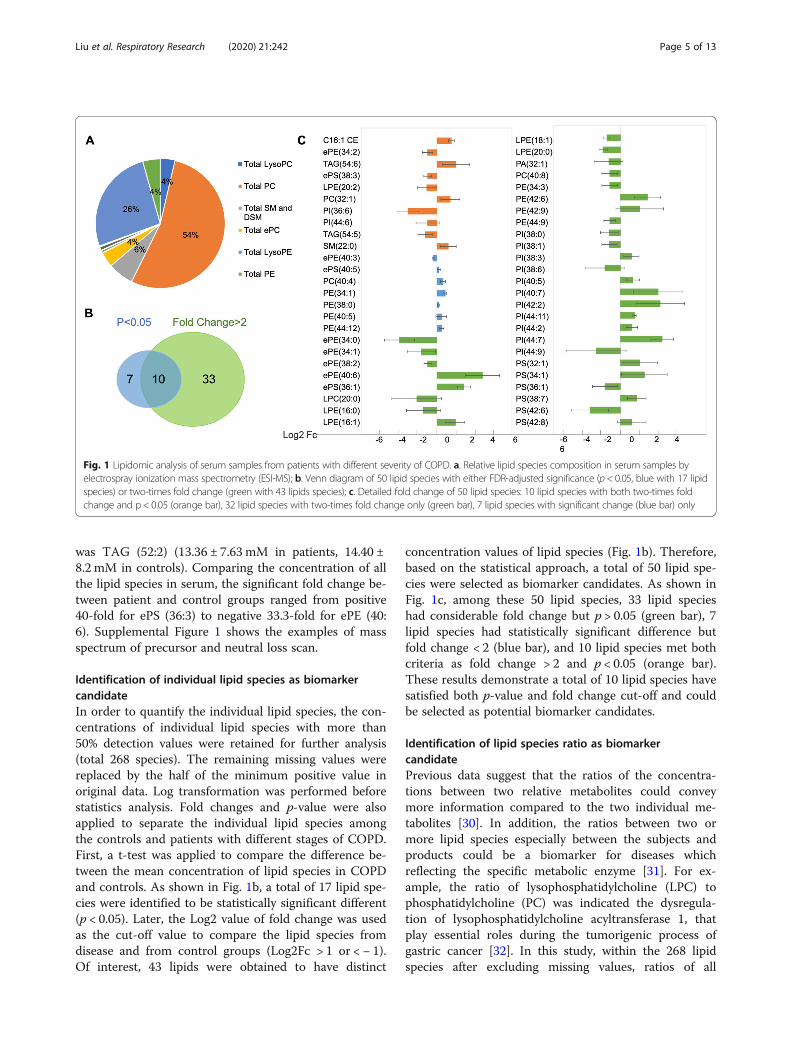
was TAG (52:2) (13.36 ± 7.63 mM in patients, 14.40 ±8.2 mM in controls). Comparing the concentration of allthe lipid species in serum, the significant fold change be-tween patient and control groups ranged from positive40-fold for ePS (36:3) to negative 33.3-fold for ePE (40:6). Supplemental Figure 1 shows the examples of massspectrum of precursor and neutral loss scan.
Identification of individual lipid species as biomarkercandidateIn order to quantify the individual lipid species, the con-centrations of individual lipid species with more than50% detection values were retained for further analysis(total 268 species). The remaining missing values werereplaced by the half of the minimum positive value inoriginal data. Log transformation was performed beforestatistics analysis. Fold changes and p-value were alsoapplied to separate the individual lipid species amongthe controls and patients with different stages of COPD.First, a t-test was applied to compare the difference be-tween the mean concentration of lipid species in COPDand controls. As shown in Fig. 1b, a total of 17 lipid spe-cies were identified to be statistically significant different(p < 0.05). Later, the Log2 value of fold change was usedas the cut-off value to compare the lipid species fromdisease and from control groups (Log2Fc > 1 or < − 1).Of interest, 43 lipids were obtained to have distinct
concentration values of lipid species (Fig. 1b). Therefore,based on the statistical approach, a total of 50 lipid spe-cies were selected as biomarker candidates. As shown inFig. 1c, among these 50 lipid species, 33 lipid specieshad considerable fold change but p > 0.05 (green bar), 7lipid species had statistically significant difference butfold change < 2 (blue bar), and 10 lipid species met bothcriteria as fold change > 2 and p < 0.05 (orange bar).These results demonstrate a total of 10 lipid species havesatisfied both p-value and fold change cut-off and couldbe selected as potential biomarker candidates.
Identification of lipid species ratio as biomarkercandidatePrevious data suggest that the ratios of the concentra-tions between two relative metabolites could conveymore information compared to the two individual me-tabolites [30]. In addition, the ratios between two ormore lipid species especially between the subjects andproducts could be a biomarker for diseases whichreflecting the specific metabolic enzyme [31]. For ex-ample, the ratio of lysophosphatidylcholine (LPC) tophosphatidylcholine (PC) was indicated the dysregula-tion of lysophosphatidylcholine acyltransferase 1, thatplay essential roles during the tumorigenic process ofgastric cancer [32]. In this study, within the 268 lipidspecies after excluding missing values, ratios of all
Fig. 1 Lipidomic analysis of serum samples from patients with different severity of COPD. a. Relative lipid species composition in serum samples byelectrospray ionization mass spectrometry (ESI-MS); b. Venn diagram of 50 lipid species with either FDR-adjusted significance (p < 0.05, blue with 17 lipidspecies) or two-times fold change (green with 43 lipids species); c. Detailed fold change of 50 lipid species: 10 lipid species with both two-times foldchange and p < 0.05 (orange bar), 32 lipid species with two-times fold change only (green bar), 7 lipid species with significant change (blue bar) only
Liu et al. Respiratory Research (2020) 21:242 Page 5 of 13
possible lipid pairs were calculated, and the top 10 ratios(based on p-value) were chosen as lipid ratio candidatesfor further biomarker analysis. In Table 2, the top 10lipid ratio candidates with p-value < 0.001 and foldchange > 2 were demonstrated. Interestingly, the mostsignificant ones were the ratio of glycerophospholipidsto cholesterol ester such as PI (38:4)/C16:1 CE andPI(36:2)/C16:1 CE. Moreover, 8 of the ratios of glycero-phospholipids to cholesterol ester were lower in COPDgroups, while the rest 2 lipid ratios biomarkers werehigher in COPD groups. Patients with severe COPDhave a higher level of cholesterol in the blood [33]. Theupregulation of cholesterol could be partially due to theadverse effects of cigarette smoking on lipoprotein regu-lation [34–37]. In aggregate, we successfully identified10 lipid ratio biomarker candidates from the patientswith different severity of COPD.
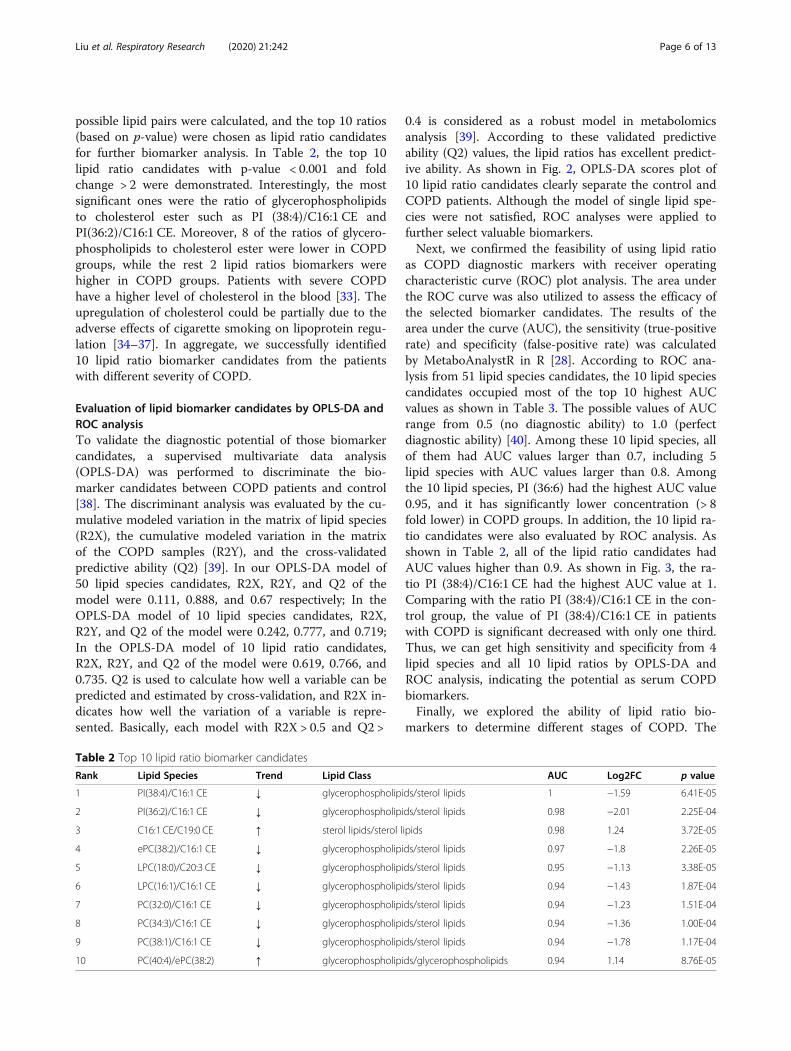
Evaluation of lipid biomarker candidates by OPLS-DA andROC analysisTo validate the diagnostic potential of those biomarkercandidates, a supervised multivariate data analysis(OPLS-DA) was performed to discriminate the bio-marker candidates between COPD patients and control[38]. The discriminant analysis was evaluated by the cu-mulative modeled variation in the matrix of lipid species(R2X), the cumulative modeled variation in the matrixof the COPD samples (R2Y), and the cross-validatedpredictive ability (Q2) [39]. In our OPLS-DA model of50 lipid species candidates, R2X, R2Y, and Q2 of themodel were 0.111, 0.888, and 0.67 respectively; In theOPLS-DA model of 10 lipid species candidates, R2X,R2Y, and Q2 of the model were 0.242, 0.777, and 0.719;In the OPLS-DA model of 10 lipid ratio candidates,R2X, R2Y, and Q2 of the model were 0.619, 0.766, and0.735. Q2 is used to calculate how well a variable can bepredicted and estimated by cross-validation, and R2X in-dicates how well the variation of a variable is repre-sented. Basically, each model with R2X > 0.5 and Q2 >
0.4 is considered as a robust model in metabolomicsanalysis [39]. According to these validated predictiveability (Q2) values, the lipid ratios has excellent predict-ive ability. As shown in Fig. 2, OPLS-DA scores plot of10 lipid ratio candidates clearly separate the control andCOPD patients. Although the model of single lipid spe-cies were not satisfied, ROC analyses were applied tofurther select valuable biomarkers.Next, we confirmed the feasibility of using lipid ratio
as COPD diagnostic markers with receiver operatingcharacteristic curve (ROC) plot analysis. The area underthe ROC curve was also utilized to assess the efficacy ofthe selected biomarker candidates. The results of thearea under the curve (AUC), the sensitivity (true-positiverate) and specificity (false-positive rate) was calculatedby MetaboAnalystR in R [28]. According to ROC ana-lysis from 51 lipid species candidates, the 10 lipid speciescandidates occupied most of the top 10 highest AUCvalues as shown in Table 3. The possible values of AUCrange from 0.5 (no diagnostic ability) to 1.0 (perfectdiagnostic ability) [40]. Among these 10 lipid species, allof them had AUC values larger than 0.7, including 5lipid species with AUC values larger than 0.8. Amongthe 10 lipid species, PI (36:6) had the highest AUC value0.95, and it has significantly lower concentration (> 8fold lower) in COPD groups. In addition, the 10 lipid ra-tio candidates were also evaluated by ROC analysis. Asshown in Table 2, all of the lipid ratio candidates hadAUC values higher than 0.9. As shown in Fig. 3, the ra-tio PI (38:4)/C16:1 CE had the highest AUC value at 1.Comparing with the ratio PI (38:4)/C16:1 CE in the con-trol group, the value of PI (38:4)/C16:1 CE in patientswith COPD is significant decreased with only one third.Thus, we can get high sensitivity and specificity from 4lipid species and all 10 lipid ratios by OPLS-DA andROC analysis, indicating the potential as serum COPDbiomarkers.Finally, we explored the ability of lipid ratio bio-
markers to determine different stages of COPD. The
Table 2 Top 10 lipid ratio biomarker candidates
Rank Lipid Species Trend Lipid Class AUC Log2FC p value
1 PI(38:4)/C16:1 CE ↓ glycerophospholipids/sterol lipids 1 −1.59 6.41E-05
2 PI(36:2)/C16:1 CE ↓ glycerophospholipids/sterol lipids 0.98 −2.01 2.25E-04
3 C16:1 CE/C19:0 CE ↑ sterol lipids/sterol lipids 0.98 1.24 3.72E-05
4 ePC(38:2)/C16:1 CE ↓ glycerophospholipids/sterol lipids 0.97 −1.8 2.26E-05
5 LPC(18:0)/C20:3 CE ↓ glycerophospholipids/sterol lipids 0.95 −1.13 3.38E-05
6 LPC(16:1)/C16:1 CE ↓ glycerophospholipids/sterol lipids 0.94 −1.43 1.87E-04
7 PC(32:0)/C16:1 CE ↓ glycerophospholipids/sterol lipids 0.94 −1.23 1.51E-04
8 PC(34:3)/C16:1 CE ↓ glycerophospholipids/sterol lipids 0.94 −1.36 1.00E-04
9 PC(38:1)/C16:1 CE ↓ glycerophospholipids/sterol lipids 0.94 −1.78 1.17E-04
10 PC(40:4)/ePC(38:2) ↑ glycerophospholipids/glycerophospholipids 0.94 1.14 8.76E-05
Liu et al. Respiratory Research (2020) 21:242 Page 6 of 13
lipid ratio PI (38:4)/C16:1 CE is shown in the spots plotin Fig. 4. As shown in Fig. 4a, the lipid ratio PI (38:4)/C16:1 CE could distinguish the control group from thepatients with COPD, but it cannot distinguish differentstages of COPD. Since age and smoking status are majorrisk factors for COPD, we were asking if the lipid ratioPI (38:4)/C16:1 CE is associated with these characteris-tics. Interestingly, the ratio of PI (38:4)/C16:1 CE de-creases with the burden of cigarette smoking status inpatients with COPD (Fig. 4b). Additionally, this lipid
ratio was not affected by age (Fig. 4c). Collectively, ourlipidomic results suggested individual lipid and lipid ra-tio signatures could be used as potential diagnostic bio-markers in future study.
DiscussionDue to the prevalence of COPD, there is a demandingfor reliable non-invasive biomarkers in diagnosing andtreating patients. Blood biomarkers are relatively non-invasive and easy to obtain for this purpose [41]. Among
Fig. 2 OPLS-DA evaluation of potential biomarker candidates. OPLS-DA analysis of1 0 lipid ratios candidates: R2 = 0.619 and Q2 = 0.735. Ellipsesdisplay 95% confidence regions. Serum samples from control are in red and samples from patients with COPD are in green
Table 3 Top 10 lipid species biomarker candidates
Rank Lipid Species Mass Element Trend Lipid Class AUC Log2FC P value
1 PI(36:6) 872.5 C45H75O13P ↓ glycerophospholipids 0.95 −3.08 0.0057
2 C16:1 CE 640.6 C43H78NO2 ↑ sterol lipids 0.88 1.54 0.0077
3 TAG(54:6) 22:6/16:0/16:0 896.8 C57H102O6N ↑ glycerolipids 0.86 1.77 0.0098
4 PI(44:6) 984.6 C53H91O13P ↓ glycerophospholipids 0.82 −1 0.0368
5 PC(32:1) 732.5 C40H78O8PN ↑ glycerophospholipids 0.8 1.42 0.0212
6 ePE(34:2) 702.5 C39H76O7PN ↓ glycerophospholipids 0.8 −1 0.041
7 TAG(54:5) 18:2/18:1/18:2 898.8 C57H104O6N ↓ glycerolipids 0.8 −1.2 0.0456
8 SM(22:0) 787.7 C45H91N2O6P ↑ gphingolipids 0.78 1.2 0.0312
9 LPE(20:2) 506.3 C25H48O7PN ↓ glycerophospholipids 0.75 −1.07 0.0432
10 ePS(38:3) 800.6 C44H82O9PN ↓ glycerophospholipids 0.73 −1 0.0445
Liu et al. Respiratory Research (2020) 21:242 Page 7 of 13
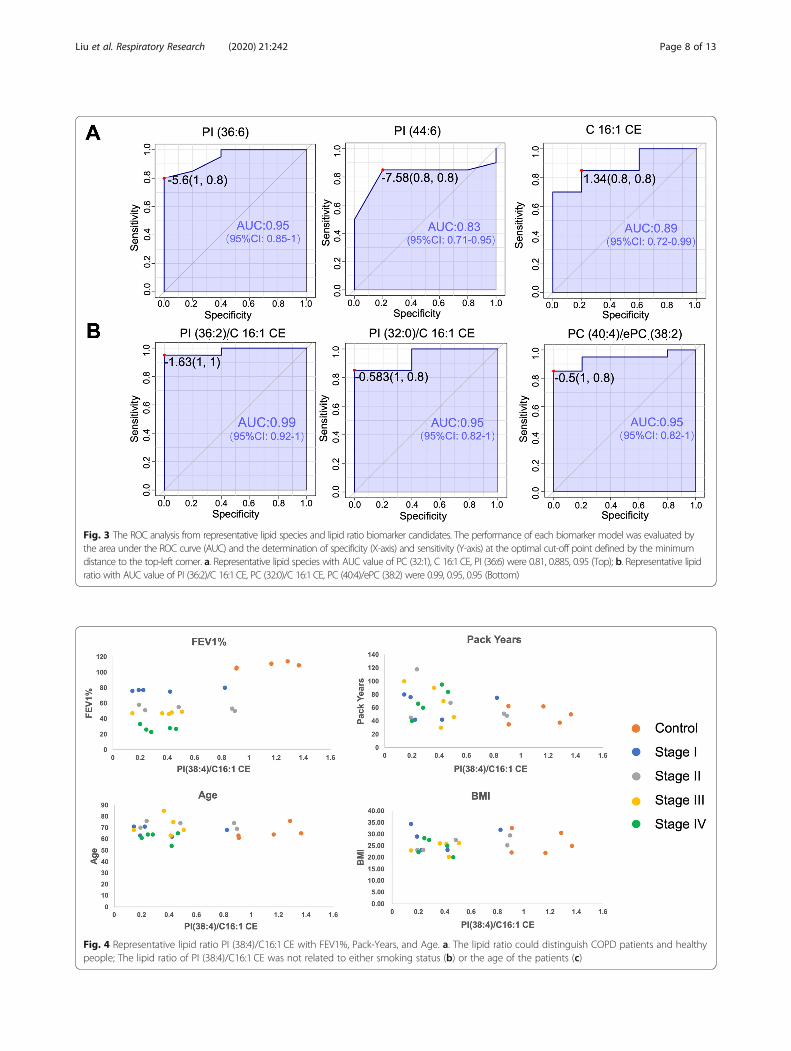
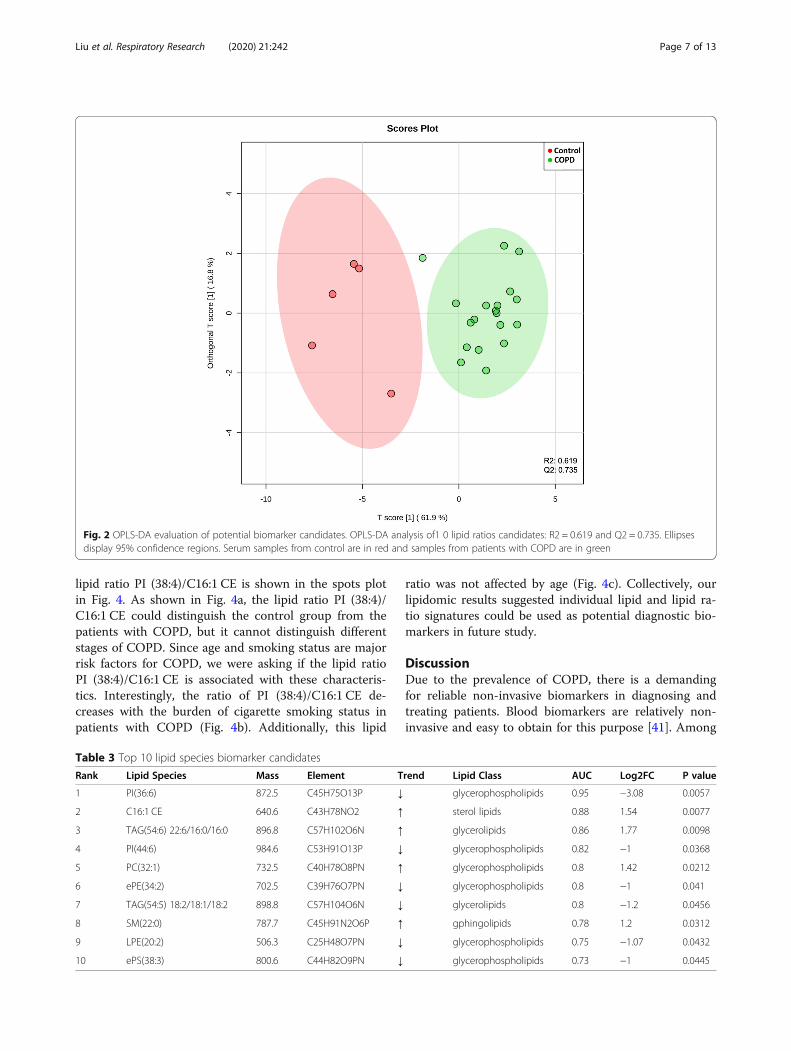
Fig. 3 The ROC analysis from representative lipid species and lipid ratio biomarker candidates. The performance of each biomarker model was evaluated bythe area under the ROC curve (AUC) and the determination of specificity (X-axis) and sensitivity (Y-axis) at the optimal cut-off point defined by the minimumdistance to the top-left corner. a. Representative lipid species with AUC value of PC (32:1), C 16:1 CE, PI (36:6) were 0.81, 0.885, 0.95 (Top); b. Representative lipidratio with AUC value of PI (36:2)/C 16:1 CE, PC (32:0)/C 16:1 CE, PC (40:4)/ePC (38:2) were 0.99, 0.95, 0.95 (Bottom)
Fig. 4 Representative lipid ratio PI (38:4)/C16:1 CE with FEV1%, Pack-Years, and Age. a. The lipid ratio could distinguish COPD patients and healthypeople; The lipid ratio of PI (38:4)/C16:1 CE was not related to either smoking status (b) or the age of the patients (c)
Liu et al. Respiratory Research (2020) 21:242 Page 8 of 13
all the blood biomarkers, blood eosinophils are the bestcharacterized and the most applied in clinical practice[42–44]. Recent data indicates that the correlation be-tween the COPD and the blood eosinophils is low (R2 =0.35), and this correlation is significantly affected by ageand the presence of hypertension [45]. Other studyshows that bacteria load could lower the eosinophilcounts in patients with COPD [46]. In addition, a totalnumber of 34 blood biomarkers were assessed in theECLIPSE cohort [47]. Among these 34 biomarkers, onlyfibrinogen, CC-16, and surfactant protein D were classi-fied as stable biomarkers of baseline disease activity withlow correlation coefficient [47]. Therefore, more innova-tive and reliable biomarkers are needed to differentiatethe status of disease. Approximately 30% of COPD pa-tients are considered obese, obesity reciprocally corre-lates with morbidity in patients with moderate to severeCOPD [11, 48]. In order to understand the role of lipidsin the development of COPD, we performed lipidomicanalysis on serum from different severity levels ofCOPD. A total of 377 lipid compounds were identifiedin human serum from 25 patients. After the overall lipidprofiling, using statistics and fold change filtration, atotal of 10 lipid species and 10 lipid ratios were found tobe significantly different between patients with COPDand controls. Together, our data suggest a lipid metabol-ism disorder play a unique role in the pathogenesis ofCOPD, and these unique lipidomic signatures need fur-ther validation for future study.In single lipids level, 10 lipid species were selected as
biomarker candidates, including six species of phospho-lipids, two species of glycerolipids, one species of sphin-golipids, and one species of sterol lipid. Among them,three phospholipids (PC(32:1), PI(36:6), PI(44:6)), oneglycerolipid TAG(54:6) 22:6/16:0/16:0, one sphingolipid(SM(22:0)), and one sterol lipid (C16:1 CE) were higherin patients with COPD comparing with the control. Onthe other hand, one glycerolipid TAG(54:5) 18:2/18:1/18:2, and four other phospholipids (ePE(34:2), ePS(38:3),LPE(20:2), and PS(34:0)) were lower in patients withCOPD.Lipid ratios have been proven to be a useful biomarker
for several diseases, including cardiovascular disease,Alzheimer’s disease, and diabetes [49–51]. In addition,using lipid ratios as a disease indicator would carry moreinformation and be more biologically meaningful. Ourresults showed that all of the ratio glycerophospholipids/sterol lipids were lower in COPD patients than inhealthy controls. The ratio of two sterol lipids C16:1 CE/C19:0 CE and the ratio of two glycerophospholipids PC(40:4)/ePC(38:2) were higher in COPD groups comparedwith the control group. Further studies are needed to es-tablish the biological mechanisms of these ratios inCOPD patients.
In the ROC analysis, the AUC of all biomarker candi-dates was calculated. Generally, an AUC of 0.5 suggestsno diagnostic ability to distinguish patients with andwithout the disease, 0.7 to 0.8 is an acceptable level, 0.8to 0.9 is an excellent level, and more than 0.9 is an out-standing level [52]. Based on this criteria, for single lipidbiomarker candidates, lipids including PS(34:0), ePS(38:3), LPE(20:2), ePE(38:6), SM(22:0) are acceptable bio-marker candidates; ePE(34:2), PC(32:1), PI(44:6), C16:1CE are excellent biomarker candidates; and PI(36:6) isoutstanding biomarker candidate. For lipid ratio bio-marker candidates, all of them are outstanding bio-marker candidates. The AUC values of lipid ratiobiomarker candidates showed higher sensitivity (true-positive rate) and specificity (false-positive rate) for dis-tinguishing COPD objects from controls (Fig. 4). Herewe applied AUC value above outstanding level (AUC >0.9) as cut off point, all of the 10 lipid ratios and 4 lipidspecie (AUC > 0.9) are qualified as potential biomarkersin diagnosing COPD disease in the future. However, thebiological functions of these biomarker candidates needto be validated before the confirmation of useful COPDbiomarkers.Glycerolphospholipids, which are the main lipid class
identified in this study, are highly enriched within thepulmonary airway surfactant. A surfactant disorder wasreported to be related to the pathogenesis of COPD [53].PI consisted of an inositol group and two fatty acidchains linked by a glycerol backbone. In a previous re-port, the upregulation of phosphatidylinositol-3 kinase(PI3K) generated extra oxidative stress on COPD pa-tients [54]. The lower production of PI in our studycould partially due to the activation of PI3K pathway inpatients with COPD. Pulmonary surfactant is a complexmixture consisting of phosphatidylcholine (PC), neutrallipids, and specific proteins [8, 9]. It is essential for nor-mal lung function because it reduces surface tension atthe air–liquid interface of lung alveoli. Surfactants defi-ciency might be related to the development of COPD[10, 11]. PC16:0/16:0 was reported to be a key compos-ition of pulmonary surfactant [55]. PC 16:0/18:0 was alsoreported to represent around 1% of surfactant phospho-lipid [56]. Besides, the higher level of phosphatidylcho-line hydroperoxide was found to be associated with theincrease of pulmonary artery pressures, which is import-ant in the pathogenesis of COPD [57]. Previous study in-dicated PC is its main component of surfactant, whileproteins and other phospholipids contribute to the dy-namic properties and homeostasis of alveolar surfactant[13]. The PC profiling from the patients with differentstages of COPD were demonstrated in SupplementalFigure 2. We found PC (16:0/18:1) percentage is posi-tively correlated with the severity of COPD. While PC(16:0/18:2) and PC (16:0/20:2) is negatively correlated
Liu et al. Respiratory Research (2020) 21:242 Page 9 of 13
with the severity of COPD. This data suggests that alter-ation of PC in plasma are pronounced in the pathogen-esis COPD. As pulmonary surfactant deficiency wasclosely associated with COPD [14], the change of PC 32:1 in COPD patients in our results could be another indi-cator of surfactant composition change. Due to smallsample size, our data did not reach the significant differ-ence. Therefore, PC labeling signature need to be vali-dated in large dataset using stable isotope standards forpotential biomarker in the future.However, PE was reported to increase in COPD pa-
tients’ serum or sputum by previous lipidomics study[15, 58], which was not identified in our study. Phospha-tidylserine (PS) comprises a minor percentage of aphospholipid, but it has an important effect on cell sig-naling and blood coagulation [59]. Interestingly, PS andePS were higher expressed in our results, which werenot observed in previous studies on COPD patients inour knowledge. Although COPD was not reported tohave a direct influence on Triacylglycerolipid (TAG), weobserved a unique labeling pattern of TAG in patientswith COPD. Among them, TAG(54:5) 18:2/18:1/18:2was lower while TAG(54:6) 22:6/16:0/16:0 was higher inpatients with COPD, suggesting these labeling patternsmay play essential roles in the development of COPD.Sphingolipids play an essential role in the development
of COPD [10, 60]. Smokers and COPD patients have ele-vated levels of ceramides in their lungs. Accumulating
data indicate that tobacco smoke induces pulmonaryand vascular cell apoptosis via ceramide production byalveolar macrophages [10, 61–63]. Sphingomyelins (SM),including phosphoethanolamines and ceramides, are themain class of sphingolipids. Neutral sphingomyelinase-2(nSMase-2), which hydrolyzes sphingomyelin to produceceramide, is elevated in small airways cells and alveolarmacrophages from COPD patients compared with thecontrol [64]. Consistent with these data, we found ahigher level of sphingomyelin (SM, 22:0) in COPD pa-tients. Thus, identification of specific lipid regulationsmay yield new insight for diagnosis and treatment.The high hydrophobicity of cholesterol ester (CE)
leads the esterified cholesterol moving from the surfaceinto the center within discoidal high-density lipoprotein(HDL), which will transform discoidal HDL into spher-ical HDL [65]. This transformation leads HDL to highercholesterol carrying capacity in the blood. Consistentwith previous data [66], the major format of cholesterolester is C18:2 CE as shown in Supplemental Table 1. Pa-tients with very severe COPD have a much higher levelof cholesterol [33, 35]. Interestingly, our results indicatedthe ratio of C16:1 CE in patients with COPD is about 3times higher than that in healthy controls. Biosynthesispathways of lipids usually involve two or more lipid spe-cies and related enzymes. Therefore, changes in thesebiosynthesis pathways can be reflected by a specific lipidratio. Lecithin cholesterol acyltransferase (LCAT) is a
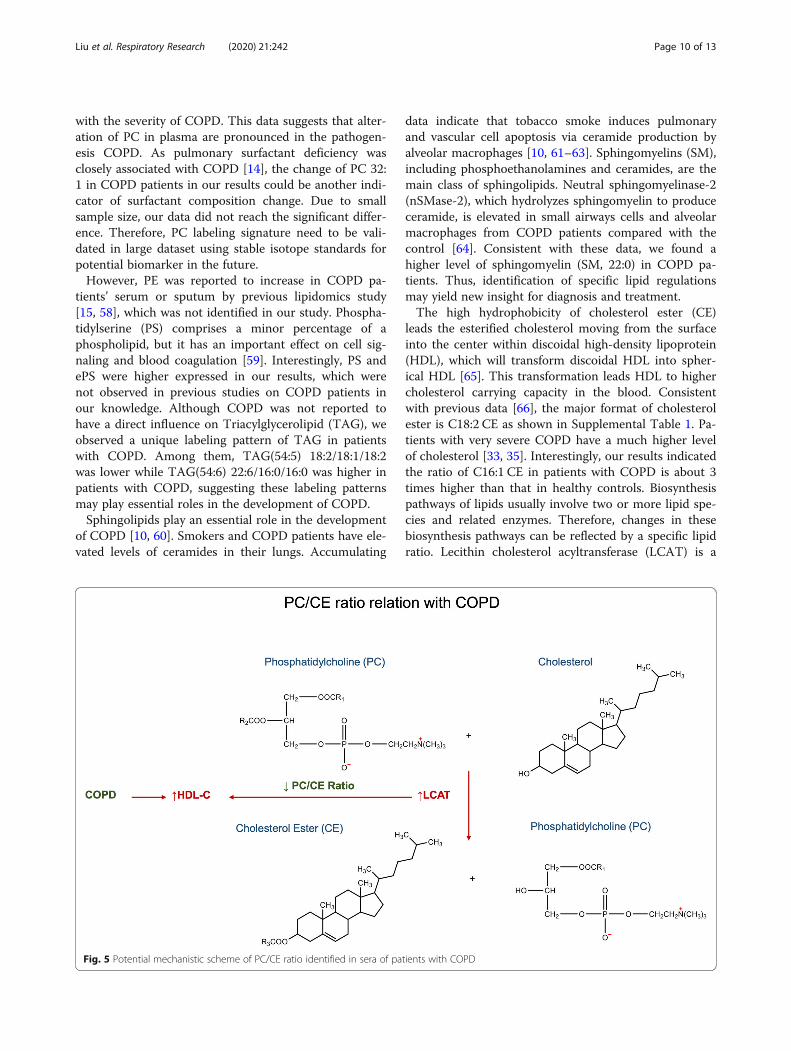
Fig. 5 Potential mechanistic scheme of PC/CE ratio identified in sera of patients with COPD
Liu et al. Respiratory Research (2020) 21:242 Page 10 of 13
key enzyme for the production of cholesteryl esters inplasma, which exerts on the formation and maturationof HDL-C [67, 68]. Ratios of glycerophospholipids/sterollipids in our study consist of two major classes, PI/CEand PC/CE. PC/CE ratio is highly associated with thefunction of lecithin cholesterol acyltransferase (LCAT),which can hydrolyze phosphatidylcholine and transferthe free cholesterol to cholesterol ester (CE). After ester-ification of cholesterol, the higher hydrophobicity of CEwould enhance the capacity of lipoproteins. The correl-ation between the concentration of HDL and the statusof COPD is not very conclusive. Clinical studies on menwith more than 10 years of smoking history showed thatsmokers had lower plasma HDL fractions 2 and 3 [37].Another meta-analysis indicated that smokers had sig-nificantly higher concentrations of cholesterol and LDL,and the lower concentrations of HDL in the serum [36].On the contrary, other studies showed patients withCOPD tend to have higher levels of high-density lipo-protein cholesterol (HDL-C) [69]. As previously de-scribed in the discussion, COPD is associated with anincreasing level of HDL-C, which refers to the elevationof LCAT. Therefore, the decreasing PC/CE ratio inCOPD patients is possibly due to the increased functionof LCAT, resulting in the elevation of HDL-C (Fig. 5). Inaddition, PI/CE ratio occupied the top 2 in the AUCvalue rank of 10 lipid ratio biomarker candidates. Al-though the PI/CE ratio does not involve pathways likethe PC/CE, PI has been shown to enhance themobilization of cellular sterol and promote a rapid clear-ance of both cholesterol and cholesterol ester from theplasma in vivo [70]. Phosphoinositide-3-kinase-delta(PI3K-δ) is activated in COPD and targeting PI3K-δmimic the effects of could reverses corticosteroid resist-ance in animal model of COPD [71].Finally, correlation analysis was performed to explore
the possible effects of age, BMI, stages, FEV1% andsmoking pack years, on the identified biomarkers. Allthe correlation analysis were shown as scatter plot insupporting information (Supplemental Figure 3–12).Through the correlation analysis, all the lipid ratioscould only discriminate the healthy people from theCOPD patients, but they were not affected by age, BMI,stages, FEV1%. Interestingly, the lipid ratios showed dif-ferences with the smoking exposure in patients withCOPD, while the healthy people had relative low packyears among all samples. Since smoking is a main causeof COPD, it is reasonable for these potential biomarkersbeing affected by smoking pack years. Although the re-sults are promising, limitations still exist in our study.Due to the limited sample size and the sample size dif-ference between control and disease groups, further ef-forts need to validate in a large independent dataset.Besides, since the instrument limitation, targeted lipid
study cannot be performed, which could further validatethe results.
ConclusionsIn conclusion, our study has identified potential bio-markers for the diagnosis of COPD and acquired a vitalclue of lipid metabolism in COPD patients. Our resultsdiscovered 4 individual lipid molecules and 10 lipid ra-tios being able to differentiate COPD from controls.Among these biomarkers, PI, PC, CE and their ratios PI/CE, PC/CE are biologically significant to COPD. LCATcould be a potential target for COPD. Future effortswould be focused on validating these biomarkers using alarge sample size and targeted lipidomics approach. Fi-nally, a panel of stable biomarkers will enable us to bet-ter predict response to therapy and prognosis.
Supplementary informationSupplementary information accompanies this paper at https://doi.org/10.1186/s12931-020-01507-9.
Additional file 1: Supplemental Figure 1. Representative of MS/MSexample ion spectrum for 798.5 and 496.3 m/z using negative ESI mode.
Additional file 2: Supplemental Figure 2. Phosphatidylcholinemolecular species distribution across the severity of COPD patients (red isup; green is down).
Additional file 3: Supplemental Figure 3–12. Correlations betweenthe lipid ratios and FEV1, Smoking Pack Years, Age and BMI.
Additional file 4.
Additional file 5.
AbbreviationsAUC–ROC: The area under the receiver operating characteristics curve;CE: Cholesterol ester; COPD: Chronic obstructive pulmonary disease; ESI-MS: Electrospray ionization mass spectrometry; ePC: Ether-linkedphosphatidylcholine; ePE: Ether-linked phosphatidylethanolamine; ePS: Ether-linked phosphatidylserine; HDL: High-density lipoprotein;LPA: Lysophosphatidic acid; LPC: Lysophosphatidylcholine;LPE: Lysophosphatidylethanolamine; LPG: Lysophosphatidylglycerol; OPLS-DA: Orthogonal projections to latent structures discriminant analysis;PC: Phosphatidylcholine; PE: Phosphatidylethanolamine;PG: Phosphatidylglycerol; PI: Phosphatidylinositol; PS: Phosphatidylserine;ROC: Receiver operating characteristics; SM: Sphingolipid;TAG: Triacylglycerolipid
AcknowledgementsThe authors thank Dr. Ruth Welti at Kansas Lipidomics Research Center, whoprovides mass-spectrometry service for our study.
Authors’ contributionsConceived and designed—L.L, P.W., P.M., X.J.; performed experiments—D.L.,M.M., S.W.; analyzed the data—D.L., R.F.; wrote the first draft of themanuscript—D.L., M.M.; edited the manuscript— S.Z., C.V., L.L., X.J. All authorshave approved this version of the submitted manuscript.
FundingThis work was supported by NCI grant CA102353 and DoD W81XWH-11-2-0161 to PPM. This work was also supported by FAMRI foundationYFEL141014 to XJ. The work is also supported by NHLBI (U54HL142019) toL.L.
Liu et al. Respiratory Research (2020) 21:242 Page 11 of 13
Availability of data and materialsThe datasets used and/or analyzed during the current study are availablefrom the corresponding author on reasonable request.
Ethics approval and consent to participateThe study protocol was approved by the institutional review board andethics committee at VUMC (IRB No. 030763) and at GSU (IRB No. B17029),and was conducted according to the principles of the Declaration ofHelsinki. The need to obtain informed consent was waived due to theretrospective nature of the study.
Consent for publicationNot applicable.
Competing interestsThe authors declare that they have no competing interests.
Author details1Department of Chemistry, Georgia State University, Atlanta, GA 30303, USA.2Department of Nutrition, Georgia State University, Atlanta 30302, USA.3Department of Mathematics and Statistics, Georgia State University, Atlanta,GA 30302, USA. 4Cancer Early Detection and Prevention Initiative, VanderbiltIngram Cancer Center; Division of Allergy, Pulmonary and Critical CareMedicine, Vanderbilt University School of Medicine, Nashville, TN 37232, USA.
Received: 5 May 2020 Accepted: 11 September 2020
References1. Quaderi SA, Hurst JR. The unmet global burden of COPD. Glob Health
Epidemiol Genom. 2018;3:e4.2. Murray CJ, Atkinson C, Bhalla K, Birbeck G, Burstein R, Chou D, Dellavalle R,
Danaei G, Ezzati M, Fahimi A, et al. The state of US health, 1990-2010:burden of diseases, injuries, and risk factors. JAMA. 2013;310(6):591–608.
3. Mannino DM, Martinez FJ. Lifetime risk of COPD: what will the future bring?Lancet. 2011;378(9795):964–5.
4. Jeffery PK. Remodeling and inflammation of bronchi in asthma and chronicobstructive pulmonary disease. Proc Am Thorac Soc. 2004;1(3):176–83.
5. Salvi S. Tobacco smoking and environmental risk factors for chronicobstructive pulmonary disease. Clin Chest Med. 2014;35(1):17–27.
6. Vogelmeier CF, Criner GJ, Martinez FJ, Anzueto A, Barnes PJ, Bourbeau J,Celli BR, Chen R, Decramer M, Fabbri LM, et al. Global Strategy for theDiagnosis, Management, and Prevention of Chronic Obstructive LungDisease 2017 Report. GOLD executive summary. Am J Respir Crit Care Med.2017;195(5):557–82.
7. Brutsche MH, Downs SH, Schindler C, Gerbase MW, Schwartz J, Frey M, RussiEW, Ackermann-Liebrich U, Leuenberger P, Team S. Bronchialhyperresponsiveness and the development of asthma and COPD inasymptomatic individuals: SAPALDIA cohort study. Thorax. 2006;61(8):671–7.
8. Csikesz NG, Gartman EJ. New developments in the assessment of COPD:early diagnosis is key. Int J Chron Obstruct Pulmon Dis. 2014;9:277–86.
9. Chen H, Li Z, Dong L, Wu Y, Shen H, Chen Z. Lipid metabolism in chronicobstructive pulmonary disease. Int J Chron Obstruct Pulmon Dis. 2019;14:1009–18.
10. Petrache I, Natarajan V, Zhen L, Medler TR, Richter AT, Cho C, Hubbard WC,Berdyshev EV, Tuder RM. Ceramide upregulation causes pulmonary cellapoptosis and emphysema-like disease in mice. Nat Med. 2005;11(5):491–8.
11. Lambert AA, Putcha N, Drummond MB, Boriek AM, Hanania NA, Kim V,Kinney GL, McDonald MN, Brigham EP, Wise RA, et al. Obesity is associatedwith increased morbidity in moderate to severe COPD. Chest. 2017;151(1):68–77.
12. Cao C, Wu Y, Xu Z, Lv D, Zhang C, Lai T, Li W, Shen H. The effect of statinson chronic obstructive pulmonary disease exacerbation and mortality: asystematic review and meta-analysis of observational research. Sci Rep.2015;5:16461.
13. Clements JA. Surface tension of lung extracts. Proc Soc Exp Biol Med. 1957;95(1):170–2.
14. Lusuardi M, Capelli A, Carli S, Tacconi MT, Salmona M, Donner CF. Role ofsurfactant in chronic obstructive pulmonary disease: therapeuticimplications. Respiration. 1992;59(Suppl 1):28–32.
15. Telenga ED, Hoffmann RF, Ruben TK, Hoonhorst SJ, Willemse BW, vanOosterhout AJ, Heijink IH, van den Berge M, Jorge L, Sandra P, et al.Untargeted lipidomic analysis in chronic obstructive pulmonary disease.Uncovering sphingolipids. Am J Respir Crit Care Med. 2014;190(2):155–64.
16. Zemski Berry KA, Murphy RC, Kosmider B, Mason RJ. Lipidomiccharacterization and localization of phospholipids in the human lung. JLipid Res. 2017;58(5):926–33.
17. Navarrete A, Ruperez FJ, Mendes TO, Perez-Rial S, Giron-Martinez A, Terron-Exposito R, Diaz-Gil JJ, Peces-Barba G, Barbas C, Garcia A. A metabolomicapproach shows sphingosine 1-phosphate and lysophospholipids asmediators of the therapeutic effect of liver growth factor in emphysema. JPharm Biomed Anal. 2017;139:238–46.
18. Barnawi J, Tran HB, Roscioli E, Hodge G, Jersmann H, Haberberger R, HodgeS. Pro-phagocytic effects of Thymoquinone on cigarette smoke-exposedmacrophages occur by modulation of the Sphingosine-1-phosphateSignalling system. COPD. 2016;13(5):653–61.
19. Bowler RP, Jacobson S, Cruickshank C, Hughes GJ, Siska C, Ory DS, PetracheI, Schaffer JE, Reisdorph N, Kechris K. Plasma sphingolipids associated withchronic obstructive pulmonary disease phenotypes. Am J Respir Crit CareMed. 2015;191(3):275–84.
20. Hannun YA, Obeid LM. Principles of bioactive lipid signalling: lessons fromsphingolipids. Nat Rev Mol Cell Biol. 2008;9(2):139–50.
21. Lee JY, Sohn KH, Rhee SH, Hwang D. Saturated fatty acids, but notunsaturated fatty acids, induce the expression of cyclooxygenase-2mediated through toll-like receptor 4. J Biol Chem. 2001;276(20):16683–9.
22. Dennis EA. Lipidomics joins the omics evolution. Proc Natl Acad Sci U S A.2009;106(7):2089–90.
23. Rabe KF, Hurd S, Anzueto A, Barnes PJ, Buist SA, Calverley P, Fukuchi Y,Jenkins C, Rodriguez-Roisin R, van Weel C, et al. Global strategy for thediagnosis, management, and prevention of chronic obstructive pulmonarydisease: GOLD executive summary. Am J Respir Crit Care Med. 2007;176(6):532–55.
24. Zhou X, Mao J, Ai J, Deng Y, Roth MR, Pound C, Henegar J, Welti R, BiglerSA. Identification of plasma lipid biomarkers for prostate cancer bylipidomics and bioinformatics. PLoS One. 2012;7(11):e48889.
25. Comfurius P, Zwaal RF. The enzymatic synthesis of phosphatidylserine andpurification by CM-cellulose column chromatography. Biochim BiophysActa. 1977;488(1):36–42.
26. Devaiah SP, Roth MR, Baughman E, Li M, Tamura P, Jeannotte R, Welti R,Wang X. Quantitative profiling of polar glycerolipid species from organs ofwild-type Arabidopsis and a phospholipase Dalpha1 knockout mutant.Phytochemistry. 2006;67(17):1907–24.
27. Welti R, Li W, Li M, Sang Y, Biesiada H, Zhou HE, Rajashekar CB, Williams TD,Wang X. Profiling membrane lipids in plant stress responses. Role ofphospholipase D alpha in freezing-induced lipid changes in Arabidopsis. JBiol Chem. 2002;277(35):31994–2002.
28. Chong J, Xia J. MetaboAnalystR: an R package for flexible and reproducibleanalysis of metabolomics data. Bioinformatics. 2018;34(24):4313–4.
29. Zhou Z, Marepally SR, Nune DS, Pallakollu P, Ragan G, Roth MR, Wang L,Lushington GH, Visvanathan M, Welti R. LipidomeDB data calculationenvironment: online processing of direct-infusion mass spectral data forlipid profiles. Lipids. 2011;46(9):879–84.
30. Anton G, Wilson R, Yu ZH, Prehn C, Zukunft S, Adamski J, Heier M,Meisinger C, Romisch-Margl W, Wang-Sattler R, et al. Pre-analyticalsample quality: metabolite ratios as an intrinsic marker for prolongedroom temperature exposure of serum samples. PLoS One. 2015;10(3):e0121495.
31. Mundra PA, Barlow CK, Nestel PJ, Barnes EH, Kirby A, Thompson P, SullivanDR, Alshehry ZH, Mellett NA, Huynh K, et al. Large-scale plasma lipidomicprofiling identifies lipids that predict cardiovascular events in secondaryprevention. JCI Insight. 2018;3(17):e121326.
32. Uehara T, Kikuchi H, Miyazaki S, Iino I, Setoguchi T, Hiramatsu Y, Ohta M,Kamiya K, Morita Y, Tanaka H, et al. Overexpression ofLysophosphatidylcholine Acyltransferase 1 and concomitant lipid alterationsin gastric Cancer. Ann Surg Oncol. 2016;23(Suppl 2):S206–13.
33. Zafirova-Ivanovska B, Stojkovikj J, Dokikj D, Anastasova S, Debresliovska A,Zejnel S, Stojkovikj D. The level of cholesterol in COPD patients with severeand very severe stage of the disease. Open Access Maced J Med Sci. 2016;4(2):277–82.
34. Burkart KM, Manichaikul A, Wilk JB, Ahmed FS, Burke GL, Enright P, HanselNN, Haynes D, Heckbert SR, Hoffman EA, et al. APOM and high-density
Liu et al. Respiratory Research (2020) 21:242 Page 12 of 13
lipoprotein cholesterol are associated with lung function and per centemphysema. Eur Respir J. 2014;43(4):1003–17.
35. Li H, Liu Y, Wang L, Shen T, Du W, Liu Z, Chen R, Hu M. High apolipoproteinM serum levels correlate with chronic obstructive pulmonary disease. LipidsHealth Dis. 2016;15:59.
36. Craig WY, Palomaki GE, Haddow JE. Cigarette smoking and serum lipid andlipoprotein concentrations: an analysis of published data. BMJ. 1989;298(6676):784–8.
37. Mjos OD. Lipid effects of smoking. Am Heart J. 1988;115(1 Pt 2):272–5.38. Eriksson L, Antti H, Gottfries J, Holmes E, Johansson E, Lindgren F, Long I,
Lundstedt T, Trygg J, Wold S. Using chemometrics for navigating in thelarge data sets of genomics, proteomics, and metabonomics (gpm). AnalBioanal Chem. 2004;380(3):419–29.
39. Blasco H, Blaszczynski J, Billaut JC, Nadal-Desbarats L, Pradat PF, Devos D,Moreau C, Andres CR, Emond P, Corcia P, et al. Comparative analysis oftargeted metabolomics: dominance-based rough set approach versusorthogonal partial least square-discriminant analysis. J Biomed Inform. 2015;53:291–9.
40. Linden A. Measuring diagnostic and predictive accuracy in diseasemanagement: an introduction to receiver operating characteristic (ROC)analysis. J Eval Clin Pract. 2006;12(2):132–9.
41. van Bragt J, Vijverberg SJH, Weersink EJM, Richards LB, Neerincx AH, SterkPJ, Bel EHD, Maitland-van der Zee AH. Blood biomarkers in chronic airwaysdiseases and their role in diagnosis and management. Expert Rev RespirMed. 2018;12(5):361–74.
42. Roche N, Chapman KR, Vogelmeier CF, Herth FJF, Thach C, Fogel R, OlssonP, Patalano F, Banerji D, Wedzicha JA. Blood Eosinophils and response tomaintenance chronic obstructive pulmonary disease treatment. Data fromthe FLAME trial. Am J Respir Crit Care Med. 2017;195(9):1189–97.
43. Bafadhel M, McKenna S, Terry S, Mistry V, Pancholi M, Venge P, Lomas DA,Barer MR, Johnston SL, Pavord ID, et al. Blood eosinophils to directcorticosteroid treatment of exacerbations of chronic obstructive pulmonarydisease: a randomized placebo-controlled trial. Am J Respir Crit Care Med.2012;186(1):48–55.
44. Bafadhel M, McKenna S, Terry S, Mistry V, Reid C, Haldar P, McCormick M,Haldar K, Kebadze T, Duvoix A, et al. Acute exacerbations of chronicobstructive pulmonary disease: identification of biologic clusters and theirbiomarkers. Am J Respir Crit Care Med. 2011;184(6):662–71.
45. Pignatti P, Visca D, Cherubino F, Zampogna E, Lucini E, Saderi L, Sotgiu G,Spanevello A. Do blood eosinophils strictly reflect airway inflammation inCOPD? Comparison with asthmatic patients. Respir Res. 2019;20(1):145.
46. Kolsum U, Donaldson GC, Singh R, Barker BL, Gupta V, George L, Webb AJ,Thurston S, Brookes AJ, McHugh TD, et al. Blood and sputum eosinophils inCOPD; relationship with bacterial load. Respir Res. 2017;18(1):88.
47. Dickens JA, Miller BE, Edwards LD, Silverman EK, Lomas DA, Tal-Singer R,Evaluation of CLtISEsi. COPD association and repeatability of bloodbiomarkers in the ECLIPSE cohort. Respir Res. 2011;12:146.
48. Cecere LM, Littman AJ, Slatore CG, Udris EM, Bryson CL, Boyko EJ, PiersonDJ, Au DH. Obesity and COPD: associated symptoms, health-related qualityof life, and medication use. COPD. 2011;8(4):275–84.
49. Artha I, Bhargah A, Dharmawan NK, Pande UW, Triyana KA, Mahariski PA,Yuwono J, Bhargah V, Prabawa IPY, Manuaba I, et al. High level of individuallipid profile and lipid ratio as a predictive marker of poor glycemic controlin type-2 diabetes mellitus. Vasc Health Risk Manag. 2019;15:149–57.
50. Sato Y, Suzuki I, Nakamura T, Bernier F, Aoshima K, Oda Y. Identification of anew plasma biomarker of Alzheimer's disease using metabolomicstechnology. J Lipid Res. 2012;53(3):567–76.
51. Anroedh S, Hilvo M, Akkerhuis KM, Kauhanen D, Koistinen K, OemrawsinghR, Serruys P, van Geuns RJ, Boersma E, Laaksonen R, et al. Plasmaconcentrations of molecular lipid species predict long-term clinicaloutcome in coronary artery disease patients. J Lipid Res. 2018;59(9):1729–37.
52. Mandrekar JN. Receiver operating characteristic curve in diagnostic testassessment. J Thorac Oncol. 2010;5(9):1315–6.
53. Hohlfeld J, Fabel H, Hamm H. The role of pulmonary surfactant inobstructive airways disease. Eur Respir J. 1997;10(2):482–91.
54. Mercado N, Ito K, Barnes PJ. Accelerated ageing of the lung in COPD: newconcepts. Thorax. 2015;70(5):482–9.
55. Perez-Gil J, Keough KM. Interfacial properties of surfactant proteins. BiochimBiophys Acta. 1998;1408(2–3):203–17.
56. Kahn MC, Anderson GJ, Anyan WR, Hall SB. Phosphatidylcholine molecularspecies of calf lung surfactant. Am J Phys. 1995;269(5 Pt 1):L567–73.
57. Joppa P, Petrasova D, Stancak B, Dorkova Z, Tkacova R. Oxidative stress inpatients with COPD and pulmonary hypertension. Wien Klin Wochenschr.2007;119(13–14):428–34.
58. Titz B, Luettich K, Leroy P, Boue S, Vuillaume G, Vihervaara T, Ekroos K,Martin F, Peitsch MC, Hoeng J. Alterations in Serum Polyunsaturated FattyAcids and Eicosanoids in Patients with Mild to Moderate ChronicObstructive Pulmonary Disease (COPD). Int J Mol Sci. 2016;17(9):1583.
59. Lentz BR. Exposure of platelet membrane phosphatidylserine regulatesblood coagulation. Prog Lipid Res. 2003;42(5):423–38.
60. Petrache I, Petrusca DN, Bowler RP, Kamocki K. Involvement of ceramide incell death responses in the pulmonary circulation. Proc Am Thorac Soc.2011;8(6):492–6.
61. Scarpa MC, Baraldo S, Marian E, Turato G, Calabrese F, Saetta M, Maestrelli P.Ceramide expression and cell homeostasis in chronic obstructive pulmonarydisease. Respiration. 2013;85(4):342–9.
62. Petrusca DN, Van Demark M, Gu Y, Justice MJ, Rogozea A, Hubbard WC,Petrache I. Smoking exposure induces human lung endothelial celladaptation to apoptotic stress. Am J Respir Cell Mol Biol. 2014;50(3):513–25.
63. Petrusca DN, Gu Y, Adamowicz JJ, Rush NI, Hubbard WC, Smith PA,Berdyshev EV, Birukov KG, Lee CH, Tuder RM, et al. Sphingolipid-mediatedinhibition of apoptotic cell clearance by alveolar macrophages. J Biol Chem.2010;285(51):40322–32.
64. Lea SR, Metcalfe HJ, Plumb J, Beerli C, Poll C, Singh D, Abbott-Banner KH.Neutral sphingomyelinase-2, acid sphingomyelinase, and ceramide levels inCOPD patients compared to controls. Int J Chron Obstruct Pulmon Dis.2016;11:2139–47.
65. Jonas A, Kezdy KE, Williams MI, Rye KA. Lipid transfers between reconstitutedhigh density lipoprotein complexes and low density lipoproteins: effects ofplasma protein factors. J Lipid Res. 1988;29(10):1349–57.
66. Nestel PJ, Couzens EA. Turnover of individual cholesterol esters in humanliver and plasma. J Clin Invest. 1966;45(7):1234–40.
67. Thacker SG, Rousset X, Esmail S, Zarzour A, Jin X, Collins HL, Sampson M,Stonik J, Demosky S, Malide DA, et al. Increased plasma cholesterolesterification by LCAT reduces diet-induced atherosclerosis in SR-BIknockout mice. J Lipid Res. 2015;56(7):1282–95.
68. Savel J, Lafitte M, Pucheu Y, Pradeau V, Tabarin A, Couffinhal T. Very lowlevels of HDL cholesterol and atherosclerosis, a variable relationship--areview of LCAT deficiency. Vasc Health Risk Manag. 2012;8:357–61.
69. Reed RM, Iacono A, DeFilippis A, Eberlein M, Girgis RE, Jones S. Advancedchronic obstructive pulmonary disease is associated with high levels ofhigh-density lipoprotein cholesterol. J Heart Lung Transplant. 2011;30(6):674–8.
70. Stamler CJ, Breznan D, Neville TA, Viau FJ, Camlioglu E, Sparks DL.Phosphatidylinositol promotes cholesterol transport in vivo. J Lipid Res.2000;41(8):1214–21.
71. To Y, Ito K, Kizawa Y, Failla M, Ito M, Kusama T, Elliott WM, Hogg JC, AdcockIM, Barnes PJ. Targeting phosphoinositide-3-kinase-delta with theophyllinereverses corticosteroid insensitivity in chronic obstructive pulmonarydisease. Am J Respir Crit Care Med. 2010;182(7):897–904.
Publisher’s NoteSpringer Nature remains neutral with regard to jurisdictional claims inpublished maps and institutional affiliations.
Liu et al. Respiratory Research (2020) 21:242 Page 13 of 13