identification of leishmania spp. and trypanosoma cruzi in
TRANSCRIPT

University of Texas at El PasoDigitalCommons@UTEP
Open Access Theses & Dissertations
2016-01-01
Identification of Leishmania spp. and TrypanosomaCruzi in Sylvatic Animals in El Paso County, TexasMariel Christina MatamorosUniversity of Texas at El Paso, [email protected]
Follow this and additional works at: https://digitalcommons.utep.edu/open_etdPart of the Epidemiology Commons, and the Public Health Education and Promotion Commons
This is brought to you for free and open access by DigitalCommons@UTEP. It has been accepted for inclusion in Open Access Theses & Dissertationsby an authorized administrator of DigitalCommons@UTEP. For more information, please contact [email protected].
Recommended CitationMatamoros, Mariel Christina, "Identification of Leishmania spp. and Trypanosoma Cruzi in Sylvatic Animals in El Paso County,Texas" (2016). Open Access Theses & Dissertations. 893.https://digitalcommons.utep.edu/open_etd/893

IDENTIFICATION OF LEISHMANIA SPP. AND TRYPANOSOMA CRUZI IN SYLVATIC
ANIMALS IN EL PASO COUNTY, TEXAS
MARIEL CHRISTINA MATAMOROS
Master’s Program in Public Health
APPROVED:
_____________________________________
Gabriel Ibarra-Mejia, MD., Ph.D., Chair
_____________________________________
Rodrigo X. Armijos, MD., ScD.
_____________________________________
Kenneth Waldrup, DVM., Ph. D.
__________________________________________
Charles Ambler, Ph.D.
Dean of the Graduate School

Copyright ©
by
Mariel Christina Matamoros
2016

IDENTIFICATION OF LEISHMANIA SPP. AND TRYPANOSOMA CRUZI IN SYLVATIC
ANIMALS IN EL PASO COUNTY, TEXAS
by
MARIEL CHRISTINA MATAMOROS, B.S.
THESIS
Presented to the Faculty of the Graduate School of
The University of Texas at El Paso
in Partial Fulfillment
of the Requirements
for the Degree of
MASTER OF PUBLIC HEALTH
Department of Public Health Sciences
THE UNIVERSITY OF TEXAS AT EL PASO
MAY 2016

iv
Abstract
Background Leishmaniasis and Chagas’s Disease are two of the seventeen diseases
considered as Neglected Tropical Diseases (NTF) by the CDC. Ten million people worldwide
are at risk of being infected by Leishmaniasis and Chagas’ disease affects six million people in
the world; however, these are mostly cases in Latin America. The vector for Chagas’ disease,
triatomine, has been identified near El Paso, Texas region to be positive for Trypanosoma cruzi.
Recent studies have also shown positive results for Chagas’ disease and Leishmaniasis in
sylvatic animals in El Paso.
Objective To determine the prevalence of Trypanosoma cruzi and/or Leishmania spp.
infection in collected tissue samples from sylvatic animals, a study was conducted in the El Paso
County Region to 1) identify DNA of Leishmania spp. and T. cruzi in tissue samples from
sylvatic animals such as foxes, coyotes, skunks and raccoons, and 2) identify and locate positive
cases on a El Paso county map to determine the geographical areas where the animals were
captured as a mean to identify potential locations for the presence of the vector insect.
Methods This study is a cross sectional study analyzing extracted DNA collected from
tissue samples from spleen, heart and skin of wild animals captured in El Paso County, Texas
region during an 18-month time period. Polymerase Chain Reaction (PCR) was used as the
method of identification using TCZ primers for T. cruzi, ITS primers for Leishmania spp., and
IRBP primers to identify mammalian cells in the extracted DNA samples. PCR samples were
run in 1.8% agarose gels.
Results Out of the 146 collected samples, 114 where considered as viable samples given
that thirty where negative for mammalian DNA. Of these, the total number of positive samples

v
was thirty-three (40.24 prevalence) for T. cruzi and eighteen (21.95) for Leishmania spp. 9
(10.98) samples were identified as positive for both parasites. Regarding species, three striped
skunks (12.50) tested positive for T. cruzi and none of samples tested positive for Leishmania
spp.; eighteen gray fox samples (48.65) tested positive for T. cruzi, four (10.81) for Leishmania
spp., and of those four (10.81) had both diseases; five raccoon (35.71) samples tested positive for
T. cruzi, ten (71.43) for Leishmania spp., and five (35.71) for both; lastly, seven coyote (100.00)
samples tested positive for T. cruzi, four (57.17) for Leishmania spp., and four (57.17) tissues
samples for both.
Conclusions As seen in previous studies, the prevalence of Chagas’ diseases in sylvatic
animals in El Paso is higher than that of Leishmaniasis. However, the prevalence found for
Leishmania spp. is higher than was reported in previous studies for the area of El Paso, Texas.
The distribution map showed that positive samples for Leishmania spp. and T. cruzi where
mostly found in suburban areas with low population density. Furthermore, active surveillance for
these diseases is needed. Also, it is necessary to educate the El Paso community on how to
prevent infections and what to do in case any of these symptoms are noticed. Health care
providers should consider symptoms for other common diseases such as cardiomyopathy and
lymphadenopathy as also a symptom for Chagas’ disease or Leishmaniasis.

vi
Table of Contents
Abstract .......................................................................................................................................... iv
Table of Contents ........................................................................................................................... vi
List of Tables ................................................................................................................................. ix
List of Figures ................................................................................................................................. x
Introduction ..................................................................................................................................... 1
Background and Significance ......................................................................................................... 3
1. Leishmaniasis .............................................................................................................................. 3
1.1 Leishmaniasis Worldwide ................................................................................................ 3
1.2 Leishmaniasis in the United States and in Texas ............................................................. 5
1.3 Life cycle of Leishmania ................................................................................................. 7
1.4 Vectors and Reservoirs .................................................................................................... 8
1.5 Clinical aspects of Leishmaniasis and treatment ............................................................. 9
2. Chagas’ disease ......................................................................................................................... 11
2.1 Chagas’ Disease Worldwide .......................................................................................... 11
2.2 Chagas’ Disease in the U.S. and in Texas ..................................................................... 12
2.3 Life cycle of T. cruzi ...................................................................................................... 14
2.4 Vector ............................................................................................................................. 15

vii
2.5 Clinical aspects of Chagas’ disease and treatment ........................................................ 17
3. Study Rationale ......................................................................................................................... 18
3.1 Specific Aims and Objectives ........................................................................................ 18
3.2 Research Question ......................................................................................................... 19
4. Methodology ............................................................................................................................. 20
4.1 Study Design .................................................................................................................. 20
4.2 Sampling ........................................................................................................................ 20
4.3 Materials ........................................................................................................................ 21
4.4 Procedure ....................................................................................................................... 21
4.4.1 Sample Collection ....................................................................................................... 21
4.4.2 DNA Extraction .......................................................................................................... 22
4.4.3 Primers and PCR ......................................................................................................... 22
4.5 Data Analysis ................................................................................................................. 26
4.6 Project Approval ............................................................................................................ 26
5. Expected Results ....................................................................................................................... 27
6. Results ....................................................................................................................................... 28
6.1 PCR Results ................................................................................................................... 29
6.2 Geographic Distribution of Samples .............................................................................. 31
6.3 DNA sequencing ............................................................................................................ 41

viii
6.4 Data analysis .................................................................................................................. 43
7. Discussion ................................................................................................................................. 45
8. Conclusion ................................................................................................................................ 48
References ..................................................................................................................................... 49
9. Vitae .......................................................................................................................................... 52

ix
List of Tables
Table 1 .......................................................................................................................................... 16
Table 2 .......................................................................................................................................... 21
Table 3 .......................................................................................................................................... 23
Table 4 .......................................................................................................................................... 24
Table 5 .......................................................................................................................................... 24
Table 6 .......................................................................................................................................... 26
Table 7 .......................................................................................................................................... 29
Table 8 .......................................................................................................................................... 42
Table 9 .......................................................................................................................................... 43

x
List of Figures
Figure 1: Geographical Distribution of Visceral Leishmaniasis..................................................... 4
Figure 2: Geographical Distribution of Cutaneous Leishmaniasis ................................................. 5
Figure 3: Geographic distribution of Cutaneous Leishmaniasis cases in Texas ............................. 7
Figure 4: Leishmania spp. Life Cycle ............................................................................................. 8
Figure 5: Geographic distribution of triatomid species, infected vectors and hosts, and human
cases .............................................................................................................................................. 13
Figure 6: Trypanosoma cruzi Life Cycle ...................................................................................... 15
Figure 7: Sample agarose gel with PCRs of L. genus, L. mexicana, and T. cruzi positive and
negative controls. .......................................................................................................................... 25
Figure 8: Sample positive and negative gel .................................................................................. 30
Figure 9: Gel using 121/122 primers ............................................................................................ 31
Figure 10: Distribution of captured sylvatic animals with positive identification for Leishmania
spp. and/or T. cruzi........................................................................................................................ 32
Figure 11: Geographic distribution of positive samples of T. cruzi by sylvatic animal species. .. 33
Figure 12: Geographic distribution of gray fox positive and negative PCR samples ................... 34
Figure 13: Geographical ditibution of skunks with positive and negative results for T. cruzi. .... 35
Figure 14: Geographic distribution of coyotes tested for T. cruzi. ............................................... 36
Figure 15: Geographic distribution of positive samples of Leishmania spp. by sylvatic animal
species. .......................................................................................................................................... 37
Figure 16: Geographic distribution of collected gray fox tested for Leishmania spp. ................. 38
Figure 17: Geographic distribution of Leishmania spp. tested raccoons ...................................... 39

xi
Figure 18: Raccon skin lesion. ...................................................................................................... 39
Figure 19: Geographical distribution of coyotes tested for Leishmania spp. ............................... 41
Figure 21: Difference between species tested positive for Leishmania spp. based on χ2 test ...... 44
Figure 22: Difference between species tested positive for T. cruzi based on χ2 test .................... 44

1
Introduction
According to the Centers for Disease Control and Prevention (CDC) (2013), there are
seventeen diseases considered as Neglected Tropical Diseases (NTD). These are diseases that are
not present in developed countries, but are continuously seen poorer countries. These parasitic
and bacterial diseases are presented in every low income countries and are affected by at least
five of these NTD. A hundred and forty-nine counties are affected by at least one NTD and
individuals are often affected by more than one of these diseases. NTD affects more than one
billion people and kills half a million people around the world every year. Only six out of the
seventeen diseases may be controlled or even eliminated through medicine. These diseases not
only have physical effects, but also create a social stigma. They are disfiguring, debilitating, and
sometimes deadly making it difficult to work and keeping the poor in a poverty cycle (Centers
for Disease Control and Prevention, Neglected Tropical Diseases, 2013).
The World Health Organization (WHO) (2013), estimates three hundred and ten million
people at risk of being infected with leishmaniasis, one million cases of cutaneous leishmaniasis
reported, and three hundred thousand cases of visceral leishmaniasis with twenty thousand
deaths annually around the world. Chagas’ disease affects between six and seven million people
worldwide and are mostly cases in Latin America (WHO, 2013). There have been studies done
around the El Paso County where the vector for Chagas’ disease has been found testing positive
for Trypanosoma cruzi (Buhaya, Galvan, & Maldonado, 2015). This study is based on previous
research by Mariscal et al. (2013) that show positive identification for leishmaniasis and Chagas’
disease in animals. The aim of this study is to identify Leishmania spp. and T. cruzi in tissue

2
samples of sylvatic animals. Based on the previous studies mentioned it is expected to find
positive results for these diseases though DNA amplification methods.

3
Background and Significance
1. Leishmaniasis
Leishmaniasis is considered by the CDC as one of the Neglected Tropical Diseases.
There are about 20 different Leishmaniasis diseases caused by parasites transmitted through the
bite of the female sandflies of the genus Phlebotomus, in the Old World, and Lutzomia, in the
New World. The major forms of Leishmaniasis include visceral (VL), cutaneous (CL), and
mucocutaneous (MCL). VL is the most severe form of Leishmaniasis that almost always fatal if
untreated, and some symptoms include fever, weight loss, splenomegaly, hepatomegaly and
anemia. CL, although not deadly, develops into skins lesions leaving disfiguring scars around the
body, including the face, creating a stigma. Some forms of CL convert into diffused cutaneous
leishmaniasis (DCL) creating several lesions throughout the body (Desdeux, 1996).
According to Alvar et al. (2012) due to the intricate epidemiology and ecology of the
Leishmania spp., Leishmaniasis is the ninth infectious disease causing the most burden, and yet
it is greatly ignored as a priority of tropical diseases. Also, there are not many tools to easily
manage cases or to keep track of the incidence data. An additional complication is the poor
ability of policy makers to recognize the burden Leishmaniasis causes in individuals and their
communities (Alvar et al., 2012)
1.1 Leishmaniasis Worldwide
Estimates collected through the World Health Organization (WHO) between the years
2007 and 2011, estimated 0.2 to 0.4 million cases of VL, and 0.7 to 1.2 million cases of CL
(Alvar et al., 2012). VL is endemic in 88 countries. It is also the most severe form of

4
leishmaniasis and it is listed as one of the most important diseases by the WHO, Tropical
Disease Research. VL is caused by L. infantum, L. donovani and L. chagasi. (Sharma & Singh,
2008). About 90% of VL cases in the world occur in the countries of India, Bangladesh, Sudan,
South Sudan, Ethiopia, and Brazil (Alvar et al., 2012). Worldwide endemicity of VL can be seen
in Figure 1: Geographical Distribution of Visceral Leishmaniasis (WHO, 2013).
Figure 1: Geographical Distribution of Visceral Leishmaniasis (WHO, 2013).
CL cases are found in more areas of the world, and it is estimated that more than 70% of
the cases in the world are found in Afghanistan, Algeria, Colombia, Brazil, Iran, Syria, Ethiopia,
North Sudan, Costa Rica and Peru (Alvar et al., 2012). Data on mortality is scarce and the data
available are mostly of cases reported from hospitals (Alvar et al., 2012). Leishmania mexicana,
a form of CL, can be found in South America, Mexico and the United States (Reithinger et al.,

5
2007). Of the Leishmania spp., 21 have been identified as pathogenic to humans. CL is caused
by L. major, L. tropica, L. mexicana, and L. amazonensis (Sharma & Singh,
2008).Leishmaniasis has 10% case-fatality rate, estimating 20,000 to 40,000 deaths a year (Alvar
et al., 2012). Figure 2 shows the Geographical distribution and endemicity of CL (WHO, 2013).
Figure 2: Geographical Distribution of Cutaneous Leishmaniasis (WHO, 2013)
1.2 Leishmaniasis in the United States and in Texas
Canine cases have been reported in the United States in the states of Texas, Oklahoma,
and Ohio (Kerr, McHugh, & Merkelz, 1999). Woodrats, Neotoma albigula, L. mexicana positive
results using PCR were reported in Arizona (Kerr et al., 1999). Leishmania infantum has also

6
been found in foxhounds that have been naturally infected in parts of Canada and in Virginia in
the U.S. (Rosypal et al., 2003).
Although leishmaniasis is seen every year in the United States among foreign travelers,
immigrants, and in members of the military, it is not seen in people with no travel history outside
the country. However, Texas is considered and endemic area since there have been reports of 30
autochthonous cases in the United States and they are all cases from Texas throughout the south
central area. Nonetheless, in 2010, there were reports of nine autochthonous cases of CL in
northern Texas of patients with no travel history to endemic areas (Wright, Davis, Aftergut,
Parrish, & Cockerell, 2008).
In the years of 1988 and 1992, there were two cases reported in Brown County in Central
Texas. Albany, Shackelford County had another case in November 1994 (Wright et al., 2008).
Texas has had documented nine cases of CL between 2005 and 2007 as shown in Figure 3. The
black circles in the map represent the 30 indigenous cases of cutaneous leishmaniasis (CL)
reported in south-central Texas since 1903. Red circles are 9 cases of CL concentrated in Dallas-
Fort Worth metroplex and surrounding counties (McHugh, Melby, & LaFon, 1996).

7
Figure 3: Geographic distribution of Cutaneous Leishmaniasis cases in Texas
1.3 Life cycle of Leishmania
The Leishmania parasites are found in two developmental stages, promastigote and
amastigote. The promastigote is the proliferative stage and it is found in the mid gut of the
female sandfly. The amastigote is the proliferation stage and it is found inside of mammalian
host cells (Teixeira et al., 2013).
(Teixeira et al., 2013) describe the life cycle of Leishmania spp. beginning by an infected
mammal being bitten by a female sandfly during blood meal and then becomes infected with the
amastigote form of Leishmania. The amastigote is then transformed into procyclic promastigoes
that then multiply in the midgut of the sandfly. Promastigotes transfer to the anterior midgut into
the stomodea valve and cell division is reinitiated transforming into metacyclic promastigotes.

8
The female sandfly will then release the promastigote into a new mammalian host during a blood
meal. These metacyclic promastigotes will infect macrophages to later be transformed into
amastigotes attaching to the parasitophorous vacuole and begin multiplication inside the vacuole.
The large multiplication of amastigotes will cause the cell to burst out and the cycle of
multiplication will repeat (Teixeira et al., 2013). Figure 4 is a graphic representation by the CDC
of the life cycle of the Leishmania spp.
Figure 4: Leishmania spp. Life Cycle
1.4 Vectors and Reservoirs
Leishmaniasis is usually spread through the bite of phlebotomine sandflies. Specie
genetic variation and population separation in sandflies is due to several factors. These include
climate, distance, differences in latitude or altitude, habitat modification such as domestic, peri-

9
domestic, or sylvatic, and other geographical barriers (Pech-May et al., 2013). Lutzomia
diabolica is known to transmit Leishmaniasis to mammals including rodents and humans and it
has been found in south Texas (McHugh, 1991). Lutzomia cruciata ranges from Panama and
Mexico to Texas, Georgia, and Florida in the United States (Pech-May et al., 2013). Sand flies
have a limited flight range of 6 to 10 meters, which allows them to fly on average 100 meters,
but cannot travel more than 1000 meters from their breeding site (Pech-May et al., 2013).
Lutzomia olmeca olmeca has also been identified as a vector for L. mexicana in the U.S. (Sharma
& Singh, 2008).
Neotoma species including, N. micropus, N. albigula, and N. floridiana are known to be
hosts of L. mexicana (McHugh et al., 2003). Predictions by McHugh et al. (1996) reports that L.
mexicana could be found in most of the southern United States, ranging from southern California
to Florida, including the southern regions of Colorado, Utah, Nebraska and North Carolina
(McHugh et al., 1996).
1.5 Clinical aspects of Leishmaniasis and treatment
Clinical manifestations of VL cases include at least two of the following symptoms:
persistent fever of more than 38 °C, hepatosplenomegaly, substantial weight loss, anemia,
leukopenia, and lymph node enlargement. In order to confirm VL, two of three tests need to be
confirmed which include: serology, demonstration of parasite by smear in tissue samples, and/or
molecular techniques (Georgiadou et al., 2015).
Pentavalent antimonials are the main treatment for CL in the New World. The dose range
is 10-20 mg/kg/day for a minimum of 20 days. Due to the higher toxicity of Amphotericin B and

10
pentamidine, these are used only in cases with a contraindication, intolerance or resistance to
antimonials (Pech-May et al., 2013).

11
2. Chagas’ disease
Dr. Joseph Reinhardt Cooper first described the epidemiology and clinical presentation of
the disease known in Portuguese as “mal de engasgo” or “evil of chocking” in the 1850s. He
worked in the cities of Limeria and Campinies, in Sao Paulo where he closely studied cases of
this disease (Meneghelli, De Rezende, Troncon, Madrid, & de Moura, 1997). Carlos Chagas, a
physician in Brazil, discovered the cause of this disease in 1909, when the protozoan parasite,
Trypanosoma cruzi, was identified in a Brazilian child’s blood. This parasite had been
previously reported by Carlos Chagas in the intestine of a triatomine insect in 1908 (Woody &
Woody, 1955). The discovery of Chagas disease was due to the malaria outbreak among workers
of the Central Railway of Brazil. After Dr. Chagas had spent over a year collecting data even
from cases in mountainous regions where malaria is not possible to be found, in the town of
Piropora, he was introduced to the kissing bug. He later dissected this insect finding T. cruzi in
the posterior of the intestine (Chagas, 1922).
2.1 Chagas’ Disease Worldwide
Chagas’ disease is an important public health problem affecting large population sectors
predominantly rural and suburban in Latin America. It is a chronic infection difficult to diagnose,
manage and treat, and plays a major role in the morbidity, mortality, and disability for endemic
regions (Jannin & Salvatella, 2006). Chagas’ disease is transmitted through vectors, during
transplants and transfusions. Endemic growth is also due to low socioeconomic and cultural
levels having a large impact over the health, well-being, and economy of Latin-American
countries (Jannin & Salvatella, 2006). An estimated 12 million Latin Americans are positive for

12
Chagas’ disease, and approximately of 30% of the cases develop cardiomyopathy, which can be
life-threatening (Doyle, Zhou, et al., 2007).
2.2 Chagas’ Disease in the U.S. and in Texas
Chagas disease serious public health concerns given that its vector and reservoirs have
been reported throughout the state of Texas (Sarkar et al., 2010). Having said this, it is a
reportable disease for the states of Arizona and Massachusetts, however it is not for Texas
(Sarkar et al., 2010). Based on Chagas’ seroprevalence and U.S. immigrants, 300,167 people are
estimated to be infected in the United States. Annually, about 30,000 – 45,000 are
cardiomyopathy cases and between 63 and 315 have congenital infections (Rassi & Marin-Neto,
2010). Chagas’ disease is known to be found in countries south of the United States (Jannin &
Salvatella, 2006). Chagas disease is mostly found in the U.S. as a zoonotic disease (Beard et al.,
2003).
The first reported Chagas disease case in the U.S. was in Corpus Christi, Texas in 1955.
This case involved a 10 month old child, who had never left the state since birth and her parents
had not previously been diagnosed with any disease. However, opossums had been seen around
the house and the family had also been having trouble with getting rid of triatomid insects inside
the house (Woody & Woody, 1955). Since then, there have been six other autochthonous human
cases in the U.S. (Buhaya et al., 2015). Figure 5: Geographic distribution of triatomid species,
infected vectors and hosts, and human cases (Hanford, Zhan, Lu, & Giordano, 2007)

13
Figure 5: Geographic distribution of triatomid species, infected vectors and hosts, and human
cases (Hanford, Zhan, Lu, & Giordano, 2007)
Based on the prevalence of Chagas’ disease of immigrant’s country of origin, it is
estimated that 300,000 people living in the U.S. are positive for T. cruzi. However, no large
studies have been made in Latin American populations. Of the few smaller studies made, 985
Latin American immigrant from Los Angeles County were tested and 10 (1%) had positive
serological results. Patients with symptoms with this disease are known to be present, yet they
are not diagnosed with Chagas’ by health care facilities and hospitals in the U.S. Other targeted
studies in hospitals of Los Angeles, provided 15 (16%) positive serological tests for T. cruzi
among 93 patients from Latin America that have been diagnosed with idiopathic cardiomyopathy
(Bern, Kjos, Yabsley, & Montgomery, 2011).
14
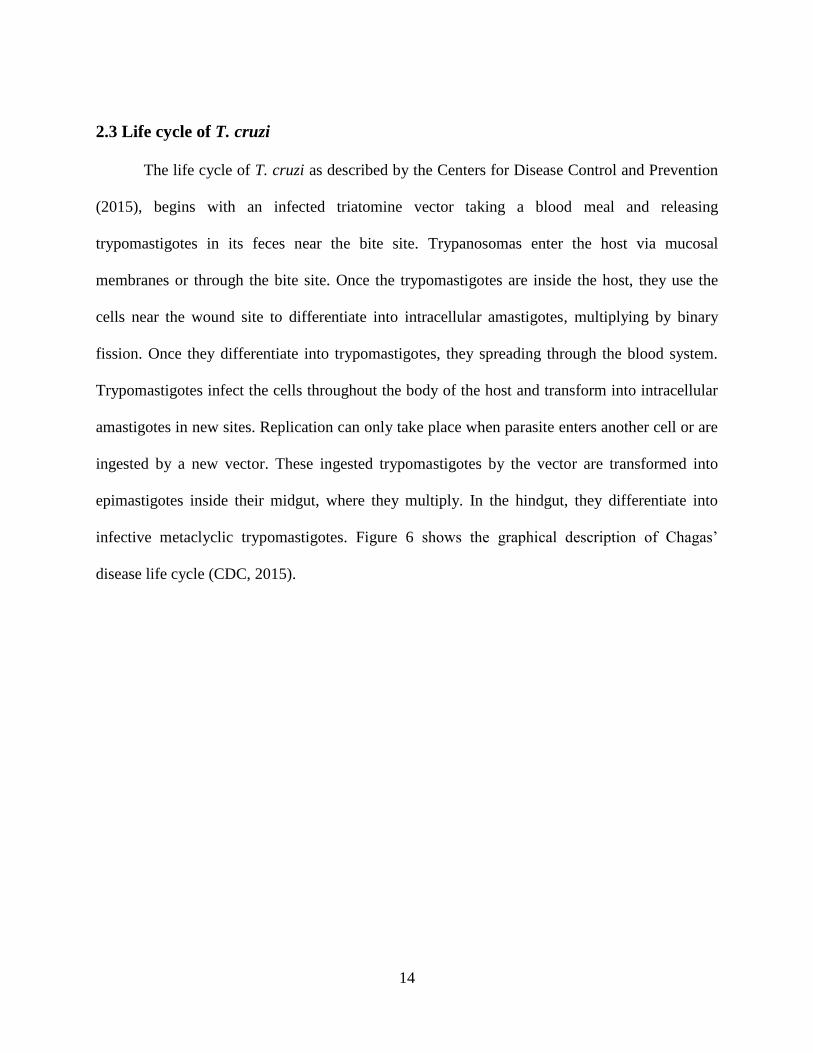
2.3 Life cycle of T. cruzi
The life cycle of T. cruzi as described by the Centers for Disease Control and Prevention
(2015), begins with an infected triatomine vector taking a blood meal and releasing
trypomastigotes in its feces near the bite site. Trypanosomas enter the host via mucosal
membranes or through the bite site. Once the trypomastigotes are inside the host, they use the
cells near the wound site to differentiate into intracellular amastigotes, multiplying by binary
fission. Once they differentiate into trypomastigotes, they spreading through the blood system.
Trypomastigotes infect the cells throughout the body of the host and transform into intracellular
amastigotes in new sites. Replication can only take place when parasite enters another cell or are
ingested by a new vector. These ingested trypomastigotes by the vector are transformed into
epimastigotes inside their midgut, where they multiply. In the hindgut, they differentiate into
infective metaclyclic trypomastigotes. Figure 6 shows the graphical description of Chagas’
disease life cycle (CDC, 2015).

15
Figure 6: Trypanosoma cruzi Life Cycle
2.4 Vector
There is a total of 21 endemic countries for Chagas’ disease caused by the flagellated
protozoan Trypanosoma cruzi, which can be transmitted via vectors, transfusions, congenic, and
several other modes of transmission such as digestive, transplant and laboratory accidents.
However, vector mediated is the main mode of transmission, and it is spread by an infected
triatomine insect also known as “kissing bug”. Table 1 shows the triatomine insects found in
each region in America (Jannin & Salvatella, 2006).

16
Table 1
Main vectors for Chagas’ disease by sub-region
Sub-region Vectors
South America Triatoma infestans
Central America Rhodnius prolixus, Triatoma dimidiata, Rhodnius pallescens
Andean Countries Rhodnius prolixus, Triatoma dimidiate, Rhodnius eduadoriensis
Amazonia Rhodnius robustus, Rhodnius stali, Rhodnius brethesi, Rhodnius
neglectus, Rhodnius pictipes
Mexico Triatoma barberi, Triatoma dimidiata, Triatoma pallidepennis,
Triatoma phyllosoma, Triatoma longipennis, Triatoma mazzottii,
Triatoma picturata, Triatoma mexicana, Triatoma gerstaeckeri
Infected triatomes have been found throughout Arizona and California (Woody &
Woody, 1955). Triatomine insects have also been found in 97 of the 254 counties in Texas, and
in 48 counties T. cruzi infected triatomes have been found. Triatoma gerstaeckeri is the most
common species found, followed by T. sanguisuga and T. lecticularia (Kjos, Snowden, & Olson,
2009). T. gerstaeckeri is a common species found among livestock and is also a pest of houses in
rural areas of Texas. In the north of Mexico this Triatoma species is also considered an important
vector for Chagas’s disease in homes (Bern, Kjos, et al., 2011). T. protracta, T. indictiva, and T.
rubida have been found in El Paso county, however only T. rubida has been found to be T. cruzi
positive (Bern, Kjos, et al., 2011).

17
2.5 Clinical aspects of Chagas’ disease and treatment
Clinical presentations of Chagas depends on the stage of the illness, immune response of
the patient, and if cardiac system is affected (Berkowitz, Raibagkar, Pritt, & Mateen, 2015). Mild
symptoms include skin lesions, fever, malaise, headaches, myalgia, and lymphadenopathy.
Severe symptoms include difficulty when breathing. It has been reported that 10% of the
patients in the acute phase present neurologic complications which include meningoencephalitis,
and neuropathy (Berkowitz et al., 2015). Immunocompromised patients and children are at a
higher risk of developing severe neurologic symptoms. Maternal infection, congenital Chagas, is
characterized by newborn meningoencephalitis, microcephaly, and brain calcifications
(Berkowitz et al., 2015)
Treatment for Chagas’ disease includes benznidazole and nifurimox, which are the only
antitrypanosomal drug treatment approved and that has shown results (Bern, Martin, & Gilman,
2011). During early stages of the Chagas, both drug treatments are able to reduce the symptoms
and shorten the duration of the disease. About 60 to 85% of the patients treated are cured (Bern,
Martin, et al., 2011).

18
3. Study Rationale
Based on a previous publication by Mariscal et al. (2013), 20 sylvatic animals were
collected in the El Paso del Norte Area to test their tissue samples through PCR. Of these
animals, 13 (65%) reported to be positive for Chagas’ disease and 1 (5%) where positive for L.
mexicana.
T. cruzi is also endemic to Texas and wild animals, such as mice and woodrats from the
region have been found to be hosts of both T. cruzi and Leishmania. It has been known for
Leishmania spp. to be autochthonous in Texas. In recent years it has also been found in northern
states of the United States. As previously mentioned these parasites are the causative agents
amongst the most burden causing diseases. As public health professionals, it is important to
determine if Leishmania spp. and T. cruzi is present in El Paso County area in order for people to
be aware of the diseases being in this area and be in the alert when the symptoms to these
diseases are present in a patient. For this reason it is important to educate the population on how
to prevent acquiring the diseases and be in the lookout for these parasites and their vectors and
hosts. It is also important to identify the reservoirs in order to know how to respond in order to
prevent these diseases.
3.1 Specific Aims and Objectives
The aim of this study is to determine if sylvatic animals from El Paso County could be
reservoirs for Leishmania spp. and Trypanosoma cruzi.
The objectives of this study are 1) to identify DNA of Leishmania spp. and T. cruzi in
tissue samples from sylvatic animals such as gray foxes, coyotes, stripped skunks, and raccoons
from El Paso County if they are carriers for Trypanosoma cruzi and/or Leishmania spp. which

19
will create a positive identification of carrier. 2) Map positive results of DNA samples for
Trypanosoma cruzi and/or Leishmania spp. to determine the areas where these parasites are
found.
3.2 Research Question
To determine the prevalence of collected tissue samples from sylvatic animals to be
identified as positive for Trypanosoma cruzi and/or Leishmania spp..

20
4. Methodology
4.1 Study Design
This study is a cross sectional study collecting tissue samples of wild animals for a time
period of 18 months. These samples were collected in an effort to represent the sylvatic animal
population in the County of El Paso.
4.2 Sampling
A convenience sample of sylvatic animals was obtained to measure the frequency of
DNA testing positive for Leishmania spp. and/or Trypanosoma cruzi. Samples were collected for
a period of 18 months. Hearth, spleen, and skin tissue samples were collected from sylvatic
animals around the El Paso County area by the Texas Department of State Health Services
(DSHS), Zoonosis Control and the Animal Services. These tissues have been chosen because of
its relationship to Trypanosoma cruzi and Leishmania spp. T. cruzi can infect all of the tissues of
its mammalian host mainly affecting the heart and digestive system in a chronic manner
(Noireau, Diosque, Jansen, 2009). The spleen plays an important role in the immune system by
producing white blood cells which help fighting infections and also synthesize antibodies.
Because of this, a symptom of individuals with Leishmaniasis is having enlarged lymph nodes,
given that white blood cells are fighting the disease. Given that CL develops skin lesions,
animals will be visually inspected for skin lesions; tissue samples will also be collected from the
area the lesions are present and noted in Table 2: Sample Data sheet.

21
Table 2: Sample Data sheet
Reference # Species Sex GPS Coordinates Comments
4.3 Materials
The following materials were used during the DNA extraction: SNET composed of 10
mM Tris pH 8, 0.1 M EDTA, and 0.5% SDS. SteadyShake 757 Bench top Incubator Shaker by
Amarex Instruments Inc. ® is used during incubation time of the DNA extraction. Vortex-
Genie® is used to evenly mix samples. Centrifuge used is the Beckman Coulter® Allegra X-
15R Refrigerated Bench top Centrifuge. Bench top centrifuge used is the Eppedorf® Centrifuge
5415D with 1.5 ml Eppedorf® tubes. NanoDrop® ND-1000 will be used to determine the DNA
concentration.
Bio-Rad® Thermal Cycler will be used to run the PCRs and primers ordered from New
England Biolabs. Positive samples will be sequenced for validation in the University of Texas at
El Paso Biological Sequencing Laboratory.
4.4 Procedure
4.4.1 Sample Collection
Heart, spleen and skin tissue samples were collected and provided by the Animal
Services of El Paso, through the Texas Department of State Health Services, of the following
sylvatic animals that were collected in El Paso County:
Striped Skunk (Mephitis mephitis)
Gray Fox (Urocyon cinereoargenteus)

22
Raccoon (Procyon lotor)
Coyote (Canis latrans)
This study focuses on the heart, skin, and spleen samples for each specimen along with the
GPS coordinates from where the specimen will be collected in Table 2. Animals were also
examined for any skin lesions and skin samples were taken from the area. All tissue samples
will be preserved in DMSO/EDTA/Salt solution at room temperature.
4.4.2 DNA Extraction
DNA of tissue samples were extracted using 20 µl of proteinase K and 2 mL of SNET.
Mixture was then be incubated overnight in a shaking plate at 55 °C. After incubation period,
equal amount of Phenol:Chloroform:Isoamyl alcohol (25:24:1 v/v) will be added to the sample,
shaked at room temperature for 30 minutes. After incubation period, samples were vortexed and
then centrifuged for 5 minutes at 15,000. A 1:1 ratio of aqueous part extracted from centrifuged
tube and ice cold isopropanol was mixed in 1.5 ml tube. Mixture was centrifuged for 15 minutes
on bench top centrifuge. A pellet formed at the bottom of the tube and supernatant was disposed.
100 µl of 70% ethanol was added to the tube to wash the pellet to remove the residue of
supernatant. The tube with the pellet was left to air dry for 30 minutes and later diluted to 100
ng/µl using nuclease free water.
4.4.3 Primers and PCR
For the PCR, each sample was ran with Trypanosoma cruzi specific primer (TCZ) (Braz
et al., 2008)., Leishmania spp primer (LITS) (El Tai, Osman, El Fari, Presber, & Schönian, 2000)
and IRBP primer to test quality of the DNA extracted (Ferreira, Gontijo, Cruz, Melo, & Silva,

23
2010). 12.5 μL PCR master mix, 1.5 μL DNA template, 1 μL reverse primer, 1 μL forward
primer and 9 μL of nuclease free water to was mixed to end up with a final volume of 25 μL in
each tube. Bio-Rad® Thermal Cycler was used to run the PCRs.
T. cruzi specific primer sequence used has 188 base pairs and is as follows: TCZ sense
F2: 5’ – TGCACTCGGCTGATCGTTTTCGAG – 3’ and TCZ anti-sense B3: 5’–
AGGGTTGTTTGGTGTCCAGTGTGTG–3. Table 3 provides the temperatures and times used
for denaturing, annealing and elongation of the DNA.
Table 3
TCZ PCR Protocol
Cycles Temperature (°C) Time
1 cycle 95° 5 min
40 cycles 95° 1 min
55° 1 min
72° 1 min
1 cycle 75° 5 min
The Leishmania spp. primers for ITS 1 segment has 320 base pairs and are the following:
LITSR (5’- CTGGATVATTTTCCGATG-3’) and LITSV (5’- ACACTCAGGTCTGTAAAAC-
3’). Cycles, temperatures, and time used for these primers are as shown in .
Table 4.

24
Table 4
ITS 1 PCR Protocol
Cycles Temperature (°C) Time
1 cycle 95° 2 min
32 cycles 95° 20 sec
53° 30 sec
72° 1 min
1 cycle 72° 6 min
The following sequence was used as primer to test quality of DNA being extracted: IRBP
FW (5’-TCCAACACCACCACTGAGATCTGGAC-3’) and IRBP RV (5’-
GTGAGGAAGAAATCGGACTGGCC-3’). The temperatures shown in Table 5 Table 5Table 5
IRBP PCR Protocol
Cycles Temperature (°C) Time
1 cycle 94° 3 min
35 cycles 94° 30 sec
57° 30 sec
72° 1 min
1 cycle 72° 10 min
A 1.8% electrophoresis gel was run for 20 minutes at 100 Volts and gel was visualized
under UV light. Figure 7 shows a sample agarose gel showing positive and negative controls for
L. genus, L. mexicana, and T. cruzi (Mariscal, 2013). A bright band is seen under UV light if
samples are positive.

25
Figure 7: Sample agarose gel with PCRs of L. genus, L. mexicana, and T. cruzi positive and
negative controls.
Samples showing positive results for T. cruzi using Tcz1/Tcz2 primers will be also be
verified utilizing primers 121/122 following the protocol shown in Table 6. Primer 121 DNA
sequence is 5’-AAATAATGTACGGGGGAGATGCATGA-3’ and the sequence for 122 is
5’-GGTTCGATTGGGGTTGGTGTAATATA-3’. The fragment size for these primers has 330
base pairs (Fitzwater et al., 2008).
1.8% agarose gels will be run for these samples to compare results in samples that used
the Tcz1/Tcz2 and 121/122 primers. Samples shown to be positive for both of these T. cruzi
primers will be sequenced. PCR samples that show to be positive for Leishmania spp. based on
the agarose gels outcomes will also be sequenced to confirm results.

26
Table 6
121/122 PCR Protocol
Cycles Temperature (°C) Time
1 cycle 94° 3 min
35 cycles 94° 30 sec
57° 30 sec
72° 30 sec
1 cycle 72° 7 min
4.5 Data Analysis
Samples with positive results were mapped based on the GPS coordinates of the location
of where the animal was trapped. Maps will illustrate the distribution of leishmaniasis and
Chagas’ disease in sylvatic animals in El Paso region.
4.6 Project Approval
Approval from The University of Texas at El Paso Institutional Biosafety Committee
(IBC) was required given that our study focused on two pathogens: Leishmania spp. and T. cruzi
(IRBNet Identification Number: 807121-1). The University of Texas at El Paso Institutional
Review Board (IRB) approval was not required since the wild animals for this study were not
captured and killed specifically for this study.

27
5. Expected Results
Based on a previous study by Mariscal et al. (2013), it was expected to identify 65% of
the collected animals to be positive for Trypanosoma cruzi and 5% to be positive for Leishmania
spp.

28
6. Results
A total of 146 samples of skunks, gray foxes, raccoons, coyotes were collected between
May 6, 2014 and November 9, 2015. Animals were catalogued by their species name followed
by a number in the order of when they were collected such as first Gray Fox (Urocyon
cinereoargenteus) UC1 followed by second fox UC2. Given that not all samples gave positive
results for mammalian cells, 32 samples had to be discarded, leaving a total of 114 viable
samples.
Of the 114 samples collected, the total number of positive samples for T. cruzi was 33
(40.24% prevalence), 18 (21.95%) for Leishmania spp. of which 9 (10.98%) samples had both of
these diseases. The collected samples by the specific species is as follows: A total of 24 skunks
samples were analyzed from which 3 (12.50%) were positive samples for T. cruzi and none for
Leishmania spp.. Sample pool for skunks was made up of 15 females and 9 males with only 5
skunks not considered as adults. 37 samples of gray fox were collected from which 6 showed
skin lesions, 12 were youth, and 19 were female. Gray fox had 18 (48.65%) positive samples for
T. %and 4 (10.81%) had both diseases. There were 14 raccoon samples, where 8 were female, 5
had skin lesions, and 6 were youth. Raccoons had 5 (35.71%) samples positive for T. cruzi, 10
(7.43%) for Leishmania spp., and 5 (35.71%) for both. There were 7 collected samples for
coyotes, from which 6 where female, 1 had a skin lesion, and all were adults. Coyotes were
positive in all 7 (100.00%) samples for T. cruzi, 4 (28.57%) for Leishmania spp., with 4
(28.75%) samples positive for both diseases (Table 7).

29
Table 7: Sylvatic animals sample charactristics
Total
Samples
Total
Samples
Leishmania
spp.
positive
T. cruzi
positive
Both
diseases
Skin
lesion
Sex
(Females)
Age<
Adult
Striped
Skunk 30 24 0 (0.00) 3 (12.50) 0 (0.00) 5 15 5
Gray
Fox 40 37 4 (10.81) 18 (48.65) 4 (10.81) 6 19 12
Raccoon 23 14 10 (71.43) 5 (35.71) 5 (35.71) 5 8 6
Coyote 7 7 4 (57.17) 7 (100.00) 4 (57.17) 1 6 0
Total 144 114 25 (21.93) 39 (34.21) 12 (18.42) 17 48 23
( ) Prevalence shown in parenthesis.
6.1 PCR Results
Samples were considered to be viable based on the results of the IRBP primer specific for
mammalian cells that would determine if the DNA extraction was successful and if what is being
seen in the gel are actual samples of the animal tissue samples. Animal sample was considered
viable if any of IRBP PCR showed positive results for at least one of the skin tissues collected,
Figure 8. This gel was positive for T. cruzi in spleen. The 32 samples that were discarded was
because no bands were visible for any of the IRBP PCRs of the tissue samples as shown on the
right of Figure 8. Some gels like the one on the right side bellow were discarded although they
showed positive results for both T. cruzi and Leishmania spp.

30
PCR using primers 121/122 were used on the T. cruzi positive samples using the results
of the TCZ 1/ TCZ2 primers. However, there was not enough T. cruzi DNA to run along with the
samples to be able to compare where the positive bands should be appearing in the gel Figure 9:
Gel using 121/122 primers
Figure 8: Sample positive and negative gel

31
Figure 9: Gel using 121/122 primers
6.2 Geographic Distribution of Samples
Sylvatic animals were collected throughout El Paso County, and coordinates mapped
using Epi Info 7.2 for samples positive for Leishmania spp. or T. cruzi. Mapped coordinates,
show the distribution of animals, where it can be noted that animals where mostly captured in
areas with low populations. Dots with number in map (Figure 10.) represent the number of
samples collected in the area, and dots with no number are of only one animal collected.

32
Figure 10: Distribution of captured sylvatic animals with positive identification for Leishmania
spp. and/or T. cruzi
Figure 11 shows the geographic distribution of positive samples of T. cruzi. by sylvatic
animal species. Although most of the positive samples were found in low populated areas,
several gray fox samples shown to be positive were located in inner areas of the city (red dots)
including the Downtown area. Samples of foxes collected in the same day were both positive for
T. cruzi. Raccoons (blue dots), were found in the West side and far North East of the city. The
raccoons found in the far North East where collected in June and July of 2014. The samples
collected from the West side were from August, 2015. Coyotes (green dots), were mostly found

33
in the West side and in the out skirt of the city on the North East and far East side. There was a
larger array of sylvatic animals on the West side, compared to the rest of the city.
Figure 11: Geographic distribution of positive samples of T. cruzi by sylvatic animal species.
Figure 12 shows the distribution of gray fox comparing negative and positive PCR
samples. Collection sites where evenly distributed throughout the city, showing that not all
animals collected in the same area were positive of T. cruzi. Two samples, collected in two
different days of June, 2015 in the same location were positive. A third sample from the same
location collected in July was considered negative given that it showed negative results for
IRBP, however, TCZ results were positive in both spleen and skin tissue samples.

34
Figure 12: Geographic distribution of gray fox positive and negative PCR samples
Figure 13 shows the distribution of the collected skunks, they were mostly found on the
west side of El Paso, however only one sample was positive in this side of town. Three samples
were collected on the north east side of town near the Franklin Mountains, were two of those
samples were positive for T. cruzi. Two skunks collected on July 24, 2015, near the intersection
of Altura Ave. and Scenic Dr., were of the same litter and were about four to five months old;
only one of these skunks was positive for T. cruzi. No skunks were collected on the East side of
town.

35
Figure 13: Geographical ditibution of skunks with positive and negative results for T. cruzi.
There were 7 coyotes collected and they all tested positive for T. cruzi via PCR. They
were mostly found in areas where there is a low population density, except for the coyote
collected near the intersection of I-10 and US 54 (Figure 14).

36
Figure 14: Geographic distribution of coyotes tested for T. cruzi.
Figure 15 shows the geographical distribution of the 21 sylvatic animals that tested
positive for Leishmania spp. As it can be seen in the map, positive samples were mostly
collected in the outskirts of the city, where there is a low population density. However, the gray
fox, like in the T. cruzi samples, were also collected from inner parts of the city, where samples
were positive for both diseases. Only the gray fox, had positive samples in the Far East side of
the city. Raccoons were positive in both North East and in the West side.

37
Figure 15: Geographic distribution of positive samples of Leishmania spp. by sylvatic animal
species.
Gray foxes were collected throughout the city and although there were some found in
central areas of El Paso, they were mostly found in low populated areas. Four out of the thirty
seven samples collected were positive for Leishmania spp. (Figure 16).

38
Figure 16: Geographic distribution of collected gray fox tested for Leishmania spp.
Figure 17 shows the location of where the raccoons were collected, and it can be seen
that were mostly found in low populated areas. On the west side of the city they were collected
near the Rio Grande. Samples were collected during the months of June through September of
2014 and 2015. Ten out of the twelve tested raccoons tested positive for Leishmania spp. via
PCR. A total of three samples were collected near Zach White, on August 15, September 1st and
September 15, 2015 from which two were considered as positive for Leishmania spp. The
September 1st sample was not considered as positive sample given that it was negative for IRBP;
however, the ITS primer for Leishmania spp. was positive on the skin. Skin lesion was found on
the nipple of the raccoon from where DNA was extracted for PCR Figure 18.

39
Figure 17: Geographic distribution of Leishmania spp. tested raccoons
Figure 18: Raccon skin lesion.

40
Coyotes were mostly found in the outskirts of the city and four out of the seven coyotes
tested for Leishmania spp., four tested positive via PCR (Figure 19). Coyotes were collected
between October 2014 and January 2016; out of the seven, only one was male and they were all
adults. There were no records of lesions for all of the coyotes; however, the four that had
information collected were severely afflicted with sarcoptic mange.

41
Figure 19: Geographical distribution of coyotes tested for Leishmania spp.
6.3 DNA sequencing
Ten samples were chosen from the twenty-nine samples PCR positive for T. cruzi, and
the twenty-one positive samples for Leishmania spp.. Given that there were twelve samples that
were positive for both diseases, another five samples were chosen from those, so the PCR
samples of the same animal were tested for both T. cruzi and Leishmania spp.. All of the samples

42
sequenced for Leishmania spp. tested positive for Leishmania mexicana. The raccoon sample
that was positive for Leishmania spp. in the skin, although it was to be considered as negative
due to negative results in IRBP, was also sequenced and was also positive for Leishmania
mexicana (Table 8)
Table 8: Leishmania spp. CLUSTAL multiple sequence alignment
PL20SK ------------------------------------------------------------
CL1H -------TCATCCATCGCGACACGTTATGTGAGCCGTTATCCACACACGCACCCCCCCSG
CL4SP ----------TCCATCGCGACACGTTATGTGAGCCGTTATCCACACACGCACCCCCCCSG
2H TCCGAAGTCATCCATCGCGACACGTTATGTGAGCCGTTATCCACACACGCACCCCCCCSG
3SK --CCAGATCATCCAKCGCGACACGTTATGTGAGCCGTTATCCACACACGCACCCCCCCGS
PL22SK GATCCAGWCATCCATCGCGACACGTTATGTGAGCCGTTATCCACACACGCACCCCCCCGS
R2H ---CCAGTCATCCATCGCGACACGTTATGTGAGCCGTTATCCACACACGCACCCCCCCGG
CL5SK --------CATCCATCGCGACACGTTATGTGAGCCGTTATCCACACACGCACCCCCCCGS
R8SP --TGCAGTCATCCATCGCGACACGTTATGTGAGCCGTTATCCACACACGCACCCCCCCGS
LMC ------------------------------------------------------------
PL20SK ------------------CGCGCTTGGGGAGGCCTATTCT--------TTCGATAGGCGC
1H CCCCAAAAMCGGAAAACGCSGWWTTGAAACGGGCATTTTTCTCGGCTTTTGTATTTACGC
4SP CCCMAAAAMSGRAAAASGCSGWWTTGAAACGGGMATTTTTCCCGGCTTTTGTTTTTACGC
2H CCCMAAAAMSGRAAAASGCGG-WWTGGAAACGGSMTTTTTTCCCGGCTTTGGWATATCCC
3SK CCCMAAAAMGGRAAAMGSCGK-WWTGGAACGGGSMTTTTTCCCCGGCTTTGGWTATACCC
22SK CCCMAAAAMGGRAAAMGCCGK-WWTGGAACGGGSMTTTTTCCCCGGTTTTGGWTATACCC
R2H CCCMAAAAMGGRAAAMGGCGK-WWTGGAACGGGSMTTTTTCCCCGGCTTTGGWTATACCC
5SK CCCMAAAAMGGRAAACGCCGK-WTTGAAACGGGSATTTTTCCCCGCTTTTGGATATACGC
R8SP CCCMAAAAMGGRAAACGCCGG-WTTGAAACGGGSATTTTTCCCCGGTTTTGGATATACCC
LC -------------------ACTCTCGGGGAGGCCTATTCT--------TTCGATAGGCGC
* * ** * ** * *
T. cruzi PCR samples that showed positive results in the agarose gels, were also positive
in the sequencing results for T. cruzi (Table 9).

43
Table 9: T. cruzi CLUSTAL multiple sequence alignment
6.4 Data analysis
Results were analyzed using chi-squared test in order to compare the significance of
difference between each sylvatic animal species for each of the diseases. The animal species are
ranked in order of significance. The degree of freedom was determined to be 1, meaning the chi-
square result will have to be higher than 3.84 in order for it to be statistically significant (p ≤
0.05). Species are in order of highest to lowest prevalence for each disease (Ott, 1984).
Based on the prevalence and χ2 test, Leishmania spp. had no significant difference
between the two highest prevalence rates Raccoon (71.43) and Coyote (57.17), p > 0.05. There
was also no difference between the Fox (10.81) and the Stripped skunk (0.00), p > 0.05.
However, the difference between the coyote and fox was statistically significant 8.49 ≤ 0.05
(Figure 20).

44
Figure 20: Difference between species tested positive for Leishmania spp. based on χ2 test
The results of the T. cruzi samples showed statistical significant difference between the
coyote (100) and the gray fox (48.65), 6.33 ≤ 0.05. There was no statistical difference between
the gray fox (48.65) and the raccoon (35.71), χ2 = 0.68 > 0.05; or between the raccoon (35.71)
and the skunk (12.50), χ2 = 2.87 > 0.05. However, there was a statistical difference between the
gray fox and the skunk, χ2 = 8.43 ≤ 0.05 (Figure 21).
Figure 21: Difference between species tested positive for T. cruzi based on χ2 test
Coyote Raccoon Gray Fox Skunk
Coyote Gray Fox Raccoon Skunk

45
7. Discussion
Based on the PCRs results, the expected results were different from the final results. The
percentage of positive results of T. cruzi was 40.24% compared to the expected results of 65%.
Leishmania spp. results were also different and much higher than expected with 21.95% of the
samples being positive, compared to the 5% that was expected. It is important to note that
although these are wild animals that are usually in low populated areas, they are also found
throughout the city, which can lead to more easily passing these diseases to other hosts including
humans.
The gray fox, Urocyon cinereoargenteus, was found in all areas of the city, including the
Downtown area, compared to the rest of the animals that were found mostly in low populated
areas close to the Rio Grande, and the Franklin Mountains. The gray fox samples positive for T.
cruzi are relatively higher than reported in other states, with some studies reporting zero cases
from the animals tested (Brown et al., 2010). A study in North Carolina and Virginia, with a total
of 54 gray fox, only had six foxes testing positive for T. cruzi (Rosypal et al., 2010). A study in
central Texas, found eight foxes, out of 58 tested to be positive for T. cruzi (Curtis-Robles,
Lewis, & Hamer, 2016). Leishmania spp. was also reported in one fox of the North Carolina and
Virginia study (Rosypal et al., 2010).
It is also important to take into account the home range of these animals, given that
although some of them were picked up at one location, some of them can travel large distances.
For the coyotes, Canis latrans, males can travel between 30 and 26 km a day and females travel
between 28 and 17 km a day (Lkaundre & Keller, 1981). Having said this, it is not clear where
the coyotes could have picked up either of these diseases. Raccoons, Procyon lotor, are known to

46
live near bodies of water, which may be the reason why they were mostly found near the Rio
Grande. The home range of the raccoons are anywhere between 0.21 km2 and 1.82 km2 (Prange,
Gehrt, & Wiggers, 2004). Raccoons were also found to be positive in ten out of the twelve tested
samples for Leishmania spp., which can be due to Lutzomia spp. also benefiting from the
ecosystem near the Rio Bravo.
All of the collected species that were positive for either Leishmaniasis or Chagas’ disease
were found in the West side of El Paso. This is probably due to the characteristics of the area
given that it is an area where agriculture and farming is practiced. The results retrieved from the
striped skunk are very similar to other studies where the Mephitis mephitis has shown to be
seropositive for T. cruzi in Arizona (9%, N=34) and Georgia (3%, N=3), and the same study
found negative results in California (0%, N=6) (Brown et al., 2010). The home range of the
skunk is of about 1.1 km for females and 1.3 for males meaning that they got infected for both of
these diseases somewhere close to where they were collected (Weissinger, Theimer, Bergman, &
Deliberto, 2009).
Based on the results of the χ2, the sylvatic animals infected with leishmaniasis were
divided in two groups: the skunk and the fox with a high prevalence, and the raccoon and coyote
with a lower prevalence. It was statistically significant the difference between these two groups
(Figure 20: Difference between species tested positive for Leishmania spp. based on χ2 test.
With the results of χ2 on the T. cruzi results, in Figure 21 it can be seen that the sylvatic
animals were divided into three categories: the coyote with the highest prevalence; in the second
category the gray fox with significant difference with the coyote and the skunk, however, no
difference with the raccoon, and in the third group are the raccoon and the skunk with no
significant difference between each other. The difference between these groups could have been

47
due to factors such as the diet and other Leishmania spp. and T. cruzi hosts and vectors present in
this area transmitting the disease.
Studies have shown that consuming food with the parasite can cause infections (Roellig,
Ellis, & Yabsley, 2009). From the four species collected, only the coyotes are primary carnivores
and the consumption of infected prey could be the reason why their prevalence in T. cruzi was so
high. Skunks feed on vegetation but are mainly scavengers, raccoon and gray fox are omnivorous
feeding on other small animals but also fruits and crops (Hall, 2005).
Although a study from central Texas found raccoons to have a prevalence of 70, this
study only showed a prevalence of 35.71 (Curtis-Robles et al., 2016). The coyotes (14.3
prevalence) and foxes (13.8) from the same study in Texas had a much lower prevalence
compared to this study with a prevalence of a 100 and 48.65 respectively. As mentioned before,
the climate in El Paso, Texas, is much different from that in central Texas and the T. cruzi
vectors found in this area are different from other parts of Texas. T. rubida has only been found
to be positive for T. cruzi in two counties of Texas, both in the Western part of Texas including
El Paso County. T. indictiva and T. protracta have also been found in the region although they
have not shown any positive results for T. cruzi. The difference of vectors in this region could be
a reason for the difference in prevalence of the same species tested in both studies.

48
8. Conclusion
It is essential to teach the El Paso population on the signs and symptoms of these
diseases. Having health care providers actively looking for symptoms for leishmaniasis or
Chagas’ disease is important given that some of the symptoms can be easily confused with other
diseases that have cardiomyopathy or lymphadenopathy also as a symptom. Recognizing this
diseases as a possibility will allow the health care provider a better case management and for the
patient to fully recover when they are diagnosed on time. It is also important to teach the
population about the diseases for them to know what to do in case they notice any of the
symptoms. However, prevention is a key factor to avoid these diseases which should be the main
focus of any education efforts made to keep the El Paso community healthy.
Identifying the local hosts of Leishmania spp. and T. cruzi will allow to create targeted
intervention programs tailored to the El Paso county area which will help in the efficiency of
raising awareness. Although the species in this study are wild animals and rarely come in close
contact with people, they do help on maintaining the disease in the area.

49
References
Alvar, Jorge, Vélez, Iván D, Bern, Caryn, Herrero, Mercé, Desjeux, Philippe, Cano, Jorge, . . .
den Boer, Margriet. (2012). Leishmaniasis worldwide and global estimates of its
incidence. PloS one, 7(5), e35671.
Beard, Charles B, Pye, Greg, Steurer, Frank J, Rodriguez, Ray, Campman, Richard, Peterson, A
Townsend, . . . Robinson, Laura E. (2003). Chagas disease in a domestic transmission
cycle, southern Texas, USA. Emerging infectious diseases, 9(1), 103-105.
Berkowitz, Aaron L, Raibagkar, Pooja, Pritt, Bobbi S, & Mateen, Farrah J. (2015). Neurologic
manifestations of the neglected tropical diseases. Journal of the neurological sciences,
349(1), 20-32.
Bern, Caryn, Kjos, Sonia, Yabsley, Michael J, & Montgomery, Susan P. (2011). Trypanosoma
cruzi and Chagas' disease in the United States. Clinical microbiology reviews, 24(4), 655-
681.
Bern, Caryn, Martin, Diana L, & Gilman, Robert H. (2011). Acute and Congenital Chagas.
Chagas Disease, 19.
Brown, Emily L, Roellig, Dawn M, Gompper, Matthew E, Monello, Ryan J, Wenning, Krista M,
Gabriel, Mourad W, & Yabsley, Michael J. (2010). Seroprevalence of Trypanosoma cruzi
among eleven potential reservoir species from six states across the southern United
States. Vector-Borne and Zoonotic Diseases, 10(8), 757-763.
Buhaya, Munir H, Galvan, Steven, & Maldonado, Rosa A. (2015). Incidence of Trypanosoma
cruzi infection in triatomines collected at Indio Mountains Research Station. Acta
tropica, 150, 97-99.
Chagas, Carlos. (1922). The Discovery of Trypanosoma Cruzi and of American
Trypanosomiasis: historic retrospect. Memórias do Instituto Oswaldo Cruz, 15(1), 67-76.
Curtis-Robles, Rachel, Lewis, Barbara C, & Hamer, Sarah A. (2016). High Trypanosoma cruzi
infection prevalence associated with minimal cardiac pathology among wild carnivores in
central Texas. International Journal for Parasitology: Parasites and Wildlife, 5(2), 117-
123.
Georgiadou, Sarah P, Stefos, Aggelos, Spanakos, Gregory, Skrimpas, Stergios, Makaritsis,
Konstantinos, Sipsas, Nikolaos V, & Dalekos, George N. (2015). Current clinical,
laboratory, and treatment outcome characteristics of visceral leishmaniasis: results from a
seven-year retrospective study in Greece. International Journal of Infectious Diseases,
34, 46-50.
Hall, S. (2005) Texas Wildlife Identification Guide: A guide to fame animals, game birds,
furbearers and other wild life of Texas. Texas Parks and Wildlife.
https://tpwd.texas.gov/publications/pwdpubs/media/pwd_bk_k0700_0517.pdf
Hanford, Elaine Jennifer, Zhan, F Benjamin, Lu, Yongmei, & Giordano, Alberto. (2007). Chagas
disease in Texas: recognizing the significance and implications of evidence in the
literature. Social science & medicine, 65(1), 60-79.
Jannin, Jean, & Salvatella, Roberto. (2006). Estimación cuantitativa de la enfermedad de Chagas
en las Américas Estimación cuantitativa de la enfermedad de Chagas en las Américas:
Organización Panamericana de la Salud.

50
Kerr, Sara F, McHugh, Chad P, & Merkelz, Robert. (1999). Short report: a focus of Leishmania
mexicana near Tucson, Arizona. The American journal of tropical medicine and hygiene,
61(3), 378-379.
Kjos, Sonia A, Snowden, Karen F, & Olson, Jimmy K. (2009). Biogeography and Trypanosoma
cruzi infection prevalence of Chagas disease vectors in Texas, USA. Vector-Borne and
Zoonotic Diseases, 9(1), 41-50.
Lkaundre, John W, & Keller, Barry L. (1981). Home-range use by coyotes in Idaho. Animal
Behaviour, 29(2), 449-461.
Mariscal, Jacqueline. (2013). Potential for sylvatic mammals and stray canines in transmission of
leishmaniasis and Trypanosoma cruzi in Paso del Norte border area.
McHugh, Chad P. (1991). Distributional records for some North American sand flies, Lutzomyia
(Diptera: Psychodidae). Entomol News, 102, 192-194.
McHugh, Chad P, Melby, Peter C, & LaFon, Sandra G. (1996). Leishmaniasis in Texas:
epidemiology and clinical aspects of human cases. The American journal of tropical
medicine and hygiene, 55(5), 547-555.
McHugh, Chad P, Thies, Monte L, Melby, Peter C, YANTIS, LOUDON D, Raymond, Russell
W, Villegas, Maria D, & Kerr, Sara F. (2003). Short report: a disseminated infection of
Leishmania mexicana in an eastern woodrat, Neotoma floridana, collected in Texas. The
American journal of tropical medicine and hygiene, 69(5), 470-472.
Meneghelli, UG, De Rezende, JM, Troncon, LE, Madrid, N, & de Moura, ML. (1997). [A
missing name in the history of chagasic megaesophagus: Joseph Cooper Reinhardt
(1809/10-1873)]. Arquivos de gastroenterologia, 35(1), 1-8.
Ott, L. (1984). Introduction to the analysis of variance. An introduction to statistical methods and
data analysis, 325-360.
Pech-May, Angélica, Marina, Carlos F, Vázquez-Domínguez, Ella, Berzunza-Cruz, Miriam,
Rebollar-Téllez, Eduardo A, Narváez-Zapata, José A, . . . Becker, Ingeborg. (2013).
Genetic structure and divergence in populations of Lutzomyia cruciata, a phlebotomine
sand fly (Diptera: Psychodidae) vector of Leishmania mexicana in southeastern Mexico.
Infection, Genetics and Evolution, 16, 254-262.
Prange, Suzanne, Gehrt, Stanley D, & Wiggers, Ernie P. (2004). Influences of anthropogenic
resources on raccoon (Procyon lotor) movements and spatial distribution. Journal of
Mammalogy, 85(3), 483-490.
Rassi, Anis, & Marin-Neto, José Antonio. (2010). Chagas disease. The Lancet, 375(9723), 1388-
1402.
Reithinger, Richard, Dujardin, Jean-Claude, Louzir, Hechmi, Pirmez, Claude, Alexander, Bruce,
& Brooker, Simon. (2007). Cutaneous leishmaniasis. The Lancet infectious diseases,
7(9), 581-596.
Roellig, Dawn M, Ellis, Angela E, & Yabsley, Michael J. (2009). Oral transmission of
Trypanosoma cruzi with opposing evidence for the theory of carnivory. Journal of
Parasitology, 95(2), 360-364.
Rosypal, Alexa C, Tripp, Shanesha, Lewis, Samantha, Francis, Joy, Stoskopf, Michael K,
Larsen, R Scott, & Lindsay, David S. (2010). Survey of antibodies to Trypanosoma cruzi
and Leishmania spp. in gray and red fox populations from North Carolina and Virginia.
Journal of Parasitology, 96(6), 1230-1231.

51
Rosypal, Alexa C, Troy, Gregory C, Zajac, Anne M, DUNCAN, ROBERT B, Waki, Kayoko,
CHANG, K‐P, & LINDSAY, DAVID S. (2003). Emergence of zoonotic canine
leishmaniasis in the United States: Isolation and immunohistochemical detection of
Leishmania infantum from foxhounds from Virginia. Journal of Eukaryotic
Microbiology, 50(s1), 691-693.
Sarkar, Sahotra, Strutz, Stavana E, Frank, David M, Rivaldi, Chissa–Louise, Sissel, Blake, &
Sánchez–Cordero, Victor. (2010). Chagas disease risk in Texas. PLoS Negl Trop Dis,
4(10), e836.
Sharma, Umakant, & Singh, Sarman. (2008). Insect vectors of Leishmania: distribution,
physiology and their control. J Vector Borne Dis, 45(4), 255-272.
Teixeira, Dirceu E, Benchimol, Marlene, Rodrigues, Juliany CF, Crepaldi, Paulo H, Pimenta,
Paulo FP, & de Souza, Wanderley. (2013). The Cell Biology of Leishmania: How to
Teach Using Animations. PLoS pathogens, 9(10), e1003594.
Weissinger, Mark D, Theimer, Tad C, Bergman, David L, & Deliberto, Thomas J. (2009).
Nightly and seasonal movements, seasonal home range, and focal location photo-
monitoring of urban striped skunks (Mephitis mephitis): implications for rabies
transmission. Journal of wildlife diseases, 45(2), 388-397.
Woody, Norman C, & Woody, Hannah B. (1955). American Trypanosomiasis (Chagas'
Disease): First Indigenous Case in The United States. Journal of the American Medical
Association, 159(7), 676-677.
Wright, Natalie A, Davis, Lance E, Aftergut, Kent S, Parrish, Charles A, & Cockerell, Clay J.
(2008). Cutaneous leishmaniasis in Texas: a northern spread of endemic areas. Journal of
the American Academy of Dermatology, 58(4), 650-652.

52
9. Vitae
Mariel Matamoros has a B.S. in Microbiology with a minor in Chemistry from The
University of Texas at El Paso. She began her Masters’ in Public Health in 2013 where she also
began her research in Leishmania and Chagas’ disease. In the summer of 2014 she visited
Ecuador where she attended Symposium of Tropical Diseases and a workshop on Leishmaniasis.
Being that this county is endemic for the disease she was able to see the physical and
psychological effects of the disease on people.
Besides doing laboratory research, she is also doing an internship with the City of El Paso
Department of Public Health in the Public Health Preparedness Program. She is the Coordinator
for the Radiation Response Volunteer Program, a program funded by the Conference of
Radiation Control Program Directors (CRCPD). Since its inception in 2014, Mariel has assisted
in the implementation of the project’s objectives, including conducting community outreach,
recruiting radiation professionals, coordinating recruitment and volunteer training with the West
Texas Medical Reserve Corp, and exercising the newly developed Community Reception Center
plan. For her efforts in the community along with the work of her coworkers, she was awarded
with the honor of being part of the 2016 Pillars of Public Health by El Paso Department of Public
Health.