identification of geomorphic signatures of active tectonics in the … · identification of...
TRANSCRIPT

INTERNATIONAL JOURNAL OF GEOMATICS AND GEOSCIENCES
Volume 4, No 1, 2013
© Copyright by the authors - Licensee IPA- Under Creative Commons license 3.0
Research article ISSN 0976 – 4380
Submitted on June 2013 published on August 2013 164
Identification of geomorphic signatures of active tectonics in the West
Lidder Watershed, Kashmir Himalayas: Using Remote Sensing and GIS Bhat F. A. 1, Bhat I. M. 1, Hamid Sana2, Mohd Iqbal3, Akhtar R. Mir1
1- Department of Earth Sciences, University of Kashmir.
2- Department of Geology & Geophysics, IIT, Kharagpur
3-.Department of Geography, Jamia Milia Islamia University.
ABSTRACT
Different geomorphic indices like Hypsometric Integral (Hi), Basin Elongation Ratio (Eb),
Drainage Basin Asymmetry (AF), Longitudinal River Profile, Transverse profile, Stream
Gradient Index (SL), for the west Lidder watershed which lies to the South east of the Kashmir
valley together with development of knick zones and unpaired terraces as interpreted from the
satellite imagery and digital elevation model (DEM) and extensive field work suggest the area
to be tectonically active. Use of geographic information (GIS) in calculation of geomorphic
indices was instrumental and helped in the identification of a fault in the watershed which could
be traced for several kilometers across the river Lidder.
Keywords: Geomorphic Indicies, Active Tectonics, DEM, Knick Zones, Lidder Basin.
1. Introduction
Geomorphic indices are useful tools in evaluating tectonic activity in any area. Tectonics plays
a very important role in the morphological evolution of any drainage basin and is well
reflected by structural, fluvial and morphotectonic parameters. Analysis of active tectonics
depends upon the use of geomorphic indices, which are sensitive to rock resistance,
climatic changes and tectonic processes resulting into landscape evolution. The information
about tectonic history of an area can be retrieved by quantification of different
morphotectonic indices, after obtaining the necessary information from topographic maps,
aerial photographs and satellite data (Keller, 1986). An integrated multi-disciplinary
approach using geomorphological, structural and neo-tectonism is very useful in evaluation
of active tectonics (Wells et al., 1988). Remote sensing plays a significant role in providing
spatial information needed for computation of these indices. The image interpretation
techniques are less time consuming than the conventional ground surveys, which if
coupled with limited field checks yield valuable information. Systematic observation and
analysis of remotely sensed data helps in quick identification and delineation of landforms,
structural features and drainage characteristics. Significant improvement in resolution of
satellite data and advancement in computing resources has enabled the investigators to
carry out quantitative and more precise analysis of geo-spatial data. Many workers have
carried out morphotectonic analysis using remote sensing and GIS techniques. Cuong and
Zuchiewicz (2001) studied the morphotectonic properties of Lo River fault near Tam Do in
North Vietnam. Raj et al. (2003) applied morphotectonic analysis to substantiate the field
observation on active tectonics. Verrios et al. (2004) carried out morphotectonic analysis in
Eliki fault zone to correlate active tectonics and erosional processes using topographic maps
and aerial photographs. Jain and Verma (2006) using remote sensing and GIS integrated
geomorphology, slope, vegetation index and morphotectonic information to assess

Identification of geomorphic signatures of active tectonics in the West Lidder Watershed, Kashmir
Himalayas: Using Remote Sensing and GIS
Bhat F. A.
International Journal of Geomatics and Geosciences
Volume 4 Issue 1, 2013 165
neotectonic potential in Bundi-Indergarh sector of Rajasthan. In the present study an attempt
has been made to evaluate the geomorphic indicators of active tectonics in West Lidder
watershed through remote sensing and GIS approach.
2. Study area
The present study aims study the tectonic geomorphology of the west Lidder catchment of the
Lidder watershed. The West Lidder is the western part of the Lidder valley, western himalayas,
that occupies the south eastern part of the Kashmir Himalaya .The study area (Figure 1) lies
between 3400’N - 34015’N latitude and 750 07’10”E - 750 23’20”Elongitude. The area is
covered in the Survey of India toposheet Nos. 43 N/4 and 43 N/8 and has a catchment area of
410 Km2. The altitude of the study area varies from2210 to 5425meters above mean sea level.
The West Lidder drains a large area in upper reaches of the valley. The West Lidder flows for
a maximum length of about 35Km before its merges with the East Lidder at famous tourist spot
Pahalgam. The study area reveals a variegated topography due to the combined action of
glaciers and rivers. The study area is characterized by sub- Mediterranean type of climate with
nearly 70 per cent of its annual precipitation concentrated in winter and spring months (Meher-
1971).
Figure 1: Study area
2.1 Geology and Geomorphology of West Lidder
Geomorphology is the study of the nature, origin and evolution of the landscape, focusing on
physical, chemical and biological processes that produce or modify landforms. Landforms, the
collection of which constitutes the landscape, includes mountains, plateaus, hills, alluvial fans,
canyons, gorges, terraces, slopes, sand dunes, gullies, moraines, river bars etc. Landform
development depends on the underlying geological structure of the earth. In geomorphology,
structure is broadly defined to include rock and soil types, nature and abundance of fractures in
the rocks and faults and folds. The development Landforms depends on the nature of surficial
and geological processes, including weathering (physical and chemical), fluvial (streams and
rivers), glacial, eolian (wind), mass wasting (including slope failures, landslides, mudflow and
earth flow), tectonic (plate motion, faulting, folding, tilting, uplift and subsidence and volcanic

Identification of geomorphic signatures of active tectonics in the West Lidder Watershed, Kashmir
Himalayas: Using Remote Sensing and GIS
Bhat F. A.
International Journal of Geomatics and Geosciences
Volume 4 Issue 1, 2013 166
(Keller and Pinter-2002). The landscape of the Lidder Valley is polygenetic in nature,
composed of elements produced by glacial, fluvio-glacial and structural agents. However the
more prominent processes of landform development are glacial and fluvial. Based on the
geomorphic / surfacial processes, the West Lidder landforms are mainly grouped into two
1. Glacial geomorphological features
2. Fluvial geomorphological features.
Glacial geomorphic landforms are produced by the glacial and fluvio-glacial processes. These
landforms are intimately related to the total mass budget of the glacier system. Glacier produces
landforms by glacial erosion, transportation or deposition that vary at different sites of the study
area due to variation in altitude, lithology of glacial bed, thickened of ice and its fluctuation in
mass balance. The glacial erosion features present in the study area are the striations on the
limestones (Plate-Ia), whaleback, Roche Moutonnees and glaciated valleys (U-shaped valleys).
The more important of the glacial transportation features are the erratic boulders andtures
pebbles. The geomorphological features of glacial deposition are the Moraines (Plate-Ib).
.
Plate I: Geomorphological features in the study area
Fluvial geomorphological landforms are produced by fluvial process. The long stretch of the
West Lidder from the source at Kolahoi Glacier to its merger with the East Lidder at Nunwun
is constituted a fluvio-glacial landscape. The fluvial landforms present in the study area are
mainly gorges and terraces. The gorge at Kalwan known as Kalwan gorge carved through the
thick formations of volcanics, limestones and calcareous sandstones is about 3-4 Km long, 100-
150mts deepp. This gorge is the fluvial erosion feature. Another fluvial feature is the terrace.
The study area is mostly characterized by the depositional terraces. The terraces are found
between Mundlun and Aru along the West Lidder and are also found at Nunwun. The terraces
found in the study area and in the surroundings are mostly un- paired (Kaul. M. N., 1994).
In addition to above morphological landforms present in the study area there are also presence
of mass-wasting (land sliding) between Nunwun to Aru along Pahalgam-Aru road (Plate-IIa).
The sliding material commonly found is the mixture of boulders, gravels, clay and silt overlying
on the inclined limestone beds (Plate-IIb).
.

Identification of geomorphic signatures of active tectonics in the West Lidder Watershed, Kashmir
Himalayas: Using Remote Sensing and GIS
Bhat F. A.
International Journal of Geomatics and Geosciences
Volume 4 Issue 1, 2013 167
Plate II: Geomorphological features in the study area
The rough terrain, inclined limestone bedding, deep gorges, unpaired terraces, land sliding and
a general youthful topography are indicative of tectonic disturbances. According to Keller
(1986) the more pristine or fresh appearing the landform is, the younger the tectonic is assumed
to be.
The lithological formations of the West Lidder area range from Devonian to Triassic with
Recent formations along the rivers and glaciers of the Lidder valley. The pioneer work on the
geology of the study area was contributed by Middlemiss in 1910, besides Gupta classified the
stratigraphic sequence of rocks of the area on the basis of the fossils. The lithological map of
the study area is shown in figure 2.
Figure 2: Lithological map of the study area.
The detailed grouping of the rock sequences has been made on the basis of the principal rocks
with reference to the specific rocks formations produced by Middlemiss and others. Each group
has a distinctive depositional environment in the evolution of the Lidder valley basin in which
these rocks were deposited and their relative competence for erosion. The geological succession
and Rock formation of the West lidder valley (after Middlemiss, 1910 and Gupta, 1973) is
shown in table

Identification of geomorphic signatures of active tectonics in the West Lidder Watershed, Kashmir
Himalayas: Using Remote Sensing and GIS
Bhat F. A.
International Journal of Geomatics and Geosciences
Volume 4 Issue 1, 2013 168
Table 1: Lithological succession of the study area valley (after Middlemiss, 1910 and Gupta,
1973)
Rock Group Rock Formation Lithological
characteristics
Age
Glacial and Fluvial
Alluvium
Recent alluvium
Older alluvium
Recent
Pleistocene
Limestone Group Lidderwat-Zaijpal
formation
Limestone & Slate
Shale & thinly bedded
limestone
U-Triassic
L-Triassic
Sandstone-Shale
Group
Zewan Formation Calcareous sandstone,
Fossiliferous Shale,
Limestone
L-Triassic
Classic volcanic Panjal Volcanic Basalt and Andesite Permocarboniferous
Outer Volcanic
Group
Agglomeratic Slate
Fenestella Shale
Slate & Quartzite
Shales& Quartzite
U-Carboniferous
M-Carboniferous
OrthoQuartzite-
Carbonate Group
Syrigothyris
Limestone
Muth-Quartzite
Limestone
Quartzite & Sandstone
L-Carboniferous
Devonian
3. Methodology
The present study was carried out in order to find the active tectonics of the west Lidder
catchment of the lidder watershed. The main objective of the study was fulfilled by computing
the geomorphic indices by using remote sensing and GIS techniques. The study used ASTER
and Landsat data and GIS interpretive techniques to analyze and calculate these indices. The
inputs employed into the study were extracted from 1:50,000-scaled base maps and ASTER
digital elevation models using Arc-GIS 9.3. Using these materials and methods the following
geomorphic indices: River sourse elevation[Zo (m)], River mouth Elevation [Zn (m)], total
Length of the river [ L (Km)], Sub-watershed area (km2), Hypsometric Integral (Hi), Basin
Elongation Ratio (Eb), Drainage Basin Asymmetry (AF), Longitudinal River Profile,
Transverse profile, Stream Gradient Index (SL), were calculated to access the tectonic
geomorphology of the study area.
4. Results and discussion
Morphotectonic analysis by the use of geomorphic indices serves as a tool of recognition in
regions with active tectonic deformation. Landforms in active deformation area are created
from interaction of tectonic and surfacial processes. One of the most important landforms in
ground is rivers that are very sensitive to tectonic movements especially uplift and tilting. Thus
based on analysis of the rivers and related drainage networks by the use of geomorphic indices
one is able to attain valuable information about tectonic history of the area (Toudeshki and
Arian, 2011). Morphotectonic analysis by the use of geomorphic indices has been developed
as basic reconnaissance tools to identify areas experiencing rapid tectonic deformation (Bull
and McFadden, 1977; Keller and Pinter, 1996). It is impossible to quantify the tectonic impact
on any drainage sub-watershed by any single geomorphic parameter. However, a group of
parameters with their assessment relative to one another allows one to address the issue
successfully and identify particular characteristics of a drainage sub-watershed, its vulnerability
to tectonic deformation and level of tectonic activity (Keller, 1986; Keller and Pinter, 1996;

Identification of geomorphic signatures of active tectonics in the West Lidder Watershed, Kashmir
Himalayas: Using Remote Sensing and GIS
Bhat F. A.
International Journal of Geomatics and Geosciences
Volume 4 Issue 1, 2013 169
Demoulin, 1998). Various several geomorphic indices computed (Table 2) for the West Lidder
sub-watershed are described and interpreted below.
Table 2: Geomorphic indices of the West Lidder drainage sub-watershed.
4.1 Hypsometric Integral (Hi)
Area elevation analysis or hypsometry is a powerful tool for differentiating tectonically active
regions from inactive ones. The hypsometric integral (Hi) is a quantitative measure of the
degree of dissection of a drainage basin at regional or local scale and can be calculated using
the equation 1 (Pike and Wilson, 1972):
Hi = (hmean – hmin) / (hmax – hmin) (1)
Where Hi is the hypsometric integral, and hmax, hmin and hmean are the maximum, the minimum,
and the mean elevation respectively. The values of Hypsometric integral are important elements
in the analysis of landscape and can be easily obtained from topographic maps or by using
Digital Elevation Models (DEM) (Pike and Wilson, 1972). High values of hypsometric integral
indicate that most of the topography is high relative to the mean, such as smooth upland surface
cut by deeply incised streams. Intermediate to low value of the integral reflect exposure of the
terrain to extensive and long term erosion, associated with more evenly dissected drainage
basins. It can therefore be expected that younger stages of basin development are associated
with higher values of hypsometric integral and the older basins will have lower values and
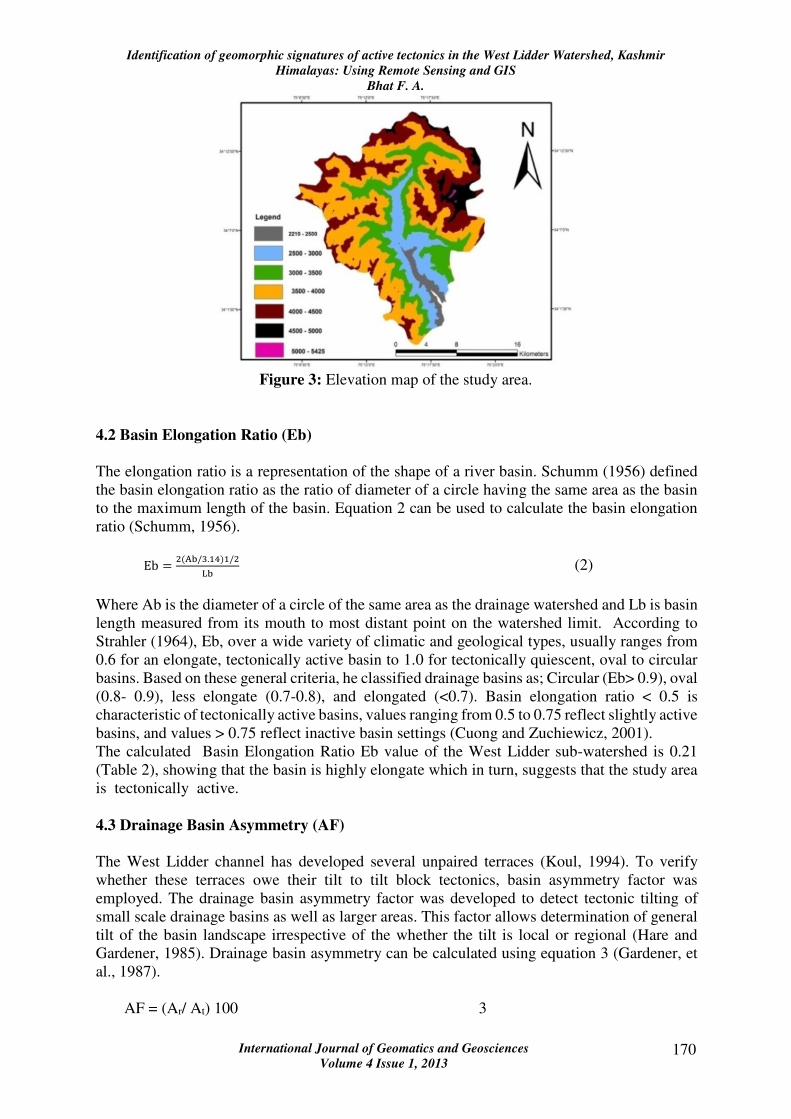
could be expected towards their maturity. The elevation map of the study area is shown in figure
3.
The calculated hypsometric integral value for the West Lidder sub-watershed is 0.51 (Table 2),
which is on the higher side indicating that the area is in youthful stage, high topography and
incised streams thus suggesting that the area is tectonically active.
S No. Geomorphic Indices Value Remarks
1. Sub-watershed area (km2) 410 Total area of the sub-watershed
2. Length (Km) L
28 The maximum sub-watershed length
3. Zo (m)
5425 River source elevation
4. Zn (m) 2150 River mouth elevation
5. Relief Ratio
3275 Elevation difference between Zo–Zn
6. Drainage basin asymmetry (AF)
63 It shows nature of tilt of the sub-
watershed
7. Basin elongation ratio (Re)
0.21 It reflects that sub-watershed is elongate
8. Hypsometric integral (Hi) 0.51 It identifies youthful landscape.
10. longitudinal River profile ---- ----
11. Transverse river profile ---- ----
Identification of geomorphic signatures of active tectonics in the West Lidder Watershed, Kashmir
Himalayas: Using Remote Sensing and GIS
Bhat F. A.
International Journal of Geomatics and Geosciences
Volume 4 Issue 1, 2013 170
Figure 3: Elevation map of the study area.
4.2 Basin Elongation Ratio (Eb)
The elongation ratio is a representation of the shape of a river basin. Schumm (1956) defined
the basin elongation ratio as the ratio of diameter of a circle having the same area as the basin
to the maximum length of the basin. Equation 2 can be used to calculate the basin elongation
ratio (Schumm, 1956).
Eb =�(��/.��)�/�
�� (2)
Where Ab is the diameter of a circle of the same area as the drainage watershed and Lb is basin
length measured from its mouth to most distant point on the watershed limit. According to
Strahler (1964), Eb, over a wide variety of climatic and geological types, usually ranges from
0.6 for an elongate, tectonically active basin to 1.0 for tectonically quiescent, oval to circular
basins. Based on these general criteria, he classified drainage basins as; Circular (Eb> 0.9), oval
(0.8- 0.9), less elongate (0.7-0.8), and elongated (<0.7). Basin elongation ratio < 0.5 is
characteristic of tectonically active basins, values ranging from 0.5 to 0.75 reflect slightly active
basins, and values > 0.75 reflect inactive basin settings (Cuong and Zuchiewicz, 2001).
The calculated Basin Elongation Ratio Eb value of the West Lidder sub-watershed is 0.21
(Table 2), showing that the basin is highly elongate which in turn, suggests that the study area
is tectonically active.
4.3 Drainage Basin Asymmetry (AF)
The West Lidder channel has developed several unpaired terraces (Koul, 1994). To verify
whether these terraces owe their tilt to tilt block tectonics, basin asymmetry factor was
employed. The drainage basin asymmetry factor was developed to detect tectonic tilting of
small scale drainage basins as well as larger areas. This factor allows determination of general
tilt of the basin landscape irrespective of the whether the tilt is local or regional (Hare and
Gardener, 1985). Drainage basin asymmetry can be calculated using equation 3 (Gardener, et
al., 1987).
AF = (Ar/ At) 100 3

Identification of geomorphic signatures of active tectonics in the West Lidder Watershed, Kashmir
Himalayas: Using Remote Sensing and GIS
Bhat F. A.
International Journal of Geomatics and Geosciences
Volume 4 Issue 1, 2013 171
Where AF is asymmetry factor, Ar is drainage area on the downstream right of the main
drainage line and At is the total drainage area.
When the AF is greater than 50; the main channel has shifted towards the downstream left side
of the drainage basin and if AF is less than 50; the channel has shifted towards the downstream
right side of the drainage basin (Hare and Gardener, 1985).
Following Strahler’s (1957) stream ordering scheme, the AF for the West Lidder sub-watershed
was extracted for the West Lidder of 6th order and a value of 63 was obtained (Table 2). The
drainage basin asymmetry of the study area is shown the figure 4. The calculated value of AF
is 63 which indicate that the West Lidder has shifted downstream left of the West Lidder
drainage sub-watershed giving rise to unpaired terraces and suggesting the tectonic activity in
the area. The observations were also reported by Koul (1994).
.
Figure 4: Drainage basin asymmetry of the study area
4.4 Longitudinal River Profile
A longitudinal river profile is a plot of a river or stream length with respect to river or stream
elevation above mean sea level. It represents channel gradient of the river from its source to
mouth. Hovius (2000) observed that the longitudinal river profiles have the following
characteristic features
1. They decrease in gradient monotonically
2. They are concave- up with occasional local convexities, and
3. Except for nick points they have smooth curve over length scales of kilometers.
Longitudinal profiles of alluvial channels and many bedrock channels or mixed bedrock-
alluvial channels typically are concave-up, a shape equated with equilibrium profile, where
driving force is equivalent to resisting force (Mackin, 1948).However, when a river passes
through zones of active tectonics (subsidence or upliftment), its profile shows the effects of
deformation. Therefore, longitudinal profile and its corresponding concavity and steepness are
used to characterize tectonics and base level fall.
The longitudinal profile of West Lidder is shown in figure 5. The longitudinal profile deviates
from a simple concave-up form. The most marked feature of the profile is the convex-up

Identification of geomorphic signatures of active tectonics in the West Lidder Watershed, Kashmir
Himalayas: Using Remote Sensing and GIS
Bhat F. A.
International Journal of Geomatics and Geosciences
Volume 4 Issue 1, 2013 172
segment or knick zone developed between 2400 – 2800m contour values. Within this section
i.e. between 2400-2800m elevations above mean sea level the bed rock lithology is
homogeneous suggesting that lithology has no active role in developing the knick zone. The
other and only explanation to this phenomenon is the influence of tectonics on the west Lidder
sub-watershed.
Figure 5: Longitudinal profile of West Lidder.
4.5 Transverse profile
The longitudinal and transverse profiles play different roles in determining sub-watershed
topography, and the overall longitudinal slope exerts a major influence on the mean sub-
watershed slope. The discontinuity of the longitudinal and transverse profiles, however, tends
to occur at the same location, which may reflect the occurrence of knick zones and their
influences on the development of valley-side slopes. The transverse profile of the river gives
an indication of valley incision versus valley width which in turn suggests the tectonic activity
in the area. Figure 6 shows the transverse profile of west lidder at different place. It is clear
from the profiles that the west lidder stream has not been uniform in its valley development;
rather there are certain deep gorges which indicate prominent downcutting one such example
is the Kalwan gorge figure (6f). The deep gorges in the rivers may arise due to many reasons
such as alternating occurrences of hard and soft rocks along the river bed or recent subsidence
or upliftment of the basin due to tectonic activity. The Kalwan gorge may be the result of recent
tectonic as the lithology is homogeneous throughout the gorge.
Figure 6: Transverse Profile of West Lidder at different locations
4.6 Stream Gradient Index (SL)

Identification of geomorphic signatures of active tectonics in the West Lidder Watershed, Kashmir
Himalayas: Using Remote Sensing and GIS
Bhat F. A.
International Journal of Geomatics and Geosciences
Volume 4 Issue 1, 2013 173
Stream gradient index (SL) reflects relationship among stream power, rock resistance and
tectonics (Hack, 1973). SL is a useful parameter to evaluate if change in stream slope is due to
rock resistance or tectonic deformation in particular, if it has a vertical component (Keller and
Pinter, 2002). The stream gradient index can be calculated by using equation 4, Hack (1973)
as follows:
SL = (∆H/∆L)*L 4
Where SL is the stream gradient index, ∆H/∆L is the local gradient of the stream reach where
the index is computed, ∆H is the drop in the elevation and ∆L is the length of the reach and L
is the total length of the of the channel from the water divide to the center of the reach measured
along the channel. The SL values are high in areas where rocks are particularly resistant or
where active tectonics has resulted in vertical deformation at the earth’s surface. Therefore,
high SL indices in rocks of low to uniform resistance are a possible indicator of active tectonics
(Keller, 1986).
SL values for the West Lidder stream increases from 480m over the mouth to 1650m over the
knick zone (figure 7) where the profile shows deviation from the general concave- up form.
The SL value then again decreases and shows the normal gradient. The higher value at the knick
zone may be due to the tectonic deformation as the basin in the stretch is composed of
homogeneous lithology.
Figure 7: Stream gradient index (SL) of the West Lidde
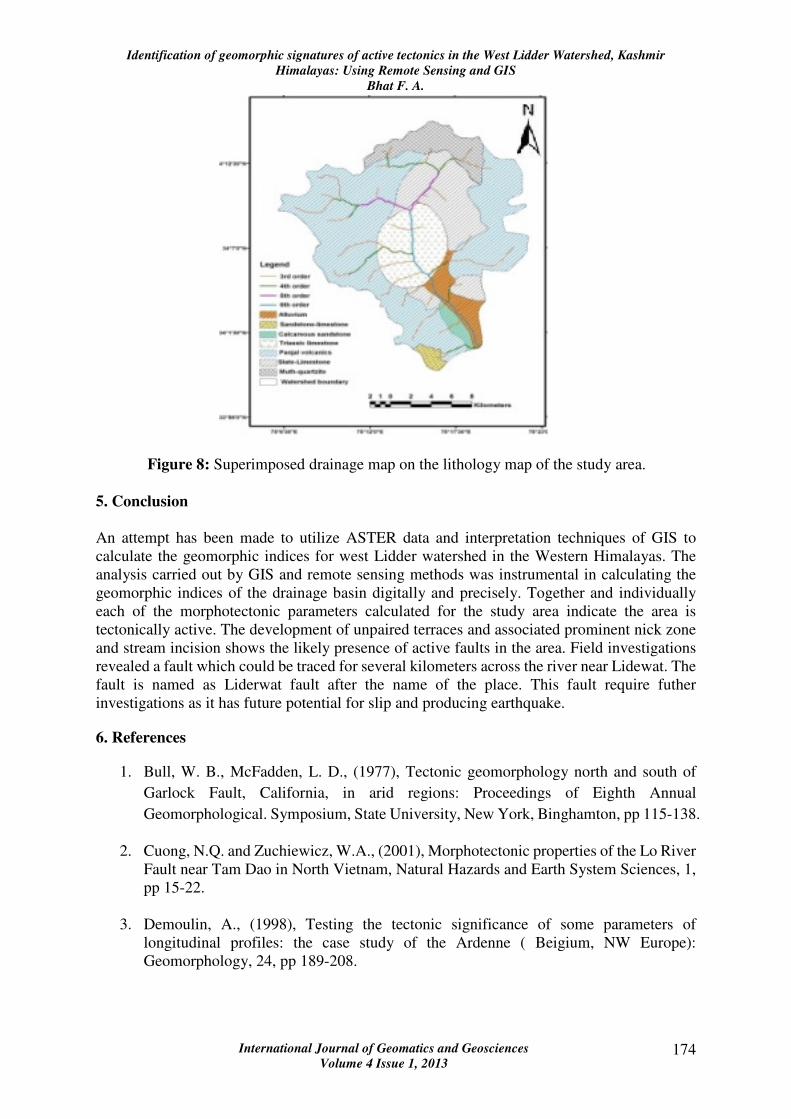
The figure No.8 shows the superimposition of drainage map on the lithology map of the study
area. From figure it is clear that formation of the knick zone near the Lidderwat is not controlled
by the lithology as the lithology is same in this area. Also due to the presence of a collinear
drainage lines on the opposite sides of the West Lidder is suggestive of the tectonic control on
the knick zone. This further suggests that the Kalwan gorge is formed due to deformation
caused by the recent tectonic activity in the area.
Identification of geomorphic signatures of active tectonics in the West Lidder Watershed, Kashmir
Himalayas: Using Remote Sensing and GIS
Bhat F. A.
International Journal of Geomatics and Geosciences
Volume 4 Issue 1, 2013 174
Figure 8: Superimposed drainage map on the lithology map of the study area.
5. Conclusion
An attempt has been made to utilize ASTER data and interpretation techniques of GIS to
calculate the geomorphic indices for west Lidder watershed in the Western Himalayas. The
analysis carried out by GIS and remote sensing methods was instrumental in calculating the
geomorphic indices of the drainage basin digitally and precisely. Together and individually
each of the morphotectonic parameters calculated for the study area indicate the area is
tectonically active. The development of unpaired terraces and associated prominent nick zone
and stream incision shows the likely presence of active faults in the area. Field investigations
revealed a fault which could be traced for several kilometers across the river near Lidewat. The
fault is named as Liderwat fault after the name of the place. This fault require futher
investigations as it has future potential for slip and producing earthquake.
6. References
1. Bull, W. B., McFadden, L. D., (1977), Tectonic geomorphology north and south of
Garlock Fault, California, in arid regions: Proceedings of Eighth Annual
Geomorphological. Symposium, State University, New York, Binghamton, pp 115-138.
2. Cuong, N.Q. and Zuchiewicz, W.A., (2001), Morphotectonic properties of the Lo River
Fault near Tam Dao in North Vietnam, Natural Hazards and Earth System Sciences, 1,
pp 15-22.
3. Demoulin, A., (1998), Testing the tectonic significance of some parameters of
longitudinal profiles: the case study of the Ardenne ( Beigium, NW Europe):
Geomorphology, 24, pp 189-208.
Identification of geomorphic signatures of active tectonics in the West Lidder Watershed, Kashmir
Himalayas: Using Remote Sensing and GIS
Bhat F. A.
International Journal of Geomatics and Geosciences
Volume 4 Issue 1, 2013 175
4. Gupta, V. J., (1973), Indian Paleozoic stratigraphy, Hindustan Publishing Corporation
(India), Delhi.
5. Hack, J. T., (1973), Stream Profile Analysis and Stream Gradient Index, U.S.
Geological. Survey, 1, pp 421-429.
6. Hare, PP. W., and Gardner, T. W., (1985), Geomorphic indicators of vertical
neotectonism along converging plate margins, Nicoya Peninsula Costa Rica. In M.
Morisawa and J. T. Hack (Eds.). Tectonic Geomorphology proceedings of the 15th
Annual Binghantom Geomorphology Symposium, September 1984. Allen and Unwin
Beston.
7. Hovius, N., (2000), Macro scale process systems of mountain belt erosion,
Geomorphology and Global Tectonics: New York, Etd, by Michael A Summerfield.
John Wiley & Sons Ltd. Pp 77-105.
8. Jain, S, and Verma, PP. K., (2006), Mapping active tectonics intensity zones using
remote sensing and GIS, Journal of Indian Society of Remote Sensing, 34(2), pp 131-
142.
9. Kaul, M. N., (1994), Late Quaternary Glacial and Climatic history of the Lidder valley,
Kashmir Himalaya. In Dikshit K. R., et. al. (eds.), India: Geomorphological Diversity,
Rawat Publications, Jaipur and New Delhi, pp 126-148.
10. Keller, E. A., (1986), Investigation of active tectonics: use of surficial earth processes.
In Panel on Active Tectonics. National Academy press: Washington, D. C.
11. Keller, E. A. and Pinter, N., (1996), Active tectonics: Earthquakes, Uplift and
Landscapes.Prentice Hall, New Jersey.
12. Keller, E. A. and Pinter, N., (2002), Active tectonics: Earthquakes, uplift and
Landscape (second edition): Englewood Cliffs, New Jersey, Prentice Hall, p 362.
13. Mackin, J. H., (1948), Concept of the graded river: Geological Society of America
Bulletin, 59, pp. 463-512.
14. Meher-Homji, V.M., (1971), The climate of Srinagar and its variability.
15. Middlemiss, C. S., (1896), The Geology of Hazara and Black mountains, Memoir
Geological Survey of India, 27, pp 1-302.
16. Middlemiss, C. S., (1910), A revise of the Silurian-Triassic sequence in Kashmir.
Records Geological Survey of India, 40, pp 206-260.
17. Pike, R. J. and Wilson, S. E., (1971), Elevation relief ratio, hypsometric integral and
geomorphic area-altitude analysis. Geological Society of America Bulletin, 62, pp
1079-1084.
18. Raj, R., Bhandari, S., Maurya, D. M. and Chamyal, L. S., (2003), Geomorphic
Indicators of Active Tectonics in the Karjan River Basin, Lower Narmada Valley,
Western India. Journal of Geological Society of India, 62, pp 739-752.

Identification of geomorphic signatures of active tectonics in the West Lidder Watershed, Kashmir
Himalayas: Using Remote Sensing and GIS
Bhat F. A.
International Journal of Geomatics and Geosciences
Volume 4 Issue 1, 2013 176
19. Schumm, S. A., (1956), Evolution of drainage systems and slopes badlands at Perth
Amboy, N. J. Geological Society of America Bulletin, 67, pp 597-646.
20. Strahler, A. N., (1957), Quantitative analysis of watershed geomorphology. American
Geophysical Union Transactions, 38, pp 913-920.
21. Strahler, A. N., (1964), Quantitative geomorphology of drainage basins and channel
networks. In Chow, V.T. (ed) Handbook of Applied Hydrology, McGraw-Hill, New
York, pp 439-476.
22. Toudeshki, V. H. and Arian, M., (2011), Morphotectonic Analysis in the Ghezel Ozan
River Basin, NW Iran, Journal of Geography and Geology, 3(1), pp 1-21.
23. Verrios, S., Zygouri V., and Kokkalas, S., (2004), Moarphotectonic Analysis in the
Eliki Fault Zone (Gulf of Corinth, Greece), Bulletin of the Geological Society of
Greece , 34(1), pp 1706-1715.
24. Wells, S., Bullard, T., et al., (1988), Regional variations in tectonic geomorphology
along segmented convergent plate boundary. Pacific Costa Rica. Geomorphology, 1,
pp 239-265.