identification of geometric parameters influencing the ... · identification of geometric...
TRANSCRIPT
Identification of geometric parameters influencing theflow-induced vibration of a two-layer self-oscillatingcomputational vocal fold model
Brian A. Pickup and Scott L. Thomsona)
Department of Mechanical Engineering, Brigham Young University, Provo, Utah 84602
(Received 22 June 2010; revised 19 January 2011; accepted 25 January 2011)
Simplified models have been used to simulate and study the flow-induced vibrations of the human
vocal folds. While it is clear that the models’ responses are sensitive to geometry, it is not clear
how and to what extent specific geometric features influence model motion. In this study geometric
features that played significant roles in governing the motion of a two-layer (body-cover), two-
dimensional, finite element vocal fold model were identified. The model was defined using a flow
solver based on the viscous, unsteady, Navier–Stokes equations and a solid solver that allowed for
large strain and deformation. A screening-type design-of-experiments approach was used to iden-
tify the relative importance of 13 geometric parameters. Five output measures were analyzed to
assess the magnitude of each geometric parameter’s effect on the model’s motion. The measures
related to frequency, glottal width, flow rate, intraglottal angle, and intraglottal phase delay. The
most significant geometric parameters were those associated with the cover—primarily the pre-pho-
natory intraglottal angle—as well as the body inferior angle. Some models exhibited evidence of
improved model motion, including mucosal wave-like motion and alternating convergent-divergent
glottal profiles, although further improvements are still needed to more closely mimic human vocal
fold motion. VC 2011 Acoustical Society of America. [DOI: 10.1121/1.3557046]
PACS number(s): 43.70.Aj, 43.70.Bk [DAB] Pages: 2121–2132
I. INTRODUCTION
Voice production is the result of the flow-induced vibra-
tion of the vocal folds. Simplified, self-oscillating continuum-
type synthetic models of the vocal folds have been used to
study various aspects of this system, such as aerodynamic
energy transfer (Thomson et al., 2005), coupling of subglot-
tal acoustics with vocal fold models (Zhang et al., 2006a),
acoustically and aerodynamically driven modes of vibration
(Zhang et al., 2006b; Zhang et al., 2009), glottal airflow
(Neubauer et al., 2007; Drechsel and Thomson, 2008), mate-
rial asymmetries (Pickup and Thomson, 2009), flow-structure-
acoustic interactions (Becker et al., 2009), and subglottal
flow (Misun et al., 2011). Synthetic models such as these are
inexpensive, durable, relatively easy to fabricate, and con-
veniently parameterized. These features allow for detailed
parametric investigations of the underlying flow-induced
vibration physics.
While these models have demonstrated some vibratory
similarities with those of the human vocal folds, such as
with regards to onset pressure, frequency, and amplitude,
some models have also exhibited a few aspects of less-than-
life-like motion-related behavior. Examples include the lack
of mucosal wave-like motion (a key feature of phonation,
Bless et al., 1987), excessive inferior-superior motion
(Drechsel and Thomson, 2008), and a generally divergent
profile during vibration (as opposed to the more realistic
convergent-divergent profile) (Pickup and Thomson, 2010).
It is therefore desirable to understand the relationship
between the models’ various geometric and material charac-
teristics and their flow-induced responses.
Researchers have studied how geometric parameters and
material properties influence the resulting fluid, solid, and/or
coupled fluid–solid dynamics of vocal fold models. For
example, static models have been used to study intraglottal
pressure and flow characteristics. One example is the “M5”
static vocal fold model of Scherer et al. (2001a), which has
been used to investigate the effect of asymmetric intraglottal
profiles on intraglottal pressure distributions. By using the
same model, Scherer et al. (2001b) found that the intraglottal
pressure distribution was dependent upon the curvature of
the exit radius in models with convergent intraglottal pro-
files. Li et al. (2006) numerically investigated the influence
of inferior and superior surface angles of these static models.
They showed that intraglottal pressures are relatively insen-
sitive to inferior and superior vocal fold surface angles,
although they emphasized the need to further study how
these angles might influence vocal fold motion.
Studies on the effects of vocal fold thickness, epithelial
membrane thickness, pre-phonatory glottal geometry, and
cover layer material properties on phonation threshold pres-
sure have been investigated using membrane-type synthetic
vocal fold models. Titze et al. (1995) studied the effects of
cover layer material properties and pre-phonatory glottal
width on phonation threshold pressure of a physical model.
They showed that phonation threshold pressure increases
with increasing pre-phonatory glottal width. By using a simi-
lar model, Chan et al. (1997) showed that phonation thresh-
old pressure increases with non-zero pre-phonatory glottal
a)Author to whom correspondence should be addressed. Electronic mail:
J. Acoust. Soc. Am. 129 (4), April 2011 VC 2011 Acoustical Society of America 21210001-4966/2011/129(4)/2121/12/$30.00
Downloaded 27 Apr 2011 to 128.187.97.3. Redistribution subject to ASA license or copyright; see http://asadl.org/journals/doc/ASALIB-home/info/terms.jsp

convergence angles, increased epithelial membrane thick-
ness, and decreased vertical model thickness. These studies
did not include analysis of model motion.
Continuum-based numerical vocal fold models have
also been studied in order to understand model response
characteristics. Cook and Mongeau (2007) investigated the
role of lateral depth, anterior–posterior length, and vertical
thickness of a single-layer, three-dimensional vocal fold
model on modal frequencies. They showed that modal fre-
quencies were most sensitive to variations in anterior–posterior
length and least sensitive to changes in vertical thickness.
Subsequently, Cook et al. (2009) extended this study to con-
sider how other geometric and material parameters influ-
enced the modal response of a three-dimensional body-cover
layer computational model. These two studies focused on invacuo modal analysis, absent flow-induced vibration. Zhang
(2009) used a two-layer body-cover continuum-based vocal
fold model with a reduced-order flow model to study me-
chanical and geometric properties on model response at
phonation onset. It was shown that significant changes
in phonation onset frequency can be induced by slight
changes in body layer stiffness and that similar changes in
phonation onset frequency may also be induced by geomet-
ric changes.
Pickup and Thomson (2010) recently compared the
flow-induced responses of synthetic models with geometries
based on magnetic resonance imaging (MRI) data with the
responses of models based on the more geometrically simpli-
fied M5-based model. The MRI-based models showed evi-
dence of mucosal wave-like motion, a feature absent in the
M5-based physical models. The M5-based model also
showed primarily divergent motion, whereas convergent-di-
vergent motion was evident in the MRI-based models. The
M5-based model pre-phonatory intraglottal profiles were
straight and it was hypothesized that convergent pre-phona-
tory profiles may have played a significant role in the
improved convergent-divergent behavior of the MRI-based
model. It was concluded that parametric studies investigat-
ing the role of the various geometric features on the flow-
induced response was necessary.
The research in this paper was undertaken to determine
which geometric features significantly influence a vocal fold
model’s flow-induced vibratory response. The model (see
Fig. 1) was a modification of the M5 model of Scherer et al.(2001a). This was chosen because it (or a very similar repre-
sentation) has been used in several recently reported studies,
and in some of these reports, it has been emphasized that
improvements to the model motion are needed in order to
better represent vocal fold motion (e.g., Zhang et al.,2006a,b; Drechsel and Thomson, 2008; Zhang et al., 2009;
Pickup and Thomson, 2009, 2010). This work is also closely
related to that of Cook and Mongeau (2007), Cook et al.(2009), and Zhang (2009), in that a similarly defined two-
dimensional computational vocal fold model was used, only
the present work considers a model in which the motion was
fully coupled with a Navier–Stokes-based flow solver. In
this work, the model geometry generally consisted of linear
subglottal and supraglottal profiles of varying angles, a linear
intraglottal profile of varying angle and length, and rounded
glottal inlet and exit regions of varying radii. A body-cover
representation was used, with body and cover geometries in-
dependently defined. In order to accommodate the significant
computation times required for model simulation, the geo-
metric parameters were defined and the simulation results
were analyzed based on a screening-type design-of-experi-
ments methodology. The simulation results were analyzed to
estimate the relative significance of different geometric
parameters on the model’s response.
In the following sections, the computational approach is
described, including model parameterization, screening
design, numerical methods, and data analysis. The results,
including rankings of the influence of model parameters on
various aspects of model response, are presented and dis-
cussed. Finally, suggestions for further studies of specific
model parameters and development of improved models are
provided.
II. METHODS
A. Model definition and parameterization
The model body and cover layer geometries were
defined using 14 parameters (see Fig. 1). Of these the model
depth, D (the maximum depth from the medial edge to the
lateral edge), was constant and the other 13 were variable.
The variable parameters were each given a low, baseline,
and high value (see Table I), according to similar values
found in previous reports (Stiblar-Martincic, 1997; Scherer
et al., 2001a; Tayama et al., 2002; Agarwal et al., 2003;
Nanayakkara, 2005; Sidlof et al., 2008). It is noted that
variations in the parameters resulted in the base vertical
thickness dimension (corresponding to the fixed, lateral edge
length; i.e., that of the leftmost vertical edge in Fig. 1)
ranging from 10 to 11.2 mm.
B. Screening design
In order to determine which geometric parameters were
significant in terms of influencing model response, a 20-run
Plackett–Burman screening design-of-experiment was used
to analyze the effect of the 13 variable parameters on various
measurements of model motion. This approach, as opposed
FIG. 1. Parametric two-layer vocal fold model.
2122 J. Acoust. Soc. Am., Vol. 129, No. 4, April 2011 B. A. Pickup and S. L. Thomson: Vocal fold model geometric parameters
Downloaded 27 Apr 2011 to 128.187.97.3. Redistribution subject to ASA license or copyright; see http://asadl.org/journals/doc/ASALIB-home/info/terms.jsp

to a full-factorial design-of-experiment or sensitivity analy-
sis, was taken because of the computational cost of the
model simulations (approximately 19 h per simulation on a
2.8 GHz quad-core Intel Nehalem CPU; time to complete all
cases was reduced by running simulations simultaneously on
a supercomputer). The combinations of high-low parameter
values for each simulation were adapted from Lawson and
Erjavec (2001) and are given in Table II. Since 13 geometric
attributes were analyzed but 20 runs were performed, six
unassigned factors (X14–X19 in Table II) represent
unknown combinations of second, third, and higher-order
interactions of the 13 assigned parameters. In addition to the
20 high-low runs, an additional run with all parameters set to
baseline values was executed.
The benefit of using a Plackett–Burman design is that
the influence of each parameter on the measured output can
be estimated using relatively few runs. The tradeoff is that
interactions between parameters are confounded with the
main effect of each parameter. It is therefore intended to
serve as a screening design to be followed up with focused,
more detailed studies on the parameters found to be signifi-
cant. In this study, analysis of each parameter’s effect was
used to determine which parameters are recommended for
such future detailed studies.
The levels of the high and low parameter values were
chosen such that changing each parameter from low to high
resulted in a similar overall change (in terms of magnitude)
in the model’s shape. For example, the inferior surface angle
(h1c) levels were determined as follows. First, all parameters
were set to their baseline values. Then, keeping all other pa-
rameters at their baseline values, high and low h1c values
that yielded 0.15 mm displacement of a point on the glottal
entrance radius position from its original position were
determined (yielding a total displacement of 0.3 mm of the
TABLE I. Vocal fold model geometric parameter values and descriptions.
Parameter Baseline Low/high values Description
h1c, h1b 50� 49.35, 50.65� Inferior glottal angle (cover, body)
h2c, h2b 0� �2.75, 2.75� Intraglottal angle (� divergent,þ convergent) (cover, body)
h3c, h3b 90� 88.85, 91.15� Superior glottal angle (cover, body)
r1c 1.5 mm 1.18, 1.82 mm Entrance radius (cover)
r1b 1.12 mm 0.80, 1.45 mm Entrance radius (body)
r2c 0.987 mm 0.837, 1.137 mm Exit radius (cover)
r2b 0.513 mm 0.36, 0.66 mm Exit radius (body)
T 2.0 mm 1.85, 2.15 mm Distance between glottal entrance and exit points
D 1.15 mm 1.0, 1.3 mm Maximum medial cover layer thickness
T 1.15 mm 1.075, 1.225 mm Inferior and superior cover layer thickness
D 8.4 mm 8.4 mm Maximum lateral distance from medial edge to lateral edge
TABLE II. Plackett–Burman 20-run statistical design-of-experiment table. “1” indicates a high geometric value; “�1” indicates a low geometric value. In
row 1, factors X1 through X13 correspond to model variable parameters denoted directly underneath in row 2. Factors X14 through X20 represent unknown
interactions of main factors. Run 0 corresponds to the baseline set of parameter values.
X1 X2 X3 X4 X5 X6 X7 X8 X9 X10 X1 X2 X3 X14 X15 X16 X17 X18 X19
Run r1c r1b r2c r2b h1c h1b h2c h2b h3c h3b T d t X14 X15 X16 X17 X18 X19
0 0 0 0 0 0 0 0 0 0 0 0 0 0 0 0 0 0 0 0
1 1 1 �1 �1 1 1 1 1 �1 1 �1 1 �1 �1 �1 �1 1 1 �1
2 1 �1 �1 1 1 1 1 �1 1 �1 1 �1 �1 �1 �1 1 1 �1 1
3 �1 �1 1 1 1 1 �1 1 �1 1 �1 �1 �1 �1 1 1 �1 1 1
4 �1 1 1 0.2 1 �1 1 �1 1 �1 �1 �1 �1 1 1 �1 1 1 �1
5 1 1 1 1 �1 1 �1 1 �1 �1 �1 �1 1 1 �1 1 1 �1 �1
6 1 1 1 �1 1 �1 1 �1 �1 �1 �1 1 1 �1 1 1 �1 �1 1
7 1 1 �1 1 �1 1 �1 �1 �1 �1 1 1 �1 1 1 �1 �1 1 1
8 1 �1 1 �1 1 �1 �1 �1 �1 1 1 �1 1 1 �1 �1 1 1 1
9 �1 1 �1 1 �1 �1 �1 �1 1 1 �1 1 1 �1 �1 1 1 1 1
10 1 �1 1 �1 �1 �1 �1 1 1 �1 1 1 �1 �1 1 1 1 1 �1
11 �1 1 �1 �1 �1 �1 1 1 �1 1 1 �1 �1 1 1 1 1 �1 1
12 1 �1 �1 �1 �1 1 1 �1 1 1 �1 �1 1 1 1 1 �1 1 �1
13 �1 �1 �1 �1 1 1 �1 1 1 �1 �1 1 1 1 1 �1 1 �1 1
14 �1 �1 �1 1 1 �1 1 1 �1 �1 1 1 1 1 �1 1 �1 1 �1
15 �1 �1 1 1 �1 1 1 �1 �1 1 1 1 1 �1 1 �1 1 �1 �1
16 �1 1 1 �1 1 1 �1 �1 1 1 1 1 �1 1 �1 1 �1 �1 �1
17 1 1 �1 1 1 �1 �1 1 1 1 1 �1 1 �1 1 �1 �1 �1 �1
18 1 �1 1 1 �1 �1 1 1 1 1 �1 1 �1 1 �1 �1 �1 �1 1
19 �1 1 1 �1 �1 1 1 1 1 �1 1 �1 1 �1 �1 �1 �1 1 1
20 �1 �1 �1 �1 �1 �1 �1 �1 �1 �1 �1 �1 �1 �1 �1 �1 �1 �1 �1
J. Acoust. Soc. Am., Vol. 129, No. 4, April 2011 B. A. Pickup and S. L. Thomson: Vocal fold model geometric parameters 2123
Downloaded 27 Apr 2011 to 128.187.97.3. Redistribution subject to ASA license or copyright; see http://asadl.org/journals/doc/ASALIB-home/info/terms.jsp
point position when alternating between high and low set-
tings of parameter h1c). This was repeated for all parameters.
The total displacement value of 0.3 mm was selected due to
geometric restrictions; higher displacement values resulted
in numerous geometrically infeasible body layer definitions.
(One deviation from the high-low values specified in Table I
was required for run 4, for which the high value of r2b¼ 0.66
mm was not feasible and was thus reduced to 0.54 mm. For
this run, proper weighting of the value was taken into con-
sideration when calculating the effects. This modification
was deemed to be acceptable since the results showed that
overall r2b was insignificant in the measured effects.) Profiles
of various geometrically defined models, including the
baseline model, are provided in Fig. 2.
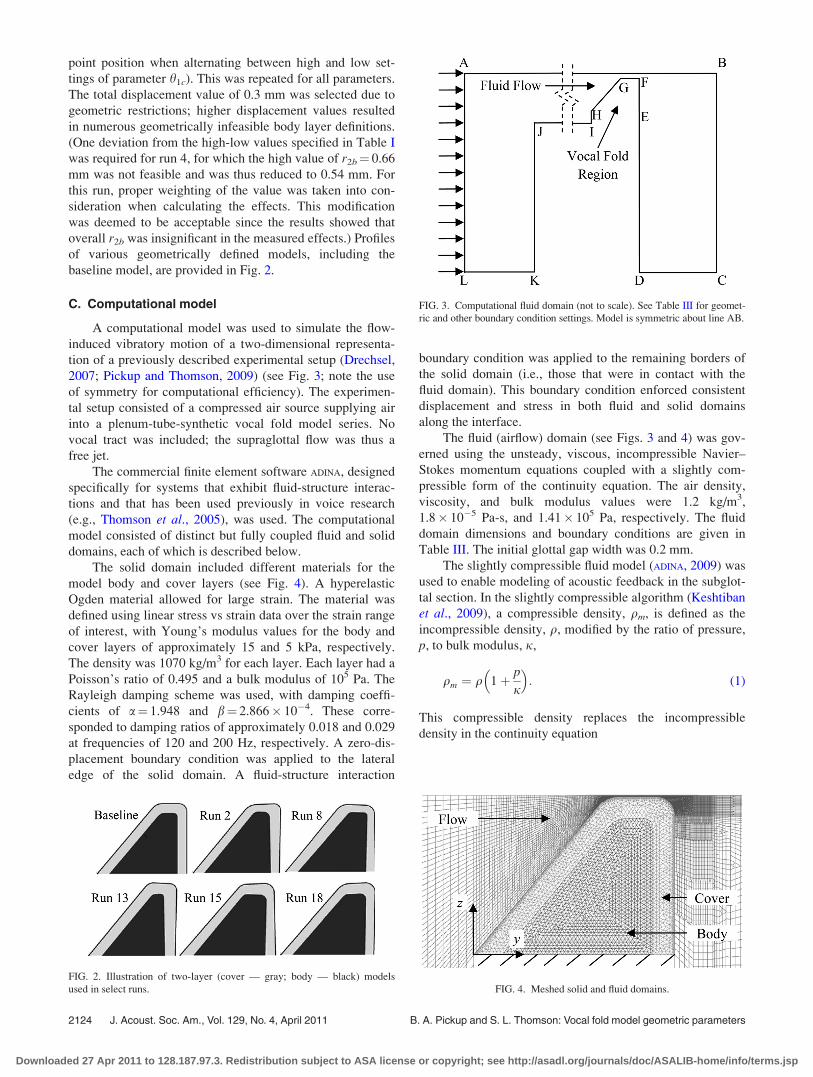
C. Computational model
A computational model was used to simulate the flow-
induced vibratory motion of a two-dimensional representa-
tion of a previously described experimental setup (Drechsel,
2007; Pickup and Thomson, 2009) (see Fig. 3; note the use
of symmetry for computational efficiency). The experimen-
tal setup consisted of a compressed air source supplying air
into a plenum-tube-synthetic vocal fold model series. No
vocal tract was included; the supraglottal flow was thus a
free jet.
The commercial finite element software ADINA, designed
specifically for systems that exhibit fluid-structure interac-
tions and that has been used previously in voice research
(e.g., Thomson et al., 2005), was used. The computational
model consisted of distinct but fully coupled fluid and solid
domains, each of which is described below.
The solid domain included different materials for the
model body and cover layers (see Fig. 4). A hyperelastic
Ogden material allowed for large strain. The material was
defined using linear stress vs strain data over the strain range
of interest, with Young’s modulus values for the body and
cover layers of approximately 15 and 5 kPa, respectively.
The density was 1070 kg/m3 for each layer. Each layer had a
Poisson’s ratio of 0.495 and a bulk modulus of 105 Pa. The
Rayleigh damping scheme was used, with damping coeffi-
cients of a¼ 1.948 and b¼ 2.866� 10�4. These corre-
sponded to damping ratios of approximately 0.018 and 0.029
at frequencies of 120 and 200 Hz, respectively. A zero-dis-
placement boundary condition was applied to the lateral
edge of the solid domain. A fluid-structure interaction
boundary condition was applied to the remaining borders of
the solid domain (i.e., those that were in contact with the
fluid domain). This boundary condition enforced consistent
displacement and stress in both fluid and solid domains
along the interface.
The fluid (airflow) domain (see Figs. 3 and 4) was gov-
erned using the unsteady, viscous, incompressible Navier–
Stokes momentum equations coupled with a slightly com-
pressible form of the continuity equation. The air density,
viscosity, and bulk modulus values were 1.2 kg/m3,
1.8� 10�5 Pa-s, and 1.41� 105 Pa, respectively. The fluid
domain dimensions and boundary conditions are given in
Table III. The initial glottal gap width was 0.2 mm.
The slightly compressible fluid model (ADINA, 2009) was
used to enable modeling of acoustic feedback in the subglot-
tal section. In the slightly compressible algorithm (Keshtiban
et al., 2009), a compressible density, qm, is defined as the
incompressible density, q, modified by the ratio of pressure,
p, to bulk modulus, j,
qm ¼ q 1þ p
j
� �: (1)
This compressible density replaces the incompressible
density in the continuity equation
FIG. 2. Illustration of two-layer (cover — gray; body — black) models
used in select runs.
FIG. 3. Computational fluid domain (not to scale). See Table III for geomet-
ric and other boundary condition settings. Model is symmetric about line AB.
FIG. 4. Meshed solid and fluid domains.
2124 J. Acoust. Soc. Am., Vol. 129, No. 4, April 2011 B. A. Pickup and S. L. Thomson: Vocal fold model geometric parameters
Downloaded 27 Apr 2011 to 128.187.97.3. Redistribution subject to ASA license or copyright; see http://asadl.org/journals/doc/ASALIB-home/info/terms.jsp

qj
@p
@tþ v � rp
� �þ qmr � v ¼ 0; (2)
where t and v denote time and velocity, respectively.
In this formulation, there is no need to use the energy
equation. Compared with a fully compressible algorithm,
this approach is more computationally efficient, and conver-
gence may be more easily obtained for the low Mach num-
bers typical of voice production. It is noted that this
approach is valid only for pj� 1. For these simulations,
maximum pressure values were around 3 kPa, for maxi-
mum pj ratios of around 0.02, thus satisfying the p
j� 1
condition.
Figure 4 shows the meshes in both domains. Model veri-
fication was performed to ensure that the solution was rea-
sonably independent of mesh density and time step size. The
fluid domain utilized primarily four-node quadrilateral ele-
ments and consisted of approximately 19 000 nodes. The
solid domain used three-node triangular elements and con-
tained approximately 3000 nodes. The time step size was
1.25� 10�5 s. As has been done previously (Thomson et al.,2005), a contact line was used to prevent complete fluid
domain mesh collapse as the solid domain moved medially.
This contact line was placed such that the minimum
allowable glottal gap width was 0.05 mm.
D. Yield calculation
To estimate the effect of each of the 13 geometric pa-
rameters on the model’s response, various output measures,
denoted here as yields, were obtained. These included the
following (described in detail below; see also Table IV):
flow-induced vibration frequency (fFIV), changes in lateral
glottal width (Dd), flow rate (Dq), intraglottal angle (Da),
and lateral phase delay (Du/T, where T is the vertical glottal
thickness). Similar measures of lateral phase delay were pre-
viously used by Titze et al. (1993) and Boessenecker et al.(2007) to quantify mucosal wave-like motion.
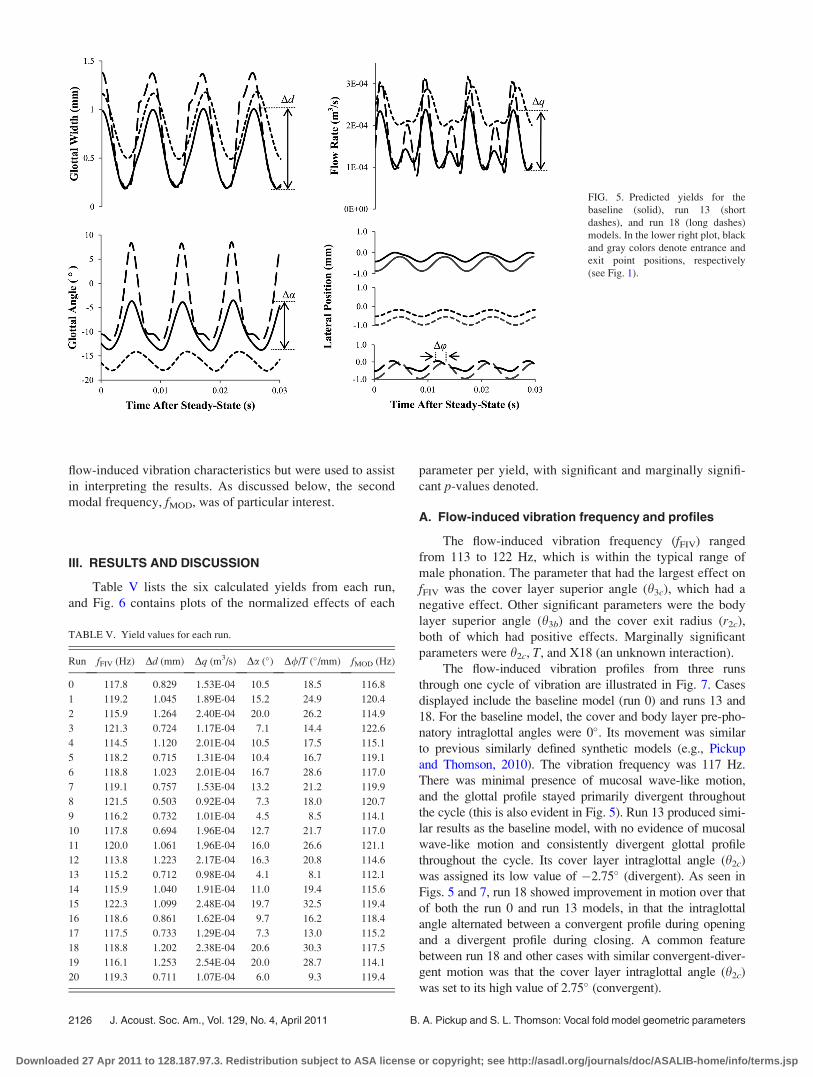
These five yields were calculated for each case after
steady-state oscillation was reached. The flow-induced
vibration frequency (fFIV) was measured by tracking the
“entrance point” position (see Fig. 1). Measures of Dd, Dq,
Da, and Du/T are visually portrayed in Fig. 5, in which three
different simulation results are shown. The difference in
minimal glottal width (Dd) was measured by taking the net
difference between high and low values of the minimum
glottal gap (z-direction; see coordinate system in Fig. 4) over
time. The change in flow rate (Dq) was measured by inte-
grating the velocity profile just downstream of the model,
multiplying by 0.017 cm (close to the length of the average
adult male’s vocal folds, Titze, 2006), and taking the differ-
ence between high and low flow rates over time. The change
in intraglottal angle (Da) was defined by tracking the y- and
z-locations of the entrance and exit points and taking the net
difference between the low and high angle between them. It
is noted that this is only an approximation, since during
vibration the glottal surface deformed and was thus not lin-
ear. The phase delay (Du/T) was measured by tracking the
entrance and exit points’ z-locations over time, taking the
difference in time between peak values, dividing by the pe-
riod, multiplying by 360�, and dividing by the vertical glottal
thickness (T).
The effect of each parameter was calculated as follows.
Each parameter’s yields from runs with a specified “high”
value were averaged. Each parameter’s yields from runs
with a specified “low” value were also averaged, subtracted
from the “high” yield average, and then normalized. A
resulting value relatively close to zero indicated that even
though the parameter levels may have been changing, the
overall yield did not vary; i.e., the parameter had minimal
effect on model response. A value close to þ1 or �1 meant
that a particular parameter had a high impact on the meas-
ured yield. A positive effect meant that increasing that pa-
rameter’s value increased the yield, while a negative effect
meant the opposite.
Statistical p-values were estimated for each parameter at
each measured yield using the statistical software package
JMP (SAS Institute, Inc., Cary, NC). A standard a¼ 0.05
value was used. Since there was no anticipated variation in
the calculated yields (due to the use of computational analy-
sis), a Monte Carlo technique was used to provide a pseudo-
standard error (PSE) which allowed for calculated p-values.
p-values less than 0.05 were considered to be significant; p-
values less than 0.10 but greater than 0.05 were considered
to be marginally significant.
In addition to these yields, animations of the simulated
model motion were created for visual inspection. Finally, invacuo modal analysis was performed on each model (also
using ADINA). These modal analysis results were not used to
estimate which parameters were important in governing the
TABLE IV. Nomenclature of measured yields.
Yield Definition
fFIV (Hz) Flow-induced vibration frequency
Dd (mm) Difference between min/max glottal width
Dq (m3/s) Difference between min/max flow rate
Da (�) Difference between min/max intraglottal angle
D//T(�/mm) Lateral phase delay between points near entrance
and exit radii
fMOD (Hz) Second modal frequency
TABLE III. Computational fluid domain line lengths and boundary
conditions.
Line segment Length (m) Bounday type
AB 0.9767 Slip wall
BC 0.1524 Zero pressure
CD 0.1000 Zero pressure
DE 0.1439 Wall
EF 0.0084 FSI
FG 0.0021 FSI
GH 0.0114 FSI
HI 0.0042 FSI
IJ 0.5588 Wall
JK 0.1397 Wall
KL 0.3080 Wall
AL 0.1524 Fixed pressure (900 Pa)
J. Acoust. Soc. Am., Vol. 129, No. 4, April 2011 B. A. Pickup and S. L. Thomson: Vocal fold model geometric parameters 2125
Downloaded 27 Apr 2011 to 128.187.97.3. Redistribution subject to ASA license or copyright; see http://asadl.org/journals/doc/ASALIB-home/info/terms.jsp
flow-induced vibration characteristics but were used to assist
in interpreting the results. As discussed below, the second
modal frequency, fMOD, was of particular interest.
III. RESULTS AND DISCUSSION
Table V lists the six calculated yields from each run,
and Fig. 6 contains plots of the normalized effects of each
parameter per yield, with significant and marginally signifi-
cant p-values denoted.
A. Flow-induced vibration frequency and profiles
The flow-induced vibration frequency (fFIV) ranged
from 113 to 122 Hz, which is within the typical range of
male phonation. The parameter that had the largest effect on
fFIV was the cover layer superior angle (h3c), which had a
negative effect. Other significant parameters were the body
layer superior angle (h3b) and the cover exit radius (r2c),
both of which had positive effects. Marginally significant
parameters were h2c, T, and X18 (an unknown interaction).
The flow-induced vibration profiles from three runs
through one cycle of vibration are illustrated in Fig. 7. Cases
displayed include the baseline model (run 0) and runs 13 and
18. For the baseline model, the cover and body layer pre-pho-
natory intraglottal angles were 0�. Its movement was similar
to previous similarly defined synthetic models (e.g., Pickup
and Thomson, 2010). The vibration frequency was 117 Hz.
There was minimal presence of mucosal wave-like motion,
and the glottal profile stayed primarily divergent throughout
the cycle (this is also evident in Fig. 5). Run 13 produced simi-
lar results as the baseline model, with no evidence of mucosal
wave-like motion and consistently divergent glottal profile
throughout the cycle. Its cover layer intraglottal angle (h2c)
was assigned its low value of �2.75� (divergent). As seen in
Figs. 5 and 7, run 18 showed improvement in motion over that
of both the run 0 and run 13 models, in that the intraglottal
angle alternated between a convergent profile during opening
and a divergent profile during closing. A common feature
between run 18 and other cases with similar convergent-diver-
gent motion was that the cover layer intraglottal angle (h2c)
was set to its high value of 2.75� (convergent).
FIG. 5. Predicted yields for the
baseline (solid), run 13 (short
dashes), and run 18 (long dashes)
models. In the lower right plot, black
and gray colors denote entrance and
exit point positions, respectively
(see Fig. 1).
TABLE V. Yield values for each run.
Run fFIV (Hz) Dd (mm) Dq (m3/s) Da (�) D//T (�/mm) fMOD (Hz)
0 117.8 0.829 1.53E-04 10.5 18.5 116.8
1 119.2 1.045 1.89E-04 15.2 24.9 120.4
2 115.9 1.264 2.40E-04 20.0 26.2 114.9
3 121.3 0.724 1.17E-04 7.1 14.4 122.6
4 114.5 1.120 2.01E-04 10.5 17.5 115.1
5 118.2 0.715 1.31E-04 10.4 16.7 119.1
6 118.8 1.023 2.01E-04 16.7 28.6 117.0
7 119.1 0.757 1.53E-04 13.2 21.2 119.9
8 121.5 0.503 0.92E-04 7.3 18.0 120.7
9 116.2 0.732 1.01E-04 4.5 8.5 114.1
10 117.8 0.694 1.96E-04 12.7 21.7 117.0
11 120.0 1.061 1.96E-04 16.0 26.6 121.1
12 113.8 1.223 2.17E-04 16.3 20.8 114.6
13 115.2 0.712 0.98E-04 4.1 8.1 112.1
14 115.9 1.040 1.91E-04 11.0 19.4 115.6
15 122.3 1.099 2.48E-04 19.7 32.5 119.4
16 118.6 0.861 1.62E-04 9.7 16.2 118.4
17 117.5 0.733 1.29E-04 7.3 13.0 115.2
18 118.8 1.202 2.38E-04 20.6 30.3 117.5
19 116.1 1.253 2.54E-04 20.0 28.7 114.1
20 119.3 0.711 1.07E-04 6.0 9.3 119.4
2126 J. Acoust. Soc. Am., Vol. 129, No. 4, April 2011 B. A. Pickup and S. L. Thomson: Vocal fold model geometric parameters
Downloaded 27 Apr 2011 to 128.187.97.3. Redistribution subject to ASA license or copyright; see http://asadl.org/journals/doc/ASALIB-home/info/terms.jsp
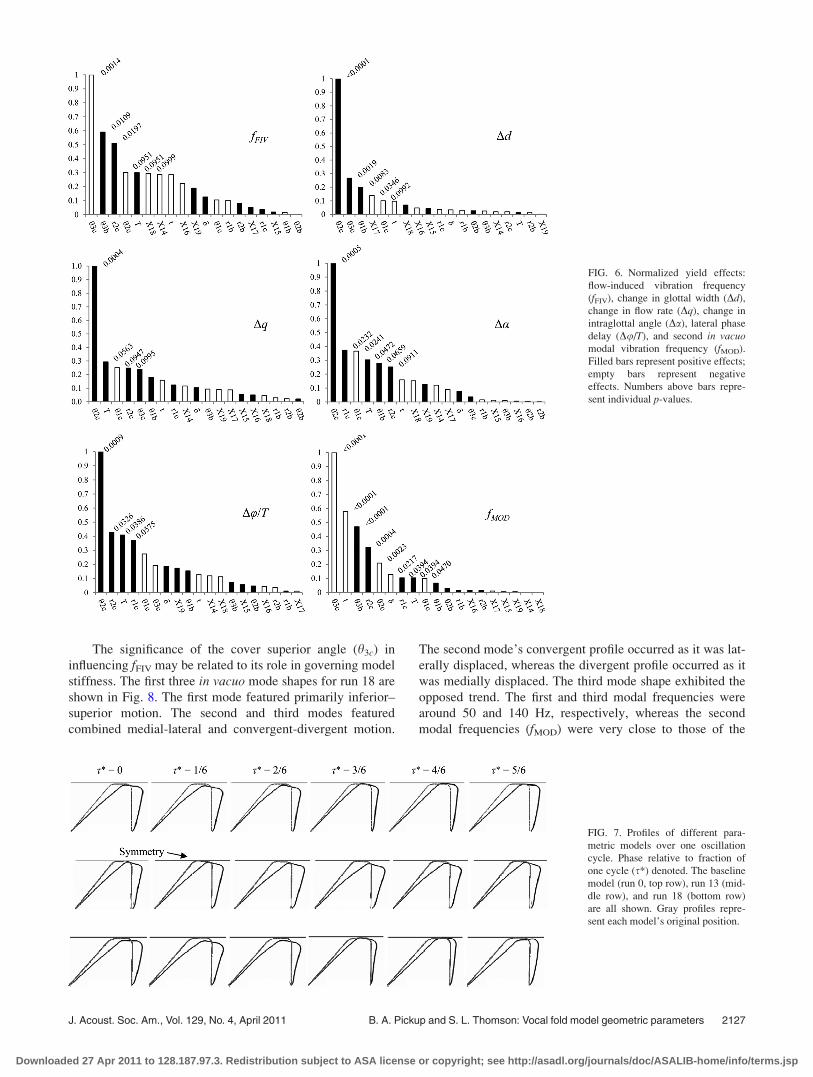
The significance of the cover superior angle (h3c) in
influencing fFIV may be related to its role in governing model
stiffness. The first three in vacuo mode shapes for run 18 are
shown in Fig. 8. The first mode featured primarily inferior–
superior motion. The second and third modes featured
combined medial-lateral and convergent-divergent motion.
The second mode’s convergent profile occurred as it was lat-
erally displaced, whereas the divergent profile occurred as it
was medially displaced. The third mode shape exhibited the
opposed trend. The first and third modal frequencies were
around 50 and 140 Hz, respectively, whereas the second
modal frequencies (fMOD) were very close to those of the
FIG. 6. Normalized yield effects:
flow-induced vibration frequency
(fFIV), change in glottal width (Dd),
change in flow rate (Dq), change in
intraglottal angle (Da), lateral phase
delay (Du/T), and second in vacuomodal vibration frequency (fMOD).
Filled bars represent positive effects;
empty bars represent negative
effects. Numbers above bars repre-
sent individual p-values.
FIG. 7. Profiles of different para-
metric models over one oscillation
cycle. Phase relative to fraction of
one cycle (s*) denoted. The baseline
model (run 0, top row), run 13 (mid-
dle row), and run 18 (bottom row)
are all shown. Gray profiles repre-
sent each model’s original position.
J. Acoust. Soc. Am., Vol. 129, No. 4, April 2011 B. A. Pickup and S. L. Thomson: Vocal fold model geometric parameters 2127
Downloaded 27 Apr 2011 to 128.187.97.3. Redistribution subject to ASA license or copyright; see http://asadl.org/journals/doc/ASALIB-home/info/terms.jsp
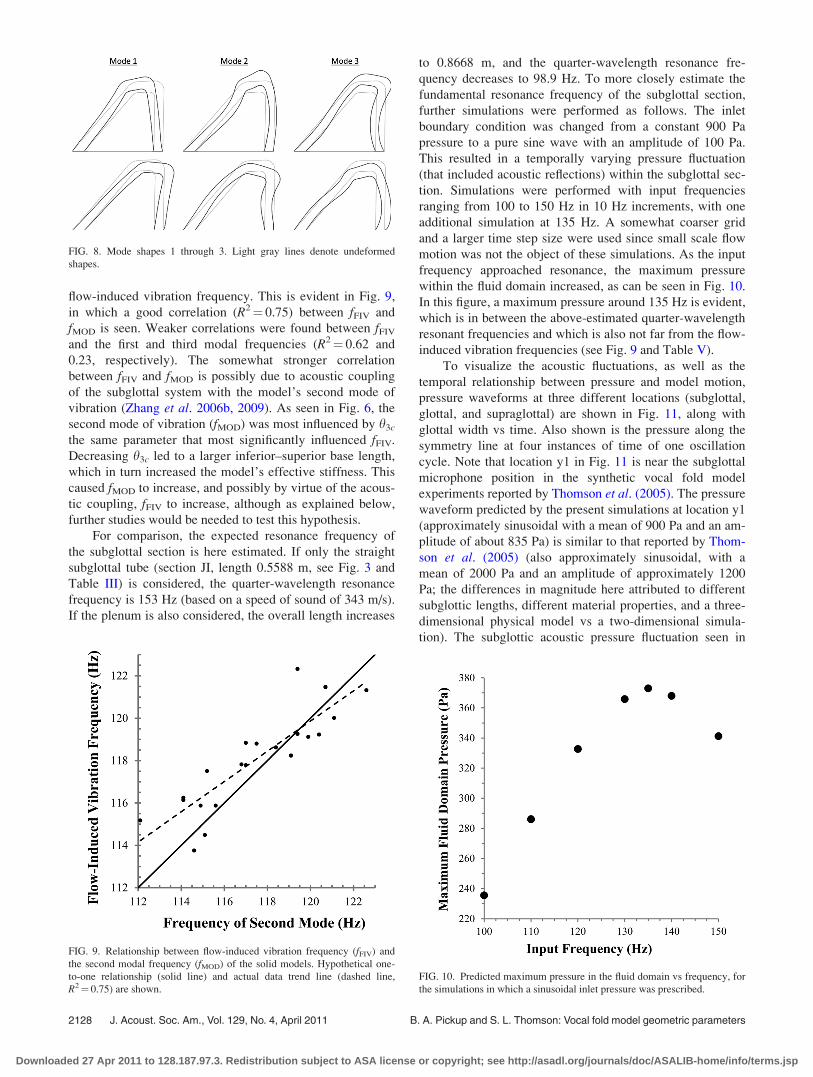
flow-induced vibration frequency. This is evident in Fig. 9,
in which a good correlation (R2¼ 0.75) between fFIV and
fMOD is seen. Weaker correlations were found between fFIV
and the first and third modal frequencies (R2¼ 0.62 and
0.23, respectively). The somewhat stronger correlation
between fFIV and fMOD is possibly due to acoustic coupling
of the subglottal system with the model’s second mode of
vibration (Zhang et al. 2006b, 2009). As seen in Fig. 6, the
second mode of vibration (fMOD) was most influenced by h3c
the same parameter that most significantly influenced fFIV.
Decreasing h3c led to a larger inferior–superior base length,
which in turn increased the model’s effective stiffness. This
caused fMOD to increase, and possibly by virtue of the acous-
tic coupling, fFIV to increase, although as explained below,
further studies would be needed to test this hypothesis.
For comparison, the expected resonance frequency of
the subglottal section is here estimated. If only the straight
subglottal tube (section JI, length 0.5588 m, see Fig. 3 and
Table III) is considered, the quarter-wavelength resonance
frequency is 153 Hz (based on a speed of sound of 343 m/s).
If the plenum is also considered, the overall length increases
to 0.8668 m, and the quarter-wavelength resonance fre-
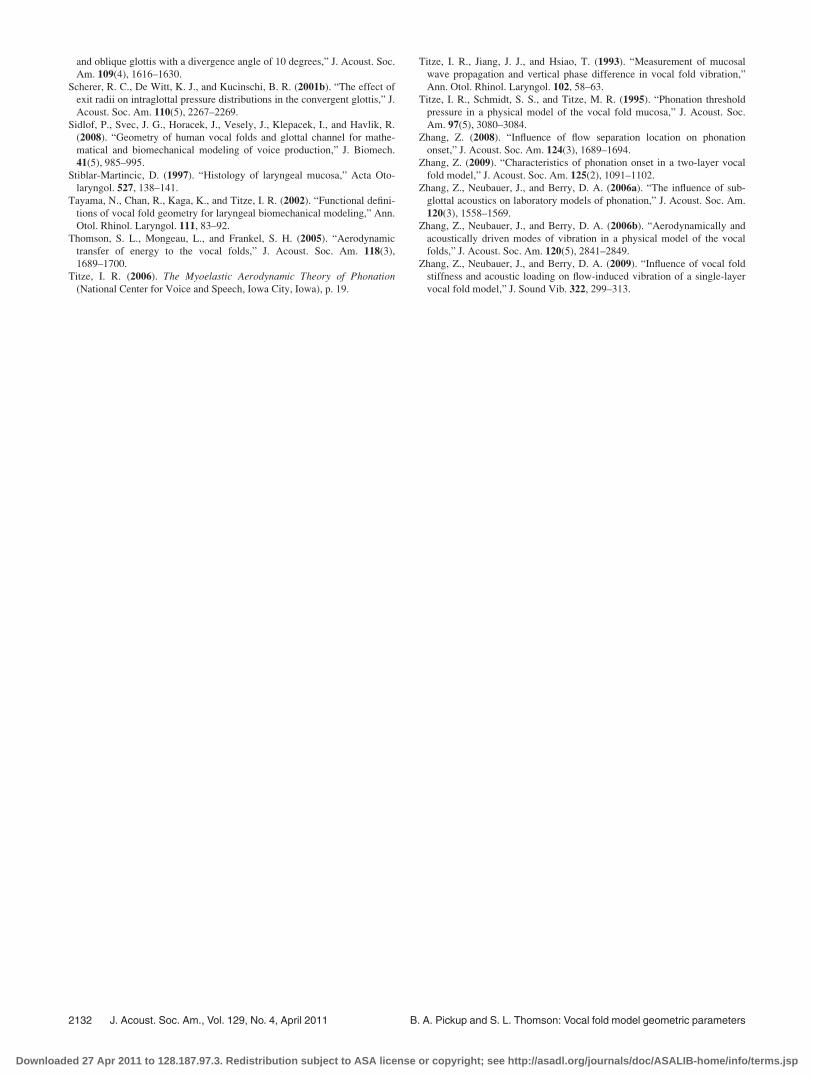
quency decreases to 98.9 Hz. To more closely estimate the
fundamental resonance frequency of the subglottal section,
further simulations were performed as follows. The inlet
boundary condition was changed from a constant 900 Pa
pressure to a pure sine wave with an amplitude of 100 Pa.
This resulted in a temporally varying pressure fluctuation
(that included acoustic reflections) within the subglottal sec-
tion. Simulations were performed with input frequencies
ranging from 100 to 150 Hz in 10 Hz increments, with one
additional simulation at 135 Hz. A somewhat coarser grid
and a larger time step size were used since small scale flow
motion was not the object of these simulations. As the input
frequency approached resonance, the maximum pressure
within the fluid domain increased, as can be seen in Fig. 10.
In this figure, a maximum pressure around 135 Hz is evident,
which is in between the above-estimated quarter-wavelength
resonant frequencies and which is also not far from the flow-
induced vibration frequencies (see Fig. 9 and Table V).
To visualize the acoustic fluctuations, as well as the
temporal relationship between pressure and model motion,
pressure waveforms at three different locations (subglottal,
glottal, and supraglottal) are shown in Fig. 11, along with
glottal width vs time. Also shown is the pressure along the
symmetry line at four instances of time of one oscillation
cycle. Note that location y1 in Fig. 11 is near the subglottal
microphone position in the synthetic vocal fold model
experiments reported by Thomson et al. (2005). The pressure
waveform predicted by the present simulations at location y1
(approximately sinusoidal with a mean of 900 Pa and an am-
plitude of about 835 Pa) is similar to that reported by Thom-
son et al. (2005) (also approximately sinusoidal, with a
mean of 2000 Pa and an amplitude of approximately 1200
Pa; the differences in magnitude here attributed to different
subglottic lengths, different material properties, and a three-
dimensional physical model vs a two-dimensional simula-
tion). The subglottic acoustic pressure fluctuation seen in
FIG. 8. Mode shapes 1 through 3. Light gray lines denote undeformed
shapes.
FIG. 9. Relationship between flow-induced vibration frequency (fFIV) and
the second modal frequency (fMOD) of the solid models. Hypothetical one-
to-one relationship (solid line) and actual data trend line (dashed line,
R2¼ 0.75) are shown.
FIG. 10. Predicted maximum pressure in the fluid domain vs frequency, for
the simulations in which a sinusoidal inlet pressure was prescribed.
2128 J. Acoust. Soc. Am., Vol. 129, No. 4, April 2011 B. A. Pickup and S. L. Thomson: Vocal fold model geometric parameters
Downloaded 27 Apr 2011 to 128.187.97.3. Redistribution subject to ASA license or copyright; see http://asadl.org/journals/doc/ASALIB-home/info/terms.jsp

Fig. 11 is similar to what one would expect in a quarter-
wavelength resonator.
Considering these data and observations, as well as the
results of other studies of subglottal acoustic coupling with a
similar synthetic model (Zhang et al., 2006a, b, 2009), it is
very likely that subglottal acoustic coupling played a signifi-
cant role in governing the present model’s vibration. The
precise coupling mechanism is not immediately evident,
however. Above it was suggested that coupling with the sec-
ond mode may have occurred; however, another possible ex-
planation is that the oscillations resulted from aeroelastic
eigenmode synchronization (e.g., Zhang, 2008, 2009). Fur-
ther work would be needed to identify the nature of the
acoustic-aerodynamic coupling of this model.
B. Glottal width, flow rate, intraglottal angle, andphase delay
The other four measured yields (change in glottal width,
Dd; change in flow rate, Dq; change in intraglottal angle, Da;
and phase delay, Du/T) all exhibited somewhat similar
trends in terms of significant parameters. All were more
strongly influenced by the cover intraglottal angle (h2c) than
by any other yield.
The glottal width (Dd) was mainly influenced by h2c,
which had a positive effect. The largest differences in the
glottal width were around 1.26 mm, compared with around 4
mm previously measured using excised human hemilarynges
(Doellinger and Berry, 2006; Boessenecker et al., 2007).
Only one body layer geometry (h1b) had a significant effect
on Dd. Other significant parameters included h3c and X17,
with marginal significance from h1c.
Unknown interactions of parameters appear to be some-
what significant only in Dd and fFIV yields. As mentioned
above, the Plackett–Burman design has interactions con-
founded in the main effects. In order to understand the mag-
nitude of the effect that interactions play in governing fFIV
and Dd, further parametric studies considering the most
influential parameters and their interactions would be
necessary.
The change in flow rate (Dq) was mainly influenced by
h2c (positive effect). Other parameters that affected Dq were
T, h1c, and r2c. This is important since changes in flow rate
are strongly correlated with sound production. The change in
intraglottal angle (Da) was also primarily positively influ-
enced by h2c. Other parameters that effected Da include r1c,
h1c, T, h1b, and r2c. Adjusting these parameters for large Dais desirable for generating alternating convergent-divergent
motion. For phase delay, other significant and marginally
significant parameters included r2c, T, and r1c. All of these
geometries had a positive effect. Relative to the baseline
model, increased phase delays are desirable; hence,
increased values of h2c (more convergent profile), r2c, T, and
r1c are recommended for improving phase delay. Further
refined sensitivity studies would be helpful in elucidating the
precise roles played by the significant parameters in govern-
ing model motion.
C. Overall parameter significance
To quantify the overall effect of each parameter on
model movement, the geometric parameters for Dd, Dq, Da,
and Du/T were ranked for each yield (i.e., assigned a number
1–19), summed, and normalized. These overall rankings are
shown in Fig. 12 to provide a graphical representation of the
parameters that exerted the greatest overall effect on model
motion. The cover medial angle profile h2c was clearly the
most significant factor overall. It had the greatest effect (pos-
itive) on all calculated yields, except for the flow-induced
vibration and second modal frequencies. Consistent with the
hypothesis of Pickup and Thomson (2010) (see Introduc-
tion), altering the intraglottal angle to have a convergent pre-
phonatory profile significantly improved model motion in
terms of generating alternating convergent-divergent motion
and mucosal wave-like motion (phase delay). The influence
FIG. 11. Pressure and displacement data for run 18. Top: Pressure along the
symmetry line (line AB, Fig. 3) vs streamwise location at four time instances
of one cycle after reaching steady-state, as denoted in legend. Middle: Pressure
vs time at three streamwise locations on the symmetry line, with y1¼�0.0212
m (subglottis), y2¼ 0.00919 m (intraglottis), and y3¼ 0.02 m (supraglottis);
see the coordinate system in Fig. 4. Bottom: Glottal width vs time.
J. Acoust. Soc. Am., Vol. 129, No. 4, April 2011 B. A. Pickup and S. L. Thomson: Vocal fold model geometric parameters 2129
Downloaded 27 Apr 2011 to 128.187.97.3. Redistribution subject to ASA license or copyright; see http://asadl.org/journals/doc/ASALIB-home/info/terms.jsp

of h2c is followed by h1c, h1b, r1c, h3c, T, r2c (all of which,
except for h1b, govern the cover layer profile), d and t (which
govern cover layer thickness), and other interactions and
body layer geometries.
The other two model cover layer angles (h1c and h3c)
also had an effect on model motion, though not nearly as
profound as h2c. h1c had a negative effect on calculated
yields, including Dq, Da, and Du/T. h3c had a positive effect
on Dd and negative effect on fFIV and fMOD.
The entrance and exit radii (r1c and r2c) showed similar
effects on all six yields. Increasing either would provide an
increase in Dq, Da, and Du/T. Since large glottal angle dif-
ferences and changes in flow rate are desirable for improving
the motion and increasing sound production, relatively larger
leading and trailing edge radii may be advisable.
Another somewhat influential geometric feature was the
glottal thickness (T), which had a significant or marginally
significant positive effect on Dq, Da, and Du/T. Increasing Thad a significant impact on the phase difference between the
inferior–superior portions of the glottis (similar to h2c), sug-
gesting that increasing T may provide improved mucosal
wave-like motion for physical modeling.
It is interesting to note that three of the body dimensions
r1b, h2b, r2b did not have a major effect on any of the meas-
ured yields. Two body dimensions affected the measured
yields: h1b, which had a positive effect on Dd and Da, and
h3b, which had a positive effect on fFIV and Da. Some of the
unknown interactions had higher overall significance than
several body parameters. Therefore, the interactions of the
cover layer geometries, h1b, and h3b may be important to
model motion and should be investigated.
D. Additional model considerations
As mentioned in the Introduction, one of the primary
motivations for the present study was to investigate the role
of geometric features on the motion of a previously used
synthetic vocal fold model in order to improve its motion.
The results showed that improvements to model motion
could be achieved by changing specific parameters; how-
ever, it is evident that further advances need to be made in
order to yield a synthetic model that exhibits more life-like
motion. The following paragraphs include specific recom-
mendations for further model advances and studies.
The synthetic model that formed the basis for the pres-
ent work has been shown to couple with subglottal acoustics
(Zhang et al., 2006b, using a one-layer model, and Drechsel,
2007, using a two-layer model). However, the vocal folds do
not seem to exhibit significant subglottal acoustic coupling.
It will therefore be important for future synthetic models to
exhibit weaker coupling with subglottal acoustics. Zhang etal. (2006b) showed that when placing vertical restraints on a
one-layer synthetic model, the model vibrated in response to
aerodynamic rather than acoustic coupling. Zhang et al.(2009) further showed that aerodynamic coupling could also
be achieved by reducing the stiffness of a one-layer model.
It is therefore likely that a two-layer model with a much
more flexible cover layer, possibly combined with a stiffer
body layer than what was used in the presently described
work, will yield the desired results in terms of reduced
subglottal acoustic coupling. It is also likely that such a
model will exhibit the added beneficial feature of reduced
inferior–superior displacement during vibration.
Another consideration is that of the model baseline con-
figuration regarding both geometry and stiffness. The geom-
etry considered here is an idealization of that of the vocal
folds. The conclusions reached here regarding parameter sig-
nificance may or may not apply to a model with a different
baseline geometry, such as that described by Sidlof et al.(2008). The same may be said if different body-cover stiff-
ness ratios were to be implemented. For example, a much
more flexible cover would be expected to exhibit much
larger deformation, potentially altering the relative signifi-
cance of geometric factors. Alternatively, a very stiff body
may more significantly increase the relative importance of
body dimensions. It is recommended that such geometric
and material considerations should be explored in the future
using self-oscillating models.
Additional insight could also be obtained by further
investigation of geometric parameters. In the above sections,
parameters that were significant in governing the model’s
vibration were identified. However, the current approach
does not allow for the magnitude of each parameter’s influ-
ence on model vibration, i.e., the sensitivity of model motion
to each parameter’s variation, to be quantified. It also
includes only very limited consideration of the interactions
between parameters. Determination of these effects can be
done via future systematic parametric variation and sensitiv-
ity analysis. Furthermore, investigation of numerous addi-
tional model parameters, such as model depth, prephonatory
glottal width, anterior–posterior geometric parameters, mate-
rial stress-strain nonlinearity, and material anisotropy, may
yield important physical insight.
IV. CONCLUSIONS
In this paper, the influence of geometric parameters on
the flow-induced vibratory response of a simplified vocal
FIG. 12. Normalized summed effects for Dd, Dq, Da, and Du/T.
2130 J. Acoust. Soc. Am., Vol. 129, No. 4, April 2011 B. A. Pickup and S. L. Thomson: Vocal fold model geometric parameters
Downloaded 27 Apr 2011 to 128.187.97.3. Redistribution subject to ASA license or copyright; see http://asadl.org/journals/doc/ASALIB-home/info/terms.jsp

fold model is discussed. It is shown that this model may be
altered geometrically for more favorable (realistic) model
movement, although further improvements are still needed.
Prior research has shown that the intraglottal angle,
vocal fold depth, and vocal fold length significantly influ-
ence vocal fold model motion (Cook and Mongeau, 2007;
Zhang, 2009). The present work considers more geometric
attributes of a simplified model and shows that the geometric
parameters that play the most important role in affecting the
flow-induced vibration frequency, second modal frequency,
phase delay, change in glottal angle during phonation, glottal
area, and flow rate are the cover layer geometries (foremost,
the intraglottal cover layer angle, h2c, followed by h1c, r1c,
h3c, T, r2c, and t), and the inferior and superior glottal angles
of the body (h1b and h3b).
A key aspect of vocal fold movement is the mucosal
wave. Previous geometrically simplified synthetic models
have not displayed this type of motion. The phase delay
measurements here provided a quantitative assessment of
model mucosal wave-like motion; the phase delays calcu-
lated in this work are similar to data obtained using excised
human larynges (Boessenecker et al., 2007). Although an
optimized model was not created in this study, the results
(see Table V) show the potential for creating a model that
has at least a 32.5�/mm phase delay (lateral Du values calcu-
lated by Boessenecker et al. reached a maximum of 89�,which corresponds to a Du/T value of approximately 44.5�/mm). Therefore, previously limited mucosal wave-like fea-
tures on simplified models may be obtainable if these geo-
metric definitions of the cover layer are incorporated.
Further, the present work shows that using a convergent pro-
file will increase intraglottal phase delays and alternating
convergent-divergent glottal angles toward a more accurate
simulation of human vocal fold movement.
The results from this design-of-experiment study do not
reflect the level of influence of each parameter in its entirety.
Therefore, recommended future work includes a full-facto-
rial statistical analysis using the subset of significant parame-
ters identified in this study. This will provide information on
the interaction of significant parameters. Also, it would be
beneficial to perform physical tests on synthetic simplified
models with improved geometric features suggested above
to validate the computational results. Such analysis and test-
ing is suggested so that specific geometric values for each
parameter may be recommended. Further studies over a
wider range of parameter values, including three-dimen-
sional geometric parameters, and exploration and develop-
ment of anisotropic modeling materials and models with
reduced subglottal acoustic coupling are also strongly
recommended.
Finally, it is here stressed that these results are applica-
ble to the two-layer vocal fold models referenced herein,
which are clearly simplified representations of the human
vocal folds. Because of differences between these models
and the human vocal folds (e.g., material stiffness, material
anisotropy, geometry, and weaker acoustic coupling in the
human case), the results of the present study may not
necessarily directly apply to human vocal fold vibration.
Consequently, the primary utility of these results lies in
contributing toward the development of synthetic (and possi-
bly computational) models with more realistic life-like
motion, rather than conclusions regarding the role of geome-
try on human vocal fold vibration. Regarding the latter issue,
however, the methodology used in the present study may be
useful in future studies aimed at exploring the influence of
specific vocal fold geometric features on human phonation.
ACKNOWLEDGMENTS
This work was supported by Grant R01 DC005788 from
the National Institute on Deafness and Other Communication
Disorders (Dr. Luc Mongeau, PI; Subcontract to Brigham
Young University through McGill University).
ADINA (2009). ADINA Theory and Modeling Guide Vol. III: ADINA CFD
& FSI, (ADINA R&D, Inc.), pp. 35–36.
Agarwal, M., Scherer, R. C., and Hollien, H. (2003). “The false vocal folds:
Shape and size in frontal view during phonation based on laminagraphic
tracings,” J. Voice 17, 97–113.
Becker, S., Kniesburges, S., Muller, S., Delgado, A., Link, G., Kaltenbacher,
M., and Dollinger, M. (2009). “Flow-structure-acoustic interaction in a
human voice model,” J. Acoust. Soc. Am. 125(3), 1351–1361.
Bless, D., Hirano, M., and Feder, R. (1987). “Videostroboscopic evaluation
of the larynx,” Ear Nose Throat J. 66, 289–296.
Boessenecker, A., Berry, D. A., Lohscheller, J., Eysholdt, U., and Doellin-
ger, M. (2007). “Mucosal wave properties of a human vocal fold,” Acta
Acust. Acust. 93, 815–823.
Chan, R. W., Titze, I. R., and Titze, M. R. (1997). “Further studies of phona-
tion threshold pressure in a physical model of the vocal fold mucosa,” J.
Acoust. Soc. Am. 101(6), 3722–3727.
Cook, D. D., and Mongeau, L. (2007). “Sensitivity of a continuum vocal
fold model to geometric parameters, constraints, and boundary con-
ditions,” J. Acoust. Soc. Am. 121(4), 2247–2253.
Cook, D. D., Nauman, E., and Mongeau, L. (2009). “Ranking vocal fold
model parameters by their influence on modal frequencies,” J. Acoust.
Soc. Am. 126(4), 2002–2010.
Doellinger, M., and Berry, D. A. (2006). “Visualization and quantification
of the medial surface dynamics of an excised human vocal fold during
phonation,” J. Voice 20(3), 401–413.
Drechsel, J. S. (2007). “Characterization of synthetic self-oscillating vocal
fold models,” M.S. Thesis, Brigham Young University, Provo, Utah.
Drechsel, J. S., and Thomson, S. L. (2008). “Influence of supraglottal struc-
tures on the glottal jet exiting a two-layer synthetic, self-oscillating vocal
fold model,” J. Acoust. Soc. Am. 123(6), 4434–4445.
Keshtiban, I., Belblidia, F., and Webster, M. (2009). “Compressible FlowSolvers for Low Mach Number Flows—A Review,” Institute of Non-New-
tonian Fluid Mechanics, Department of Computer Science, University of
Wales, Swansea, SA2 8PP, UK.
Lawson, J., and Erjavec, J. (2001). Modern Statistics for Engineering andQuality Improvement, 1st ed. (Wadsworth Group, Duxbury, Pacific Grove,
CA), p. 759.
Li, S., Scherer, R. C., Wan, M., Wang, S., and Wu, H. (2006). “Numerical
study of the effects of inferior and superior vocal fold surface angles on
vocal fold pressure distributions,” J. Acoust. Soc. Am. 119(5), 3003–3010.
Misun, V., Svancara, P., and Vasek, M. (2011). “Experimental analysis of
the characteristics of artificial vocal folds,” J. Voice (in press).
Nanayakkara, I. (2005). “Vocal fold superior and inferior angles measured
from radiographic images,” M.S. Thesis, Bowling Green State University,
Bowling Green, OH.
Neubauer, J., Zhang, Z., Miraghaie, R., and Berry, D. A. (2007). “Coherent
structures of the near field flow in a self-oscillating physical model of the
vocal folds,” J. Acoust. Soc. Am. 121(2), 1102–1118.
Pickup, B. A., and Thomson, S. L. (2009). “Influence of asymmetric stiff-
ness on the structural and aerodynamic response of synthetic vocal fold
models,” J. Biomech. 42, 2219–2225.
Pickup, B. A., and Thomson, S. L. (2010). “Flow-induced vibratory
response of idealized vs. magnetic resonance imaging-based synthetic
vocal fold models,” J. Acoust. Soc. Am. 128(3), EL124–EL129.
Scherer, R. C., Shinwari, D., De Witt, K. J., Zhang, C., Kucinschi, B. R.,
and Afjeh, A. A. (2001a). “Intraglottal pressure profiles for a symmetric
J. Acoust. Soc. Am., Vol. 129, No. 4, April 2011 B. A. Pickup and S. L. Thomson: Vocal fold model geometric parameters 2131
Downloaded 27 Apr 2011 to 128.187.97.3. Redistribution subject to ASA license or copyright; see http://asadl.org/journals/doc/ASALIB-home/info/terms.jsp
and oblique glottis with a divergence angle of 10 degrees,” J. Acoust. Soc.
Am. 109(4), 1616–1630.
Scherer, R. C., De Witt, K. J., and Kucinschi, B. R. (2001b). “The effect of
exit radii on intraglottal pressure distributions in the convergent glottis,” J.
Acoust. Soc. Am. 110(5), 2267–2269.
Sidlof, P., Svec, J. G., Horacek, J., Vesely, J., Klepacek, I., and Havlik, R.
(2008). “Geometry of human vocal folds and glottal channel for mathe-
matical and biomechanical modeling of voice production,” J. Biomech.
41(5), 985–995.
Stiblar-Martincic, D. (1997). “Histology of laryngeal mucosa,” Acta Oto-
laryngol. 527, 138–141.
Tayama, N., Chan, R., Kaga, K., and Titze, I. R. (2002). “Functional defini-
tions of vocal fold geometry for laryngeal biomechanical modeling,” Ann.
Otol. Rhinol. Laryngol. 111, 83–92.
Thomson, S. L., Mongeau, L., and Frankel, S. H. (2005). “Aerodynamic
transfer of energy to the vocal folds,” J. Acoust. Soc. Am. 118(3),
1689–1700.
Titze, I. R. (2006). The Myoelastic Aerodynamic Theory of Phonation(National Center for Voice and Speech, Iowa City, Iowa), p. 19.
Titze, I. R., Jiang, J. J., and Hsiao, T. (1993). “Measurement of mucosal
wave propagation and vertical phase difference in vocal fold vibration,”
Ann. Otol. Rhinol. Laryngol. 102, 58–63.
Titze, I. R., Schmidt, S. S., and Titze, M. R. (1995). “Phonation threshold
pressure in a physical model of the vocal fold mucosa,” J. Acoust. Soc.
Am. 97(5), 3080–3084.
Zhang, Z. (2008). “Influence of flow separation location on phonation
onset,” J. Acoust. Soc. Am. 124(3), 1689–1694.
Zhang, Z. (2009). “Characteristics of phonation onset in a two-layer vocal
fold model,” J. Acoust. Soc. Am. 125(2), 1091–1102.
Zhang, Z., Neubauer, J., and Berry, D. A. (2006a). “The influence of sub-
glottal acoustics on laboratory models of phonation,” J. Acoust. Soc. Am.
120(3), 1558–1569.
Zhang, Z., Neubauer, J., and Berry, D. A. (2006b). “Aerodynamically and
acoustically driven modes of vibration in a physical model of the vocal
folds,” J. Acoust. Soc. Am. 120(5), 2841–2849.
Zhang, Z., Neubauer, J., and Berry, D. A. (2009). “Influence of vocal fold
stiffness and acoustic loading on flow-induced vibration of a single-layer
vocal fold model,” J. Sound Vib. 322, 299–313.
2132 J. Acoust. Soc. Am., Vol. 129, No. 4, April 2011 B. A. Pickup and S. L. Thomson: Vocal fold model geometric parameters
Downloaded 27 Apr 2011 to 128.187.97.3. Redistribution subject to ASA license or copyright; see http://asadl.org/journals/doc/ASALIB-home/info/terms.jsp