identification of blood protein biomarkers of acute liver
TRANSCRIPT
Identification of Blood Protein Biomarkers of Acute Liver Injury by Targeted Quantitative
Proteomics in Acetaminophen and Carbon tetrachloride treated Mouse Models and
Acetaminophen Overdose Patients
RUNNING TITLE: Blood biomarkers for drug-induced liver injury
Shizhen Qin1, Yong Zhou
1, Li Gray
1, Ulrike Kusebauch
1, Laurence McEvoy
3, Daniel J Antoine
3,
Lucy Hampson3, Kevin B Park
3, David Campbell
1, Juan Caballero
1, Gustavo Glusman
1, Xiaowei
Yan1, Taek-Kyun Kim
1, Yue Yuan
1, Kai Wang
1, Lee Rowen
1, Robert L Moritz
1, Gilbert S
Omenn1,2
, Munir Pirmohamed 3* and Leroy Hood
1*
1. Institute for Systems Biology, USA
2. Departments of Computational Medicine & Bioinformatics, Internal Medicine, an Human
Genetics and School of Public Health, University of Michigan, USA
3. Institute of Translational Medicine at University of Liverpool, England
*To whom correspondence should be addressed:
Dr. Leroy Hood, (MD, PhD, Professor, President) Institute for Systems Biology, 401
Terry N, Seattle WA, 98109-5234 USA; Email: [email protected]; Fax:
206 732 1299
Dr. Munir Pirmohamed (FRCP, PhD, Professor, Director), MRC Centre for Drug Safety
Science, University of Liverpool, Block A: Waterhouse Building, 1-5 Brownlow Street,
Liverpool L69 3GL; Email: [email protected]; Fax +44 151 7945059
2
ABSTRACT:
Organ-enriched blood proteins, those produced primarily in one organ and secreted or exported
to the blood, potentially afford a powerful and specific approach to assessing diseases in their
cognate organs. In this paper, we demonstrate that quantification of organ-enriched proteins in
the blood offers a new strategy to find biomarkers for diagnosis and assessment of drug-induced
liver injury (and presumably the assessment of other liver diseases). We used selected reaction
monitoring (SRM) mass spectrometry to quantify 81 liver-enriched proteins plus three
aminotransferases (ALT1, AST1, and AST2) in plasma of C57BL/6J and NOD/ShiLtJ mice
exposed to acetaminophen or carbon tetrachloride. Plasma concentrations of 49 liver-enriched
proteins were perturbed significantly in response to liver injury induced by one or both toxins.
We validated four of these toxin-responsive proteins (ALDOB, ASS1, BHMT and GLUD1) by
Western blotting. By both assays, these four proteins constitute liver injury markers superior to
currently employed markers such as ALT and AST. A similar approach was also successful in
human serum where we had analyzed 66 liver-enriched proteins in acetaminophen overdose
patients. Of these, 23 proteins were elevated in patients; 15 of 23 overlapped with the
concentration-increased proteins in the mouse study. A combination of 5 human proteins, AGXT,
ALDOB, CRP, FBP1, and MMP9, provides the best diagnostic performance to distinguish
acetaminophen overdose patients from controls (sensitivity: 0.85, specificity: 0.84, accuracy:
85%). These five blood proteins are candidates for detecting acetaminophen-induced liver injury
using next-generation diagnostic devices (e.g, microfluidic ELIZA assays).

3
KEYWORDS: liver-enriched proteins, selected reaction monitoring, drug-induced liver injury,
acetaminophen, biomarker panel
4
INTRODUCTION
Adverse effects associated with therapeutic drugs are a serious health concern and a costly
challenge for healthcare systems. Many drug-induced adverse effects target the liver due to their
immediate exposure through first-pass pharmacokinetics and the liver’s active roles in
metabolizing xenobiotics. For example, overexposure to acetaminophen (N-acetyl-p-
aminophenol, APAP), a widely used analgesic and antipyretic agent, is a leading cause of acute
hepatic failure and the second most common reason for liver transplantation in the United States
(1-3). To protect consumers from the risk of severe liver damage from APAP overdoses, the
FDA recommended discontinuation of prescription drug products containing more than 325 mg
of APAP (FDA Drugs_Drug Safety and Availability_20140114). Besides therapeutics,
environmental toxins can also cause significant liver injury; for example, the use of the cleaning
agent carbon tetrachloride (CCl4) and many other halogenated alkanes has been severely
restricted due to their liver toxicity.
To assess probable injury to an organ, it is important to monitor biologic materials that originate
exclusively or primarily in that organ, in this case, liver-enriched proteins. A gene (and hence
protein) is considered to be organ-enriched if its transcript abundance in that organ is >10-fold
higher than the maximal values of gene expression in any other tissues assessed. For decades,
cellular integrity indicators, such as levels of the transaminases, alanine aminotransferase (ALT,
GPT) and aspartate aminotransferase (AST, GOT) in serum, have been used to reflect liver
injury. However, use of these enzymes as surrogate markers of liver injury is not ideal. Since
they are ubiquitously expressed at similar levels in multiple organs, an interpretation of their

5
change in levels in blood in response to a toxin can be complicated as a consequence of these
enzymes originating from many tissues other than liver. For example, on the second day
following a myocardial infarction, 98% of patients have higher levels of AST activity in blood
(4). In addition to the fact that a particular enzyme may be heavily expressed in several different
tissues, the existence of isozymes, often distributed differently among different tissues, may
further complicate their measurements as, in laboratory tests, the combined activities of all
isozymes are usually measured. Indeed, the AST protein is encoded in humans as two
orthologous genes; AST1 is highly expressed in heart, muscle, brain, liver and kidney, while
AST2 is more highly expressed in heart and skeletal muscle and a few other organs than in liver.
Any injury to these tissues will cause elevated AST activity in the blood. ALT is more liver-
enriched than AST, with an estimated two-fold higher transcript concentration in liver than in
any other organ (Illumina Body Map). However, the distribution of two ALT isozymes, ALT1
and ALT2, is analogous to the AST isozymes with significant abundances represented across
multiple organs, e.g., muscle, heart, liver and pancreas. Separating the two different forms of
ALT is possible by isozyme-specific antibodies (5), but this test is not widely used in clinical
laboratories. The short half-lives of circulating ALT (47 hours) and AST (17 hours) activities
further limit their use in detecting drug-induced liver injury (6). Other enzymes such as alkaline
phosphatase (ALP), gamma-glutamyl transpeptidase or transferase (GGT), KRT18 (keratin-18,
full-length FL-K18, M65 and the caspase-cleaved fragment cK-K18, M30) and High Mobility
Group Box-1 (HMGB1) have been reported as potential markers for APAP-induced liver injury
(7, 8). However, none of these proteins is liver-enriched; accordingly, they do not specifically
reflect hepatic injury.

6
In addition to protein markers, the levels of specific circulating RNAs such as the liver-enriched
microRNA miR-122, and liver-specific transcripts, including those encoding albumin and
transferrin, have been reported as blood biomarkers for reflecting liver injuries (9, 10). However,
the clinical performance of these RNA-based blood biomarkers is yet to be determined.
Selected Reaction Monitoring (SRM), a targeted mass spectrometry-based proteomic approach
that has molecular specificity and performs at high-sensitivity, is particularly powerful in
quantifying a predetermined set of proteins in a complex mixture of proteins such as blood
across a multitude of samples (11-13). We identified liver-enriched transcripts and then
employed SRM analyses to determine which could be detected in blood. To identify more
informative protein biomarkers that reflect liver injury, we adapted SRM to interrogate the levels
of liver-enriched proteins in plasma collected from mice that have been exposed to APAP or
CCl4. This strategy was further tested in human serum as a means of identifying potential
biomarkers to reflect liver injury from APAP-overdosed patients.
MATERIALS AND METHODS
Animals, drug treatment and plasma preparation
All work involving live animals was conducted under Institutional Animal Care and Use
Committee (IACUC) approved protocols (10-00 series) with an assurance on file with the Office
of Laboratory Animal Welfare (OLAW Assurance #A4355-01) and is accredited by the
Association for Assessment and Accreditation of Laboratory Animal Care (AAALAC
Accreditation #001363). All animal work was performed in our pathogen-free (SPF) vivarium

7
facility.
Female C57BL/6J (B6, stock number 000664) and NOD/ShiLtJ (NOD, stock number 001976)
mice at 8 weeks of age were purchased from Jackson Laboratory (Bar Harbor, Maine). Animals
were injected intraperitoneally (ip) with a single dose of 375 mg/kg of PBS-dissolved
acetaminophen (BioXtra, ≥99.0% pure, Sigma Aldrich) or 1ml/kg of CCl4 (anhydrous, ≥99.5%
pure, Sigma-Aldrich) 1:10 (v/v) diluted in sterile corn oil. These doses were based on pathology
examinations from pilot tests and are in similar dosage ranges with other studies (14-17). Vehicle
groups received the same volume of PBS (APAP) or corn oil (CCl4). No-treatment controls for
each mouse strain were included. In the APAP model system, mice were fasted for 24 hours
before injection. The detailed procedures are summarized in Supplementary Table 1. Plasma was
collected and prepared following Tammen’s protocol (18). Briefly, blood samples were
centrifuged at 1,300 X g for 10 minutes at room temperature followed by a second centrifugation
of the supernatant at 2,500 X g for 15 minutes. Plasma samples were stored at -80°C without
proteinase inhibitors. Livers from sacrificed animals were excised and stored at -80°C with a
section of each liver preserved in 10% buffered formalin for H&E staining.
Liver injury assessment in APAP and CCl4 mouse models
The degree of liver injury in mice was assessed by ALT and AST enzyme activities (19, 20) and
histology H&E staining (detailed procedures in Supplementary Materials).
Plasma acetaminophen concentration measurement
Plasma APAP concentrations in mice were measured with an acetaminophen ELISA kit that
8
shows less than 2% cross reactivity toward similar compounds such as procainamide (Neogen
Corporation, Lexington, KY). Because it is a competitive ELISA assay, the extent of color
development is inversely proportional to the concentration of APAP in samples that were
determined with a standard curve.
Liver total glutathione and GSH/GSSG ratio in mice after fasting
Total liver glutathione and GSH/GSSG ratios were measured with GSH/GSSG-Glo assay, a
luminescence-based system for the detection and quantification of total glutathione (GSH
+GSSG) and GSH/GSSG ratios (Promega, Madison, WI). Five female NOD mice, 8 weeks of
age, were fasted for 24 hours similarly to the APAP-treated group described. Liver samples were
collected at the end of fasting, tissue lysates prepared and tested following the manufacturer’s
instructions.
Human APAP overdose patient samples
We conducted a prospective study where patients admitted to the Royal Liverpool University
Hospital (UK) with acetaminophen overdose were recruited after providing written informed
consent. The study was approved by the Liverpool Local Research Ethics Committee. Patients
presented at various times after their overdose and had taken differing amounts of
acetaminophen. According to treatment guidelines in the UK, these patients were treated with N-
acetylcysteine (NAC) if the acetaminophen levels were above the treatment threshold lines.
Some patients presented with a staggered overdose (ingestion of multiple doses of APAP over a
period of >1 hour), and, as per guidelines, they were treated irrespective of serum acetaminophen
levels. In every case, a first blood sample was drawn and ALT level tests were performed before

9
NAC treatment. The ALT levels (reference range females <35 IU/L, males <40 IU/L) recorded
in the patients varied according to the amount of acetaminophen taken and the time of
presentation after the overdose. Detailed information on the 14 patients studied is summarized in
Supplementary Table 2. We also analysed control serum samples taken from healthy volunteers
who had not consumed any acetaminophen for at least 2 weeks prior to recruitment.
Human and mouse sample preparation for SRM
To reduce the protein complexity, fourteen highly abundant blood proteins (HAP) were depleted
from each plasma or serum sample using an AKTA FPLC (fast protein liquid chromatography)
system (GE Healthcare, USA) coupled with a custom-ordered mouse IgY14 LC5 column or a
human IgY14 LC2 depletion column (Sigma-Aldrich, USA), respectively. All control and
treated samples were processed similarly with about 90% of the total protein depleted from
mouse, or 95% removed from human samples. Depleted samples were digested with trypsin and
desalted with Oasis MCX cartridges (Waters, Milford, MA) as previously described (21).
Preparation of liver tissue samples for SRM analysis
Mouse liver tissues kept at -80 C were lysed and homogenized in lysis buffer (1:10 g/ml) (0.1%
SDS in 100 mM sodium phosphate buffer, pH7.5 with protease inhibitor cocktail from
Sigma/Pierce) in a PreCellys homogenizer at speed of 6,500 rpm for 3 X 45 seconds in a cold
room. The homogenizing program was repeated once. Supernatant fraction was collected after
spinning for 10 min at 14,000 X g at 4°C. Extracted liver proteins in the supernatant were
digested with trypsin and desalted with MCX cartridge.

10
Mass spectrometry
All SRM analyses were performed on the Agilent 6460 (mouse) and 6490 (human, replaced
6460 after mouse study) triple quadrupole (QQQ) mass spectrometers. Both mass spectrometers
were equipped with a ChipCube nano-HPLC device. An Agilent HPLC chip (Cat # G4240-
62101, large capacity 160 nL trap, 150 mm C18 column) was used for peptide separation. Spray
voltage was set at 1800 V. A 2µg sample aliquot of depleted serum, plasma or liver lysate was
loaded and eluted over a 60-minute gradient with 0.66% per minute acetonitrile slope in the
presence of 0.1% formic acid. Peptides were analyzed in dynamic SRM mode with 4-15 minutes
retention time window according to number of concurrent transitions. The cycle time was set at
2500 ms.
Building the mouse and human liver-enriched protein list
Liver-enriched proteins for mouse and human were generated respectively with multiple
microarray and RNA-Seq body-map datasets, including BioGPS, NCBI/GEO, Illumina Body
Map and in-house ISB human-tissue atlas (Supplemental Materials). From the liver-enriched
transcripts, we identified the candidate blood liver-enriched proteins that could be quantified
with SRM mass spectrometry.
SRM method generation and optimization
As described previously (21), target peptides and transitions were selected to ensure they are
proteotypic (specific) to the protein of interest. ISB in-house proteomics databases, e.g.,
PeptideAtlas for mouse (22) and SRMAtlas for human (23), were used to facilitate this process.

11
Of all the peptides (about 130 for each species) we only have 6 peptides that are common for the
same protein between human and mouse. A three-step optimization procedure was conducted to
identify the best-performing 2 peptides for each protein and top 4 transitions for each peptide
(Supplemental Materials). The numbers of proteins and peptides in each step are summarized in
Supplementary Table 3. Final SRM methods applied for the 52 mouse and 66 human proteins are
summarized in Supplementary Table 4 sheet 1 (human) and sheet 2 (mouse)
Crude unpurified peptide standards were synthesized with heavy isotopic lysine (13
C615
N2) or
arginine (13
C615
N4) at the C-termini (heavy PEPscreen® peptides, Sigma-Aldrich, St. Louis, MO,
USA). SRM conditions including collision energy (CE, vendor-provided default formula
CE=0.036*m/z − 4.8 for 6460 and CE=0.036*m/z – 7.3 for 6490) were optimized with heavy
labeled synthetic peptides and titration curves were generated for each peptide. The proper spike-
in amount of heavy peptides was determined to reach an L/H ratio within ± 10 fold in most
samples. Characterization of titration curves of the heavy peptide standards from the 5 best
classifier proteins in the human APAP overdose study is shown in Supplementary Figure 1.
SRM samples and data analysis and statistics
In the mouse study, two mice (#1 and #2) were analyzed for each time point, except for the 8h
and 24h time points in the APAP model, in which 3-4 mice were monitored. In the human study,
all 12 healthy volunteer and 14 patient samples were analyzed. Duplicate mass spectrometry runs
were performed for each sample.
SRM data were processed using the Skyline targeted proteomics environment (24). The total
peak area and Light/Heavy (L/H) ratio of each peptide were exported and normalized to the

12
original blood volume. An algorithm similar to that used in a proteomic characterization of
pulmonary nodules study (25) was developed to evaluate how well each protein was able to
predict liver toxicity induced by APAP or CCl4 and to identify the best classifiers. Classification
performance of protein panels was estimated with support vector machine (SVM). Using the
LibSVM package built in the Waikato Environment for Knowledge Acquisition (WEKA)
version 3.6.11, a non-linear SVM classifier with radial basis kernel function was constructed.
WEKA's default settings were used for all parameters including a hyperparameter and a marginal
value. To compute the classification accuracy and probability estimates, a 10-fold cross
validation approach was performed. Based on the probability estimates, ROC (Receiver
Operating Characteristic) curve and the area under the curve (AUC) were generated with the
MedCalc toolbox in Matlab. All other analyses, including t-test and all graphics, were generated
by Microsoft Excel, MultiExperiment Viewer (MeV) (26) or Prism 5 (GraphPad Software, La
Jolla, CA, USA).
Western blotting
Aliquots of 0.5µl serum or plasma (not depleted) from human or mice samples were loaded on 4-
12% SDS-PAGE Bis-Tris gels (Life Technologies, Grand Island, NY USA). Following
separation, the proteins were transferred to PVDF membrane using an iBlot® dry blotting system
from Life Technologies and probed overnight at 4ºC with primary antibodies. After washing
with TBS-T (0.1% Tween 20 in TBS), membranes were incubated with HRP-conjugated
secondary antibodies for 1 hour at room temperature. Detection was carried out by enhanced
chemiluminescence (Thermo Scientific, Rockford, IL) with a CCD camera (ProteinSimple, Santa
Clara, CA). The images were analyzed using ImageJ. Commercial antibodies were ordered from

13
Protein Tech group (ALT1, AST1, AST2, ASS1, BHMT, CRP and GLUD1, Chicago, IL),
Epitomics (ALDOB, Burlingame, CA), ABNOVA (FBP1, Taipei, Taiwan) and Cell Signaling
(MMP9, Danvers, MA), respectively.
RESULTS
Significant drug-response variations were seen in APAP-treated but not in CCl4-treated
mice
Liver injury in mice induced by a single i.p. injection of hepatotoxins APAP or CCl4 was initially
assessed by ALT and AST enzyme activities in plasma, and later confirmed by histological
examination. In APAP-treated mice, the plasma ALT and AST activities peaked 8 to 24 hours
post-treatment in NOD and 24 to 48 hours for B6 mice, respectively. In CCl4 exposed mice, the
peak times were slightly delayed compared with APAP - 24 hours for NOD and 48 hours for B6
mice, respectively. In the CCl4-exposed mouse model, the toxin-responsive variations measured
by ALT and AST activities were small among mice in both strains; however, significant
variations were observed in the APAP-treated groups. For example, at the peak time point (8h), a
greater than 80-fold difference in ALT activity was observed between hyper-responsive (mouse
8h2 – mouse #2 at 8 hour) and hypo-responsive (8h1) NOD mice. Similar results were observed
among APAP-treated B6 mice. In all cases, the levels of ALT and AST levels were parallel to
each other (Figure 1A). Histopathological examination (H&E staining) showed typical toxin-
responsive zone III centrilobular necrosis as described by Davidson (27) and Boyd (28) in
animals from the APAP and CCl4-treated groups; the severity of liver injury based on

14
histopathology analysis agrees with the relative changes ALT and AST activities measured in
plasma (Figure 1B and 1C).
Plasma APAP concentrations are similar in mice with different degrees of toxic responses
Blood APAP concentrations and ALT activities were measured in five NOD and five B6 mice at
3h and 8h time points. In both NOD and B6 mice, APAP can be detected in plasma 3 hours after
drug administration. In all 5 animals tested in both strains, similar APAP levels were observed
regardless of their difference in blood ALT activities in both strains. For example, APAP levels
in NOD mice range from 89 to 111 g/mL while ALT activity ranges from 54 to 212 IU/L;
similarly, APAP levels in B6 mice range from 33 to 52 g/mL while ALT activity ranges from
102 to 1242 IU/L from the hypo-responder to the hyper-responder. There was no positive
correlation between plasma APAP concentration and ALT activity in the blood (Supplementary
Table 5). At 8 hours post injection, plasma APAP concentrations in all tested animals fell back to
zero in both strains.
Liver total glutathione content and GSH/GSSG ratios are similar after fasting in mice
Another possible explanation for the individual differences in response to APAP treatment is the
liver level of dithiolthiones, specifically glutathione (GSH), a key detoxification compound that
neutralizes toxic APAP or CCl4 metabolites in the liver (29, 30). The levels of GSH and the
ratios of GSH/GSSG (oxidized form of GSH) were measured in five NOD mice livers at 24
hours after fasting. No significant inter-individual differences were observed in either total
glutathione levels (from 4.90 to 5.79 nmole/mg liver, relative standard deviation RSD =6.8%) or
GSH/GSSG ratios (from 45.4 to 49.8, RSD=3.4%) among the 5 mice (Supplementary Table 6).
Forty-nine informative proteins distinguish APAP or CCl4-treated mice from controls

15
Responses to APAP and CCl4 in both B6 and NOD strains were similar except that the NOD
strain was more responsive to both hepatotoxins as evidenced by earlier response time and higher
ALT and AST enzyme activities compared to baseline values. Therefore, subsequent work, i.e.,
SRM proteomics and Western Blotting, focused on the NOD strain. Of the 52 proteins
successfully measured in both APAP and CCl4 treated mice, we identified 49 informative
proteins (including known liver toxicity markers AST and ALT which are not liver-enriched)
with plasma levels reproducibly changed in response to APAP or CCl4 induced liver injuries. Of
these, 25 (including AST and ALT) showed concentration increases and 22 demonstrated
concentration decreases in plasma after either APAP (responsive animals) or CCl4 treatment. In
APAP-treated animals, two protease inhibitor components, inter-alpha-trypsin inhibitor heavy
chain 2 and 3 (ITIH2 and ITIH3), showed decreased plasma concentrations at pre- or peak
response time (ITIH2, 3 and 8h time points, p=0.0002; ITIH3, 3, 8, 24h time points, p=0.0008).
However, no concentration decreases were observed in CCl4 treated mice at pre- or peak
response time points (3 to 48h). Accordingly these two proteins may permit one to distinguish
liver toxicities due to APAP exposure from those arising from CCl4 exposure. Liver tissue SRM
results were also compared (Table 1). The other liver-enriched proteins were not affected by
drug treatment.
Plasma ALT and AST enzyme activities after APAP treatment paralleled each other with a
Pearson’s correlation coefficient of 0.97. When plotted against ALT enzyme activities, most of
the 25 proteins with increased plasma concentrations measured by SRM correlated with ALT
(thick black line) and AST (thick red line) activities (correlation coefficient r = 0.50 - 0.98,
average 0.83) (Figure 2). Some proteins with lower r values did not correlate as well with ALT

16
enzyme activity after APAP insult. For example, plasma concentrations of GLUD1 in hyper-
responders remained elevated up to 96 hours (183X control average) post APAP treatment when
ALT enzyme activities dropped back to baseline level. Its prolonged elevation implies that
GLUD1 may better reflect APAP-induced liver injury than ALT or AST activities due to the fact
that the hepatopathology induced by APAP exposure remains 96 hours after treatment. In
addition to GLUD1, other proteins with low r values may potentially serve as better markers than
ALT or AST for early detection (Figure 2A). Similar results were observed in CCl4 treated NOD
mice with Pearson correlation coefficient ranging from 0.66 to 0.95 and an average of 0.86
(Figure 2B). In both APAP and CCl4 NOD mouse models, the plasma levels of 12 proteins
(AGXT, ALDOB, ASS1, BHMT1, DPYS, FAH, GLUD1, GNMT, IDH1, MAT1A1, MDH1 and
UBP1) proved to be better indicators (in terms of fold change) than ALT or AST, for early (3
and/or 8 hours) and extended detection (72 and/or 96 hours) of APAP- and CCl4- induced liver
injury.
Validation by Western Blotting
To validate proteins that showed better performance than ALT or AST in reflecting the status of
drug-induced liver injury, especially at early (3 and/or 8 hours) or late (72 and/or 96 hours) time
points, we tested a number of antibodies specific for some of the liver-enriched proteins in
Western blotting. Only antibodies against BHMT1, ALDOB, ASS1, and GLUD1 worked well in
mouse plasma samples. All these proteins showed good correlations between the Western blot
and SRM measurements. For example, in APAP treated NOD mice, despite clear microvesicular
injuries indicated by histopathological examination at 3 hours post acetaminophen exposure,
elevation of ALT and AST activities in plasma were not reliably detected. However, at the same
time point ALDOB, ASS1 and BHMT were significantly elevated and detected clearly by SRM

17
as well as by Western blot. Differences in the levels of GLUD1, ASS1 and BHMT could also be
readily detected at 96 hours post exposure when the ALT and AST levels declined rapidly to the
normal range. GLUD1 in plasma could be detected as late as 144 hours post treatment by WB
(Table 2A). Similarly, at 3 hours post CCl4 treatment, while the ALT level increased slightly (76
IU/L, a 1.8 fold change over control average) and AST level showed no change. However,
histopathology showed centrilobular microvesicular changes in the liver and meanwhile, plasma
BHMT protein elevated from undetectable to a 40-fold increase over background level measured
by SRM and later confirmed by Western blotting. The CCl4 induced injuries extended beyond
144 hours based on our histopathology observations. Accordingly, elevations of ASS1 and
GLUD1 protein were still reliably detected at 144 hours by Western analyses, whereas ALT and
AST activities were only detectable at the 24-hour time point post exposure (Table 2B).
Identifying serum biomarkers to reflect liver injury associated with APAP overdose in
human patients by SRM
To explore the possibility of using a similar approach to discover more effective serum
biomarkers for liver toxicity, we monitored 66 liver-enriched proteins by SRM in sera from 14
APAP overdose patients and 12 controls. The 66 proteins are represented by 124 proteotypic
peptides. We identified 23 proteins, including ALT and AST, with elevated levels (3 fold or
higher) in APAP overdosed patients (Supplementary Table 7), over a wide range of times from
the point of acute overdose. Five patients, LIV003, LIV004, LIV007, LIV013 and LIV014 were
identified with higher than normal (female > 35IU/L, male > 40IU/L) ALT enzyme activity in
serum. AST enzyme activities were not tested in patients. The results from SRM-based
measurement showed only 3 of the 14 APAP overdose patients, LIV004, LIV013 and LIV014,

18
had higher than normal levels of ALT, AST1 and AST2. These differences of detection
sensitivities on ALT and ASTs may be explained by the fact that ALT enzyme activities were
analyzed on the same day samples were collected while SRM tests were performed 1 to 3 years
later. Also, we defined a 3-fold increase as significant in the SRM tests.
For the remaining 43 proteins, no significant changes were observed in patients compared with
controls, although 22 mouse orthologous proteins showed decreased plasma concentrations in
APAP mouse model (Table 1).
The elevation of 23 proteins was observed in 12 of the 14 APAP overdose patients (except for
patients LIV005 and LIV010) while ALT and AST protein levels were up only in 3 patients
(patients LIV004, LIV013 and LIV014) by SRM (Supplementary Table 7). Multivariate
statistical analysis revealed 5 human proteins: AGXT, ALODB, CRP, FBP1 and MMP9, that
constituted a classifier panel that separated APAP overdose patients from healthy volunteers
(Figure 3A) with an area under curve (AUC) of 0.84 (sensitivity 0.85, specificity 0.84 and
accuracy 85%). For comparison, a combination of the two known liver markers ALT1 and AST1
reached an AUC of 0.46 (sensitivity 0.54, specificity 0.50 and accuracy 54%), adding ALT and
AST to the 5-protein panel did not improve its diagnostic performance (Figure 3B). We tested
the 7 aforementioned mouse antibodies and found antibodies against ALDOB and CRP worked
well on human sera. Results showed good consistency between the SRM measurements and WB
images (Figure 3C).
DISCUSSION
19
Finding blood biomarkers to reflect the status of specific pathological conditions has been a
major focus in academia and industry. Various high throughput approaches have been applied to
gain comprehensive molecular profiles, although there have been few successes translating the
findings to clinically useful biomarkers (31). In developing diagnostic markers, the most
common scheme is first to create a candidate panel by discovering molecules relevant to disease
condition, assess the panel’s diagnostic performance, and then validate the panel on a different
set of samples (31). In order to discover markers that represent biological networks and hence
could be employed as proxies for toxin-perturbed changes in their cognate networks in a
particular organ, we employed a different strategy by focusing on proteins enriched in disease-
associated organs. We identified 131 liver-enriched proteins for mouse by comparative organ-
riched transcript analyses, then determined which of the proteins encoded by these transcripts
could be detected in the blood and finally measured the concentration changes of these proteins
by SRM in plasma samples from toxin-exposed mice. The same strategy was also used in serum
samples from acetaminophen overdose patients.
Based on blood aminotransferase activity and histopathology examination, we observed inter-
strain as well as inter-individual variations within the same strain in response to APAP treatment.
Inter-strain variation in response to APAP is well documented, for example Harrill and
colleagues reported a greater than 20-fold serum ALT concentration difference at 24 hour post
drug administration amongst different mouse strains. In addition, the authors demonstrated that
genetic variation in the gene orthologous to CD44 in human is associated with susceptibility to
acetaminophen toxicity in two independent cohorts (32). In this study, we observed both inter-
and intra- strain variations among NOD and B6 mice in response to APAP treatment that cannot

20
be explained by genetic heterogeneity. Even though not specifically discussed, data from some
prior reports showed similar or greater inter-individual variations in ALT or AST activities in the
mouse strain tested (32-34). Based on the similar blood APAP levels and glutathione
reduced/oxidized state (GSH/GSSG) ratios in the livers from hypo-responsive and hyper-
responsive individuals, we conclude that the observed inter-individual variation is not due to
drug administration errors or differences in the glutathione content in liver, a key detoxification
compound. Also, our study showed that female mice displayed similar degree of inter-individual
variation as male mice in prior APAP toxicity studies. Thus, we can exclude the possibility of
female specific biological features such as the menstrual cycle that may contribute to the
difference in APAP response. Unlike APAP, our data indicated no significant inter-individual
variation towards CCl4 induced liver injury even though CCl4 is also metabolized by P450 (35)
and a GSH-dependent detoxification mechanism may protect the microsomal membrane against
free-radical injury induced by this chemical (36). All these observations suggest that additional
factors may contribute to the inter-individual differences in response to APAP exposure. For
example, Claton et al. found an association between an individual's pre-dose urinary microbial
metabolites p-cresol sulfate (PCS) and phenylacetylglutamine (PAG) concentrations, and the
post-dose urinary acetaminophen concentration (37). Conversion of p-cresol to PCS is analogous
to the conversion of acetaminophen to non-toxic acetaminophen sulfate. A person's capacity for
acetaminophen sulfonation can be significantly reduced by competitive p-cresol sulfonation.
Thus, an individual’s spectrum of gut microbiota may trigger an adverse effect of a drug.
In the human study presented here, using a limited number of subjects with different
confounding factors including ages, gender, weight, time of overdose, alcohol consumption,
21
eating disorders, hepatic disease, smoking and drug use history, we did not observe correlation
between the patients’ blood APAP concentrations and ALT levels (Pearson’s correlation
coefficient r-value 0.36; p-value 0.21, Supplementary Table 2). This is not surprising given the
very different time points at which patients presented after APAP overdose.
Blood protein measurement results from this study demonstrated an excellent agreement of
concentration-increase proteins in both mouse models and human APAP overdose patients.
There are 15 concentration-increase proteins in the human APAP overdose study that overlap
with proteins in the APAP treated mouse study. 14 of the 15 proteins (except APOA1) agree
with each other with elevated protein levels after APAP exposure (Table 3). Some of the
biomarker candidates identified in the mouse study have been reported. For example, in a
glycocapture-assisted global quantitative proteomics (gagQP) study, we discovered 235 proteins
that showed concentration changes at 48h after APAP exposure. Among them, 17 of the 135
proteins were liver-enriched proteins (38). Fourteen of those 17 liver-enriched proteins
overlapped with the proteins identified in this study. The increase of hepatic MMP9 expression
after CCl4 exposure has been reported (39). In this study, we have shown that MMP9 levels
increased in serum by up to 10-fold in four of the APAP overdose patients tested. ALDOB, one
of the proteins increased in both hepatotoxin mouse models and in APAP-overdose patients
observed in this study, has been reported with a dose-dependent concentration change in 95% of
the patients with liver cell necrosis (40). GLUD1 is located in mitochondria and has been used as
a marker for mitochondrial damage (41). Similar to our finding, increased GLUD1 activity in
plasma has been reported in APAP overdose patients with abnormal liver function tests (LFT)
(42). It is known that liver failure impairs CRP production by the liver (43), we demonstrated
that serum CRP concentration increased up to 14-fold in APAP overdose patients

22
(Supplementary Table 7). CRP and MMP9 identified patients in this study that were otherwise
indistinguishable from controls by the traditional liver injury markers ALT and AST. It has been
reported that the increase of ASS concentrations in plasma is more sensitive than ALT; ASS
levels appeared to increase early in some patients with APAP overdose, then decreased quickly
in plasma after 24 hours of APAP exposure (44). Our mouse study showed a persistent increase
of ASS1 concentration in plasma till 96 hours. Unfortunately, ASS1 was not detected in human
serum samples by SRM or WB in this study.
Gene ontology enrichment analysis for biological process, cellular components and signaling
pathways were performed with the 58 blood biomarker candidates identified which include 36
elevated (from both mouse and human studies) and 22 decreased their blood concentration
(mouse study) after acute liver injury. A number of metabolic processes (biological networks)
including steroid, glycosaminoglycan and amino acids metabolism, as well as glycolysis and
lipogenesis are associated with these putative blood biomarkers for acute liver injury (Figure 4).
These reflect major biological processes carried out in the liver and it is not surprising to see
them change during acute liver injury.
All extracellular proteins exhibited decreased concentrations in mice plasma after APAP or CCl4
exposure. Under normal conditions, these extracellular proteins are synthesized in hepatocytes
and released into blood as part of normal hepatocyte functions. It is not surprising to see a
decrease of these proteins in blood since the production and release of these extracellular
proteins were impaired during liver injury. This concentration-decrease phenomenon after
APAP treatment was not observed in humans. This may be due to the relatively high
concentration of APAP administrated in the animal model system as compared to what the

23
human patients ingested. For examples, 375mg/kg of APAP was used in the mouse study which
would translate to greater than 80 Tylenol tablets containing 325 mg acetaminophen per tablet
taken by an average person. Massive damages in the livers were observed in mice at peak hours
(Figure 1) and production of proteins that were normally secreted into the blood stream must be
severally obstructed (resulting in decreased concentrations in serum). Since much lower APAP
doses were taken by the overdosed patients, the liver damage probably was less severe in patients
compared to mice and the hampered secretion of those liver proteins may be compensated by
increased production in part of the liver that were not severely damaged.
It is interesting to note that most of the 36 proteins with increased plasma concentrations after
APAP or CCl4 exposure are intracellular (A1BG, CRP are 2 exceptions) and are involved in
functions localized in hepatic zone 3—the zone that responds acutely to the two liver toxins used
in the study. The hepatocytes in zone 3 have the poorest oxygenation and predominantly perform
oxygen-independent metabolic processes, e.g., glycolysis and lipogenesis. In addition, some
amino acid metabolism enzymes in the arginine, proline, alanine, aspartate, methionine and
glutamate metabolism networks are also located in zone 3 (45). In this study, the blood
concentration of two catalytic enzymes involved in glycolysis, FBP1 and ALDOB, were
increased after APAP or CCl4 exposure. In addition, AGXT, ALT, ASL, ASS1, AST, CPS1, and
GLUD1 are involved in the citrate and urea pathways, which are connected with the glycolysis
pathway. It is well known that threonine can be converted to glycine, then serine and later
pyruvate. Enzymes involved in glycine, serine and threonine metabolic process including
BHMT1, BHMT2, FAH, GNMT, HGD, HPD and SARDH, were increased in plasma after
APAP or CCl4 exposure. Some other cytosolic proteins (ADH1A, ADH4, ALDH1A1, ASL,
ASS1, CPS1, DPYS and UPB1) are also either directly or indirectly involved in the metabolic

24
processes in zone 3. Five proteins with increased blood concentrations after APAP and CCl4
treatment including ADH1A1, ADH4, ALDH1A1, CAT and HMGCS2 are annotated with
process of response to oxidative stress and xenobiotic metabolism. MAT1A, GNMT and BHMT
are mainly expressed in liver and are involved in methionine metabolism. MAT1A catalyzes the
formation of biological methyl donor S−Adenosyl Methionine (SAMe) and GNMT is involved
in regulating hepatic SAMe concentrations. There is evidence indicating the importance of labile
methyl group in maintaining normal liver function (46). SAMe also plays a central role in
epigenetic processes (47). It is well known that DNA methylation as an epigenetic factor
influences drug metabolism (48). Interestingly, these enzymes may also affect liver regeneration
that is critical after massive liver damages caused by toxins. For example, mice lacking MAT1A
have reduced hepatic SAMe level which resulted in impaired liver regeneration (49).
It is well known that the liver is the main source of both coagulation factors and proteins
involved in fibrinolysis. In the coagulation cascade, F10 activates thrombin (F2), which then
cleaves FGA/FGB/FGG (fibrinogen, depletion target of IgY14 column, therefore was not tested
in this study) and releases fibrins that polymerize to form blood clots. On the other hand, cleaved
PLG (plasminogen) forms plasmin that degrades the fibrin clots (fibrinolysis). In acute liver
injury, both clot formation and fibrinolysis are impaired. For example, the concentrations of PLG
and SERPINF2 in fibrinolysis and F10, F2 and FGG in the fibrin formation were all decreased in
blood after liver damage (Figure 4). This may explain why patients with liver diseases are often
in hemostatic balance as a result of concomitant changes in both pro- and anti-hemostatic
networks and this rebalanced hemostatic system is reflected clinically by the large proportion of

25
patients with liver disease who can undergo major surgery without any requirement for blood
product infusion (50).
In addition to blood, the concentration of 49 proteins was also investigated by SRM in liver
tissues. However, up- and down-regulations of protein expression in response to drug exposure
was overshadowed by massive liver damages caused by the relatively high doses of APAP and
CCl4 as demonstrated by the fact that almost all the proteins tested showed decreased levels in
liver tissue after drug exposure. This was in agreement with the observation that intracellular
proteins increased their concentrations in blood due to cell lysis and extracellular proteins
decreased their blood concentrations due to diminished normal production and secretion by liver
cells after massive liver damage occurred.
Only two proteins of all those tested may have the ability to distinguish between injuries caused
by APAP and CCl4. (Table 1). This is consistent with the findings that both APAP and CCl4
induce toxicities through similar metabolic processes with similar histopathological changes in
the centrilobular area of the liver (51). This observation is also in agreement with the findings of
Aleksunes et al. who showed that hepatotoxic doses of APAP and CCl4 increased Ho-1, Nqo1
and Mrp4, and reduced Oatp1a1, 1a4, and Ntcp transcripts in liver in a similar pattern (52). The
major difference between APAP and CCl4 induced liver injury we observed was the peak
response time determined by histopathology and plasma aminotransferase activities in mice: 8
hours post-exposure for APAP vs. 24 hours for CCl4. This delayed response may be due to the
compound vehicle and not the drug per se. Corn oil has been found to markedly delay the
absorption of force-fed CCl4 from the GI tract in rats (53).

26
The best 5-member classifier identified in our human toxicity study (AGXT, ALDOB, CRP,
FBP1 and MMP9) showed better diagnostic performance than ALT and AST. Twelve of the 14
patients were correctly identified by the 5-protein panel while the ALT test detected only 3
(Figure 3). The much lower performance of ALT is probably due to its short half-life in the
blood. Patients come to clinic with different dosages, post exposure times and pathologies, which
are known to affect the diagnostic accuracy of ALT and AST. The new panel with liver-enriched
proteins may have longer half-life, specifically linked to liver injury and less affected by other
factors. The clinical utility of these markers is currently unclear but they have many possible
applications. For example, one possible use of these markers may be to assess the effectiveness
and prognosis of NAC treatment after APAP overdose.
Blood bathes all organs of the body, which synthesize as well as secrete/release proteins and
other molecules, including small molecules and nucleic acids, into blood. In pathological
conditions the profile of molecular exchange between organs and blood will be affected as a
consequence of their cognate networks becoming perturbed by diseases (or toxins); therefore,
analyzing the changes of molecular profiles in blood may serve as an informative window to
distinguish health and disease and to provide basic insights into the pathophysiology of the
disease. The approach we adopted by monitoring the change in the concentrations of organ-
enriched proteins in blood is especially informative because these proteins specifically reflect
disease-affected organs –hence they provide direct insights into the pathophysiology and severity
of the disease. Many new potential blood markers identified in this study performed better in
reflecting drug-induced liver injury than traditional blood AST and ALT measurements. Using

27
this approach, more informative and accurate blood markers can be identified. High quality
antibodies, aptamers or synthetic capture agents against these proteins can then be developed and
incorporated in devices to detect a set of diseases, including drug-induced injuries. (54). The
development of microfluidic devices offer the possibility of using a fraction of a droplet of blood
for such assessment—thus making it easier to follow the dynamics of the disease with frequent
blood samplings. These diagnostic platforms may provide the foundation for convenient, low
cost, Point-of-Care and even possibly self-administered tests which is a key step toward the
contemporary predictive, preventive, personalized, and participatory (P4) medicine (55).
SUPPORTING INFORMATION:
The following files are available free of charge at ACS website http://pubs.acs.org:
Supplementary Materials-Qin et al.docx. Supplementary Methods and Figures. Figure S1:
Characterizing individual SRM assays for the 5 informative proteins and ALT, AST in APAP
overdose patients; Figure S2: Detection of endogenous peptide VNEAACDIAR after APAP or
CCl4 treatment in mouse plasma; Figure S3: Collision energy optimization of 185 peptides
Supplementary Tables S1-S7 - Qin et al.xlsx. Table S1: Number of mice in each treatment group;
Table S2: Information for 14 APAP overdose patients; Table S3: Numbers of targeted proteins
and their proteotypic peptides (Protein/Peptide) filtered for SRM in each step of target protein
selection; Table S4.1: SRM methods to monitor mouse liver proteins in APAP and CCL4 liver-
toxicity mouse models; Table S4.2: SRM methods to monitor human liver proteins in APAP
overdose serum samples; Table S5: No relationship between plasma APAP concentration in
blood and liver injury after APAP injection; Table S6: Total Glutathione concentration and

28
GSH/GSSG ratio in 5 NOD mice at drug administration; Table S7: Fold change of 23 level-up
proteins in individual APAP overdose patients measured by SRM as compared to healthy
volunteer controls.
ACKNOWLEDGMENTS
The mouse model study was supported by DOD contract “Blood Biomarkers for Assessing the
Exposure and Responses of Mammals to Chemical and Biological Agents” W911SR-06-C-0057,
W911SR-07-C-0101, W911SR-09-C-0062. Human SRM research reported in this publication
was performed in part with federal funds from the American Recovery and Reinvestment Act
(ARRA) funds through National Institutes of Health, from the National Human Genome
Research Institute grant No. RC2 HG005805, the National Institute of General Medical Sciences
under grant No. R01 GM087221, 2P50 GM076547/Center for Systems Biology), the European
DAAD (fellowship to UK), U54ES017885 and RM-08-029 (GSO), and DOD research contracts
W911NF-10-2-0111 and HDTRA1-13-C-0055. We thank the Luxembourg Centre for Systems
Biomedicine and the University of Luxembourg for supporting the Acetaminophen-overdose
patient study. We also thank the MRC Centre for Drug Safety Science in Liverpool (UK) for
funding the patient study. MP is a NIHR Senior Investigator. The authors thank Trevor Baker,
ISB Proteomics Core, and David Rodriguez and Wiley Lawhead, for excellent technical
assistance and for providing excellent husbandry care and drug injection for the mouse model
study. Special thanks are given to Drs. Kelly Hudkins and Ying-Tzang Tien, University of
Washington Pathology Research Service Laboratory, for providing expertise in histologic
staining and analyzing the mouse liver samples.
ABBREVIATIONS

29
ALT, Alanine Aminotransferase; APAP, acetaminophen; AST, Aspartate Aminotransferase;
C57BL/6J, B6; CCl4, carbon tetrachloride; DILI, drug-induced liver injury; LC-IMS-MS, liquid
chromatography-ion mobility spectrometry-mass spectrometry; NOD, NOD/ShiLtJ; SRM,
selected reaction monitoring; WB, Western Blot.

30
References
1. McJunkin, B.; Barwick, K. W.; Little, W. C.; Winfield, J. B., Fatal massive hepatic necrosis following
acetaminophen overdose. JAMA 1976, 236, (16), 1874-5.
2. Larson, A. M.; Polson, J.; Fontana, R. J.; Davern, T. J.; Lalani, E.; Hynan, L. S.; Reisch, J. S.; Schiodt, F.
V.; Ostapowicz, G.; Shakil, A. O.; Lee, W. M.; Acute Liver Failure Study, G., Acetaminophen-induced acute liver
failure: results of a United States multicenter, prospective study. Hepatology 2005, 42, (6), 1364-72.
3. Dart, R. C.; Erdman, A. R.; Olson, K. R.; Christianson, G.; Manoguerra, A. S.; Chyka, P. A.; Caravati, E.
M.; Wax, P. M.; Keyes, D. C.; Woolf, A. D.; Scharman, E. J.; Booze, L. L.; Troutman, W. G.; American
Association of Poison Control, C., Acetaminophen poisoning: an evidence-based consensus guideline for out-of-
hospital management. Clin Toxicol (Phila) 2006, 44, (1), 1-18.
4. Nissen, N. I.; Ranlov, P.; Weis-Fogh, J., Evaluation of Four Different Serum Enzymes in the Diagnosis of
Acute Myocardial Infarction. Br Heart J 1965, 27, 520-6.
5. Lindblom, P.; Rafter, I.; Copley, C.; Andersson, U.; Hedberg, J. J.; Berg, A. L.; Samuelsson, A.; Hellmold,
H.; Cotgreave, I.; Glinghammar, B., Isoforms of alanine aminotransferases in human tissues and serum--differential
tissue expression using novel antibodies. Arch Biochem Biophys 2007, 466, (1), 66-77.
6. Dufour, D. R.; Lott, J. A.; Nolte, F. S.; Gretch, D. R.; Koff, R. S.; Seeff, L. B., Diagnosis and monitoring of
hepatic injury. I. Performance characteristics of laboratory tests. Clin Chem 2000, 46, (12), 2027-49.
7. Antoine, D. J.; Jenkins, R. E.; Dear, J. W.; Williams, D. P.; McGill, M. R.; Sharpe, M. R.; Craig, D. G.;
Simpson, K. J.; Jaeschke, H.; Park, B. K., Molecular forms of HMGB1 and keratin-18 as mechanistic biomarkers for
mode of cell death and prognosis during clinical acetaminophen hepatotoxicity. J Hepatol 2012, 56, (5), 1070-9.
8. Zhou, Y. Q., S.; Wang, K., Biomarkers of drug-induced liver injury. Current Biomarker Findings. Current
Biomarker Findings 2013, 3, 1-9.
9. Wang, K.; Yuan, Y.; Li, H.; Cho, J. H.; Huang, D.; Gray, L.; Qin, S.; Galas, D. J., The spectrum of
circulating RNA: a window into systems toxicology. Toxicol Sci 2013, 132, (2), 478-92.
10. Szabo, G.; Bala, S., MicroRNAs in liver disease. Nat Rev Gastroenterol Hepatol 2013, 10, (9), 542-52.
11. Huttenhain, R.; Soste, M.; Selevsek, N.; Rost, H.; Sethi, A.; Carapito, C.; Farrah, T.; Deutsch, E. W.;
Kusebauch, U.; Moritz, R. L.; Nimeus-Malmstrom, E.; Rinner, O.; Aebersold, R., Reproducible quantification of
cancer-associated proteins in body fluids using targeted proteomics. Sci Transl Med 2012, 4, (142), 142ra94.
12. Picotti, P.; Aebersold, R., Selected reaction monitoring-based proteomics: workflows, potential, pitfalls and
future directions. Nat Methods 2012, 9, (6), 555-66.
13. Carr, S. A.; Abbatiello, S. E.; Ackermann, B. L.; Borchers, C.; Domon, B.; Deutsch, E. W.; Grant, R. P.;
Hoofnagle, A. N.; Huttenhain, R.; Koomen, J. M.; Liebler, D. C.; Liu, T.; MacLean, B.; Mani, D. R.; Mansfield, E.;
Neubert, H.; Paulovich, A. G.; Reiter, L.; Vitek, O.; Aebersold, R.; Anderson, L.; Bethem, R.; Blonder, J.; Boja, E.;
Botelho, J.; Boyne, M.; Bradshaw, R. A.; Burlingame, A. L.; Chan, D.; Keshishian, H.; Kuhn, E.; Kinsinger, C.; Lee,
J. S.; Lee, S. W.; Moritz, R.; Oses-Prieto, J.; Rifai, N.; Ritchie, J.; Rodriguez, H.; Srinivas, P. R.; Townsend, R. R.;
Van Eyk, J.; Whiteley, G.; Wiita, A.; Weintraub, S., Targeted peptide measurements in biology and medicine: best
practices for mass spectrometry-based assay development using a fit-for-purpose approach. Mol Cell Proteomics
2014, 13, (3), 907-17.
14. Mirochnitchenko, O.; Weisbrot-Lefkowitz, M.; Reuhl, K.; Chen, L.; Yang, C.; Inouye, M., Acetaminophen
toxicity. Opposite effects of two forms of glutathione peroxidase. J Biol Chem 1999, 274, (15), 10349-55.
15. Simpson, K.; Hogaboam, C. M.; Kunkel, S. L.; Harrison, D. J.; Bone-Larson, C.; Lukacs, N. W., Stem cell
factor attenuates liver damage in a murine model of acetaminophen-induced hepatic injury. Lab Invest 2003, 83, (2),
199-206.
16. Yu, C.; Wang, F.; Jin, C.; Wu, X.; Chan, W. K.; McKeehan, W. L., Increased carbon tetrachloride-induced
liver injury and fibrosis in FGFR4-deficient mice. Am J Pathol 2002, 161, (6), 2003-10.
17. Nath, R. G.; Li, D. H.; Randerath, K., Acute and long-term effects of carbon tetrachloride on DNA
modifications (I-compounds) in male mouse liver. Chem Biol Interact 1990, 76, (3), 343-57.
18. Tammen, H., Specimen collection and handling: standardization of blood sample collection. Methods Mol
Biol 2008, 428, 35-42.
19. Doumas, B.; Biggs, H. G., A colorimetric method for assaying serum aspartate aminotransferase activities.
Clin Chim Acta 1969, 23, (1), 75-82.
20. Henry, R. J.; Chiamori, N.; Golub, O. J.; Berkman, S., Revised spectrophotometric methods for the
determination of glutamic-oxalacetic transaminase, glutamic-pyruvic transaminase, and lactic acid dehydrogenase.
Am J Clin Pathol 1960, 34, 381-98.

31
21. Qin, S.; Zhou, Y.; Lok, A. S.; Tsodikov, A.; Yan, X.; Gray, L.; Yuan, M.; Moritz, R. L.; Galas, D.; Omenn,
G. S.; Hood, L., SRM targeted proteomics in search for biomarkers of HCV-induced progression of fibrosis to
cirrhosis in HALT-C patients. Proteomics 2012, 12, (8), 1244-52.
22. Zhang, Q.; Menon, R.; Deutsch, E. W.; Pitteri, S. J.; Faca, V. M.; Wang, H.; Newcomb, L. F.; Depinho, R.
A.; Bardeesy, N.; Dinulescu, D.; Hung, K. E.; Kucherlapati, R.; Jacks, T.; Politi, K.; Aebersold, R.; Omenn, G. S.;
States, D. J.; Hanash, S. M., A mouse plasma peptide atlas as a resource for disease proteomics. Genome Biol 2008,
9, (6), R93.
23. Kusebauch, U.; Campbell, D. S.; Deutsch, E. W.; Chu, C. S.; Spicer, D. A.; Brusniak, M. Y.; Slagel, J.; Sun,
Z.; Stevens, J.; Grimes, B.; Shteynberg, D.; Hoopmann, M. R.; Blattmann, P.; Ratushny, A. V.; Rinner, O.; Picotti,
P.; Carapito, C.; Huang, C. Y.; Kapousouz, M.; Lam, H.; Tran, T.; Demir, E.; Aitchison, J. D.; Sander, C.; Hood, L.;
Aebersold, R.; Moritz, R. L., Human SRMAtlas: A Resource of Targeted Assays to Quantify the Complete Human
Proteome. Cell 2016, 166, (3), 766-78.
24. MacLean, B.; Tomazela, D. M.; Shulman, N.; Chambers, M.; Finney, G. L.; Frewen, B.; Kern, R.; Tabb, D.
L.; Liebler, D. C.; MacCoss, M. J., Skyline: an open source document editor for creating and analyzing targeted
proteomics experiments. Bioinformatics 2010, 26, (7), 966-8.
25. Li, X. J.; Hayward, C.; Fong, P. Y.; Dominguez, M.; Hunsucker, S. W.; Lee, L. W.; McLean, M.; Law, S.;
Butler, H.; Schirm, M.; Gingras, O.; Lamontagne, J.; Allard, R.; Chelsky, D.; Price, N. D.; Lam, S.; Massion, P. P.;
Pass, H.; Rom, W. N.; Vachani, A.; Fang, K. C.; Hood, L.; Kearney, P., A blood-based proteomic classifier for the
molecular characterization of pulmonary nodules. Sci Transl Med 2013, 5, (207), 207ra142.
26. Saeed, A. I.; Sharov, V.; White, J.; Li, J.; Liang, W.; Bhagabati, N.; Braisted, J.; Klapa, M.; Currier, T.;
Thiagarajan, M.; Sturn, A.; Snuffin, M.; Rezantsev, A.; Popov, D.; Ryltsov, A.; Kostukovich, E.; Borisovsky, I.; Liu,
Z.; Vinsavich, A.; Trush, V.; Quackenbush, J., TM4: a free, open-source system for microarray data management
and analysis. Biotechniques 2003, 34, (2), 374-8.
27. Davidson, D. G.; Eastham, W. N., Acute liver necrosis following overdose of paracetamol. Br Med J 1966,
2, (5512), 497-9.
28. Boyd, E. M.; Bereczky, G. M., Liver necrosis from paracetamol. Br J Pharmacol Chemother 1966, 26, (3),
606-14.
29. Ansher, S. S.; Dolan, P.; Bueding, E., Chemoprotective effects of two dithiolthiones and of
butylhydroxyanisole against carbon tetrachloride and acetaminophen toxicity. Hepatology 1983, 3, (6), 932-5.
30. Gorla, N.; de Ferreyra, E. C.; Villarruel, M. C.; de Fenos, O. M.; Castro, J. A., Studies on the mechanism of
glutathione prevention of carbon tetrachloride-induced liver injury. Br J Exp Pathol 1983, 64, (4), 388-95.
31. Micheel, C. M.; Nass, S. J.; Omenn, G. S., Committee on the Review of Omics-Based Tests for Predicting
Patient Outcomes in Clinical Trials. In Evolution of Translational Omics: Lessons Learned and the Path Forward.
National Academies Press (US): Washington (DC), 2012; p 274 pp.
32. Harrill, A. H.; Watkins, P. B.; Su, S.; Ross, P. K.; Harbourt, D. E.; Stylianou, I. M.; Boorman, G. A.; Russo,
M. W.; Sackler, R. S.; Harris, S. C.; Smith, P. C.; Tennant, R.; Bogue, M.; Paigen, K.; Harris, C.; Contractor, T.;
Wiltshire, T.; Rusyn, I.; Threadgill, D. W., Mouse population-guided resequencing reveals that variants in CD44
contribute to acetaminophen-induced liver injury in humans. Genome Res 2009, 19, (9), 1507-15.
33. Lim, A. Y.; Segarra, I.; Chakravarthi, S.; Akram, S.; Judson, J. P., Histopathology and biochemistry
analysis of the interaction between sunitinib and paracetamol in mice. BMC Pharmacol 2010, 10, 14.
34. Liu, W. X.; Jia, F. L.; He, Y. Y.; Zhang, B. X., Protective effects of 5-methoxypsoralen against
acetaminophen-induced hepatotoxicity in mice. World J Gastroenterol 2012, 18, (18), 2197-202.
35. Irie, H.; Asano-Hoshino, A.; Sekino, Y.; Nogami, M.; Kitagawa, T.; Kanda, H., Striking LD50 variation
associated with fluctuations of CYP2E1-positive cells in hepatic lobule during chronic CCl4 exposure in mice.
Virchows Arch 2010, 456, (4), 423-31.
36. Burk, R. F., Glutathione-dependent protection by rat liver microsomal protein against lipid peroxidation.
Biochim Biophys Acta 1983, 757, (1), 21-8.
37. Clayton, T. A.; Baker, D.; Lindon, J. C.; Everett, J. R.; Nicholson, J. K., Pharmacometabonomic
identification of a significant host-microbiome metabolic interaction affecting human drug metabolism. Proc Natl
Acad Sci U S A 2009, 106, (34), 14728-33.
38. Sun, B.; Utleg, A. G.; Hu, Z.; Qin, S.; Keller, A.; Lorang, C.; Gray, L.; Brightman, A.; Lee, D.; Alexander,
V. M.; Ranish, J. A.; Moritz, R. L.; Hood, L., Glycocapture-assisted global quantitative proteomics (gagQP) reveals
multiorgan responses in serum toxicoproteome. J Proteome Res 2013, 12, (5), 2034-44.
39. Knittel, T.; Mehde, M.; Grundmann, A.; Saile, B.; Scharf, J. G.; Ramadori, G., Expression of matrix
metalloproteinases and their inhibitors during hepatic tissue repair in the rat. Histochem Cell Biol 2000, 113, (6),
443-53.

32
40. Asaka, M.; Miyazaki, T.; Hollinger, F. B.; Alpert, E., Human aldolase B serum levels: a marker of liver
injury. Hepatology 1984, 4, (3), 531-5.
41. Racine-Samson, L.; Scoazec, J. Y.; D'Errico, A.; Fiorentino, M.; Christa, L.; Moreau, A.; Roda, C.;
Grigioni, W. F.; Feldman, G., The metabolic organization of the adult human liver: a comparative study of normal,
fibrotic, and cirrhotic liver tissue. Hepatology 1996, 24, (1), 104-13.
42. McGill, M. R.; Sharpe, M. R.; Williams, C. D.; Taha, M.; Curry, S. C.; Jaeschke, H., The mechanism
underlying acetaminophen-induced hepatotoxicity in humans and mice involves mitochondrial damage and nuclear
DNA fragmentation. J Clin Invest 2012, 122, (4), 1574-83.
43. Clyne, B.; Olshaker, J. S., The C-reactive protein. J Emerg Med 1999, 17, (6), 1019-25.
44. McGill, M. R.; Cao, M.; Svetlov, A.; Sharpe, M. R.; Williams, C. D.; Curry, S. C.; Farhood, A.; Jaeschke,
H.; Svetlov, S. I., Argininosuccinate synthetase as a plasma biomarker of liver injury after acetaminophen overdose
in rodents and humans. Biomarkers 2014, 19, (3), 222-30.
45. Kuo, F. C.; Hwu, W. L.; Valle, D.; Darnell, J. E., Jr., Colocalization in pericentral hepatocytes in adult
mice and similarity in developmental expression pattern of ornithine aminotransferase and glutamine synthetase
mRNA. Proc Natl Acad Sci U S A 1991, 88, (21), 9468-72.
46. Mato, J. M.; Martinez-Chantar, M. L.; Lu, S. C., Methionine metabolism and liver disease. Annu Rev Nutr
2008, 28, 273-93.
47. Janke, R.; Dodson, A. E.; Rine, J., Metabolism and epigenetics. Annu Rev Cell Dev Biol 2015, 31, 473-96.
48. Zanger, U. M.; Schwab, M., Cytochrome P450 enzymes in drug metabolism: regulation of gene expression,
enzyme activities, and impact of genetic variation. Pharmacol Ther 2013, 138, (1), 103-41.
49. Chen, L.; Zeng, Y.; Yang, H.; Lee, T. D.; French, S. W.; Corrales, F. J.; Garcia-Trevijano, E. R.; Avila, M.
A.; Mato, J. M.; Lu, S. C., Impaired liver regeneration in mice lacking methionine adenosyltransferase 1A. FASEB J
2004, 18, (7), 914-6.
50. Lisman, T.; Porte, R. J., Rebalanced hemostasis in patients with liver disease: evidence and clinical
consequences. Blood 2010, 116, (6), 878-85.
51. Knockaert, L.; Berson, A.; Ribault, C.; Prost, P. E.; Fautrel, A.; Pajaud, J.; Lepage, S.; Lucas-Clerc, C.;
Begue, J. M.; Fromenty, B.; Robin, M. A., Carbon tetrachloride-mediated lipid peroxidation induces early
mitochondrial alterations in mouse liver. Lab Invest 2012, 92, (3), 396-410.
52. Aleksunes, L. M.; Slitt, A. M.; Cherrington, N. J.; Thibodeau, M. S.; Klaassen, C. D.; Manautou, J. E.,
Differential expression of mouse hepatic transporter genes in response to acetaminophen and carbon tetrachloride.
Toxicol Sci 2005, 83, (1), 44-52.
53. Kim, H. J.; Bruckner, J. V.; Dallas, C. E.; Gallo, J. M., Effect of dosing vehicles on the pharmacokinetics
of orally administered carbon tetrachloride in rats. Toxicol Appl Pharmacol 1990, 102, (1), 50-60.
54. Fan, R.; Vermesh, O.; Srivastava, A.; Yen, B. K.; Qin, L.; Ahmad, H.; Kwong, G. A.; Liu, C. C.; Gould, J.;
Hood, L.; Heath, J. R., Integrated barcode chips for rapid, multiplexed analysis of proteins in microliter quantities of
blood. Nat Biotechnol 2008, 26, (12), 1373-8.
55. Hood, L., Systems biology and p4 medicine: past, present, and future. Rambam Maimonides Med J 2013, 4,
(2), e0012.

33
Tables
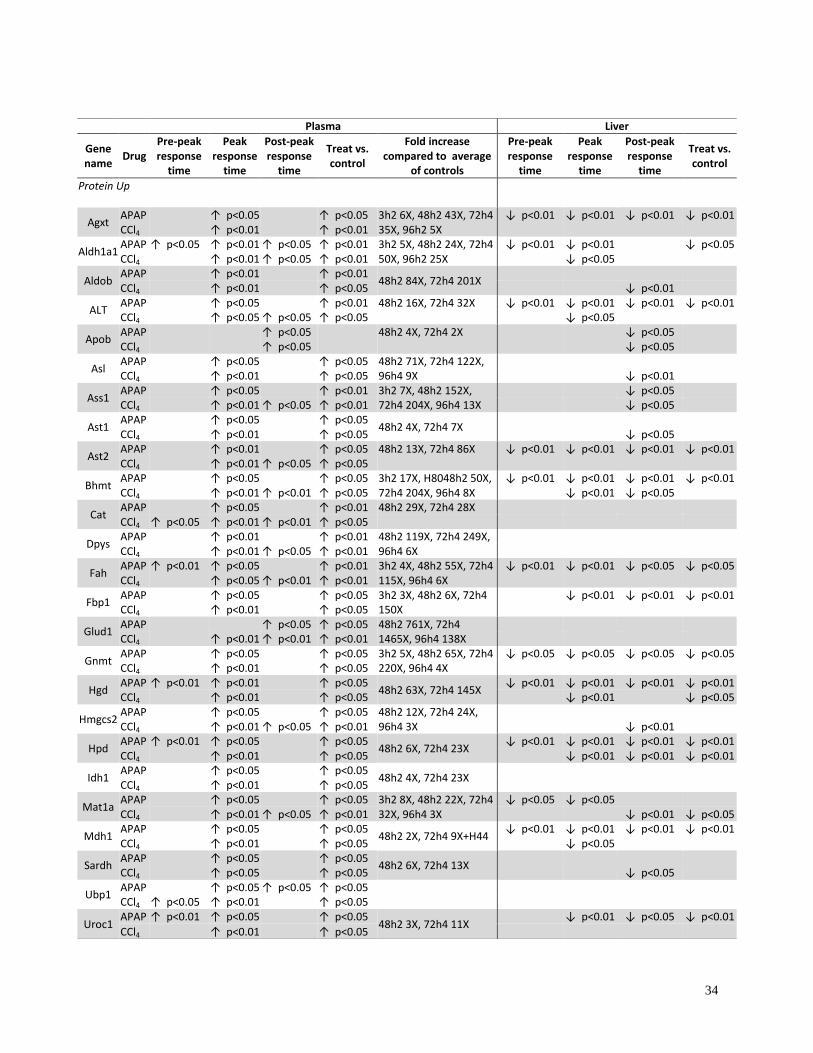
Table 1. Summary of SRM analyses of the 49 informative proteins in plasma and liver
tissue of NOD mice treated with APAP or CCl4. Existing liver injury markers ALT (ALT1),
AST1 and AST2 showed significant elevations in treated plasma samples compared to controls.
T-test was used to determine the significance of concentration change of specific proteins
between treated and control at pre-peak response time (3h for APAP or 3-8h for CCl4), at peak
response time (8-24h for APAP or 24-48h for CCl4) and at post-peak response time (48-96h for
APAP or 72-96h for CCl4). Significant inter-individual variation negatively affected p-values in
APAP-treated mice. Exact fold changes at data points (average of two peptides) in concentration
increase category of the most hyper-response mouse plasma were specified.
ND: not detected, concentration increase, concentration decrease, Blank: no change.
34
Plasma Liver
Gene name
Drug Pre-peak response
time
Peak response
time
Post-peak response
time
Treat vs. control
Fold increase compared to average
of controls
Pre-peak response
time
Peak response
time
Post-peak response
time
Treat vs. control
Protein Up
Agxt APAP ↑ p<0.05 ↑ p<0.05 3h2 6X, 48h2 43X, 72h4
35X, 96h2 5X ↓ p<0.01 ↓ p<0.01 ↓ p<0.01 ↓ p<0.01
CCl4 ↑ p<0.01 ↑ p<0.01
Aldh1a1 APAP ↑ p<0.05 ↑ p<0.01 ↑ p<0.05 ↑ p<0.01 3h2 5X, 48h2 24X, 72h4
50X, 96h2 25X ↓ p<0.01 ↓ p<0.01
↓ p<0.05
CCl4
↑ p<0.01 ↑ p<0.05 ↑ p<0.01 ↓ p<0.05
Aldob APAP ↑ p<0.01 ↑ p<0.01
48h2 84X, 72h4 201X
CCl4 ↑ p<0.01 ↑ p<0.05 ↓ p<0.01
ALT APAP
↑ p<0.05
↑ p<0.01 48h2 16X, 72h4 32X ↓ p<0.01 ↓ p<0.01 ↓ p<0.01 ↓ p<0.01
CCl4
↑ p<0.05 ↑ p<0.05 ↑ p<0.05 ↓ p<0.05
Apob APAP ↑ p<0.05 48h2 4X, 72h4 2X ↓ p<0.05 CCl4 ↑ p<0.05 ↓ p<0.05
Asl APAP
↑ p<0.05
↑ p<0.05 48h2 71X, 72h4 122X,
96h4 9X
CCl4
↑ p<0.01
↑ p<0.05
↓ p<0.01
Ass1
APAP ↑ p<0.05 ↑ p<0.01 3h2 7X, 48h2 152X, 72h4 204X, 96h4 13X
↓ p<0.05 CCl4 ↑ p<0.01 ↑ p<0.05 ↑ p<0.01 ↓ p<0.05
Ast1 APAP
↑ p<0.05
↑ p<0.05
48h2 4X, 72h4 7X
CCl4
↑ p<0.01
↑ p<0.05
↓ p<0.05
Ast2
APAP ↑ p<0.01 ↑ p<0.05 48h2 13X, 72h4 86X ↓ p<0.01 ↓ p<0.01 ↓ p<0.01 ↓ p<0.01 CCl4 ↑ p<0.01 ↑ p<0.05 ↑ p<0.05
Bhmt APAP
↑ p<0.05
↑ p<0.05 3h2 17X, H8048h2 50X,
72h4 204X, 96h4 8X ↓ p<0.01 ↓ p<0.01 ↓ p<0.01 ↓ p<0.01
CCl4
↑ p<0.01 ↑ p<0.01 ↑ p<0.05 ↓ p<0.01 ↓ p<0.05
Cat APAP ↑ p<0.05 ↑ p<0.01 48h2 29X, 72h4 28X CCl4 ↑ p<0.05 ↑ p<0.01 ↑ p<0.01 ↑ p<0.05
Dpys APAP
↑ p<0.01
↑ p<0.01 48h2 119X, 72h4 249X,
96h4 6X
CCl4
↑ p<0.01 ↑ p<0.05 ↑ p<0.01
Fah
APAP ↑ p<0.01 ↑ p<0.05 ↑ p<0.01 3h2 4X, 48h2 55X, 72h4 115X, 96h4 6X
↓ p<0.01 ↓ p<0.01 ↓ p<0.05 ↓ p<0.05 CCl4 ↑ p<0.05 ↑ p<0.01 ↑ p<0.01
Fbp1 APAP
↑ p<0.05
↑ p<0.05 3h2 3X, 48h2 6X, 72h4
150X ↓ p<0.01 ↓ p<0.01 ↓ p<0.01
CCl4
↑ p<0.01
↑ p<0.05
Glud1 APAP ↑ p<0.05 ↑ p<0.05 48h2 761X, 72h4
1465X, 96h4 138X
CCl4 ↑ p<0.01 ↑ p<0.01 ↑ p<0.01
Gnmt APAP
↑ p<0.05
↑ p<0.05 3h2 5X, 48h2 65X, 72h4
220X, 96h4 4X ↓ p<0.05 ↓ p<0.05 ↓ p<0.05 ↓ p<0.05
CCl4
↑ p<0.01
↑ p<0.05
Hgd APAP ↑ p<0.01 ↑ p<0.01 ↑ p<0.05
48h2 63X, 72h4 145X ↓ p<0.01 ↓ p<0.01 ↓ p<0.01 ↓ p<0.01
CCl4 ↑ p<0.01 ↑ p<0.05 ↓ p<0.01 ↓ p<0.05
Hmgcs2 APAP
↑ p<0.05
↑ p<0.05 48h2 12X, 72h4 24X,
96h4 3X
CCl4
↑ p<0.01 ↑ p<0.05 ↑ p<0.01
↓ p<0.01
Hpd
APAP ↑ p<0.01 ↑ p<0.05 ↑ p<0.05 48h2 6X, 72h4 23X
↓ p<0.01 ↓ p<0.01 ↓ p<0.01 ↓ p<0.01 CCl4 ↑ p<0.01 ↑ p<0.05 ↓ p<0.01 ↓ p<0.01 ↓ p<0.01
Idh1 APAP
↑ p<0.05
↑ p<0.05
48h2 4X, 72h4 23X
CCl4
↑ p<0.01
↑ p<0.05
Mat1a
APAP ↑ p<0.05 ↑ p<0.05 3h2 8X, 48h2 22X, 72h4 32X, 96h4 3X
↓ p<0.05 ↓ p<0.05 CCl4 ↑ p<0.01 ↑ p<0.05 ↑ p<0.01 ↓ p<0.01 ↓ p<0.05
Mdh1 APAP
↑ p<0.05
↑ p<0.05
48h2 2X, 72h4 9X+H44 ↓ p<0.01 ↓ p<0.01 ↓ p<0.01 ↓ p<0.01
CCl4
↑ p<0.01
↑ p<0.05 ↓ p<0.05
Sardh APAP ↑ p<0.05 ↑ p<0.05
48h2 6X, 72h4 13X
CCl4 ↑ p<0.05 ↑ p<0.05 ↓ p<0.05
Ubp1 APAP
↑ p<0.05 ↑ p<0.05 ↑ p<0.05
CCl4 ↑ p<0.05 ↑ p<0.01
↑ p<0.05
Uroc1 APAP ↑ p<0.01 ↑ p<0.05 ↑ p<0.05
48h2 3X, 72h4 11X ↓ p<0.01 ↓ p<0.05 ↓ p<0.01
CCl4 ↑ p<0.01 ↑ p<0.05

35
Plasma Liver
Gene name
Drug Pre-peak response
time
Peak response
time
Post-peak response
time
Treat vs. control
Fold increase compared to average
of controls
Pre-peak response
time
Peak response
time
Post-peak response
time
Treat vs. control
Proteins Down
Apcs APAP
↓ p<0.01 ↓ p<0.01
ND ND ND ND
CCl4
↓ p<0.05
ND ND ND ND
Apoa1 APAP ↓ p<0.01 ↓ p<0.05 ↓ p<0.05 ↓ p<0.05 CCl4 ↓ p<0.01
C8g APAP ↓ p<0.01 ↓ p<0.01 ↓ p<0.01 ↓ p<0.01
ND ND ND ND
CCl4 ↓ p<0.05 ↓ p<0.01
↓ p<0.05
ND ND ND ND
Cfb APAP ↓ p<0.05 ↓ p<0.01 ↓ p<0.05 ND ND ND ND CCl4 ↓ p<0.01 ↓ p<0.05 ND ND ND ND
Cp APAP ↓ p<0.05 ↓ p<0.01 ↑ p<0.01
ND ND ND ND
CCl4
↑ p<0.05
ND ND ND ND
Cpb2 APAP ↓ p<0.01 ↓ p<0.01 ↓ p<0.05 ↓ p<0.05 ↓ p<0.01 CCl4 ↓ p<0.01 ↓ p<0.01 ↓ p<0.01 ↓ p<0.05 ↓ p<0.05
F10 APAP ↓ p<0.01 ↓ p<0.01
↓ p<0.05
ND ND ND ND
CCl4
↓ p<0.05 ↓ p<0.05 ↓ p<0.05
ND ND ND ND
F12 APAP ↓ p<0.01 ↓ p<0.01 ↓ p<0.05 ND ND ND ND CCl4 ↓ p<0.05 ND ND ND ND
F2 APAP ↓ p<0.01 ↓ p<0.01
↓ p<0.05
ND ND ND ND
CCl4
↓ p<0.01 ↓ p<0.05 ↓ p<0.05
ND ND ND ND
Fetub APAP ↓ p<0.05 ↓ p<0.05 CCl4 ↓ p<0.05
Hgfac APAP ↓ p<0.01 ↓ p<0.01
↓ p<0.05
↓ p<0.01
↓ p<0.05
CCl4
↓ p<0.05
↓ p<0.01
↑ p<0.05
Hpx APAP ↓ p<0.01 ↓ p<0.01 ↓ p<0.01 ↓ p<0.01 ↓ p<0.01 ↓ p<0.01 CCl4 ↓ p<0.01 ↓ p<0.01 ↓ p<0.01
Hrg APAP ↓ p<0.05 ↓ p<0.05
CCl4
↓ p<0.01
↓ p<0.01 ↓ p<0.01 ↓ p<0.01
Igfals APAP ↓ p<0.01 ↓ p<0.01 ND ND ND ND CCl4 ↓ p<0.01 ↓ p<0.01 ↓ p<0.01 ND ND ND ND
Itih1 APAP ↓ p<0.01 ↓ p<0.05
↓ p<0.05
CCl4
↓ p<0.01
↓ p<0.05
Itih4
APAP ↓ p<0.05 ↓ p<0.01 ↓ p<0.05 CCl4 ↓ p<0.01 ↓ p<0.01 ↓ p<0.01 ↓ p<0.01 ↓ p<0.05
Pglyrp2 APAP ↓ p<0.01 ↓ p<0.01
ND ND ND ND
CCl4
↓ p<0.05
ND ND ND ND
plg APAP ↓ p<0.01 ↓ p<0.01 ↓ p<0.01 ↓ p<0.05 CCl4 ↓ p<0.01 ↓ p<0.01 ↓ p<0.01
Rbp4 APAP ↓ p<0.01 ↓ p<0.01
↓ p<0.01 ↓ p<0.01 ↓ p<0.01 ↓ p<0.01
CCl4 ↓ p<0.05
↓ p<0.05
Saa4 APAP ↓ p<0.01 ↓ p<0.01 ND ND ND ND CCl4 ↓ p<0.05 ↓ p<0.05 ↓ p<0.05 ND ND ND ND
Serpinf2 APAP ↓ p<0.01 ↓ p<0.01
↓ p<0.01
CCl4 ↓ p<0.05 ↓ p<0.01 ↓ p<0.01 ↓ p<0.01
Vtn
APAP ↓ p<0.01 ↓ p<0.01 ↓ p<0.01 ↑ p<0.05 CCl4 ↓ p<0.05 ↓ p<0.01 ↓ p<0.01 ↓ p<0.01 ↑ p<0.05
Proteins Down/Up
Itih2 APAP ↓ p<0.05
↑ p<0.01
↓ p<0.01
↓ p<0.05
CCl4
↑ p<0.05
↓ p<0.01
Itih3 APAP ↓ p<0.01 ↓ p<0.01 ↑ p<0.01 ND ND ND ND
CCl4 ↑ p<0.01 ↑ p<0.05 ND ND ND ND

36
Table 2. Fold changes of plasma ALT/AST enzyme activities and of SRM-measured proteins
ALT, AST1, AST2, GLUD1, ALDOB, ASS1, BHMT. WB images for each protein in plasma
were shown for APAP-treated (2A) or CCl4-treated (2B) NOD mice. The results were
normalized based on the average concentrations of controls. ALT1, AST1 and AST2 protein WB
bands were mainly shown at the peak responsive time points. Typical results from one animal are
shown at each time point in the table. For t-test in the APAP/NOD group, all animals: 12 PBS-
injected animals, mouse #1 and #2 at each of the 6 time-points from 3 hours to 96 hours post
injection, and 15 APAP-treated mice (mice 03h1, 03h2, 08h1, 08h2, 08h3, 08h7, 24h1, 24h4,
24h6, 48h1, 48h2, 72h1, 72h4, 96h2, 96h4) were included. In the CCL4/NOD group, mouse #1
and #2 at each corn oil or CCl4-treated animals (12 controls and 12 treated from 3 hour to 96
hour time-points) were included. NT: not tested.

37
Table 2A. APAP/NOD
Time points No
treat
3h2
8h2
24h4
48h2
72h4
96h2
120h6
144h2
168h2
p value
Protein
name
Method
Protein level fold change measured by SRM or enzyme activity
with corresponding WB images
ALT
Enzyme 1 2 267 98 27 55 2 1 1 1 0.01
SRM 1 2 85 32 15 30 1 NT NT NT 0.02
WB
AST Enzyme 1 1 73 25 4 19 1 1 2 1 0.01
AST1
SRM 1 1 39 10 3 7 1 NT NT NT 0.05
WB
AST2
SRM 1 1 2 14 13 10 1 1 1 1 0.10
WB
GLUD1
SRM 1 2 15 338 920 1771 168 NT NT NT 0.05
WB
ALDOB
SRM 1 2 124 78 13 122 1 NT NT NT 0.02
WB
ASS1
SRM 1 2 399 44 222 278 14 NT NT NT 0.03
WB
BHMT
SRM 1 17 942 210 69 281 9 NT NT NT 0.03
WB

38
2B. CCl4/NOD
Time points No
treat
3h1
8h1
24h1
48h1
72h1
96h1
120h1
144h1
168h1
p value
Proteins
names
Method
Protein level fold change measured by SRM or enzyme activity
with corresponding WB images
ALT Enzyme 1 2 9 583 59 4 2 1 1 1 0.03
ALT1
SRM 1 2 6 60 124 3 2 NT NT NT 0.06
WB
AST Enzyme 1 1 6 162 6 2 2 1 1 1 0.03
AST1
SRM 1 1 3 156 196 2 1 NT NT NT 0.04
WB
AST2
SRM 1 1 1 163 226 6 3 NT NT NT 0.03
WB
GLUD1
SRM 1 2 2 296 366 290 235 NT NT NT 0.002
WB
ALDOB
SRM 1 2 11 730 635 16 2 NT NT NT 0.03
WB
ASS1
SRM 1 1 3 106 116 15 7 NT NT NT 0.01
WB
BHMT
SRM 1 44 1451 1908 1834 72 44 NT NT NT 0.01
WB

39
Table 3. Agreement of concentration-increase proteins in both mouse models and human APAP
overdose patients. There are 15 proteins in the human APAP overdose study that overlap with
proteins in the APAP treated mouse study. 14 of the 15 proteins agree with each other with
elevated protein levels () after APAP exposure. APOA1 is the only exception, with decreased
protein level () in mouse study. NT: not tested.
Gene
symbol
Human UniProtKB
ID
Mouse UniProtKB
ID
Protein level in
human study
Protein level in
mouse study
ALT P24298
Q8QZR5
ADH1 P07327
P00329
ADH4 P08319
Q3V0P5
NT
AGXT P21549
Q8R128
ALDOB P05062
Q91Y97
APOA1 P02647
Q8BPD5
APOE P02649
P08226
NT
ASS1 P00966
P16460
AST1 P17174
P05201
AST2 P00505
P05202
BHMT1 Q93088
O35490
BHMT2 Q9H2M3
Q91WS4
NT
CES1 P23141
Q8VCC2
NT
CRP P02741
P14847
NT
FAH P16930
Q3TY87
FBP1 P09467
Q9QXD6
GLUD1 P00367
P26443
GLUD2 P49448
P26443 NT
GNMT Q14749
Q9QXF8
HPD P32754
P49429
MAT1A Q00266
Q91X83
MMP9 P14780
P41245
NT
UROC1 Q96N76 Q3UEL5

40
Figure Legends
Figure 1. Significant responsiveness variation among APAP-treated B6 and NOD mice were
indicated by differences of plasma ALT and AST activities. Variations after CCl4 treatment were
small in both strains. Figure 1A shows log2 values of ALT and AST enzyme activities (IU/ml)
in the APAP/B6, APAP/NOD, CCl4/B6 and CCl4/NOD groups. In the APAP groups, 10 or
fewer mice were used at each time point. In the CCl4 groups, every time point has 3 (B6) or 4
(NOD) mice. Each marker in the chart of Figure 1A represents the log2 ALT or AST enzyme
activity value of an individual mouse at each time point. Marked lines in Figure 1A: average
ALT (black) and AST (red) levels with STDEV error bars. Figure 1B: Histopathology images
show that liver damage 8 hours post APAP treatment correspond to the huge ALT, AST enzyme
activity variations. Figure 1B1: Liver stain of PBS treated mouse from the APAP/NOD group
shows normal liver cells. 1B2: Liver damage characterized by severe central lobular necrosis and
bleeding was observed in Mouse APAP/NOD/8h2 (NOD mouse #2 treated with APAP at 8h
time point, a super responder by ALT and AST activities). 1B3: close to normal liver structure
was observed in liver slice from mouse APAP/NOD/8h1 (one of the least responders). Figure
1C: Histopathology images show that liver damages caused by CCl4 24 hours post treatment
correspond to the ALT, AST enzyme activities without significant variation among mice in each
time point group. 1C1: Corn-oil treated mouse shows normal liver structure. 1C2 and 1C3 show
livers from both mouse CCl4/NOD/24h1 and CCl4/NOD/24h2 at 24 hour time point with similar
ALT, AST values are similarly damaged with severe wide spread centrilobular necrosis and
hemorrhage.

41
Figure 2. 2A. Fold changes (Log2 value) of 25 concentration increase proteins by SRM in
APAP-treated NOD mice showing consistency of SRM measurement with ALT and AST
enzyme activity levels. Data normalized on negative controls (average of 12 PBS treated mice, 2
mice at each of the 6 time points). SRM results shown are average of two peptides from each
protein (in some cases, only one peptide/protein). ALT and AST enzyme activity fold changes
are shown as black (ALT) or red (AST) lines. 2B. Similar to 2A, showing normalized fold-
changes from concentration increase proteins after CCl4 treatment in NOD mice. Mouse number
03h1 is mouse #1 sacrificed at 3 hour time point, 08h1 is mouse #1 sacrificed at 8 hour time
point, and so on. Since mice were sacrificed at time of sample collection, mouse 03h1 is not the
same mouse as 08h1 and so on. Each batch of vertical lines reflects different proteins
concentrations obtained from an individual mouse at a given time point.
Figure 3. A. Heat map showing classifiers AGXT, ALODB, CRP, FBP1 and MMP9 detected
12 of the 14 APAP overdose patients while ALT and AST detected 3 patients. B. This 5 protein
panel increased detection sensitivity from 0.54 to 0.85 and specificity from 0.50 to 0.84 when
compared to ALT and AST. C. SRM results of two proteins, ALDOB and CRP, have been
validated by Western blotting. SRM test results of ALDOB and CRP proteins showing fold
change over healthy volunteer controls. Numbers shown in the Liver function test (LFT) with
ALT are enzyme activities (IU/L) in serum not fold changes, <35 IU/L is considered as normal
range of ALT. Due to number of gel well limitation, only 5 controls (HV) were randomly
selected for WB except HV07 which showed a >4 fold increase of CRP in serum than control
average. A combination of ALDOB and CRP detected APAP caused liver injury in 10 patients
by Western blotting (high-lighted with yellow fill).

42
Figure 4. Informative proteins observed in plasma from the mouse DILI and human APAP
patient studies were rearranged by network according to enriched annotations. Extracellular
proteins were measured with decreased concentrations in mice plasma after APAP or CCl4
exposure while liver proteins with elevated concentrations in plasma were all intracellular
(except A1BG, CRP and MMP9). Network analysis shows that most of these cytosolic or
mitochondrial proteins are related to functions mainly localized in hepatic zone 3 where
hepatocytes have the poorest oxygenation and perform oxygen-independent metabolic processes.
ADH1A1, ADH4, ALDH1A1, CAT and HMGCS2, are annotated with process of response to
oxidative stress and xenobiotic metabolism. Some other concentration-increase proteins
discovered in this study and 2 other proteins from Ref 52 (NQO1 and HMOX1) are annotated
with process of response to oxidative stress and xenobiotic metabolism that happen in zone 3.

43
Figures
Figure 1
.

44
Figure 2

45
Figure 3.

46
Figure 4.

47
“for TOC only”