identification of block-oriented nonlinear processes using designed relay feedback tests
TRANSCRIPT
Identification of Block-Oriented Nonlinear Processes UsingDesigned Relay Feedback Tests
Jyh-Cheng Jeng,† Ming-Wei Lee,‡ and Hsiao-Ping Huang*,†
Department of Chemical Engineering, National Taiwan University,Taipei, Taiwan 106, Republic of China, and Center for Environmental, Safety and Health TechnologyDevelopment, Industrial Technology Research Institute, Building 51, 195-10 Section 4, Chung Hsing Road,Chutung, Hsinchu, Taiwan 310, Republic of China
A systematic approach to identifying Hammerstein and Wiener models, including the modelstructure and parameters, for nonlinear processes is presented. A sequence of predesigned relaymagnitude changes is applied in a relay feedback experiment to generate dynamic response foridentification. By way of this proposed approach, the identifications of linear and nonlinearelements in the block-oriented models are fully separated and the needs for iterative optimizationprocedures can be relaxed. With the nonlinear models obtained, nonlinear control strategiesare developed to achieve a better control performance. The effectiveness of the proposedidentification method and control strategy is demonstrated with simulated examples.
1. Introduction
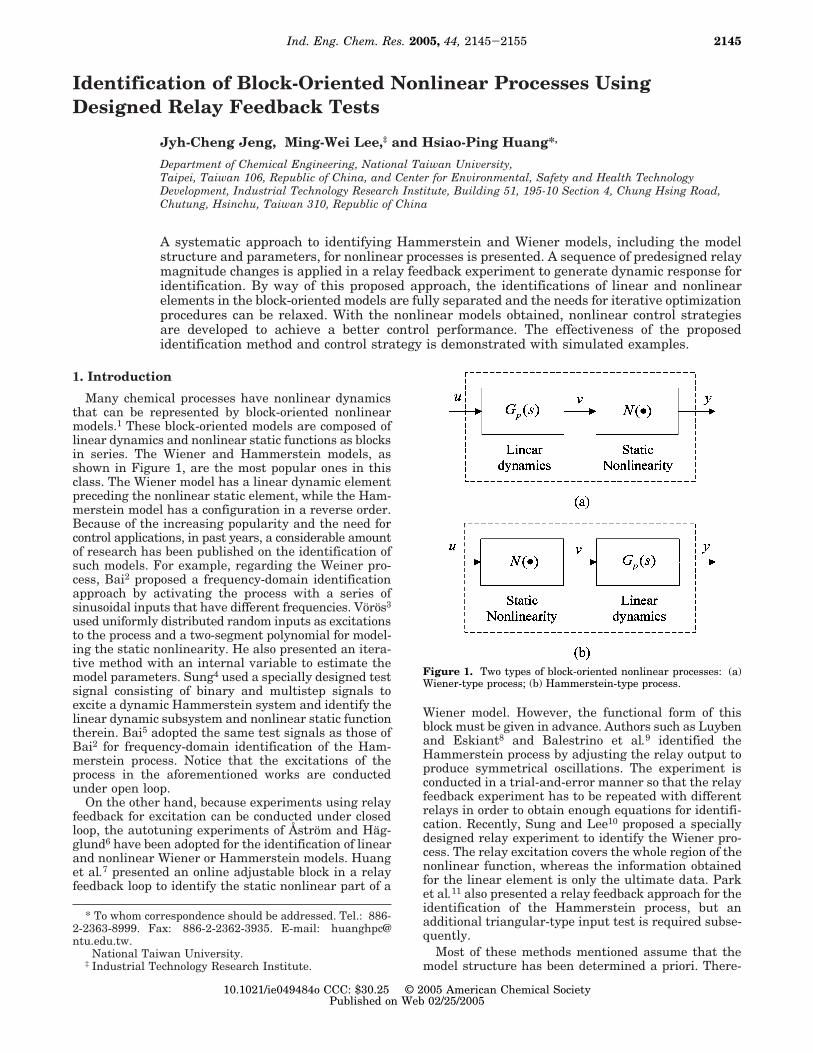
Many chemical processes have nonlinear dynamicsthat can be represented by block-oriented nonlinearmodels.1 These block-oriented models are composed oflinear dynamics and nonlinear static functions as blocksin series. The Wiener and Hammerstein models, asshown in Figure 1, are the most popular ones in thisclass. The Wiener model has a linear dynamic elementpreceding the nonlinear static element, while the Ham-merstein model has a configuration in a reverse order.Because of the increasing popularity and the need forcontrol applications, in past years, a considerable amountof research has been published on the identification ofsuch models. For example, regarding the Weiner pro-cess, Bai2 proposed a frequency-domain identificationapproach by activating the process with a series ofsinusoidal inputs that have different frequencies. Voros3
used uniformly distributed random inputs as excitationsto the process and a two-segment polynomial for model-ing the static nonlinearity. He also presented an itera-tive method with an internal variable to estimate themodel parameters. Sung4 used a specially designed testsignal consisting of binary and multistep signals toexcite a dynamic Hammerstein system and identify thelinear dynamic subsystem and nonlinear static functiontherein. Bai5 adopted the same test signals as those ofBai2 for frequency-domain identification of the Ham-merstein process. Notice that the excitations of theprocess in the aforementioned works are conductedunder open loop.
On the other hand, because experiments using relayfeedback for excitation can be conducted under closedloop, the autotuning experiments of Åstrom and Hag-glund6 have been adopted for the identification of linearand nonlinear Wiener or Hammerstein models. Huanget al.7 presented an online adjustable block in a relayfeedback loop to identify the static nonlinear part of a
Wiener model. However, the functional form of thisblock must be given in advance. Authors such as Luybenand Eskiant8 and Balestrino et al.9 identified theHammerstein process by adjusting the relay output toproduce symmetrical oscillations. The experiment isconducted in a trial-and-error manner so that the relayfeedback experiment has to be repeated with differentrelays in order to obtain enough equations for identifi-cation. Recently, Sung and Lee10 proposed a speciallydesigned relay experiment to identify the Wiener pro-cess. The relay excitation covers the whole region of thenonlinear function, whereas the information obtainedfor the linear element is only the ultimate data. Parket al.11 also presented a relay feedback approach for theidentification of the Hammerstein process, but anadditional triangular-type input test is required subse-quently.
Most of these methods mentioned assume that themodel structure has been determined a priori. There-
* To whom correspondence should be addressed. Tel.: 886-2-2363-8999. Fax: 886-2-2362-3935. E-mail: [email protected].
† National Taiwan University.‡ Industrial Technology Research Institute.
Figure 1. Two types of block-oriented nonlinear processes: (a)Wiener-type process; (b) Hammerstein-type process.
2145Ind. Eng. Chem. Res. 2005, 44, 2145-2155
10.1021/ie049484o CCC: $30.25 © 2005 American Chemical SocietyPublished on Web 02/25/2005

fore, only algorithms for parameter estimation wereemphasized. These algorithms are a bit different fromeach other according to the type of process beingidentified. Thus, a reasonable procedure for identifica-tion is to identify the structure of the model in the firststep and choose the appropriate algorithm for parameterestimation in the next.
In this paper, a system of procedures for identifyingblock-oriented nonlinear models is presented. Theseprocedures include the design of relay experiments andthe identification of the model structure and parameterstherein. As a first step, the type of model selected isbased on an important feature of the response from arelay feedback test. Then, for parameter estimation, arelay feedback experiment is designed accordingly. Thestatic nonlinearity of the proposed model is representedby an invertible function defined on an operation range.After a constant cycle has achieved peak values betweenthe switches of relay, the parameters in this functionare determined by a simple least-squares procedure thataims to find coefficients that “best fit” the staticnonlinear function to the data obtained from the de-signed relay experiment. On the basis of the nonlinearfunction identified, a simple transfer function of thelinear subsystem represented by an FOPDT or SOPDTmodel is determined using the frequency-domain method.By way of this approach, identification of the linear andnonlinear parts is separated in sequence and can bedone without any iterative procedure. To demonstratethe advantages of the proposed method, numericalexamples and nonlinear control systems based on theidentified models have been simulated.
2. Identification of the Model Structure
The models in block-oriented form most used forrepresenting the nonlinear processes are the Wiener andHammerstein types, as shown in Figure 1. Both of themcomprise a static nonlinearity N(‚) and a linear dynamicsubsystem Gp(s), but the order of these components isdifferent. In Figure 1, u and y denote the process inputand output, respectively, which are known or measur-able, whereas the internal signal, v, is not measurable.In this paper, the static nonlinear function is assumedto be monotonic, crossing the origin and, hence, invert-ible. Besides, the linear dynamic subsystem is assumedto be open-loop stable.
For the modeling of block-oriented nonlinear pro-cesses, identification of the model structure is the firststep because parameter estimation in the next stepcounts on the model structure being identified. Severalresearchers have studied the identification of the modelstructure,1,12-14 but they have different levels of com-plexity in computation.
In general, it is desirable that experimental dataobtained at the stage of structure identification can alsobe used for parameter estimations so that no extra testsare required. The relay feedback test, as shown inFigure 2a, is suitable for this purpose. The relay output(ur) is given according to the sign of the error (e) asfollows:
The relay is called a symmetric relay if h+ ) |h-|;otherwise, it is called an asymmetric relay. From therelay feedback test, two parameters are normally ob-
tained. One is the amplitude of the periodic outputcurve, and the other is the period. T+ (or T-) and a+ (ora-) are the time period and maximum amplitude,respectively, in a constant cycle, during which thesystem has positive (or negative) output. If the processin this relay feedback loop is a linear one, symmetricoutput cycles with T+ ) T- and a+ ) a- will be observed.However, with the existence of static nonlinearity in anonlinear process, the symmetry in the output of therelay and the system disappears. With different se-quences of blocks in a nonlinear model, the features ofthe output cycles differ. Huang et al.15 presented astrategy for selecting a feasible model structure basedon the observed outputs from a symmetric relay feed-back test. Table 1 summarizes the important featuresof the output curve from linear, Wiener, and Hammer-stein systems. On the basis of the results as shown inTable 1, the feasible model structure of the nonlineardynamic system can be identified. After the modelstructure has been determined, estimation of the pa-rameters can then proceed.
Although the identification of the model structuresis derived from the dynamic behavior of the Wiener andHammerstein processes, it may apply to Wiener-Hammerstein-type or Hammerstein-Wiener-type pro-cesses within a little more conservative range.
3. Parameter Estimations of NonlinearProcesses
The proposed procedures for parameter estimationsof nonlinear processes apply to a class of processes withmonotonic and static nonlinear function. They consistof two steps. Because this proposed method will befocused on their application to control, especially forproportional-integral-derivative (PID; linear or non-linear) systems, the linear model structure adopted foridentification will be confined to transfer functions ofFOPDT or SOPDT. First, to identify the static nonlinearfunction, the relay feedback test of the nonlinear process
ur(t) ) h+ > 0 e(t) > 0h- < 0 e(t) < 0
(1)
Figure 2. (a) Relay feedback experiment for structure identifica-tion of the nonlinear process and parameter estimation of theWiener-type process. (b) Relay feedback experiment for parameterestimation of the Hammerstein-type process.
Table 1. Features of the Response in the SymmetricRelay Feedback Test
linearprocess
Wiener-typeprocess
Hammerstein-typeprocess
period T+ ) T- T+ ) T- T+ * T-amplitude a+ ) a- a+ * a- a+ * a-
2146 Ind. Eng. Chem. Res., Vol. 44, No. 7, 2005

is conducted, where the outputs of relay are sequentiallyassigned to have different magnitudes. Then, a linearmodel of FOPDT or of SOPDT will be identified bymaking use of frequency analysis of the resulting cyclingresponses. One of the particular reasons for using thefrequency-domain method is that it estimates theultimate frequency better than other time-domain meth-ods, especially when a low-order model is the goal. Thedetails of identification procedures for these two typesof models will be described in the following.
3.1. Identification Procedures for the Wiener-Type Model. If a Wiener-type model is identified to beappropriate for a nonlinear process, the remaining workis to estimate the parameters in the model. Toward thispurpose, the relay feedback experiment is conducted intwo periods of time. In the first period of time, desig-nated as Ω1 in Figure 3, a sequence of differentmagnitude levels of symmetric relay outputs are used.Each level of magnitude is applied over two or three ormore cycles and is switched to another level and so on.At this stage, the maximum and minimum values of theconstant cycles for each different level of relay outputare recorded. In the second period of time, designatedas Ω2, the relay becomes slightly asymmetric and thesystem outputs in one constant cycle are collected. Theentire input and output responses of such an experimentare as shown in Figure 3.
After completion of the experiment, the static non-linear function is estimated by a nonlinear curve-fittingprocedure using data generated from stage Ω1. Whenthe static nonlinearity is finished, the internal variablev(t) is reconstructed through an inverse function of theobtained nonlinear function. Also, a linear model ofFOPDT or SOPDT is identified using u(t) and v(t) inthe time period of Ω2 as the input and output of thelinear subsystem, respectively. The details of the iden-tification procedures are given as follows.
3.1.1. Identification of a Static Nonlinear Func-tion. Assume that h+,i and h-,i are the relay outputs,which are symmetric (h+,i ) |h-,i| ) hi) in the period ofΩ1. For the Wiener-type process, the relay shifts syn-chronically with v(t), which is proportional in magnitudeto the magnitude of the relay output being applied when
a stable limit cycle is achieved. Thus, the followingresults can be found in each designed magnitude of therelay signals:
where v+,i and v-,i represent the maximum and mini-mum of v(t), respectively, in one constant cycle. Noticethat v+,i ) |v-,i| ) vi.
It is important to note that, in the block-orientednonlinear models such as the Wiener one, any two [Gp-(s)/R, N(R)] pairs with different values of R (R * 0) areessentially equivalent. To make the identification con-sistent and unique, when a proper R is chosen, the valueof v1 can be taken as 1. With this assumption and therelations in eq 2, although being unmeasurable, themaximum and minimum values of v(t) can be impliedby the relay magnitude being applied.
The static nonlinearity [N(‚)] then maps the internalvariables v+,i and v-,i to y+,i and y-,i, respectively, wherey+,i and y-,i are the maximum and minimum values ofsystem output y(t). That is, for each designed relaysignal, we have
As a result, for each relay magnitude (i.e., for each i),two points, (h+,i/h1, y+,i) and (h-,i/h1, y-,i), on the N(‚)curve can be obtained.
After all of the data sets of (h+,i/h1, y+,i) and (h-,i/h1,y-,i), i ) 1, 2, ..., I, are collected, the nonlinear staticfunction is identified to correlate these data sets bylinear regression. Let θ be the parameter vector of thenonlinear static function to be determined, i.e., y )N(v;θ). Usually, this function is a polynomial and θconsists of its coefficients of different orders. Thus, the
Figure 3. Response of the relay feedback experiment for identification of the Wiener-type process.
h+,i
h+,1)
v+,i
v+,1or
h+,i
h1)
v+,i
v1
h-,i
h-,1)
v-,i
v-,1or
h-,i
h1)
v-,i
v1(2)
y+,i ) N(v+,i) ) N(h+,i/h1)
y-,i ) N(v-,i) ) N(h-,i/h1) (3)
Ind. Eng. Chem. Res., Vol. 44, No. 7, 2005 2147

identification problem for the static nonlinearity isformulated as the following curve-fitting problem:
Notice that a standard least-squares software routinecan be used to solve this above problem. At the sametime, the inverse function of the static nonlinearity,N-1(‚), can also be found using the same data set inreverse order. This inverse function will be used in thenext step to identify the dynamic linear subsystem.More importantly, the inverse function is very usefulfor the nonlinear controller design.
3.1.2. Identification of a Dynamic Linear Sub-system. Because the inverse function of the staticnonlinearity of the process has been identified, theunmeasurable internal signal can be reconstructed fromv(t) ) N-1[y(t)]. As a result, by taking v(t) as the systemoutput, identification of a linear subsystem in a Wienermodel is the same as that of a linear system in a relayfeedback test.
The data collected in the period of Ω2, where the relayoutput is asymmetric, are used in this step. The asym-metric relay employed has two main purposes. One isto compute the steady-state gain of the linear sub-system, and the other one is to classify the modelstructure of this linear subsystem.
When the system at stage Ω2 exhibits constant cycleswith period Pr, from the dc components of the input andoutput of the linear subsystem, i.e., ur(t) and v(t), thesteady-state gain of Gp(s) can be computed as
Also, the frequency responses of Gp(s) at certain nonzerofrequencies can be estimated from the coefficients ofFourier series expansion of ur(t) and v(t) as
where ωr ) 2π/Pr. So far, the steady-state gain andfrequency response, at the frequency nωr, of Gp(s) havebeen estimated. Next, a transfer function model for thelinear subsystem is to be identified. The models con-sidered for this identification are confined to being ofFOPDT or SOPDT. This is because these two types ofmodels resemble most dynamic behaviors of real pro-cesses. Model structures between these two are deter-mined along with the estimation of the parameters inthat model being considered. The procedures of theidentification of such a linear model are described asfollows.
(i) Model Structure Identification. For a trulyfirst-order process, its dead time is equal to the timeperiod from v ) 0 to when v reaches a peak (designatedas Π+) or that from v ) 0 to when v reaches a valley(designated as Π-), in an asymmetric relay feedbacktest. Otherwise, for a higher-order process, Π+ will not
be equal to Π-. Accordingly, a simple criterion tovalidate if a FOPDT model is adequate for representingthe linear subsystem is to check if Π+/Π- is close enoughto 1. This criterion can be written as
where ε is an arbitrarily small value as the tolerancefor estimation error. When a proper value is given to ε,eq 7 is used to justify the adequacy of a FOPDT model.If eq 7 is not satisfied, the linear subsystem would beidentified as a SOPDT model.
(ii) Estimation of the FOPDT Model. Assume thatthe unknown Gp(s) is represented as the followingFOPDT model:
Using the magnitude of Gp(jωr), the time constant of theprocess can be directly calculated as follows:
After τ has been obtained, the dead time of the processis then estimated by taking the average value as
(iii) Estimation of the SOPDT Model. If Gp(s) isfound suitable to be characterized by a SOPDT model,then
The parameters a and b are estimated to minimize theerror between |Gp(jnωr)| and the calculated |Gp(jnωr)|from eq 6, for n ) 1 to some specified value nc. Thisoptimization problem can be simply solved by a least-squares method, and the values of a and b can bedirectly estimated from the following equation:
Once the values of a and b are found, the dead timeof the process is estimated as the mean of valuesobtained from the argument relation at each frequency,i.e.
3.2. Identification Procedures for the Hammer-stein-Type Model. For a Hammerstein-type processin a feedback loop that has a symmetric relay controller,the internal signal to the linear subsystem becomesasymmetric because of the static nonlinearity block. In
θ* )
arg minθ
∑i
[N(h+,i
h1
;θ) - y+,i]2
+ [N(h-,i
h1
;θ) - y-,i]2(4)
K )∫t
t+Prv(t) dt
∫t
t+Pr ur(t) dt(5)
Gp(jnωr) )∫t
t+Prv(t) e-jnωrt dt
∫t
t+Prur(t) e-jnωrt dtfor n ) 1, 2, 3, ...
(6)
∆ ) |1 -Π+
Π-| e ε (7)
Gp(s) ) Ke-ds
τs + 1(8)
τ ) x( K|Gp(jωr)|)
2- 1
ωr2
(9)
d ) 13[Π+ + Π- +
arctan(-ωrτ) - ∠Gp(jωr)ωr
] (10)
Gp(s) ) Ke-ds
as2 + bs + 1(11)
a2|Gp(jnωr)|2(nωr)4 + (b2 - 2a)|Gp(jnωr)|2(nωr)
2 )
K2 - |Gp(jnωr)|2 n ) 1, 2, ..., nc (12)
d )1
nc∑n)1
nc [arctan( -bnωr
1 - anωr2) - ∠Gp(jnωr)
nωr] (13)
2148 Ind. Eng. Chem. Res., Vol. 44, No. 7, 2005

other words, although having a symmetric input to theHammerstein process, the linear subsystem is es-sentially activated by the asymmetric relay signal.Therefore, the output of the linear subsystem will notbe symmetric with respect to the setpoint, and thefollowing result will be found for a linear subsystem:
where v+ [)N(h+)] and v- [)N(h-)] represent the valuesof output from the nonlinear block driven by the relay.
The key to identifying the static nonlinearity in aHammerstein model is to have several points on the N(‚) curve. To attain this, the following lemma9 will beuseful.
Lemma 3.1. If the relay feedback system of a Ham-merstein-type process, as shown in Figure 2a, exhibitsa stable limit cycle and the linear element Gp(s) includesan integrator, then the following relation holds:
where T+ and T- are the time durations in a constantcycle during which v(t) has a value of v+ and v-,respectively.
Accordingly, when the nonlinear process is of theHammerstein type after the symmetric relay feedbacktest for model structure identification (designated asstage Ω1), an additional integrator is inserted into thefeedback path of the relay feedback system, as shownin Figure 2b. In this second stage (designated as stageΩ2), the relay will see the linear element as if it includesan integrator so that lemma 3.1 can be applied. Con-sequently, a designed sequence of relay signals is usedto estimate the static nonlinearity of the process. Thissequence of relay output (i.e., h+,i and h-,i) is arrangedas follows:
(1) For i ) 1, h+,1 ) |h-,1| ) h1. This relay output isthe same as that used in model structure identification.
(2) For i ) 2, 3, ..., I1, the positive relay output is fixed,h+,i ) h+,1, and the negative relay output h-,i is variedfor different i.
(3) For i ) I1 + 1, ..., I1 + I2, the negative relay outputis fixed, h-,i ) h-,1, and the positive relay output h+,i isvaried for different i.
Each magnitude of the relay output is applied overtwo or three cycles to develop constant cycles, and thenthe relay output is switched to another magnitude andso on. The entire input and output responses of suchan experiment are as shown in Figure 4. The proceduresfor the identification of nonlinear and linear blocks aregiven in the following.
3.2.1. Identification of the Static Nonlinear Func-tion. The experimental data generated in stage Ω2 areused for identifying the nonlinear block. Let v+,i [)N(h+,i)]and v-,i [)N(h-,i)] designate the positive and negativevalues of v(t) when the relay shifts between h+,i and h-,iin stage Ω2. Moreover, T+,i and T-,i are used to representthe time durations in one cycle, within which v(t) andur(t) remain positive and negative values, respectively.From the experimental data and applying lemma 3.1,we have
When eq 16 is substituted into eq 18, it follows that
Again, as has been mentioned, the gains of nonlinearand linear blocks are not unique, and any two [RN(‚),Gp(s)/R] pairs with different values of R (R * 0) are
Figure 4. Response of the relay feedback experiment for identification of the Hammerstein-type process.
v-,1
v+,1) -
T+,1
T-,1, i ) 1 (16)
v-,i
v+,i)
v-,i
v+,1) -
T+,i
T-,i, i ) 2, 3, ..., I1 (17)
v+,i
v-,i)
v+,i
v-,1) -
T-,i
T+,i, i ) I1 + 1, ..., I1 + I2 (18)
v+,i
v+,1)
T-,i
T+,i
T+,1
T-,1, i ) I1 + 1, ..., I1 + I2 (19)
v+
v-*
y+
y-(14)
v+
v-) -
T-
T+(15)
Ind. Eng. Chem. Res., Vol. 44, No. 7, 2005 2149

essentially equivalent for the Hammerstein-type pro-cess. Therefore, the value of v+,1 can be normalized tobe 1, without loss of generality. Consequently, with therelations of eqs 16, 17, and 19, the unmeasurable signalv(t) can be implied by the time durations between shiftsof ur(t), which is measurable. In this way, several pointsof (h+,i, v+,i), i ) 1, I1 + 1, ..., I1 + I2, and (h-,i, v-,i), i )1, 2, ..., I1, on the N(‚) curve can be obtained.
With these data sets, the static nonlinearity of theprocess can be approximated by some nonlinear func-tion. The method is similar to that for the Wiener-typemodel. Let θ be the parameter vector of the nonlinearstatic function to be determined, i.e., v ) N(u;θ). Theidentification problem for the static nonlinearity isformulated as the following curve-fitting problem:
Notice that the inverse function of the static nonlinear-ity is not required for the following identification of thelinear subsystem. However, it can be similarly foundfrom the data sets if it is desired for other purposes.
3.2.2. Identification of the Linear Subsystem. Forthe identification of the linear subsystem, the data ofstage Ω1 are used in this step. The procedures of theidentification for the linear subsystem of the Hammer-stein process are the same as those described in theWiener process. In stage Ω1, the relay outputs are h+,1and h-,1, which are mapped into v+,1 and v-,1, respec-tively, through the nonlinearity. The values of v+,1(assumed to be 1) and v-,1 have been found in theprevious step, and their durations, T+ and T-, can bemeasured from ur(t). The identification of the linearsubsystem is rather straightforward. First, the steady-state gain of the linear subsystem is computed as
where Pr ()T+ + T-) is the oscillation period in stageΩ1. In addition, the frequency responses of Gp(s) can beestimated as
For modeling Gp(s) as an FOPDT or SOPDT model,the procedures are described as follows:
(1) In the beginning, the model structure of the linearsubsystem is identified by the simple criterion of eq 7.
(2) If Gp(s) can be represented by an FOPDT model,compute τ with eq 9 and estimate d with eq 10.
(3) If Gp(s) has to be modeled as an SOPDT model,estimate a and b with eq 12 through a least-squaresmethod and estimate d with eq 13.
Remarks.(1) The relay signal is designed before the parameter
estimations so that no online adaptation of the relayoutput is required. Performing the relay feedback testin this way for identification will be more convenientthan trial with displacing the relay online.
(2) For the Wiener process, in stage Ω1, the numberof data points on the N(‚) curve can be obtained is 2I (Ifor positive input and I for negative input) if the relayoutputs are designed as I different magnitudes. For theHammerstein process, in stage Ω2, the number of datapoints on the N(‚) curve can be obtained is I1 + I2 + 1(I2 + 1 for positive input and I1 for negative input) ifthe relay outputs are designed as I1 + I2 differentmagnitudes. With more data points obtained, betteraccuracy can be achieved. Thus, tradeoff is necessarybetween the accuracy of identification and the experi-mental time.
(3) The duration of the experiment depends on thenonlinearity of the static function and the dynamics ofthe process because it is closely related to the poly-nomial for representing the nonlinearity. Fortunately,for simple monotonic static functions, a low-orderpolynomial provides feasibility for curve fitting. Thus,the duration of the experiment can be essentiallyreduced to the time it takes for a few more constantcycles rather than the time it takes for linear systems.
(4) The magnitude of the relay experiment is anotherissue. The most important issue is to let the nonlinearvariable involved cover the possible operating range sothat no extrapolation to the nonlinear static model willbe needed for practical implementations.
3.3. Adaptation to Measurement Noises. It isenviable that measured output will accompany somenoises. For small noises, the data used for identificationcan be taken as the average values of the measurementsfrom several constant cycles. Therefore, the results fromthe proposed identification method would not be toosensitive to weak noises. For strong noises, the mea-sured signals need to be pretreated by a filter to reducethe effect of measurement noises. During the relayfeedback experiment, the input to the process consistsof only periodic pulses. As a result, the output signalsfrom the process will also be periodic within the samefrequency range. Without distortions of the major outputsignal content during filtering, the wavelet transformis one of the most efficient methods recommended forthis purpose. Wavelets are a family of basis functions,well localized in both time and frequency domains.Because of their local character, the representation ofa signal in the wavelet domain is sparse and allowssignal compression and denoising. The procedures of thesignal denoising are (1) decomposition of the signal intodifferent frequency bands, (2) thresholding (eliminationof small coefficients), and (3) reconstruction of thesignal.
The wavelets used in the following simulation workare the discrete Meyer wavelets. After the measure-ments are denoised, the identification procedures canthen be applied.
4. Illustrative Examples for Identification andControl
In the following section, the identification togetherwith the controller design will be demonstrated. Oncethe model of the block-oriented nonlinear process is
θ* ) arg minθ
∑i
[N(h+,i;θ) - v+,i]2 +
∑i
[N(h-,i;θ) - v-,i]2 (20)
K )∫t
t+Pry(t) dt
∫t
t+Pr v(t) dt)
∫t
t+Pry(t) dt
v+,1T+ + v-,1T-)
∫t
t+Pry(t) dt
T+ + v-,1T-
(21)
Gp(jnωr) )∫t
t+Pry(t) e-jnωrt dt
∫t
t+Prv(t) e-jnωrt dt)
∫t
t+Pry(t) e-jnωrt dt
∫t
t+T+e-jnωrt dt + v-,1∫t+T+
t+Pre-jnωrt dt
for n ) 1, 2, 3, ... (22)
2150 Ind. Eng. Chem. Res., Vol. 44, No. 7, 2005

obtained, a control system can be designed accordingly.The control strategies are shown in parts a and b ofFigure 5 for the Wiener and Hammerstein processes,respectively. In Figure 5a,b, an inverse of the identifiedstatic nonlinear function is imbedded into the controlloop to make the system equivalent to a linear loop, asshown in Figure 5c,d. Then, the linear PID controllercan be designed, and control performances such as thoseof linear systems can be achieved. Because the systemis equivalent to a linear one, various tuning rules canbe applied to the design for the PID controller. Forexample, to implement the autotuning procedures ofÅstrom and Hagglund,6 only the static nonlinear blockwill be determined, and when the controller is replacedwith a relay in the system of parts a or b of Figure 5,the PID controller settings can be easily obtained. Onthe other hand, if the transfer function for the linearsubsystem is also identified, methods of the model-basedcontroller design can be used.
Two example processes are used to demonstrate theproposed identification procedures and control. Example1 is a Wiener-type process, and example 2 is a Ham-merstein-type process.
4.1. Example 1: Wiener Process. Consider a Wiener-type process with the following structure:
To show the effect of measurement noise, the outputof the process is added with a random number that isof uniform distribution with zero mean and a standarddeviation, σ, of 0.025. The value of the noise-to-signalvariance ratio is about 0.05, while the relay amplitudeis set to 0.5. Because of the presence of measurementnoise, the data used for identification are taken as theaverage values of the measurement from two or threecycles. Figure 6a (from t ) 0 to 30) shows the outputresponse from a symmetric relay (h+,1 ) |h-,1| ) h1 )1) feedback experiment. As a result, the time periods
Figure 5. Control system for nonlinear processes: (a) Wiener process; (b) Hammerstein process. Equivalent control systems; (c) Wienerprocess; (d) Hammerstein process.
Linear subsystem
Gp(s) ) 1.5e-s
(4s2 + 2s + 1)(s2 + s + 1)(23)
Nonlinear static element
y ) (1 - e-0.25v)x|v3| (24)
Ind. Eng. Chem. Res., Vol. 44, No. 7, 2005 2151

and maximum amplitudes of positive and negativeoutputs are
It is concluded that a Wiener model could fit the process.Because a nonlinear model structure was determined,
a sequence of designed relay signals, as shown in Figure6b, is used to estimate those parameters of the nonlinearmodel of the Wiener process. Table 2 summarizes theapplied relay magnitudes and features of the processoutputs in stage Ω1.
The next step is to identify the static nonlinearity.According to the data of (h+,i/h1, y+,i) and (h-,i/h1, y-,i),i ) 1, ..., 4, shown in Table 2, and when an optimizationprocedure is employed to minimize the objection func-tion of eq 4, the following polynomial is found toapproximate the nonlinear static function:
Figure 6. Relay feedback experiment for example 1: (a) process output y; (b) relay output ur; (c) reconstructed internal variable v.
Table 2. Features of the Responses in Stage Ω1 for Example 1
I II III IV
i + - + - + - + -
hi 1 -1 0.5 -0.5 1.5 -1.5 2 -2yi 0.884 -1.335 0.098 -0.122 2.278 -4.451 4.145 -10.282vi
v+,1( )
hi
h+,1) 1 -1 0.5 -0.5 1.5 -1.5 2 -2
T+ ) 5.42 T- ) 5.40
|1 -T+
T-| ) 0.004 < ε ) 0.05
a+ ) 0.884 a- ) 1.335
|1 -a+
a-| ) 0.338 . ε ) 0.05
y ) N(v) ) -0.056v5 - 0.171v4 + 1.122v3 -0.086v2 + 0.010v (25)
2152 Ind. Eng. Chem. Res., Vol. 44, No. 7, 2005

Figure 6c shows the internal signal v reconstructed bythe inverse nonlinear function. Notice that it looks likethe typical response of a linear process in a relayfeedback loop.
On the basis of the reconstructed v in stage Ω2, thesteady-state gain and the frequency responses of thelinear subsystem are computed by eqs 5 and 6. Then, alinear transfer function model of FOPDT or SOPDT willbe identified. From v in stage Ω2, the following resultcan be found:
It is concluded that the SOPDT model could fit thelinear subsystem of the process. Consequently, theestimated result is
Figure 7 shows the result of the identified staticnonlinearity where the input of the real nonlinearfunction is scaled by a factor of 1.818 ()1.5/0.825) tocompare it with the identified result. We can see thatthe proposed identification method provides an excellentnonlinear model. Figure 8 compares the control perfor-mance of the proposed nonlinear control strategy andthe linear PID controller. The PID parameters arecomputed using the IMC tuning rule based on a lineardynamic subsystem. The nonlinear controller showssatisfactory responses regardless of the set-point valuesbecause it cancels the nonlinearity, whereas the linearPID controller shows acceptable performances for onlysome set points.
To simulate the presence of stronger noise, a noise of0.075 standard deviation is added to the output of theprocess. The noise-to-signal variance ratio is 9 timesthat of the previous case. To reduce the effect ofmeasurement noise, the output signal is filtered bywavelets before employing the optimization procedure.Accordingly, the identified static nonlinearity is alsogiven in Figure 7, and the result of control is similar tothat shown in Figure 8.
4.2. Example 2: Hammerstein Process. Considerthe following Hammerstein-type process:
Similarly, a noise of 0.025 standard deviation is addedto the output of the process.
On the basis of the result of the symmetric relayfeedback response in stage Ω1, the time periods andmaximum amplitudes of positive and negative outputsare
Obviously, T+ * T- and a+ * a-. It can thus be inferredthat a Hammerstein model could fit the process.
To estimate the static nonlinear function, an ad-ditional integrator is inserted in the feedback loop (seeFigure 2b) and a sequence of designed relay signals areapplied to activate the process during stage Ω2. Themeasured and computed results of stage Ω2 are givenin Table 3. Then, on the basis of the data of (h+,i, v+,i)and (h-,i, v-,i) shown in Table 3, the nonlinear staticfunction of this process was estimated by employing an
Figure 7. Identification result for the static nonlinear functionin example 1.
Π+ ) 3.08 Π- ) 2.70
|1 -Π+
Π-| ) 0.141 . ε ) 0.05
Gp(s) ) 0.825e-2.30s
3.47s2 + 1.79s + 1(26)
Figure 8. Control performances of example 1.
Table 3. Features of the Responses in Stage Ω2 forExample 2
I II III IV
i + - + - + - + -
hi 1 -1 1 -0.5 1 -1.5 1 -2Ti 14.82 7.07 7.00 15.92 27.55 4.75 45.79 3.65vi/v+,1 1 -2.095 1 -0.440 1 -5.804 1 -12.812
V VI VII
i + - + - + -
hi 2 -1 1.5 -1 0.5 -1Ti 8.44 11.71 10.40 9.45 32.18 9.45vi/v+,1 2.908 -2.095 1.903 -2.095 0.3108 -2.095
Nonlinear static element y ) (1 - e-0.75u)|u| (27)
Linear subsystem Gp(s) ) 1(s + 1)5
(28)
T+ ) 3.60 T- ) 5.44
|1 -T+
T-| ) 0.339 . ε ) 0.05
a+ ) 0.255 a- ) 0.499
|1 -a+
a-| ) 0.489 . ε ) 0.05
Ind. Eng. Chem. Res., Vol. 44, No. 7, 2005 2153

optimization procedure to minimize the objection func-tion of eq 20 and the result is as the following:
where u ∈ (-2, 2).Now, the outputs of the nonlinear element in stage
Ω1 are known, from stage Ω2, as v+,1 ) 1 and v-,1 )-2.095, so that the steady-state gain and the frequencyresponses of the linear subsystem are computed by eqs21 and 22. Furthermore, data measured in stage Ω1show that
Accordingly, the linear subsystem has to be modeledas SOPDT and the parameters of the model are esti-mated as follows:
Figure 9 shows the result of the identified staticnonlinearity where the output of the real nonlinearfunction is multiplied by 1.852 ()1.0/0.54) to compareit with the identified result. It can be seen that theidentified nonlinear function does provide an excellentapproximation. Figure 10 compares the control perfor-mance of the proposed nonlinear control strategy andthe linear PID controller. The nonlinear controllershows almost the same and satisfactory responsesregardless of set points because the nonlinearity isremoved, whereas the linear PID controller shows astrong dependence on the set-point values.
5. Conclusions
In this research, a system of procedures for theidentification of Wiener- and Hammerstein-type non-
linear processes have been developed. This method usesa relay feedback test with a sequence of designed relaymagnitudes and, for the Hammerstein process, with anintegrator inserted in the loop. First, the model struc-ture is selected according to the response in the firstfew cycles, and then the model parameters of thenonlinear static function and linear dynamic subsystemare estimated in a sequential order. By way of thisapproach, the identification problems of the nonlinearstatic function and linear dynamic subsystem areseparated and no iterative procedures should be taken.On the basis of the nonlinear model identified, a controlsystem can be designed to realize better control perfor-mances than those of a locally linearized controller.
The simulation results show that the proposed iden-tification methods provide satisfactory results, andextension to the multivariable systems will be the nextfocus of study in the future.
Figure 9. Identification result for the static nonlinear function in example 2.
v ) N(u) ) -0.028u5 - 0.214u4 + 0.948u3 -0.393u2 + 0.591u (29)
Π+ ) 1.84 Π- ) 2.47
|1 -Π+
Π-| ) 0.253 . ε ) 0.05
Gp(s) ) 0.54e-1.45s
4.24s2 + 3.43s + 1(30)
Figure 10. Control performances of example 2.
2154 Ind. Eng. Chem. Res., Vol. 44, No. 7, 2005

Literature Cited
(1) Haber, R.; Unbehauen, H. Structure Identification of Non-linear Dynamic SystemssA Survey on Input/Output Approaches.Automatica 1990, 26, 651.
(2) Bai, E. W. Frequency Domain Identification of WienerModels. Automatica 2003, 39, 1521.
(3) Voros, J. Modeling and Identification of Wiener Systemswith Two-Segment Nonlinearities. IEEE Trans. Control Syst.Technol. 2003, 11, 253.
(4) Sung, S. W. System Identification Method for HammersteinProcesses. Ind. Eng. Chem. Res. 2002, 41, 4295.
(5) Bai, E. W. Frequency Domain Identification of HammersteinModels. IEEE Trans. Autom. Control 2003, 48, 530.
(6) Åstrom, K. J.; Hagglund, T. Automatic Tuning of SimpleRegulators with Specifications on Phase and Amplitude Margins.Automatica 1984, 20, 645.
(7) Huang, H. P.; Lee, M. W.; Tang, Y. T. Identification ofWiener Model Using Relay Feedback Test. J. Chem. Eng. Jpn.1998, 31, 604.
(8) Luyben, W. L.; Eskinat, E. Nonlinear Auto-Tuning Identi-fication. Int. J. Control 1994, 59, 595.
(9) Balestrino, A.; Landi, A.; Ould-Zmirli, M.; Sani, L. Auto-matic Nonlinear Auto-Tuning Method for Hammerstein Modeling
of Electrical Drives. IEEE Trans. Ind. Electron. Control Instrum.2001, 48, 645.
(10) Sung, S. W.; Lee, J. Modeling and Control of Wiener-TypeProcesses. Chem. Eng. Sci. 2004, 59, 1515.
(11) Park, H. C.; Koo, D. G.; Youn, J. H.; Lee, J.; Sung, S. W.Relay Feedback Approaches for the Identification of Hammerstein-Type Nonlinear Processes. Ind. Eng. Chem. Res. 2004, 43, 735.
(12) Billings, S. A.; Voon, W. S. F. Structure Detection andModel Validity Tests in the Identification of Nonlinear Systems.IEE Proc. D 1983, 30, 193.
(13) Haber, R. Structure Identification of Quadratic Block-Oriented Models Based on Estimated Volterra Kernels. Int. J. Syst.Sci. 1989, 20, 1355.
(14) Menold, P. H.; Allgower, F.; Pearson, P. K. NonlinearStructure Identification of Chemical Processes. Comput. Chem.Eng. 1997, 21, S137.
(15) Huang, H. P.; Lee, M. W.; Tsai, C. Y. Structure Identifica-tion for Block-Oriented Nonlinear Models Using Relay FeedbackTests. J. Chem. Eng. Jpn. 2001, 34, 748.
Received for review June 14, 2004Revised manuscript received January 17, 2005
Accepted January 25, 2005
IE049484O
Ind. Eng. Chem. Res., Vol. 44, No. 7, 2005 2155