identification of bitter compounds in whole wheat...
TRANSCRIPT

Food Chemistry 141 (2013) 1345–1353
Contents lists available at SciVerse ScienceDirect
Food Chemistry
journal homepage: www.elsevier .com/locate / foodchem
Identification of bitter compounds in whole wheat bread
0308-8146/$ - see front matter � 2013 Elsevier Ltd. All rights reserved.http://dx.doi.org/10.1016/j.foodchem.2013.03.021
⇑ Corresponding author. Tel.: +1 612 624 3201; fax: +1 612 625 5272.E-mail address: [email protected] (D.G. Peterson).
Deshou Jiang, Devin G. Peterson ⇑Department of Food Science and Nutrition, University of Minnesota, 1334 Eckles Avenue, 145 FScN Building, St. Paul, USA
a r t i c l e i n f o a b s t r a c t
Article history:Received 8 October 2012Received in revised form 12 February 2013Accepted 6 March 2013Available online 13 March 2013
Keywords:Whole grain wheat breadMaillard reactionBitterOff-line 2D HPLC separation
Bitterness in whole wheat bread can negatively influence product acceptability and consumption. Theoverall goal of this project was to identify the main bitter compounds in a commercial whole wheat breadproduct. Sensory-guided fractionation of the crust (most bitter portion of the bread sample) utilisingliquid–liquid extraction, solid-phase extraction, ultra-filtration and 2-D offline RPLC revealed multiplebitter compounds existed. The compounds with the highest bitterness intensities were selected andstructurally elucidated based on accurate mass-TOF, MS/MS, 1D and 2D NMR spectroscopy. Eight bittercompounds were identified: Acortatarins A, Acortatarins C, 5-(hydroxymethyl)furfural(HMF), 2,3-dihy-dro-3,5-dihydroxy-6-methyl-4(H)-pyran-4-one (DDMP), N-(1-deoxy-D-fructos-1-yl)-L-tryptophan(ARP), Tryptophol (TRO), 2-(2-formyl-5-(hydroxymethyl-1H-pyrrole-1-yl)butanoic acid (PBA) and Tryp-tophan (TRP). Based on the structures of these compounds, two main mechanisms of bitterness genera-tion in wheat bread were supported, fermentation and Maillard pathways.
� 2013 Elsevier Ltd. All rights reserved.
1. Introduction example, these methods have been applied to identify various
Cereal based foods have been a staple source of nutrients forhumans since the advent of agriculture about 10,000 years ago.With the introduction of the roller mill in the late nineteenth cen-tury, the consumption of refined grain products surpassed wholegrain products consumption mainly because of superior flavorattributes. More recently public awareness of ‘healthier’ foodchoices has helped reverse this trend (Slavin, 2004). Numerous epi-demiological studies have reported whole grain consumption canreduce the risk of several chronic diseases, such as cardiovasculardisease, diabetes, and cancer, and may help with weight mainte-nance (Vitaglione, Napolitano, Fogliano, 2008). However, from amanufacturing standpoint, the development of high quality wholegrain food is challenging due to inferior flavor attributes in com-parison to products made with refined grain. Bakke and Vickers(2007) reported people preferred refined grain bread to wholegrain bread when both were made with equivalent ingredients (re-fined versus whole grain flour). Among all of the flavor attributes,they suggested higher perceived bitterness in whole grain breadwas believed to contribute to poorer consumer acceptability.
Bitterness in whole grain rye has been related to the intrinsicphenolic compounds or the hydroxycinnamic acids (Heinio et al.,2008). However, these compounds were not ‘tasted’ or shown tobe bitter at the concentrations in rye flour. In food systems, sen-sory-guided fractionation/identification techniques have beenwidely applied to define both aroma and taste compounds. For
previously unknown bitter tastants in cocoa (Stark, Bareuther, &Hofmann, 2005; Stark, Bareuther, & Hofmann, 2006; Stark &Hofmann, 2005a; Stark & Hofmann, 2005b) and coffee (Frank,Blumberg, Krümpel, & Hofmann, 2008; Frank, Blumberg, Kunert,Zehentbauer, & Hofmann, 2007; Frank, Zehentbauer, & Hofmann,2006).
The main goal of this study was to identify bitter compounds ina whole wheat bread sample by application of sensory-guided frac-tionation. Defining the chemical structures of bitter compounds inwhole wheat bread provides insight into the origin of bitternessand an improved basis for flavor improvement strategies.
2. Materials and methods
2.1. Bread
Arnold Soft Family 100% whole wheat breads were purchasedfrom the local grocery store (Roseville, MN) and frozen immedi-ately (�20 �C) prior to use.
2.2. Chemicals
All the chemicals were purchased from Sigma–Aldrich Co. (St.Louis, MO). High performance liquid chromatography (HPLC) sol-vents were purchased from EMD Chemicals (Gibbstown, NJ).
2.3. Solvent extraction of whole grain bread crust
Bread crust was separated by knife from whole wheat bread.The removed crust (400 g) was crushed in a blender with liquid

1346 D. Jiang, D.G. Peterson / Food Chemistry 141 (2013) 1345–1353
nitrogen, and then extracted with hexane (5 � 800 ml) at roomtemperature for 30minutes/extraction. After filtration, the hexanelayers were combined and freed from the solvent in a rotovap toproduce the hexane soluble portion (fraction I). The residue breadcrust materials were then extracted with 20% aqueous ethanolsolution (4 L) for 8 h. The supernatants after centrifugation werepooled together, and the solvent was removed under vacuum togive a residue named fraction II. In addition, the insoluble residueof the extracted bread crust was freeze-dried to give fraction III.The yields and bitter taste intensities of individual fractions ob-tained are reported in Table 1.
2.4. Solid phase extraction
A solution of fraction II (6 g) in 60 ml 10% aqueous methanolwas loaded into a 60 ml, 10 g Resprep SPE cartridge (Restek, Belle-fonte, PA) and washed with 30 ml of water. The relatively hydro-phobic analytes retained by SPE were eluted by 60 ml methanol.The eluent from the water wash (hydrophilic portion) was re-loaded into the SPE cartridge. This cartridge was washed with30 ml water again. The retained analytes were eluted with another60 ml methanol. The methanol isolates were pooled together, andthe solvent was removed under vacuum to yield hydrophilic frac-tion II-1 and hydrophobic portion fraction II-2, respectively. Theyields and bitter taste intensities of individual fractions obtainedare reported in Table 1.
2.5. Multiple-step ultrafiltration (UF)
A solution of fraction II-2 (3.6 g) in 50 ml water was fraction-ated by using an amicon8200 ultrafiltration cell (Millopore, Bed-ford, MA) sequentially with three membranes YM10, YM5 andYM1 (Millipore, Bedford, MA) with cutoffs at 10, 5 and 1 kD respec-tively, under a nitrogen pressure of 207 kPa. The three permeateultrafiltration fractions, namely fraction II-2-UF1, fraction II-2-UF2 and fraction II-2-UF3, were obtained after freeze-drying. Theyields and bitter taste intensities of individual fractions obtainedare reported in Table 1.
2.6. First dimensional liquid chromatography fractionation
The primary bitter fraction isolated from bread crust (fraction-II-2-UF3; Table 1) was taken up in a mixture (9/1; v/v; 20 ml) ofaqueous formic acid (0.2%; pH 2.1) and methanol, and aliquots(2 ml) thereof were separated by HPLC using a preparative C18 col-umn (21.2 � 250 mm, pursuit 5, Varian, USA). Chromatographywas performed with flow rate at 10 ml/min starting with a mixture(90/10, v/v) of aqueous formic acid (0.2%, pH 2.1) and methanol,thereafter increasing the methanol content to 50% over 45 min,
Table 1Fraction yields and bitterness intensities of bread crust isolates.
Sample Yield (%) Sample amounta (g) Bitterness intensityb
Bread crust – 2.000 4.6 ± 1.2Fraction I 1.21 0.024 0 ± 0Fraction II 9.52 0.190 7.5 ± 2.5Fraction III 90.2 1.804 0.5 ± 0.2Fraction II-1 8.75 1.750 1.2 ± 0.5Fraction II-2 0.95 0.190 8.6 ± 2.3Fraction II-2-UF1 0.05 0.010 0.5 ± 0.2Fraction II-2-UF2 0.02 0.004 0.2 ± 0.1Fraction II-2-UF3 0.89 0.178 8.2 ± 2.6
a Sample amount for sensory analysis based on yield.b Sensory scores were the average of four panelists ± standard deviation. Bitter-
ness scale of 2, 5, 10 was equivalent to 0.03%, 0.08%, 0.15% caffeine aqueous solu-tions, respectively.
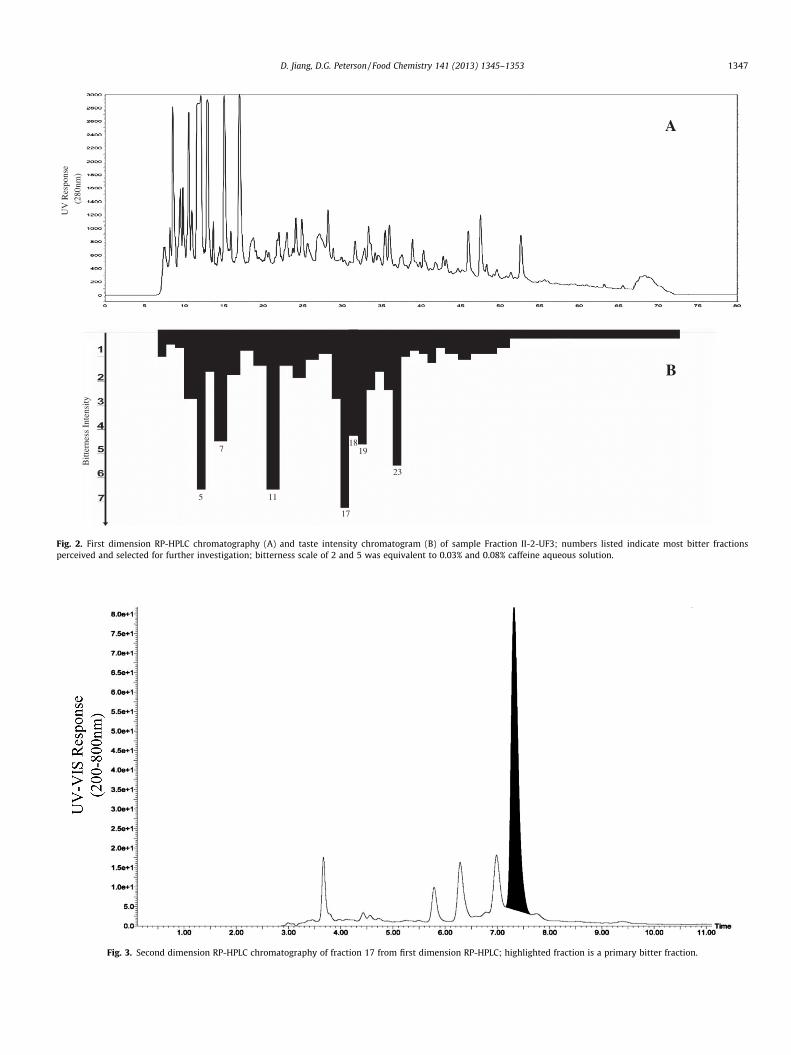
then to 100% over 25 min, and holding additional 10 min. The efflu-ent was collected with a fraction collector in 33 fractions (Fig. 2).The corresponding fractions (termed A1 to A33) obtained from sev-eral runs were combined and freeze-dried. The resulting residuesobtained were then taken up in water (50 ml), and this solutionwas subjected to sensory evaluation for bitterness intensity.
2.7. Second dimensional liquid chromatography fractionation
The HPLC fractions A-5, -7, -11, -17, -18, -19, -23 from the firstdimension were individually dissolved in a mixture (10:90 v/v,2 ml) of methanol and ammonium acetate (10 mM, pH = 5). Afterfiltration, aliquots (50–500 ll) were fractionated by semi-prepara-tive HPLC on a diphenyl column (250 � 10 mm, 5 lm pursuit 5,Varian, USA) using an methanol/ammonium acetate (10 mM,pH = 5) gradient at a flow rate of 5 ml/min. The effluent was sepa-rated into sub-fractions, which were collected in vials by means ofa fraction collector. The corresponding fractions obtained from sev-eral HPLC runs were combined, freed from the solvent in a vacuumand freeze-dried twice. The resulting residue obtained were dis-solved in water and subjected to sensory evaluation for bitternessintensity.
2.8. Prep-LC
The preparative HPLC system consisted of a binary pumpingsystem (LC-8A), a manual injector (SIL-10vp), a column heater, avariable-wavelength UV–Vis detector 280 nm (Shimadzu, SPD-10A), a fraction collector (Shimadzu FRC-10A) and a reverse phaseC18 column (21 mm � 250 mm, 5 lm, pursuit 5, Varian, USA). Thesemi-preparative system consisted of a binary pumping system(LC-10ADvp), an in-line degasser (DGU-14A), an autosampler(SIL-10vp), a water column heater (TCM model, Waters), a diodearray detector (Shimadzu, SPD-M10Avp), a fraction collector (Shi-madzu FRC-10A) and a reverse phase diphenyl column(10 mm � 250 mm, 5 lm, pursuit diphenyl Varian, USA).
2.9. LC–MS-Accurate Mass
Analysis was conducted with Agilent 1100 HPLC system(Columbia, MD) coupled with a Waters Q-TOF mass spectrometer(Q-TOF micro, Milford, CT) equipped with an electrospray ionisa-tion (ESI) probe and lock spray inlet system. Accurate mass acqui-sition of the ion of interest was performed by chromatographyinjection with reserpine as an internal standard. Ten microlitersof sample was injected on analytical C18 column(2.1 mm � 150 mm, 5 lm, pursuit 5, Varian, USA) maintained at
Fig. 1. Perceived bitterness intensity of the curst and crumb region of Arnold SoftFamily 100% whole wheat bread; n = 7 in duplicate; different letters = significantlydifferent at a = 0.05; bitterness scale of 2 and 5 was equivalent to 0.03% and 0.08%caffeine aqueous solution.
Bitt
erne
ss I
nten
sity
UV
Res
pons
e
(280
nm)
5
7
11
17
18 19
23
B
A
Fig. 2. First dimension RP-HPLC chromatography (A) and taste intensity chromatogram (B) of sample Fraction II-2-UF3; numbers listed indicate most bitter fractionsperceived and selected for further investigation; bitterness scale of 2 and 5 was equivalent to 0.03% and 0.08% caffeine aqueous solution.
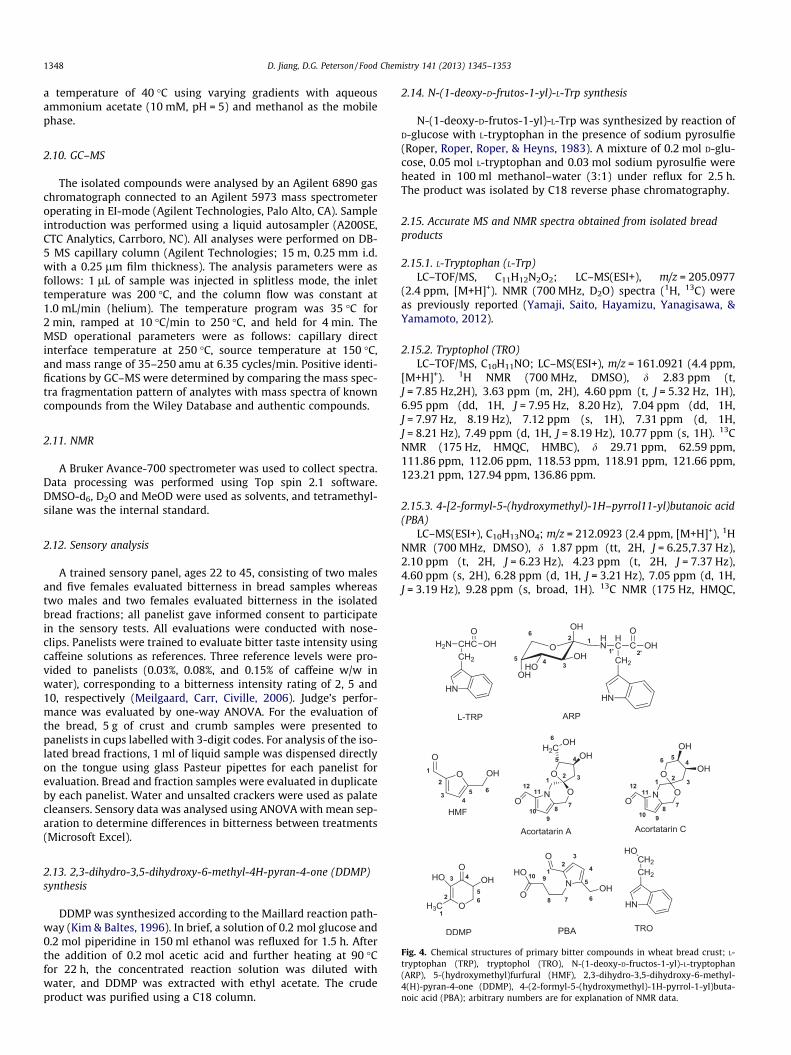
Fig. 3. Second dimension RP-HPLC chromatography of fraction 17 from first dimension RP-HPLC; highlighted fraction is a primary bitter fraction.
D. Jiang, D.G. Peterson / Food Chemistry 141 (2013) 1345–1353 1347
1348 D. Jiang, D.G. Peterson / Food Chemistry 141 (2013) 1345–1353
a temperature of 40 �C using varying gradients with aqueousammonium acetate (10 mM, pH = 5) and methanol as the mobilephase.
2.10. GC–MS
The isolated compounds were analysed by an Agilent 6890 gaschromatograph connected to an Agilent 5973 mass spectrometeroperating in EI-mode (Agilent Technologies, Palo Alto, CA). Sampleintroduction was performed using a liquid autosampler (A200SE,CTC Analytics, Carrboro, NC). All analyses were performed on DB-5 MS capillary column (Agilent Technologies; 15 m, 0.25 mm i.d.with a 0.25 lm film thickness). The analysis parameters were asfollows: 1 lL of sample was injected in splitless mode, the inlettemperature was 200 �C, and the column flow was constant at1.0 mL/min (helium). The temperature program was 35 �C for2 min, ramped at 10 �C/min to 250 �C, and held for 4 min. TheMSD operational parameters were as follows: capillary directinterface temperature at 250 �C, source temperature at 150 �C,and mass range of 35–250 amu at 6.35 cycles/min. Positive identi-fications by GC–MS were determined by comparing the mass spec-tra fragmentation pattern of analytes with mass spectra of knowncompounds from the Wiley Database and authentic compounds.
2.11. NMR
A Bruker Avance-700 spectrometer was used to collect spectra.Data processing was performed using Top spin 2.1 software.DMSO-d6, D2O and MeOD were used as solvents, and tetramethyl-silane was the internal standard.
2.12. Sensory analysis
A trained sensory panel, ages 22 to 45, consisting of two malesand five females evaluated bitterness in bread samples whereastwo males and two females evaluated bitterness in the isolatedbread fractions; all panelist gave informed consent to participatein the sensory tests. All evaluations were conducted with nose-clips. Panelists were trained to evaluate bitter taste intensity usingcaffeine solutions as references. Three reference levels were pro-vided to panelists (0.03%, 0.08%, and 0.15% of caffeine w/w inwater), corresponding to a bitterness intensity rating of 2, 5 and10, respectively (Meilgaard, Carr, Civille, 2006). Judge’s perfor-mance was evaluated by one-way ANOVA. For the evaluation ofthe bread, 5 g of crust and crumb samples were presented topanelists in cups labelled with 3-digit codes. For analysis of the iso-lated bread fractions, 1 ml of liquid sample was dispensed directlyon the tongue using glass Pasteur pipettes for each panelist forevaluation. Bread and fraction samples were evaluated in duplicateby each panelist. Water and unsalted crackers were used as palatecleansers. Sensory data was analysed using ANOVA with mean sep-aration to determine differences in bitterness between treatments(Microsoft Excel).
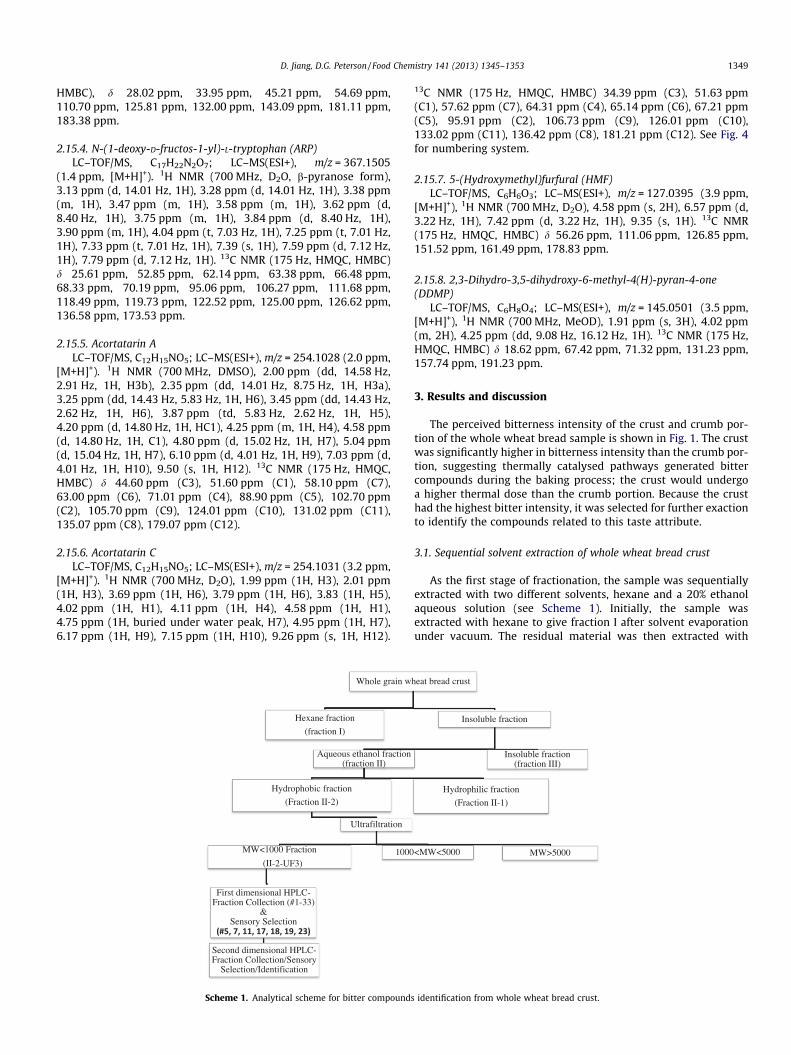
Fig. 4. Chemical structures of primary bitter compounds in wheat bread crust; L-tryptophan (TRP), tryptophol (TRO), N-(1-deoxy-D-fructos-1-yl)-L-tryptophan(ARP), 5-(hydroxymethyl)furfural (HMF), 2,3-dihydro-3,5-dihydroxy-6-methyl-4(H)-pyran-4-one (DDMP), 4-(2-formyl-5-(hydroxymethyl)-1H-pyrrol-1-yl)buta-noic acid (PBA); arbitrary numbers are for explanation of NMR data.
2.13. 2,3-dihydro-3,5-dihydroxy-6-methyl-4H-pyran-4-one (DDMP)synthesis
DDMP was synthesized according to the Maillard reaction path-way (Kim & Baltes, 1996). In brief, a solution of 0.2 mol glucose and0.2 mol piperidine in 150 ml ethanol was refluxed for 1.5 h. Afterthe addition of 0.2 mol acetic acid and further heating at 90 �Cfor 22 h, the concentrated reaction solution was diluted withwater, and DDMP was extracted with ethyl acetate. The crudeproduct was purified using a C18 column.
2.14. N-(1-deoxy-D-frutos-1-yl)-L-Trp synthesis
N-(1-deoxy-D-frutos-1-yl)-L-Trp was synthesized by reaction ofD-glucose with L-tryptophan in the presence of sodium pyrosulfie(Roper, Roper, Roper, & Heyns, 1983). A mixture of 0.2 mol D-glu-cose, 0.05 mol L-tryptophan and 0.03 mol sodium pyrosulfie wereheated in 100 ml methanol–water (3:1) under reflux for 2.5 h.The product was isolated by C18 reverse phase chromatography.
2.15. Accurate MS and NMR spectra obtained from isolated breadproducts
2.15.1. L-Tryptophan (L-Trp)LC–TOF/MS, C11H12N2O2; LC–MS(ESI+), m/z = 205.0977
(2.4 ppm, [M+H]+). NMR (700 MHz, D2O) spectra (1H, 13C) wereas previously reported (Yamaji, Saito, Hayamizu, Yanagisawa, &Yamamoto, 2012).
2.15.2. Tryptophol (TRO)LC–TOF/MS, C10H11NO; LC–MS(ESI+), m/z = 161.0921 (4.4 ppm,
[M+H]+). 1H NMR (700 MHz, DMSO), d 2.83 ppm (t,J = 7.85 Hz,2H), 3.63 ppm (m, 2H), 4.60 ppm (t, J = 5.32 Hz, 1H),6.95 ppm (dd, 1H, J = 7.95 Hz, 8.20 Hz), 7.04 ppm (dd, 1H,J = 7.97 Hz, 8.19 Hz), 7.12 ppm (s, 1H), 7.31 ppm (d, 1H,J = 8.21 Hz), 7.49 ppm (d, 1H, J = 8.19 Hz), 10.77 ppm (s, 1H). 13CNMR (175 Hz, HMQC, HMBC), d 29.71 ppm, 62.59 ppm,111.86 ppm, 112.06 ppm, 118.53 ppm, 118.91 ppm, 121.66 ppm,123.21 ppm, 127.94 ppm, 136.86 ppm.
2.15.3. 4-[2-formyl-5-(hydroxymethyl)-1H–pyrrol11-yl)butanoic acid(PBA)
LC–MS(ESI+), C10H13NO4; m/z = 212.0923 (2.4 ppm, [M+H]+), 1HNMR (700 MHz, DMSO), d 1.87 ppm (tt, 2H, J = 6.25,7.37 Hz),2.10 ppm (t, 2H, J = 6.23 Hz), 4.23 ppm (t, 2H, J = 7.37 Hz),4.60 ppm (s, 2H), 6.28 ppm (d, 1H, J = 3.21 Hz), 7.05 ppm (d, 1H,J = 3.19 Hz), 9.28 ppm (s, broad, 1H). 13C NMR (175 Hz, HMQC,
D. Jiang, D.G. Peterson / Food Chemistry 141 (2013) 1345–1353 1349
HMBC), d 28.02 ppm, 33.95 ppm, 45.21 ppm, 54.69 ppm,110.70 ppm, 125.81 ppm, 132.00 ppm, 143.09 ppm, 181.11 ppm,183.38 ppm.
2.15.4. N-(1-deoxy-D-fructos-1-yl)-L-tryptophan (ARP)LC–TOF/MS, C17H22N2O7; LC–MS(ESI+), m/z = 367.1505
(1.4 ppm, [M+H]+). 1H NMR (700 MHz, D2O, b-pyranose form),3.13 ppm (d, 14.01 Hz, 1H), 3.28 ppm (d, 14.01 Hz, 1H), 3.38 ppm(m, 1H), 3.47 ppm (m, 1H), 3.58 ppm (m, 1H), 3.62 ppm (d,8.40 Hz, 1H), 3.75 ppm (m, 1H), 3.84 ppm (d, 8.40 Hz, 1H),3.90 ppm (m, 1H), 4.04 ppm (t, 7.03 Hz, 1H), 7.25 ppm (t, 7.01 Hz,1H), 7.33 ppm (t, 7.01 Hz, 1H), 7.39 (s, 1H), 7.59 ppm (d, 7.12 Hz,1H), 7.79 ppm (d, 7.12 Hz, 1H). 13C NMR (175 Hz, HMQC, HMBC)d 25.61 ppm, 52.85 ppm, 62.14 ppm, 63.38 ppm, 66.48 ppm,68.33 ppm, 70.19 ppm, 95.06 ppm, 106.27 ppm, 111.68 ppm,118.49 ppm, 119.73 ppm, 122.52 ppm, 125.00 ppm, 126.62 ppm,136.58 ppm, 173.53 ppm.
2.15.5. Acortatarin ALC–TOF/MS, C12H15NO5; LC–MS(ESI+), m/z = 254.1028 (2.0 ppm,
[M+H]+). 1H NMR (700 MHz, DMSO), 2.00 ppm (dd, 14.58 Hz,2.91 Hz, 1H, H3b), 2.35 ppm (dd, 14.01 Hz, 8.75 Hz, 1H, H3a),3.25 ppm (dd, 14.43 Hz, 5.83 Hz, 1H, H6), 3.45 ppm (dd, 14.43 Hz,2.62 Hz, 1H, H6), 3.87 ppm (td, 5.83 Hz, 2.62 Hz, 1H, H5),4.20 ppm (d, 14.80 Hz, 1H, HC1), 4.25 ppm (m, 1H, H4), 4.58 ppm(d, 14.80 Hz, 1H, C1), 4.80 ppm (d, 15.02 Hz, 1H, H7), 5.04 ppm(d, 15.04 Hz, 1H, H7), 6.10 ppm (d, 4.01 Hz, 1H, H9), 7.03 ppm (d,4.01 Hz, 1H, H10), 9.50 (s, 1H, H12). 13C NMR (175 Hz, HMQC,HMBC) d 44.60 ppm (C3), 51.60 ppm (C1), 58.10 ppm (C7),63.00 ppm (C6), 71.01 ppm (C4), 88.90 ppm (C5), 102.70 ppm(C2), 105.70 ppm (C9), 124.01 ppm (C10), 131.02 ppm (C11),135.07 ppm (C8), 179.07 ppm (C12).
2.15.6. Acortatarin CLC–TOF/MS, C12H15NO5; LC–MS(ESI+), m/z = 254.1031 (3.2 ppm,
[M+H]+). 1H NMR (700 MHz, D2O), 1.99 ppm (1H, H3), 2.01 ppm(1H, H3), 3.69 ppm (1H, H6), 3.79 ppm (1H, H6), 3.83 (1H, H5),4.02 ppm (1H, H1), 4.11 ppm (1H, H4), 4.58 ppm (1H, H1),4.75 ppm (1H, buried under water peak, H7), 4.95 ppm (1H, H7),6.17 ppm (1H, H9), 7.15 ppm (1H, H10), 9.26 ppm (s, 1H, H12).
Whole grain w
Hexane fraction
(fraction I)
Aqueous ethanol fraction(fraction II)
Hydrophobic fraction
(Fraction II-2)
Ultrafiltration
MW<1000 Fraction
(II-2-UF3)
First dimensional HPLC-Fraction Collection (#1-33)
&Sensory Selection
Second dimensional HPLC-Fraction Collection/Sensory
Selection/Identification
1000
Scheme 1. Analytical scheme for bitter compounds
13C NMR (175 Hz, HMQC, HMBC) 34.39 ppm (C3), 51.63 ppm(C1), 57.62 ppm (C7), 64.31 ppm (C4), 65.14 ppm (C6), 67.21 ppm(C5), 95.91 ppm (C2), 106.73 ppm (C9), 126.01 ppm (C10),133.02 ppm (C11), 136.42 ppm (C8), 181.21 ppm (C12). See Fig. 4for numbering system.
2.15.7. 5-(Hydroxymethyl)furfural (HMF)LC–TOF/MS, C6H6O3; LC–MS(ESI+), m/z = 127.0395 (3.9 ppm,
[M+H]+), 1H NMR (700 MHz, D2O), 4.58 ppm (s, 2H), 6.57 ppm (d,3.22 Hz, 1H), 7.42 ppm (d, 3.22 Hz, 1H), 9.35 (s, 1H). 13C NMR(175 Hz, HMQC, HMBC) d 56.26 ppm, 111.06 ppm, 126.85 ppm,151.52 ppm, 161.49 ppm, 178.83 ppm.
2.15.8. 2,3-Dihydro-3,5-dihydroxy-6-methyl-4(H)-pyran-4-one(DDMP)
LC–TOF/MS, C6H8O4; LC–MS(ESI+), m/z = 145.0501 (3.5 ppm,[M+H]+), 1H NMR (700 MHz, MeOD), 1.91 ppm (s, 3H), 4.02 ppm(m, 2H), 4.25 ppm (dd, 9.08 Hz, 16.12 Hz, 1H). 13C NMR (175 Hz,HMQC, HMBC) d 18.62 ppm, 67.42 ppm, 71.32 ppm, 131.23 ppm,157.74 ppm, 191.23 ppm.
3. Results and discussion
The perceived bitterness intensity of the crust and crumb por-tion of the whole wheat bread sample is shown in Fig. 1. The crustwas significantly higher in bitterness intensity than the crumb por-tion, suggesting thermally catalysed pathways generated bittercompounds during the baking process; the crust would undergoa higher thermal dose than the crumb portion. Because the crusthad the highest bitter intensity, it was selected for further exactionto identify the compounds related to this taste attribute.
3.1. Sequential solvent extraction of whole wheat bread crust
As the first stage of fractionation, the sample was sequentiallyextracted with two different solvents, hexane and a 20% ethanolaqueous solution (see Scheme 1). Initially, the sample wasextracted with hexane to give fraction I after solvent evaporationunder vacuum. The residual material was then extracted with
heat bread crust
Insoluble fraction
<MW<5000 MW>5000
Hydrophilic fraction
(Fraction II-1)
Insoluble fraction (fraction III)
identification from whole wheat bread crust.

1350 D. Jiang, D.G. Peterson / Food Chemistry 141 (2013) 1345–1353
20% aqueous ethanol for 8 h to produce fraction II after rotaryevaporation and freeze-drying. The final insoluble materials (frac-tion III) had the highest yield, accounting for approximately 90% ofthe dry mass of the whole grain crust (see Table 1). The yields forfraction I and II were 1.21% and 9.52%, respectively. Fraction II wasstrongly bitter, whereas fraction I had a fatty mouth-feel as ex-pected for triglycerides, and fraction III had negligible tasteattributes.
3.2. Solid phase extraction and ultrafiltration
Because bitter compounds are typically relatively hydrophobiccompounds, C18 solid phase extraction was used to clean up sug-ars, salts and other highly hydrophilic interfering compounds. Theretained materials by SPE termed Fraction II-2 (Scheme 1) ac-counted for approximately 8% of weight of the original materialand exhibited predominately bitter attributes (Table 1). In contrast,the hydrophilic portion, termed Fraction II-1 imparted a morecomplex taste sensation but no detectable bitterness (Table 1).To further clean up the sample for improved HPLC separation,ultrafiltration was used to remove larger food polymers (seeScheme 1).The permeate from the UF molecular weight cutoff at1 kDa was reported to be bitter and was termed fraction II-2-UF3. The other UF fractions imparted negligible taste attributes(Table 1).
3.3. Sensory-guided 2D-HPLC fractionation of isolateII-2-UF3 (seeScheme 1)
The bitter compounds were further purified and fractionatedwith a reverse phase, reverse phase (RP-RP) off-line 2D HPLC sys-tem. The selection of column combination was based on the F(-C)value from the hydrophobic subtraction model (Dolan & Snyder,2009; Snyder, Dolan, & Carr, 2004). For the first dimensional sepa-ration, a conventional C18 column (mobile phase methanol and0.2% aqueous formic acid, pH = 2.1) was used to collect 33 sub-frac-tions. All sub-fractions were freeze-dried, taken up in water, andevaluated for bitterness intensities (Fig. 2). The most intense bitterfractions (#5, 7, 11, 17, 18, 19, 23) were selected and further puri-fied on second dimensional HPLC separation (diphenyl columnwith methanol and aqueous ammonium acetate, pH = 5). An exam-ple of the second dimensional chromatogram from fraction 17 isillustrated in Fig. 3; the bitter compound identified in the
Fig. 5. H–H NMR ROESY spe
chromatogram is highlighted in black. After the second dimen-sional analysis of the seven fractions collected from the firstdimension (Fig. 2), eight bitter peaks were identified as the mainbitter regions and eight corresponding bitter compounds were elu-cidated by NMR, LC–MS-TOF, and GC–MS techniques.
For fraction 5 (Fig. 2), 2,3-dihydro-3,5-dihydroxy-6-methyl-4(H)-pyran-4-one (DDMP; Fig. 4) was revealed to be responsiblefor the bitter attribute of this fraction. Based on NMR COSY analy-sis, a CH2–CH and a methyl group were detected. Two hydroxylgroups were also deducted based on the difference between thenumbers of protons in the chemical formula and non-exchangeableprotons detected in 1H spectrum. The methyl group, C1, was deter-mined to be connected to a vinyl group, and the H4 atom was alsofound to be connected to a carbonyl group according to the HMBCspectrum. The structure was further confirmed by GC–MS analysisand comparison with an independently synthesized standard.
In fraction 7 (Fig. 2), hydroxymethylfurfural (HMF; Fig. 4), awell-known Maillard product, was identified as the main bittercompound. A 2,5-substituted furan ring was deduced from thecharacteristic coupling pattern of the protons H3 and H4 that werecorrelated two vinyl carbons (HMBC). An aldehyde group and amethylhydroxyl group were deduced from chemical shifts of H1and H6. This compound was further confirmed by GC–MS libraryidentification and an authentic standard.
For fraction 12 (Fig. 2), two bitter compounds were identified, L-tryptophan (L-TRP; Fig. 4) and the tryptophan-Amadori compound(ARP; Fig. 4). Tryptophan was easily identified by the NMR spectraand further compared to an authentic compound. 1H NMR spec-trum of the tryptophan-Amadori compound demonstrated co-exis-tence of several tautomers, which is typical for hexose sugarspectrum. Further analysis of other proton signals and the corre-lated quaternary carbon in HMBC spectrum disclose the presenceof one hexose moiety, corresponding to six carbon resonances atdC 52.85 ppm, 62.14 ppm, 66.48 ppm, 68.33 ppm, 70.19 ppm,95.06 ppm. The absence of HMBC cross peak in the sugar anomericregion indicated this hexose was a ketose. The pyranose ring struc-ture was deducted by a HMBC correlation of the H-6 with a quater-nary carbon C2. The NMR spectra also indicated a tryptophanmoiety. The connectivity between sugar moiety and TRP moietywas confirmed by both presence of HMBC correlation of H1/C10
and absence of HMBC correlation H1/C20. The compound was fur-ther confirmed by NMR spectra comparison with an independentsynthetic compound.
ctrum of Acortatarin A.

CHO
OHH
HHO
OHH
OHH
CH2OH
OHH
HHO
OHH
OHH
CH2OH
NR
Protein
Fermentation
CH2CH2
HN
HO
HN HCC
CH2
OH
O
HN
O
OH
OHHOOH
2,3-Enolizationfollowed bydeamination
1,2-Enolizationfollowed bydeamination
O
CH2OHH
OHH
CH2OH
O CH3O
OHH
OHH
CH2OH
O
O
O
OH
O
OHO OH
Hemiketal formationand followed bydehydrationDe
hydration
OH2C
OH
OHHO
HO
H2N
NO
O
OOH
NH2
O
OH
NHOO
O
NO
OCH2
HOO
HOHO
HO
O
O O
Glucose
TRO
H2N CHCCH2
OHO
HN
TRP(Amino acids)
ARP(Amadori Compounds)
3-DG 1-DG
HMF DDMP
Strecker
degradation
Imine
1,3-Dideoxy-1-amino-f ructose
γ-Aminobutyric acid
PBA Acortatarin AAcortatarin C
Reduction
Ferm
entation
6-hydroxy-2,5-dioxohexanal
Scheme 2. Proposed bitterness generation map in whole wheat bread; all bitter compounds identified are in italics font; consists of both fermentation and Maillardpathways.
D. Jiang, D.G. Peterson / Food Chemistry 141 (2013) 1345–1353 1351
For fraction 19 (Fig. 2), 4-(2-formyl-5-(hydroxymethyl)-1H-pyr-rol-1-yl) butanoic acid (PBA, Fig. 4) was revealed to be the primarybitter tastant. The presence of an alkyl chain CH2–CH2–CH2 was re-ported by COSY. One end of this alkyl chain was connected to car-bonyl carbon resonating at 183.38 ppm. The vicinal couplingconstant of J = 3.19 Hz observed for two olefinicmethine H3 andH4 disclosed the presence of 2,5-disubstituted pyrrole ring. Thetwo proton signals resonating at 9.28 ppm and 4.60 ppm assignedthe substituted function groups in the pyrrole ring to be formyl andhydroxymethyl group. This compound was further confirmed byindependent synthesis.
For fraction 18 (Fig. 2), a novel compound so-named AcortatarinA (Fig. 4) was identified as the bitter compound. MS-TOF analysis
of the bitter compound reported a molecular weight of 254.1028(M+H)+1 with the predicted formula for pseudomolecular ion ofC12H15NO5, indicating six degrees of unsaturation. Direct compari-son of NMR data of PBA in fraction 19 (Fig. 5) with the currentcompound revealed the presence of a 5-methylene-pyrrole-2-carb-aldehye moiety. The methylene group was concluded to be con-nected to an oxygen atom based on the chemical shift(dC = 58.1 ppm). Further analysis of the remaining carbon signalsresonating at dC = 44.60 ppm, 51.60 ppm, 63.00 ppm, 71.01 ppm88.90 ppm, 102.70 ppm strongly suggested the presence of adeoxysugar moiety. This conclusion is further supported by COSYcorrelation of H3/H4/H5/H6 and HMBC correlation of H1/C2,C3,H3/C2,C4,C1, C5, and H6/C5,C4 (Fig. 4). The furanose ring structure

1352 D. Jiang, D.G. Peterson / Food Chemistry 141 (2013) 1345–1353
was confirmed by the presence HMBC correlation H5/C2 and theabsence of HMBC correlation H6/C1. The remaining connectivitywas finally deducted by the degree of unsaturation and molecularformula. The relative configuration of this compound was assignedvia ROESY analysis (see Fig. 5) that showed spatial correlation ofH3-a/H1, H3-b/H5 and H4/H6, suggesting H3-a, H1, H4 and H6are at the same face of furanose ring. This compound was not de-tected in the crumb but only in the crust, suggesting the compoundwas generated in the crust during baking. Therefore, the furanosering in this structure was proposed to be from naturally occurringsugars, which exclusively have D configuration on C5. With the aidof the aforementioned spatial information from ROSEY and abso-lute chemistry of C5, the remaining absolute stereo-configurationsof C4 and C2 were determined to be S and R respectively. Tonget al., 2010) discovered the same compound from Chinese Medi-cine but assigned the wrong absolute stereochemistry assignment.A follow-up total synthesis of this compound by another group re-vealed its correct stereochemistry and coincides our assignment(Sudhakar, Kadam, Bayya, Pranitha, & Jagadeesh, 2011).
A constitutional isomer of Acortatarin A was further reported asthe main bitter compound in fraction 20 and named as AcortatarinC (Fig. 4). The HMBC and COSY NMR signals were very similar tothose of Acortatarin A. Based on the NMR spectra, this compoundhad similar molecular skeleton as Acortatarin C with the only dif-ference in the furanose ring. In contrast to furanose ring in Acortat-arin A, this compound has a pyranose ring, which is supported byHMBC correlation H6 resonating at 3.69 ppm with C2 resonating at95.91 ppm. Furthermore, Acortatarin A and C were also found to bereadily epimerized at room temperature under acidic aqueous con-dition, which further suggested they were generated from thesame precursors.
The final bitter compound identified was Tryptophol in fraction24. MS-TOF analysis reported a molecular weight of 161.0921(M+H)+1 with the predicted formula for pseudomolecular ion ofC10H11NO. Comparison of its HMBC and COSY NMR spectra withthose of TRP led to the identification of the TRP side chain moiety.Analysis of the numbers of nitrogen and carbon demonstrated thiscompound to be decarboxylated and deaminated TRP. This identi-fication was further supported with the authentic compound.
Based on the structures of the bitter compounds identified inthe crust, a mechanism for bitterness generation in wheat breadwas proposed and illustrated in Scheme 2. Six of the eight com-pounds identified were Maillard-type reaction products (HMF,DDMP, ARP, PBA, Acortatarin A, Acortatarin C; Fig. 4), while Tryp-tophan and Tryptophol were suggested fermentation products.The origins of these compounds were further supported by Qing,Jiang, Cho, and Peterson (2012) who reported higher concentra-tions of these Maillard reaction products in the crust than thecrumb portion of wheat bread; whereas for the fermentation prod-uct Tryptophol the concentration was similar in the crumb andcrust.
This mechanism indicates fermentation can contribute to thebitterness of wheat bread not only by directly generating bittercompounds, but also by providing precursors for the generationof Maillard-type bitter compounds. For the Maillard pathways, allthese compounds, except Acortatarin A and Acortatarin C, arewell-known Maillard products. Acortatarin A and C generationmechanisms are proposed to be very similar as that of PBA. Thenucleophile 1,3-Dideoxy-1-amino-fructose can be generated from3-deoxyglucosone via Strecker degradation (Ghiron, Quack,Mawhinney, & Milton, 1988). Our data suggests these potentialhealth-promoting compounds are likely thermal generated ratherthan being native to plant material – thermal processing is a com-mon step in preparation of Chinese medicine and was used for thepreparation of the material where these compounds were previ-ously isolated (Tong et al., 2010).
This proposed bitterness mechanism (Scheme 2) provides anexplanation for why the crust of wheat bread is typically perceivedas having a higher bitter intensity than the crumb portion (Fig. 1),due to the increased generation of bitter Maillard reaction prod-ucts. Furthermore, whole-wheat bread is generally considered tohave higher bitterness intensity than refined flour wheat bread.The unique composition of whole-wheat flour (versus refinedflour) would be anticipated to alter these two bitterness pathways,fermentation and Maillard chemistry. Whole-wheat flour wouldhave unique protein composition (albumin and globulin) as wellas higher levels of phenolic hydroxycinnamic acid compounds.Our group has previously reported that phenolic compounds canalter Maillard reaction pathways (Colahan-Sederstrom & Peterson,2005; Peterson & Totlani, 2005; Totlani & Peterson, 2005, 2006,2007). Future work focused on quantification of these compoundsand a more details investigation of the pathways of formation isongoing.
Acknowledgement
This work was supported by the USDA-NIFA program, projectnumber 2009-35503-06066.
References
Bakke, A., & Vickers, Z. (2007). Consumer liking of refined and whole wheat breads.Journal of Food Science, 72(7), S473–S480.
Colahan-Sederstrom, P. M., & Peterson, D. G. (2005). Inhibition of key aromacompound generated during ultrahigh-temperature processing of bovine milkvia epicatechin addition. Journal of Agricultural and Food Chemistry, 53(2),398–402.
Dolan, J., & Snyder, L. (2009). Selecting an ‘‘orthogonal’’ column during high-performance liquid chromatographic method development for samples thatmay contain non-ionized solutes. Journal of Chromatography, A, 1216, 5.
Frank, O., Blumberg, S., Krümpel, G., & Hofmann, T. (2008). Structure determinationof 3-O-caffeoyl-epi-c-quinide, an orphan bitter lactone in roasted coffee. Journalof Agricultural and Food Chemistry, 56(20), 9581–9585.
Frank, O., Blumberg, S., Kunert, C., Zehentbauer, G., & Hofmann, T. (2007). Structuredetermination and sensory analysis of bitter-tasting 4-vinylcatechol oligomersand their identification in roasted coffee by means of LC–MS/MS. Journal ofAgricultural and Food Chemistry, 55(5), 1945–1954.
Frank, O., Zehentbauer, G., & Hofmann, T. (2006). Bioresponse-guideddecomposition of roast coffee beverage and identification of key bitter tastecompounds. European Food Research and Technology, 222(5), 492–508.
Ghiron, A. F., Quack, B., Mawhinney, T. P., & Milton, S. F. (1988). Studies on the roleof 3-deoxy-D-erythro-glucosulose (3-deoxyglucosone) in nonenzymicbrowning. Evidence for involvement in a Strecker degradation. Journal ofAgricultural and Food chemistry, 36(4), 677–680.
Heinio, R. L., Liukkonen, K. H., Myllymäki, O., Pihlava, J. M., Adlercreutz, H.,Heinonen, S. M., et al. (2008). Quantities of phenolic compounds and theirimpacts on the perceived flavour attributes of rye grain. Journal of Cereal Science,47(3), 566–575.
Kim, M. O., & Baltes, W. (1996). On the role of 2,3-dihydro-3,5-dihydroxy-6-methyl-4 (H)-pyran-4-one in the Maillard reaction. Journal of Agricultural and FoodChemistry, 44(1), 282–289.
Meilgaard, M., Carr, B., & Civille, G. V. (2006). Sensory evaluation techniques. Spectrumintensity scales for descriptive analysis. CRC.
Peterson, D. G., & Totlani, V. M. (2005). Influence of flavonoids on the thermalgeneration of aroma compounds. Phenolics in Foods and Natural Health Products,909, 143–160.
Qing, B., Jiang, D., Cho, I. H., & Peterson, D. G. (2012). Chemical markers forbitterness in wheat bread. Flavor and Fragrance, 27(6), 454–458.
Roper, H., Roper, S., & Heyns, K. (1983). NMR spectroscopy of N-(1-deoxy-D-fructos-1-yl)-l-amino acids. Carbohydrate Research, 116(2), 183–195.
Slavin, J. (2004). Whole grains and human health. Nutrition Research Reviews, 17(01),99–110.
Snyder, L., Dolan, J., & Carr, P. W. (2004). The hydrophobic-subtraction model ofreversed-phase column selectivity. Journal of Chromatography, A, 1060(1–2),77–116.
Stark, T., Bareuther, S., & Hofmann, T. (2005). Sensory-guided decomposition ofroasted cocoa nibs (Theobroma cacao) and structure determination of taste-active polyphenols. Journal of Agricultural and Food Chemistry, 53(13),5407–5418.
Stark, T., Bareuther, S., & Hofmann, T. (2006). Molecular definition of the taste ofroasted cocoa nibs (Theobroma cacao) by means of quantitative studies andsensory experiments. Journal of Agricultural and Food Chemistry, 54(15),5530–5539.

D. Jiang, D.G. Peterson / Food Chemistry 141 (2013) 1345–1353 1353
Stark, T., & Hofmann, T. (2005a). Isolation, structure determination, synthesis, andsensory activity of N-phenylpropenoyl-L-amino acids from cocoa (Theobromacacao). Journal of Agricultural and Food Chemistry, 53(13), 5419–5428.
Stark, T., & Hofmann, T. (2005b). Structures, sensory activity, and dose/responsefunctions of 2,5-diketopiperazines in roasted cocoa nibs (Theobroma cacao).Journal of Agricultural and Food Chemistry, 53(18), 7222–7231.
Sudhakar, G., Kadam, V. D., Bayya, S., Pranitha, G., & Jagadeesh, B. (2011). Totalsynthesis and stereochemical revision of acortatarins A and B. Organic Letters,13(20), 5452–5455.
Tong, X. G., Zhou, L. L., Wang, Y. H., Xia, C., Wang, Y., Liang, M., et al. (2010).Acortatarins A and B, two novel antioxidative spiroalkaloids with a naturallyunusual morpholine motif from Acorus tatarinowii. Organic Letters, 12(8),1844–1847.
Totlani, V. M., & Peterson, D. G. (2005). Reactivity of epicatechin in aqueous glycineand glucose Maillard reaction models: Quenching of C2, C3, and C4 sugarfragments. Journal of Agricultural and Food Chemistry, 53(10), 4130–4135.
Totlani, V. M., & Peterson, D. G. (2006). Epicatechin carbonyl-trapping reactions inaqueous maillard systems: Identification and structural elucidation. Journal ofAgricultural and Food Chemistry, 54(19), 7311–7318.
Totlani, V. M., & Peterson, D. G. (2007). Influence of epicatechin reactions on themechanisms of Maillard product formation in low moisture model systems.Journal of Agricultural and Food Chemistry, 55(2), 414–420.
Vitaglione, P. A., Napolitano & Fogliano, V. (2008). Cereal dietary fibre: A naturalfunctional ingredient to deliver phenolic compounds into the gut. Trends in FoodScience & Technology, 19(9), 451–463.
Yamaji, T., Saito, T., Hayamizu, K., Yanagisawa, M., & Yamamoto, O. (2012). SpectralDatabase for Organic Compounds, SDBS.