identification, assessment and selection of environmentally sound technologies · 2011-04-28 ·...
TRANSCRIPT

Project on
Converting Waste Agricultural Biomass to an Energy / Material Resource
Report V
Identification, Assessment and Selection of
Environmentally Sound Technologies
Prepared by
National Cleaner Production Center Sri Lanka
February 2010

CONTENT
1. INTRODUCTION 02
1.1 Background 02
1.2 Environmentally Sound Technologies 03
1.3 Environmental Assessment Tools 03
2. SAT METHODOLOGY 05
2.1 Rationale 05
2.2 Main Features 05
2.3 Development Process 07
2.4 Key Elements 08
2.5 Basic Steps in Implementation 09
3. CONVERTION OF WASTE TO RESOURCE: SITUATION ANALYSIS 14
3.1 Baseline Data Collection 14
3.2 Stakeholder Consultation 17
3.3 Mapping and Analysis 18
4. CONVERTION OF WASTE TO RESOURCE: STRATEGIC LEVEL
ASSESSMENT 21
4.1 Introduction 21
4.2 Overview of Applications and Technology Options 22
4.3 Description of Technologies 25
4.4 Short listing of Technologies 32
5. CONVERTION OF WASTE TO RESOURCE: OPERATIONAL LEVEL
ASSESSEMNT 33
5.1 Screening of Technologies 33
5.2 Scoping of Technologies 37
5.3 Detailed Assessment of Technologies 45
5.4 Selection of Technology Option for the Pilot Implementation Project 53
References 57
Appendices 59

1
1. INTRODUCTION
1.1 Background
The project on “Converting Waste Agricultural Biomass to a Fuel / Resources” implemented
in the Moneragala District, Sri Lanka is initiated with the final objective of developing a pilot
project based on a selected resource-technology combination as a mean of managing waste.
The waste materials are considered as resources than rubbish and it is intended to explore the
most appropriate ways of converting these resources to value added products or materials,
thereby minimizing the social and environmental issues arisen due to present management
practices while generating additional income to the local community. Series of activities have
been developed for the successful conduct of the project, which are broadly categorized as:
� Activity 1: Formation and manage a project team,
� Activity 2: Characterize qualitatively and quantitatively the agro-residues available,
� Activity 3: Identify potential applications/users of agro-residues including market
potentials,
� Activity 4: Identify, assess and characterize environmentally sustainable technologies
(ESTs) related to conversion of agro-residues,
� Activity 5: Select a set of most viable resource-technology combinations and rank them
based on potential of implementation and social & environmental impacts,
� Activity 6: Develop a pilot project based on a selected resource-technology combination.
The details and results of the first two activities are presented in the first progress report [1].
The agricultural residues and other biomass wastes identified as potential resources include
paddy husk, paddy straw, sawdust, banana waste and market waste. In addition, a weed grass
known as Wild Guinea Grass (Scientific name: Panicam Maximum; Local name: Ginihirassa)
is found widely spread over almost all kinds of lands in the area. The properties of these
wastes and their present generation, utilization pattern and availability are identified. Further,
future generation potentials of these sources are predicted. The technologies available for
converting the agro-residues and other wastes are highlighted.
Now, in order to select and implement the most appropriate project(s) for converting waste
agricultural biomass to a fuel / material, it is essential to evaluation each resource-technology
combination under local context with a systematic approach such that all the important
aspects are included. In fact, conversion of agricultural residues and other waste materials for

2
a fuel or other value added products or materials is not a new concept. Extensive volume of
literature on this topic could be found freely and there are many attempts to implement
different types of projects in Sri Lanka. However, it is evident that the majority of the
projects could not be implemented as planed and also unsuccessful in achieving the
objectives. Such failures could be attributed to the lack of systematic approach in developing
and implementing the project activities, as well as issues with the technology choices. In fact,
use of suitable technology assessment methodology and appropriate technologies is an
essential element of a project/programme. The present project thus considered the above
circumstances and incorporated an integrated and systematic approach in technology
selection. Prior to introduce the methodology selected in the present study, basic concepts
and tools related to technology evaluation methodologies are presented the following two
sections.
1.2 Environmentally Sound Technologies
The need for promotion of Environmentally Sound Technologies (ESTs) in the context of
sustainability was recognized in the early 1990s. In particular, at the United Nations
Conference on Environment and Development (UNCED) in 1992, the need to promote ESTs
was highlighted in Agenda 21. Chapter 34 of Agenda 21 defines ESTs as those technologies
that protect the environment, are less polluting, use all resources in a more sustainable
manner, recycle more of their waste and products and handle residual waste in a more
sustainable manner than the technologies for which they are substitutes. ESTs include a
variety of cleaner production process and pollution prevention technologies, as well as end-
of-pipe and monitoring technologies. Apart from just technologies, they can be considered as
total ‘systems’ that may include knowledge and skills transfer, operating procedures, goods,
services and equipment, and also organizational and managerial procedures [3]. Many
initiatives have been developed in relation to promotion of ESTs in developing countries and
countries with economies in transition.
1.3 Environmental Assessment Tools
In parallel to the promotion of ESTs, there was a need to evolve Technology Assessment
(TA) framework to assess and evaluate environmental technologies to facilitate identification
and selection of the ‘best possible technology option’. Accordingly, International
Environmental Technology Centre (IETC), UNEP initiated the development of a
methodology for Environmental Technology Assessment (EnTA). EnTA is defined as a

3
systematic procedure whereby a proposed technology intervention is described and appraised
in terms of its potential influence on the environment, the implications for sustainable
development and the likely cultural and socio-economic consequences. Note that EnTA is not
meant to replace existing environmental assessment tools such as Environmental Impact
Assessment (EIA), Environmental Risk Assessment (ERA) and Life Cycle Assessment
(LCA), and a comparison between EnTA and these tools is presented in Table 1.1.
Table 1.1: Comparison of EnTA and Other Selected Environmental Assessment Tools Feature EnTA EIA ERA LCA
Purpose Assesses implications of a technology and guides choices of technology
Identifies and predicts the env. impacts of a project, policy or similar initiatives
Estimates risks to the environment and public health
Evaluates the impacts associated with a product/ process or activity over the entire lifecycle
Scope Implications for health, safety and well being, and for natural resources and ecosystems, costs of tech. Interventions & monetary benefits
Impacts on the natural resources, ecosystems, human health, safety and well being
Assessment of risks to the environment and human health
Implications for human health, safety and well being, and for natural resources and ecosystems
Initiator Proponent of technology, investor, stakeholders
Applicant for regulatory approval
Proponent of project/initiative, investor, stakeholders
Proponent of project/initiative, investor, stakeholders
Approach A systematic, comprehensive and qualitative comparison of the pressures on the environment and the resulting impacts
Requirements often prescribed by regulatory authority, including identification of impacts, mitigation & monitoring measures
Hazard identification, dose-response and exposure assessments, risk identification
Life cycle inventory of energy &material requirements and waste produced, impact analysis and improvement analysis
Timing Scoping tool at the pre-investment stage, before the development of the full/formal proposal
Prior to decision whether or not the initiative should proceed
At any time, as determined by the initiator
At any time, as determined by the initiator
Regulatory Status
None – often used to screen options before more detailed assessment
Often required under environmental protection legislation, especially for larger projects in environmentally sensitive areas
None - may be used to give support to conclusions of assessments required under law
None – typically used by producers or consumers to assess the environmental merit of the products or activity

4
The scope of EnTA is outlined with a focus on identifying specific and broader
environmental impacts of technologies. EnTA is primarily qualitative and comparative and it
looks at broader processes over technology’s entire life cycle.
More recently, further improvements to the approach in technology assessment under the
concept of sustainability are introduced and the new methodology known as Sustainable
Assessment of Technology (SAT) is developed, which received commendation
internationally [2]. This methodology, as detailed in the next part of the report, is used to
accomplish the remaining activities of the project (i.e. Activity 3 to Activity 6).
2. SAT METHODOLOGY
2.1 Rationale
Technology plays an important role in development. In fact, the development of human
society is directly linked to development in technologies to cater for diverse and demanding
needs. However, with the physical development, mankind is also facing critical challenges,
especially associated with environmental issues. It is apparent that this situation is arisen due
to the consideration of only economic factors in selecting technologies, while dissociating
social and environment factors in the process. In fact this issue is found in the prevailing
systems for decision-making in general in many countries, where economic, social and
environmental factors are considered separately at the policy, planning and management
levels. This can influence the actions of all groups in society, including governments,
industry and individuals, and has important implications for the efficiency and sustainability
of development.
The general concept of Sustainable Development is defined in addressing the above issues
where full integration of economic, environmental and social factors is envisaged. As a vital
part in the development, choice of technology too should follow the same philosophy of
addressing the economic, environmental and social factors with due emphasis [3].
2.2 Main Features
The concept of SAT is fundamentally the integration of Sustainable Development in
Technology Assessment. Therefore the essential characteristic of SAT is the sustainability,
i.e. integration of three important aspects: environmental soundness, social/cultural

5
acceptability and economic feasibility. This methodology is built on existing technology
assessment framework and could be adapted to local conditions, parameters and constraints.
It uses a progressive assessment procedure through tiers on screening, scoping and detailed
assessment allowing entry points for diverse stakeholders and optimizing information
requirements. Another important characteristic of SAT methodology is that it operates both
strategic and operational levels, addressing thereby choices to be made on a more robust
basis. It is also a quantitative procedure that allows more objective assessment, sensitivity
analyses and incorporation of scenarios. Further, SAT methodology comprises of Plan-Do-
Check-Assessment milestones that incorporate feedbacks and learning encouraging
continuous improvement.
The SAT methodology can be used by different stakeholders and at different levels of
decision making. At the policy / government level, SAT can be applied for strategic decision-
making. Once decisions at the strategic level are taken, SAT could be applied at the
operational level, primarily by the technical staff, designers, and consultants, to assess
alternate technology systems. SAT methodology can be used by communities and industrial
clusters, particularly for development of centralized systems. Similarly individual
hamlets/villages and enterprises can use the SAT methodology for comparing a number of
available options for a particular need. Further, target users of SAT could include
developmental as well as commercial financing institutions that often play a key role in
funding projects and programmes that make use of various technologies.
The SAT methodology can be applied in scenarios involving technology interventions in the
context of sustainable socio-economic development. These include, but not limited to,
� End of pipe or waste management technologies and recycling programmes,
� Environmental health related programmes,
� Provision of basic services/infrastructure such as roads, power, water etc.,
� Bio-diversity management,
� Remediation / land reclamation,
� Process technology modernization (at shop floors / in industrial clusters).
The development process and the main elements in the SAT methodology are discussed in
the section sections.

6
2.3 Development Process
Prior to understand the key elements in the SAT methodology, it is useful to appreciate its
development process, which will facilitate one to distinguish the essential differences of SAT
with other existing methodologies and approaches.
It is apparent that the integration of the sustainable development concept fully addressing the
economic, environmental and social factors in a technology selection process is a very
challenging task. In fact, SAT methodology has been developed through an elaborate process
of research and expert consultations, as illustrated in Figure 2.1.
Figure 2.1: Development Process of SAT Methodology [3]
The development process was started with a comprehensive literature review to understand
past developments and to study the similar technology assessment approaches (especially
related to Environmentally Sound Technologies - ESTs and Environmental Technology
Assessment – EnTA, as briefed in Sections 1.2 and 1.3). In Stage 2, strengths and weaknesses
of the current methodologies and approaches were identified with areas for improvement. In
next stage, a draft SAT methodology was developed based on generic criteria and indicators.
STEP 2 Identify Strengths and Weaknesses
of Present Approaches
STEP 1 Literature Review
STEP 3 Propose New Methodology,
Criteria and Indicators
STEP 4 Peer Review and Consultations during the Review / Workshops
STEP 5 Finalization of New Methodology,
Criteria and Indicators

7
Further, the generic set of criteria and indicators were customized for sector specific
applications covering number of important areas including solid waste management. The
generic methodology, criteria and indicators as well as sector-specific customization were
peer reviewed in Stage 4. Finally, the draft methodology, criteria and indicators as well as
evaluation were reviewed by experts to obtain the improved methodology. This elaborative
and structured process was able to come up with a methodology with stipulated features of
sustainability.
2.4 Key Elements
Number of key elements could be identified in the SAT methodology. These include the
following [3]:
� Assessment at strategic and operational levels
The SAT methodology incorporates assessments at both strategic level and operational level,
whereas other approaches in technology assessments concentrated primarily on operational
level. However, strategic considerations are important as these encourage a focus on situation
analyses, thus discussing broader issues such as institutional, financial, policy/planning
related aspects, rather than the technology alone.
� A tiered process including Screening, Scoping and Detail Assessments
The technology assessment is performed in a tiered process of screening, scoping and detail,
so that comprehensive information collection becomes essential only for short-listed
technology systems. The obviously non-feasible technical options are eliminated at the
screening stage, and then subjected to a second round of elimination through scoping process.
Scoping uses selected criteria that use more of qualitative or readily available quantitative
information for the evaluation. At the detailed assessment tier, the systems that pass through
scoping stage are subjected to a more rigorous evaluation using additional criteria. This tiered
process reflects progressiveness and optimized information requirement.
� Criteria and indicators
The most important element in the assessment process is the identification of appropriate
criteria and indicators. In the framework of sustainability, a set of generic criteria and
indicators are developed under the broad categories of technological, environmental, financial
and socio-cultural, giving due consideration to the risks and restrictions associated with the

8
technology choices. Further, development of customized criteria and indicators applicable to
specific situations is required to ensure the rationality.
� Assessment of the technology with system approach
Any application of a technology represents a system and thus comprised of number of
individual technologies. Operational behaviour of a technology depends on the other
technologies taking part in the system and therefore individual optimization is not
appropriate. The SAT methodology recognizes the interdependencies within technology units
by putting an emphasis on the “system” rather than the individual technology.
� Framework for quantification and aggregation method
In order to facilitate decision making, the qualitative assessments based on selected criteria
and indicators are converted into quantitative figures through a quantification and
aggregation framework in the SAT methodology. The key elements in this approach are the
weights to be assigned to criteria and scores to be assigned to indicators. This process also
facilitates sensitivity studies and scenario building so that more flexible and dynamic results
could be obtained.
� Information, expertise and participation driven approach
The SAT methodology employs a number of tools and techniques, such as Information driven
benchmarking, Expert opinions and Participatory assessment by stakeholders, to facilitate the
assessment process. These tools are used in a mix and at different degrees depending on the
level of assessment – strategic or operational.
2.5 Basic Steps in Implementation
The SAT Methodology comprised of a number of basic steps that follow typical Plan-Do-
Check-Act cycle of continuous improvement. These steps are illustrated in Figure 2.2 and a
brief description of each key step is given in this section [3].
� Situational analysis
The purpose of technological intervention is usually to address a prevailing issue or problem.
Therefore the whole cycle essentially starts with the problem definition followed by a
situation analysis. The situation analyses will include baseline data collection, stakeholder
consultation, mapping and analyses as necessary. A situation analysis facilitates to identify

9
the relevant issues as well as assess their affects and importance. Further, situation analysis
reveals the reasons behind successes and failures of earlier interventions and could help in
scenario building. Finally, situation analyses leads to setting of targets that should be
addressed by the proposed technology intervention.
Figure 2.2: Basic Structure of SAT Methodology [2]
� Strategic level assessment
At the strategic level assessment of SAT methodology, planners, decision-makers, etc. are
required to brainstorm and study various options at the policy and plan levels. The outcomes
of the strategic level assessment are very important on the following four accounts:
- The decision at the strategic level is the critical factor in the subsequent identification
of technology system options.
- Strategic decisions may help to develop customized criteria and indicators (possibly
with weights across criteria) from a generic list for the decisions to be taken at
operation level.
- Strategic level assessment facilitates short-listing and identification of suitable
technology systems for the situation at hand.
Preferred Technology Options
Implementation
Anticipating future scenarios
Detailed Engineering Design and Costing
Monitoring / Performance Evaluation
Issues to be Addressed / Problems to be solved
Situation Analysis
Define Targets
Strategic level Assessment
Operational level Assessment
Screening
Scoping
Detailed Assessment
Public Information / Consultation
Customized Criteria and Indicators by Considering
Environment, Social and Economic Aspects

10
- The outcomes of the strategic level assessment can also provide some leads about the
possible future scenario building, which can influence the decision regarding the
technology choice.
In the strategic level assessment, the involvement of key stakeholders plays the main role,
followed by expert opinion. The technology information plays the least role in this level of
assessment.
� Operational level assessment
Once the strategic level options are finalized, the SAT moves on to a more operational level
assessment. Based on the problem definition, situation analysis and the outcomes of strategic
level assessment, a set of potential technology systems is identified, which are then subjected
to further rigorous three-tiered assessment (i.e. screening, scoping and detail). Depending
upon the specific situation and needs, the stakeholder group could adopt the set of generic
and/or sector specific criteria proposed at the strategic level without any changes. However,
in some situation-specific cases, it may be essential to revisit the generic set of criteria, and
modify or add some specific criteria. At this level, the assessment of available technology
systems is performed by engineers, technical staff etc. If the SAT methodology is to be
applied at a community or enterprise level, the earlier stage of strategic level may be skipped
and stakeholders can start with the operational level assessment. The levels of expert opinion
and technology information are the highest in the operational level assessment.
� Screening
At this stage, the short-listed system options first undergo screening using criteria in tier 1.
The tier 1 criteria yield only an objective Yes/No type answer and hence, those options that
do not qualify one or all the conditions, then get automatically eliminated.
� Scoping
At Tier 2, the short-listed system options from Tier 1 go through a comprehensive scoping
assessment. This assessment is more of qualitative in nature and usually the ratings of the
options are assigned as low, medium and high. The stakeholders are required to assess the
various technology system options against the generic and customized criteria and indicators
using an appropriate standard methodology, preferable simple weighted sum method. The
weighted sum method is a quantitative method for screening and ranking available

11
technology options against multiple criteria. This method provides a means of quantifying
and emphasising the important criteria over the others. Firstly, the set of criteria is arranged
in order of priority and then weights for each criterion are assigned. Once the weights have
been assigned for each criteria, each available technology option is to be rated against each
criterion using a scale. Finally, the rating of each option for a particular criterion is multiplied
by the weight of the criterion. These values and calculations could be presented in a matrix
form (i.e. weighted sum matrix). An option's overall rating is the sum of the products of
rating times the weight of the criterion.
In the process of developing the weighted sum matrix, it can be seen that at times the
difference between the total scores for some options may be very marginal. Therefore, during
the group discussion, it is essential to try various iterations to check the sensitivity of the
matrix to such changes. Another limitation of weighted sum matrix is that at the end of the
process, users get an aggregated score for each technology option and it is not possible to see
as to which were the dominating criteria amongst all. To overcome such a situation, it is
recommended that the total scores for each of the technology options be represented by a star
diagram. Such a diagram can illustrate the influence of various factors in the final scores. In
some cases, for instance, the total score earned by a technology system may be the highest,
but this could be due to the contribution of non-priority criteria. This will require revisiting
the weights and scores to ensure that the total scores are in accordance with the priorities
defined by the stakeholder groups, and thus lead to a more rational and acceptable decision.
The final outcome of scoping assessment the selection of technology options with the best
overall ratings for the detailed assessment in tier 3. In this process a number of options with
lower overall ratings is eliminated.
� Detailed assessment
The selected list of technology options in the scoping assessment undergoes a detailed (Tier
3) technical and economic feasibility assessment. This level of assessment is rather situation-
specific and the suggested criteria at this stage demand a lot more detailed and quantitative
information to facilitate decision making. Using the information, the stakeholder group
should once again prepare a new weighted sum matrix or revise the existing one. It is
possible that the rating of the technology systems may change due to the new scoring based
on available information.

12
� Anticipating future scenarios
If the current situation changes, the technology system choice made could be found to be
inadequate or inappropriate. Therefore, it is required to simulate certain future scenarios and
ensure that the outcome of the current exercise is robust enough and confirm that the
suggested technology system can stand the test of time. For new scenario, the weights as
well as scores could be different and this may alter the choices to be made.
� Decision-making on preferred technology options
Although some technology system may score the best in the current context, while simulating
different scenarios, the same option may not qualify as the best. Conversely, an option that
does not qualify due to lower scores in the current situation may probably top the list, with
appropriate technology transfer/adaptation or capacity building efforts or change in policies/
regulations. This is an important aspect to be considered before discarding the low-scoring
options. Hence a careful scrutiny of the options, going beyond the mere numbers, is required.
� Implementation / monitoring
Once the decision is made on the best technology system to be used as the intervention for
the problem, it would then form the basis for further steps such as detailed engineering
design, tendering, actual construction and commissioning. It is also important to continuously
monitor and evaluate the technology system during its operational phase to ensure that it is
meeting the desired objectives. As the conditions and environment under which the
technology intervention operates is dynamic and there would be increasing demand for better
technical and environmental performances due to more stringent regulations, provision for
continuous improvements should be incorporated in the system.
� Feedback loop
The SAT methodology also makes provision to use the experience gained through the
implementation of the present project for either duplication of the project into other locations
or for carrying out situational analysis of similar projects in future, and hence can help in
making better informed decisions. This could be realized by recording the outcomes of the
monitoring and evaluation and reporting them to the stakeholder groups, especially
government agencies, planners and other decision makers. In particular, the performance of
the technology under the real local conditions would be very useful information. Thus
feedback can help for future decisions at both strategic as well as operational level.

13
3. CONVERTION OF WASTE TO RESOURCE: SITUATION ANALYSIS
3.1 Problem Definition
Lack of proper waste management practices could lead to severe social and environmental
problems. Further, dispose of such wastes could also be considered as a lost in useful
resources. Agricultural residues could be considered as one such waste category, especially in
the rural areas in the country. One of the most appropriate options for waste management is
to implement technological interventions to convert wastes to value added product such as
energy and/or material. Yet, at present there is a lack of such projects that are in successful
operation in Sri Lanka. Therefore identification of most appropriate technology option for a
specific situation / waste and implementation of a pilot project are required for the promotion
of the concept. As most of the aspects and issues related to waste management are site
specific, development and implementation of a pilot project by selecting a potential region /
site is required. The present study is developed to implement a pilot programme of utilizing
waste agricultural residues for useful application (energy / materials) in Moneragala District
in Sri Lanka.
3.2 Baseline Data Collection
The baseline data on types, generation and availability of agro-wastes were presented in the
first progress report, a summary of which is presented in this section [1]. The analysis was
restricted to the two district secretariat (DS) divisions Moneragala and Buttala in the district.
The waste materials considered include agricultural residues as well as other waste types
generated within the area that have significant generation potentials, as listed below:
- Paddy Straw
- Paddy Husk
- Sawdust
- Market Waste
- Banana Waste
- Wild Guinea Grass
In addition, though not considered for the present analysis, availability of coconut husks and
maize residues is also noticed. Present waste management practices (including present usage
and technologies) and related issues were also analysed. Table 3.1 presents the agricultural
residues and other waste materials identified in the selected area of study, including the
availability.

Table 3.1: Availability of Residues DS Division Source Residue Availability Remarks
Paddy Cultivation Paddy Straw(1) 10,041 t/yr 70% collection efficiency (15% - return to field as fertilizer and further 15%- losses)
Paddy Milling Processing
Paddy Husk 1,721 t/yr Considered as a potential source for the present study. 80% for the present project, 90% collection efficiency (20%-other uses, 10%-losses)
Sawmills Sawdust 162 t/yr Will not be considered for the present study, as the majority of the saw mills are in Buttala DS division, but the technology may be used. 90% collection efficiency, 10%-other uses
Public Markets Market waste 364 t/yr 6 tractor loads of market waste per wk, 80%- biodegradable organic waste in market waste.
Monaragala DS
Grassland Wild Guinea Grass(1)
5,673 t/yr Estimation is based on total yield of 18,909 t/yr at 20% moisture content and 30% collection efficiency (50% remains in the field, 20% for other uses) [4] (see Appendix A for more details of the estimation).
Paddy Cultivation Paddy Straw(1) 31,415 t/yr 70% collection efficiency (15% - return to field as fertilizer and further 15%- losses)
Paddy Milling Processing
Paddy Husk 970 t/yr 90% collection efficiency, 80% is allocated for the future potential expansions in the brick industry,
Sawmills Sawdust 648 t/yr Considered as a potential source for the present study, 90% collection efficiency, 10%-other uses
Public Markets Market waste 180 t/yr Potential is not quantified yet, but need is apparent. Banana Cultivation
Rejected Banana
4,500 t/yr Quantification is based on preliminary information, Generated in the processing industry, Not considered for the present study, but need for management of waste. 15 t per day, 300 working days.
Buttala DS
Grassland Wild Guinea Grass(1)
8,353 t/yr Estimation is based on total yield of 27,845 t/yr at 20% moisture content and 30% collection efficiency (50% remains in the field, 20% for other uses) [4] (see Appendix A for more details of the estimation).
Coconut Plantation Coconut husk - Potential is not quantified yet, but its significant is apparent. Other DS Divisions Maize Plantation cob & stalk - Potential is not quantified yet, but its significant is apparent.
Note (1): These residue types were not given high priority in the present project, but could be major resources in the future.

The percentage availability of the above wastes in each DS division is presented in Figure 3.1
(a) and (b). The estimation of the generation potential and availability of wild guinea grass is
not a simple task and another research group carried out a detailed study on this aspect, the
findings of which are briefed in Appendix A.
(a) Monaragala D.S. Division
(b) In Buttala DS division
Figure 3.1: Availability of wastes in percentages by weight
16
Note that, in both DS divisions, paddy straw and wild guinea grass contribute to the majority
of the waste generation, which are field based residues/wastes. Both of these waste categories
were not given a high priority in the present study as there are uncertainties/difficulties in the
accessibility and collection, but could become high potential resources in future.
3.3 Stakeholder Consultation
A stakeholder consultation workshop was conducted to get the feedback on the data
collected, planned activities and also to identify the needs and potential applications. The
stakeholders participated in the workshop include
- Policy makers (local government, Chamber of commerce officials),
- Technology suppliers,
- Service providers,
- NGOs,
- Waste generators,
- Waste users (Present and Potential users) / Industrialists,
- Researchers.
After the inauguration session (during which the general objectives of the project and the
specific objectives of the workshop were briefed), progress of the project was presented to
the participants. The presentation comprised of information of generation and availability of
the waste categories, technology options available for the conversion of each waste to a value
added product / material, and also the present and potential applications. The presentation
was followed by a session for clarification and discussion. The aspects discussed during this
session could be categorized under the followings:
- Sustainable supply and availability of paddy husks,
- Real potential of paddy straw as a source in future,
- Future generation potential of sawdust,
- Technology options available for sawdust and market waste,
- Technology options available for applications such as drying of vegetable / food
products,
- Improved technology options available for present applications of paddy husk,
particularly brick making and tobacco processing.

17
The final session was devoted to assess the prevailing stakeholder-based waste management
system in Moneragala district. Principles of the assessment of waste management system
could be identified as follows:
- Analyzing the availability, enforcement and impact of regulations and economic
tools;
- Assessing the institutional framework, resources and jurisdictions for current
institutions;
- Analyzing the efficiency and effectiveness of collection, treatment, usage and disposal
technologies and associated infrastructure;
- Analyzing the prevailing financial mechanisms including pricing, taxes, levies,
funding mechanisms etc.
- Understanding the role of different stakeholders at different levels of solid waste
management chain; and
- Identifying the gaps and opportunities.
In particular, feedback from the participants was obtained on prevailing technologies for
waste management in the areas of collection, transportation, pre-treatment, recycling/
recovery and disposal, under technical, economic, environmental and social aspects.
3.4 Mapping and Analysis
The findings of the above activities under the situational analysis could be used to identify
the issues associated with the present waste management systems and assess their
significance. Further, those findings would lead to setting of targets should be addressed by
appropriate technology interventions. Table 3.2 presents issues identified in the present study
together with the target set for each issue, under each waste stream.
Table 3.2: Issues and targets of the waste management system Waste Issues Target
Present policies resulting dumping of the total amount generated to the field resulting adverse effects on environment as well as yield of the crop itself, and loss of potential resource.
Use of relevant technology to convert waste to energy or material together with policy level interventions.
Increase in generation of waste in future Dissemination of technology for duplication or that capable of up-scaling
Paddy Straw
Lack of availability of appropriate Introduction of appropriate

18
technologies / local expertise technology/technologies to suit local resources and expertise
Low bulk density resulting a decrease in the value as a raw material (e.g. “fuel value”)
Use of relevant technology (e.g. bailing, briquetting, pelletizing, pressing) to upgrade the value as a raw material
Table 3.2: Issues and targets of the waste management system (Cont...) Waste Issues Target
Inappropriate practices of dumping of excess amount resulting adverse environmental and health impacts and loss of potential resources
Use of relevant technology to convert waste to energy (process heat)
Improper practices of collection resulting adverse environmental and health impacts and loss of potential resources
Incorporation of appropriate design features for the present collection system following national regulatory standards
Use of conventional technologies for conversion to energy (brick making, drying) resulting low quality products, higher energy cost, waste of resource, and higher level of pollutions.
Introduction of improved technology and/or process modification to increase energy efficiency
Lack of availability of appropriate technologies / local expertise
Introduction of appropriate technology to suit local resources and expertise
Low bulk density resulting a decrease in “fuel value”
Use of relevant technology (e.g. briquetting) to upgrade the fuel value
High ash content leading to problem associated with dumping
Utilization of appropriate waste management system / identification of potential usages
Increase in generation of waste in future Dissemination of technology for duplication or that capable of up-scaling
Lack of land area for dumping Use of relevant technology to convert waste to energy
Paddy Husk
Public protest on open dumping / open burning
Introduction of appropriate technology/technologies to convert waste to energy addressing social issues
Inappropriate practices of dumping of waste resulting adverse environmental and health impacts and loss of potential resources
Use of relevant technology to convert waste to energy (process heat)
Low bulk density resulting a decrease in “fuel value”
Introduction of appropriate technology (e.g. briquetting, pelletizing) to improve the fuel value
High moisture content resulting a decrease in “fuel value” and fast decomposition
Incorporation of appropriate pre-treatment process (i.e. drying) to improve the fuel value
Sawdust
Improper practices of collection resulting contamination of sand
Incorporation of appropriate design features for the present collection system

19
Lack of availability of appropriate technologies / local expertise
Introduction of appropriate technology to suit local resources and expertise
Lack of land area for dumping Use of relevant technology to convert waste to energy
Public protest on open dumping Introduction of appropriate technology to convert waste to energy addressing social issues
Table 3.2: Issues and targets of the waste management system (Cont...) Waste Issues Target
Inappropriate practices of dumping of waste resulting adverse environmental and health impacts
Use of relevant technology to convert waste to energy (biogas generation for process heat)
Lack of land area for dumping Use of relevant technology to convert waste to energy
Lack of availability of appropriate technologies / local expertise
Introduction of appropriate technology to suit local resources and expertise
Increase in generation of waste in future Dissemination of technology for duplication or that capable of up-scaling
Market Waste
Public protest on open dumping Introduction of appropriate technology/technologies to convert waste to energy addressing social issues
Extensive growth as a weed resulting adverse effects on agriculture / useful land
Use of relevant technology to convert waste to energy or material
Lack of availability of appropriate technologies / applications
Introduction of appropriate technology to suit local requirement / application
Difficulty in harvesting / cutting Incorporation of appropriate design features for the harvesting system
Low bulk density resulting a decrease in “fuel value”
Introduction of appropriate technology (e.g bailing, briquetting, pelletizing) to improve the fuel value
Wild Guinea Grass
High moisture content resulting a decrease in “fuel value”
Incorporation of appropriate pre-treatment process (i.e. drying) to improve the fuel value
Inappropriate practices of dumping of waste resulting adverse environmental and health impacts
Use of relevant technology to convert waste to energy (biogas generation for electricity generation)
Lack of land area for dumping Use of relevant technology to convert waste to energy
Lack of availability of appropriate technologies / local expertise
Introduction of appropriate technology to suit local resources and expertise
Banana Rejects
High moisture content resulting a decrease in “fuel value”
Introduction of a technology that is not sensitive to high moisture content (e.g. biogas generation)
Above analysis on issues and targets related to waste management in Moneragala district
clearly indicates the need for diverse spectrum of technology options, for example covering

20
technologies related conversion of waste to energy, fuels and materials, as well as
technologies related to simple physical conversions such as densification and drying.
Although there is limited number of such technologies in operation locally, extensive
developments and promotion of ESTs could be found in international level initiatives and
programmes. It also demands for adaptation of technologies to the local conditions.
4. CONVERTION OF WASTE TO RESOURCE: STRATEGIC LEVEL
ASSESSMENT
4.1 Introduction
As highlighted earlier, conversion of agricultural residues to energy, fuel or value added
material through appropriate technology intervention is not only a sustainable way of waste
management but also could be an economic activity that contributes to the development of
the local community. Usually direct usage waste materials including agricultural residues for
a useful application is not feasible due to some of their inherent properties including low
density, higher moisture level and physical characteristics. These features also affect
adversely the effort and cost for transportation, handling and storage. Therefore, prior to the
usage for end-use activities to some kind of beneficiation (i.e. conversion from its primary
form into a more convenient form) is needed to improve their relevant properties. These
beneficiation processes may involve a simple physical processing, densification, drying, or
upgrading to a variety of convenient chemicals or fuels.
ESTs relevant to the above requirements have been developed and practiced in different parts
of the world and information on those is available in many sources of literature. For example,
United Nations Environment Programme - UNEP (partnered with Development Academy of
the Philippines - DAP) has developed a compendium of biomass waste conversion
technologies (conversion to both energy and material) under the project titled “Using
Agricultural Biomass Waste for Energy and Material, Resource Conversion and GHG
Reduction” (the major outputs of which could be accessed online [5]). A section on biomass
conversion technologies was included in the first progress report of the present project [1].
Further literature sources ESTs were referred to gather more information related to the
specific technologies selected in the present study.
Other sources technology reviews referred in the above regard include a review of selected
biomass energy technologies covering gasification, combustion, carbonization and

21
densification [6], a global review on biomass densification with emphasis on developing
countries [7], a field document on technology and practices of biomass briquetting [8], an
information service on biogas technology covering biogas basics, application and product
development, costs and benefits, and biogas programme implementation [9], a report on
system approach to biogas technology [10], a review paper on biomass gasification in Sri
Lanka [11], an evaluation report on solid waste conversion technologies [12] and a review
report on technologies for energy use of rice straw [13]. Other literature sources on more
specific technology/plant were also referred and are indicated with the relevant text.
4.2 Overview of Applications and Technology Options
Based on the finding of the activities under situational analysis and the information on the
available ESTs, a list of applications and appropriate conversion process relevant to each
waste stream / residue was identified, as listed in Table 4.1. The remarks column is
introduced to present the overall observations of each application and conversion process,
which will facilitate to rank the technology options. Among the applications presented in the
table, thermal energy generation from agro-residues for process heating applications is
appeared to be more attractive than electricity generation options (both grid and off-grid).
Further, small scale applications are seemed to be at a higher priority compared with large
scale applications as the direct positive impact on the local community through fulfilling their
energy needs (especially for small scale local industry) is more.
Table 4.1: Overview of Technology Options Residue Application / (Process) Remarks
Value addition to the residue as a fuel/ (Briquetting)
- Increase in density and change in physical form diversify the applications and increase the fuel value (E.g.: Application – Tea Industry, Fuel value > 15 Rs/kg)
- Although the technology is not at the low- end, local manufacture / fabrication is possible
Value addition to the residue as a fuel/ (Charcoal making)
- Small scale / domestic level technology
Paddy Husk
Domestic cooking / (Direct combustion)
- At present, fuel wood is abundantly available in the area for cooking, and usage of this technology seems to be not viable.
- This is a small scale application and simple technology. ESTs are available at local as well as regional levels.
22
Process heat generation for vegetable and fruit drying / (Direct combustion – Indirect Heating)
- Available, but the technology is conventional - Very relevant to the local community and
could contribute to the development of local industry / agriculture.
- Local/regional level ESTs are available and complete local design/fabrication is possible.
Process heat generation for Brick making / (Direct combustion – Direct Heating)
- Available, but the technology is conventional. - There is a need as well as potential for the
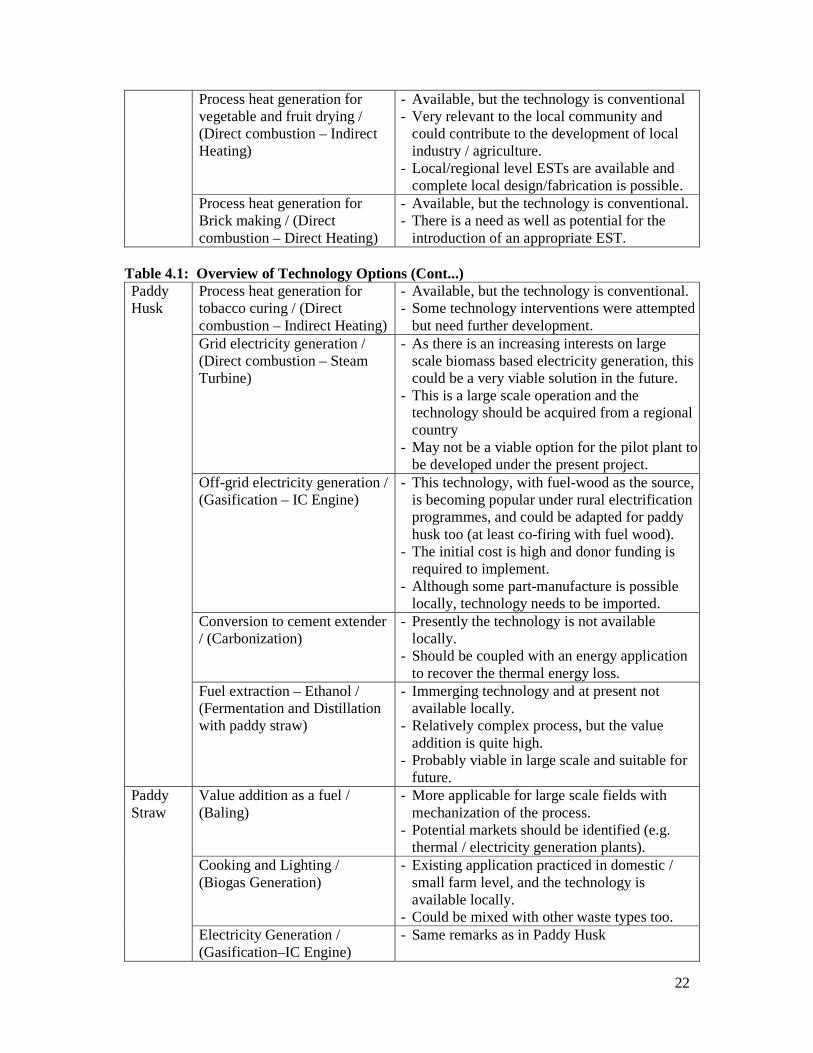
introduction of an appropriate EST. Table 4.1: Overview of Technology Options (Cont...)
Process heat generation for tobacco curing / (Direct combustion – Indirect Heating)
- Available, but the technology is conventional. - Some technology interventions were attempted
but need further development. Grid electricity generation / (Direct combustion – Steam Turbine)
- As there is an increasing interests on large scale biomass based electricity generation, this could be a very viable solution in the future.
- This is a large scale operation and the technology should be acquired from a regional country
- May not be a viable option for the pilot plant to be developed under the present project.
Off-grid electricity generation / (Gasification – IC Engine)
- This technology, with fuel-wood as the source, is becoming popular under rural electrification programmes, and could be adapted for paddy husk too (at least co-firing with fuel wood).
- The initial cost is high and donor funding is required to implement.
- Although some part-manufacture is possible locally, technology needs to be imported.
Conversion to cement extender / (Carbonization)
- Presently the technology is not available locally.
- Should be coupled with an energy application to recover the thermal energy loss.
Paddy Husk
Fuel extraction – Ethanol / (Fermentation and Distillation with paddy straw)
- Immerging technology and at present not available locally.
- Relatively complex process, but the value addition is quite high.
- Probably viable in large scale and suitable for future.
Value addition as a fuel / (Baling)
- More applicable for large scale fields with mechanization of the process.
- Potential markets should be identified (e.g. thermal / electricity generation plants).
Cooking and Lighting / (Biogas Generation)
- Existing application practiced in domestic / small farm level, and the technology is available locally.
- Could be mixed with other waste types too.
Paddy Straw
Electricity Generation / (Gasification–IC Engine)
- Same remarks as in Paddy Husk

23
Conversion to material / (Paper pulping)
- Non-energy application with higher value addition
- Technology does exist but need more popularization / dissemination.
Fertilizer / (Composting) - Very relevant to the local community practicing agriculture
- Could be mixed with other waste types too. Fuel extraction – Ethanol (Fermentation and Distillation with or without husk)
- Same remarks as in Paddy Husk
Table 4.1: Overview of Technology Options (Cont...) Value addition to the residue as a fuel / (Briquetting / Pelletizing)
- Increase in density and change in physical form diversify the applications and increase the fuel value.
- Although the technology is not at the low-end, local manufacture / fabrication is possible.
Domestic cooking / (Direct combustion)
- At present, fuel wood is abundantly available in the area for cooking, and usage of this technology seems to be not viable.
- This is a small scale application and simple technology. Local as well as regional level ESTs are available.
Sawdust
Manufacture of particle boards/Medium fibre density board (Densification)
- Relatively complex process, but the value addition is quite high.
Cooking and lighting / (Biogas generation)
- Existing application practiced at community / municipality level, and the technology is available locally.
- Local manufacture / fabrication is possible. Off-grid electricity generation /(Biogas generation – IC Engine)
- This technology, with fuel-wood as the source, is becoming popular under rural electrification programmes, and could be adapted to biogas too.
- The initial cost is high and donor funding is required.
- Although some part-manufacture is possible locally, technology needs to be imported.
Market waste
Fertilizer / (Composting) - Very relevant to the local community practicing agriculture
- Could be mixed with other waste types too. Banana Rejects
Grid electricity generation (Biogas generation – IC Engine)
- High generation of waste could be managed by this technology / application
- As there is an increasing interest on large scale waste to energy (electricity) projects, this could be a very viable solution.
- May not be a viable option for the pilot plant to be developed under the present project due to its scale, but the industry may implement by their own resources if the appropriate technology is introduced.

24
Off-grid electricity generation (Biogas generation – IC Engine)
- Existing application practiced at community / municipality level, and the technology is available locally.
- Local manufacture / fabrication is possible. Value addition to the residue as a fuel / (Briquetting)
- Same remarks as in paddy husk.
Value addition to the residue as a fuel / (Baling)
- Same remarks as in paddy straw. - May not be viable of small scale operation.
Wild Guinea Grass
Conversion to material (Animal fodder)
- This is practiced at large scale industrial level and .possible to adapt to small scale.
4.3 Description of Technologies
It is evident, from the list of applications and related conversion processes presented in Table
4.1 above, that several varieties of technological options are needed to address the waste
management issues of the selected areas in the Moneragala district. Obviously,
implementation of all these technological interventions simultaneously is not only practicable
but also meaningless as the there would be varying degree of technical feasibilities, resource
requirements, outcomes and impacts, barriers, etc., among them. Especially, as the present
project works within limited resources and time frame, it is important to identify a set of
more appropriate technology options through a simple but fail-safe ranking process, prior to
conduct a detailed analysis to select the optimum option(s). In order to facilitate such ranking
process, in addition to the information provided in Table 4.1 above, more information on the
each technology in terms of the present status, capacity range, and other key technical
parameters is needed.
Table 4.2 presents descriptions of technology options available for each residue and
application. The information provided includes the type of equipment / devices, their capacity
ranges, present level of technology development, and also a remark column to provide
additional considerations, if any. The level of technology development is categorized under
three broad groups as Commercial level (C), Pilot Demonstration level (PD) and Research
level (R), which is the main criteria considered in the present study to eliminate or select a
given technology option. The technologies at research and pilot demonstration levels are
eliminated prior to conduct detailed analysis.
The capacity range for a given technology is denoted by different parameters, which are
basically the norms utilised by relevant industry. For example, these parameters include, in
the case of applications related to conversion to energy: rated energy output or energy input,
rate of material input, amount of product processed, etc., and in the case of conversion to fuel

25
or material: the rate of material processed, physical size, output rate, etc. Note that, in the
case of energy applications, the units kWth and kWe refer to the rate of thermal energy and
electrical energy, respectively in kilo watts.
Additional information including some performance indices are given under remarks column.

Table 4.2: Description of Technology Selection Residue Application Process /
Technology Equipment Capacity Range
R PD C Remarks
Value addition to the residue as a fuel for process heat generation in industry
Densification / Briquette making
Screw type briquetting machine
Typical Capacity Range: 100 – 250 kg/hr Selected Capacity: 200 kg/hr
X Briquette density = 0.8 – 1.2 t/m3, Energy Requirement = 150 – 225 kWh/t.
Value addition to the residue as a fuel for small scale heat generation
Carbonization / Charcoal making
Small scale charcoal kiln
Typical Capacity: Input - 6 kg/load; Output - 2 kg/load
X Low environment performances; Need hand operated extruder type briquetting machine for densification.
Direct combustion
Paddy husk cook stove
Heat Generated: 4.0 kWth Fuel input = 1.0 kg/load
X Overall efficiency - 20% Combustion efficiency - 80% Fuel input rate = 1.3 kg/hr
Gasification Paddy husk gas stove
Heat Generated: 5.5 kWth Fuel input = 1.3 kg/load
X Overall efficiency - 15%; Combustion efficiency - 80%; Fuel input rate = 1.75 kg/hr
Domestic Cooking
Carbonization Charcoal making cook stove
Heat Generated: 3.0 kWth Fuel input = 2.2 kg/load
X Overall efficiency - 10%; Charcoal output = 0.6 kg/load Fuel input rate = 1.8 kg/hr
Process Heat Generation for lime drying/smoking
Direct combustion / Direct heating
Paddy husk stove cum cabinet dryer
Product Input = 200 kg/batch Heat Generated: 5.0 kWth Fuel input = 72 kg/load
X Efficiency of Drying = 60%; Efficiency of Stove = 65%; Fuel input rate = 2 kg/hr
Paddy Husk
Process Heat Generation for vegetable / fruit drying
Direct combustion / Indirect heating
Paddy husk stove cum tray dryer
Product Input = 100 kg/batch Heat Generated: 8.0 kWth Fuel input = 54 kg/load
X Efficiency of Drying = 40%; Efficiency of Stove = 65%; Fuel input rate = 3 kg/hr

27
Table 4.2: Description of Technology (Cont...) Selection Residue Application Process / Technology Equipment Capacity Range R PD C
Remarks
Process heat generation for brick making
Direct combustion / Direct heating
Improved brick kiln
Estimated capacity>100 kWth X Need further research to develop the technology
Process heat generation for tobacco curing
Direct combustion / Indirect heating
Tobacco barn
Selected capacity ~ 5.0 kWth X Need modifications to existing technology; Can be implemented in commercial basis
Grid electricity generation
Direct combustion & external combustion / Steam cycle
Boiler Steam turbine
> 500 kWe
X Overall Efficiency – 25%; May not be viable to implement under this project due to limitation in resources and time
Off-grid electricity generation
Gasification / Four Stroke Spark Ignition
Gasifier cum Internal combustion engine
< 30 kWe
X Overall Efficiency – 15%; Commercially proven technologies not available. Operational issues with gasifier
Conversion to cement extender
Carbonization Basket burner Input - 20 kg paddy husk Output – 4 kg ash /batch
X Considerable loss in energy unless a recovery system is used; Limited market locally
Paddy Husk
Fuel extraction (Ethanol)
Fermentation and Distillation (with or without husk)
Bio-refinery system
> 100 t/day of feed stoke > 30,000 l/day of ethanol (Commercial Systems)
X 1 t biomass mix yields about 300 l of ethanol and 150 kg of silica/sodium oxide.

28
Table 4.2: Description of Technology (Cont...) Selection Residue Application Process / Technology Equipment Capacity Range R PD C
Remarks
Value addition as a raw material for variety of applications
Baling / Densification Straw Baler
Wide range; Selected capacity: Field capacity - 0.25 ha/h Rate – 100 bales/hr
X Not very viable for small scale operations; Bale Size (d×w)- 80×45 cm Bale weight – 20 kg Need to create local market.
Straw boards manufacturing
Series of processes including baling, classifying, drying, blending, densification, sanding, etc
Series of equipment including press or extruder
Wide range; Selected capacity – 2 t/day of material input Output – 60 no. of panels of size 0.8m × 2.5m × 5 cm
X Density of straw panel – 0.7 t/m3.
Paper making Paper pulping Hand tools and utensils
Small scale X Low-end technology but high social impacts in rural areas.
Cooking/Lighting
Anaerobic digestion / Biogas Generation
Biogas digester– Continuous type
Typical capacity range: 2 to 100 kg/day of waste Tank volume 1 to 15 m3. Selected capacity: 40 kg/day of waste Tank volume 5 m3
X Biogas yield – 3.8 m3/day; Suitable for cooking and lighting for a family of 5 members.
Off-grid electricity generation
Anaerobic digestion / Four Stroke Spark Ignition
Biogas Digester & Internal combustion engine
Typical capacity range: > 200 kg/day of waste Selected capacity: 500 kg/day of waste Plant capacity - 2.2 kWe
X Biogas yield – 47 m3/day, Could generate about 50 kWh/day, Energy conversion efficiency Digester – 13.5% Engine – 20%
Paddy Straw
Fertilizer
Composting
Only hand tools for the handling of waste
No specific capacity range X Low level technology. Other materials required.

29
Table 4.2: Description of Technology (Cont...) Selection Residue Application Process / Technology Equipment Capacity Range R PD C
Remarks
As animal fodder
Sizing / Mixing & Densification
Densified TMR Block Making Plant with TMR Mixer
Typical Capacity: 65 – 75 blocks per hr 12 – 15 kg/block Bale size:40×50×15 cm Rated power 15 kWe
X Densified Total Mixed Ration (DTMR) Block is made with straws, concentrates and minerals blends.
Paddy Straw
Fuel extraction (Ethanol)
Fermentation and Distillation (with/ without husk)
Bio refinery system
> 100 t/day of feed stoke > 30,000 l/day of ethanol (Commercial Systems)
X 1 t biomass mix yields about 300 l of ethanol and 150 kg of silica/sodium oxide.
Densification / Briquette making
Screw type briquetting machine
Typical Capacity Range: 100 – 250 kg/hr Selected Capacity: 200 kg/hr
X Briquette density: 0.8–1.2 t/m3, Energy Requirement: 150 – 225 kWh/t.
Value addition to the residue as a fuel for process heat generation in industry
Densification / Pelletizing
Pelletizing machine (Roller and Die Press)
Typical Capacity Range: 1 – 30 t/hr Selected Capacity: 1 t/hr
X Pellet size: 5 – 15 mm diameter, 30 mm length; Energy Requirement: 50 – 200 kWh/t Less reliable supply of waste Market response is uncertain
Domestic cooking
Direct combustion for cooking
Improved saw dust cook stove with multi-fuel capability
Heat Generated: 3.5 kWth Fuel input = 1.0 kg/load
X Dissemination of this technology will enhance options for managing agro-waste, diversification of application
Saw Dust
Manufacture of Particle boards
Series of processes including size reduction, screening, drum chipping, resin blending, drying, mat formation, pressing, cooling, sanding, etc
Series of equipment including chipper and press
Typical Capacity Range: > 40 m3/day output
X Density of particle board – 0.45 t/m3.
30
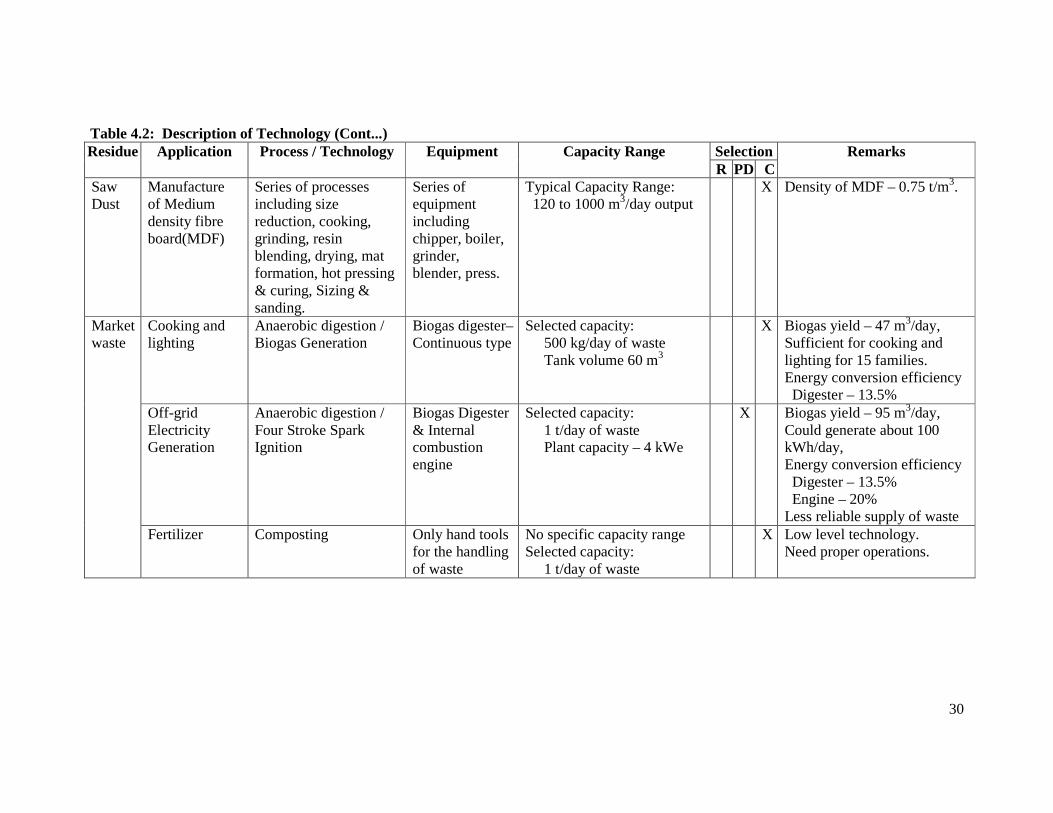
Table 4.2: Description of Technology (Cont...) Selection Residue Application Process / Technology Equipment Capacity Range R PD C
Remarks
Saw Dust
Manufacture of Medium density fibre board(MDF)
Series of processes including size reduction, cooking, grinding, resin blending, drying, mat formation, hot pressing & curing, Sizing & sanding.
Series of equipment including chipper, boiler, grinder, blender, press.
Typical Capacity Range: 120 to 1000 m3/day output
X Density of MDF – 0.75 t/m3.
Cooking and lighting
Anaerobic digestion / Biogas Generation
Biogas digester– Continuous type
Selected capacity: 500 kg/day of waste Tank volume 60 m3
X Biogas yield – 47 m3/day, Sufficient for cooking and lighting for 15 families. Energy conversion efficiency Digester – 13.5%
Off-grid Electricity Generation
Anaerobic digestion / Four Stroke Spark Ignition
Biogas Digester & Internal combustion engine
Selected capacity: 1 t/day of waste Plant capacity – 4 kWe
X Biogas yield – 95 m3/day, Could generate about 100 kWh/day, Energy conversion efficiency Digester – 13.5% Engine – 20% Less reliable supply of waste
Market waste
Fertilizer Composting Only hand tools for the handling of waste
No specific capacity range Selected capacity: 1 t/day of waste
X Low level technology. Need proper operations.
31
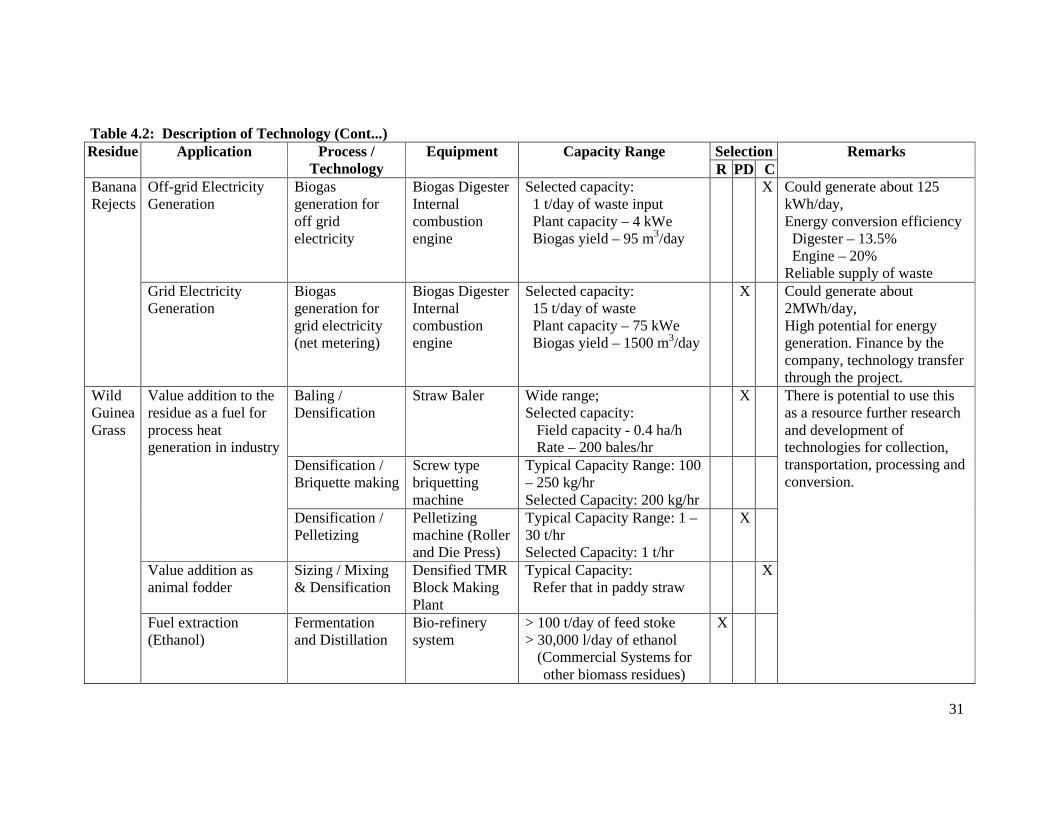
Table 4.2: Description of Technology (Cont...) Selection Residue Application Process /
Technology Equipment Capacity Range
R PD C Remarks
Off-grid Electricity Generation
Biogas generation for off grid electricity
Biogas Digester Internal combustion engine
Selected capacity: 1 t/day of waste input Plant capacity – 4 kWe Biogas yield – 95 m3/day
X Could generate about 125 kWh/day, Energy conversion efficiency Digester – 13.5% Engine – 20% Reliable supply of waste
Banana Rejects
Grid Electricity Generation
Biogas generation for grid electricity (net metering)
Biogas Digester Internal combustion engine
Selected capacity: 15 t/day of waste Plant capacity – 75 kWe Biogas yield – 1500 m3/day
X Could generate about 2MWh/day, High potential for energy generation. Finance by the company, technology transfer through the project.
Baling / Densification
Straw Baler
Wide range; Selected capacity: Field capacity - 0.4 ha/h Rate – 200 bales/hr
X
Densification / Briquette making
Screw type briquetting machine
Typical Capacity Range: 100 – 250 kg/hr Selected Capacity: 200 kg/hr
Value addition to the residue as a fuel for process heat generation in industry
Densification / Pelletizing
Pelletizing machine (Roller and Die Press)
Typical Capacity Range: 1 – 30 t/hr Selected Capacity: 1 t/hr
X
Value addition as animal fodder
Sizing / Mixing & Densification
Densified TMR Block Making Plant
Typical Capacity: Refer that in paddy straw
X
Wild Guinea Grass
Fuel extraction (Ethanol)
Fermentation and Distillation
Bio-refinery system
> 100 t/day of feed stoke > 30,000 l/day of ethanol
(Commercial Systems for other biomass residues)
X
There is potential to use this as a resource further research and development of technologies for collection, transportation, processing and conversion.

4.4 Short listing of Technologies
Based on the technical and other performance characterizations of the technology options
considered in the above section, especially referring to the technology status, short listing of
technologies is carried out. The result is presented in Table 4.3. Basically the technologies
that are commercialized (or possible to commercialize with minor modifications) were
selected.
Table 4.3: Shortlisted Technologies Residue Application Technology Equipment
Briquette making Screw type briquetting machine
Value addition to residue as a fuel
Charcoal making Small scale charcoal kiln Direct combustion Paddy husk cook stove Gasification Paddy husk gas stove
Domestic cooking
Carbonization Charcoal making cook stove Process heat generation for lime smoking
Direct combustion / Direct heating
Paddy husk stove cum cabinet dryer
Process heat generation for fruit and vegetable drying
Direct combustion / Indirect heating
Paddy husk stove cum tray dryer
Process heat generation for tobacco curing
Direct combustion / Indirect heating
Tobacco barn
Grid electricity generation
Direct combustion / Steam cycle
Boiler Steam turbine
Paddy Husk
Conversion to cement extender
Carbonization Basket burner
Value addition as a raw material
Baling / Densification Straw Baler
Straw boards manufacturing
Series of conversion processes
Series of equipment including press or extruder
Paper making Paper pulping Hand tools and utensils Cooking/Lighting Anaerobic digestion /
Biogas Generation Biogas digester– Continuous type
Fertilizer
Composting
Only hand tools for the handling of waste
Paddy Straw
Value addition as animal fodder (total mixed ration - TMR)
Sizing / Mixing & Densification
Densified TMR Block Making Plant
Briquette making Briquetting machine Value addition to the residue as a fuel Pelletizing Pelletizing machine Domestic cooking Direct combustion for
cooking Improved saw dust cook stove with multi-fuel capability
Manufacture of Particle boards
Series of conversion processes
Series of equipment including chipper and press
Saw dust
Manufacture of Medium density fibre board(MDF)
Series of conversion processes
Series of equipment including chipper, boiler, grinder, blender, press.

33
Table 4.3: Shortlisted Technologies (Cont...) Residue Application Technology Equipment
Cooking and lighting Anaerobic digestion / Biogas generation
Biogas digester– Continuous type
Market waste
Fertilizer Composting Only hand tools for the handling of waste
Banana Rejects
Off-grid electricity generation
Biogas generation for off grid electricity
Biogas Digester Internal combustion engine
Wild Guinea Grass
Value addition as animal fodder
Sizing / Mixing & Densification
Densified TMR Block Making Plant
The shortlisted technologies listed above together with their performance characteristics
identified are the outcome of the strategic level assessment. Still the number of resource (i.e.
waste stream) and technology combinations is quite high for the implementation of waste
management programme within the selected areas in Moneragala district. The operational
level assessment, as detailed in the next section, is needed to identify most suitable and
effective technology option(s).
5. CONVERTION OF WASTE TO RESOURCE: OPERATIONAL LEVEL
ASSESSEMNT
5.1 Screening of Technologies
At this stage, the short-listed system options first undergo screening using criteria in Tier-1.
Tier-1 criteria yield only an objective Yes/No type answer and hence, those options that do
not qualify one or all the conditions, then get automatically eliminated. For the present study,
following seven tier-1 criteria were:
- No Policy Restrictions
- Alignment with MEAs and National Plans
- Positive/No impact on existing users of WAB
- Achievement of Project Objectives
- Economic Viability (Affordability)
- Good Environmental Performance
- Positive Social Impact (Employment/ Income generation)
Table 5.1 presents the status of each technology option with reference to each of the criteria.
Technologies satisfying all the above criteria are selected for the further analysis (i.e. scoping
assessment).

Table 5.1: Screening of Technologies Residue Application Technology Equipment
No
Pol
icy
Res
tric
tions
Alig
nmen
t with
ME
As
and
Nat
iona
l Pla
ns
Pos
itive
/No
impa
ct o
n ex
istin
g us
ers
of W
AB
Ach
ieve
men
t of
Pro
ject
Obj
ectiv
es
Eco
nom
ic V
iabi
lity
(Affo
rdab
ility
)
Goo
d E
nviro
nmen
tal
Per
form
ance
Pos
itive
Soc
ial I
mpa
ct
(Em
ploy
men
t/ In
com
e ge
nera
tion)
O
utco
me
Briquette making Briquetting machine Yes Yes Yes Yes Yes Yes Yes Selected Value addition to residue as a fuel Charcoal making Charcoal kiln Yes N/A Yes Yes Yes No Yes Not Selected
Direct combustion Paddy husk cook stove Yes Yes Yes Yes Yes Yes Yes Selected Domestic cooking Gasification Paddy husk gas stove Yes N/A Yes Yes Yes Yes Yes Selected Process heat for lime smoking
Direct combustion / Direct heating
Paddy husk stove cum cabinet dryer
Yes N/A Yes Yes Yes Yes Yes Selected
Process heat for fruit and vegetable drying
Direct combustion / Indirect heating
Paddy husk stove cum tray dryer
Yes N/A Yes Yes Yes Yes Yes Selected
Process heat for tobacco curing
Direct combustion / Indirect heating
Tobacco barn
Yes N/A Yes Yes Yes Yes Yes Selected
Grid electricity generation
Direct combustion / Steam cycle
Boiler Steam turbine
Yes N/A No Yes
Yes Yes Yes Not selected
Paddy Husk1
Conversion to cement extender
Carbonization Basket burner Yes N/A Yes Yes
Yes Yes Yes Selected
1 Paddy husk generated in Buttala D.S. Division is used by brick kilns in the area. Therefore the paddy husk considered in the above matrix is for Monaragala D.S. Division only.

35
Table 5.1: Screening of Technologies (Cont...) Residue Application Technology Equipment
No
Pol
icy
Res
tric
tions
Alig
nmen
t with
ME
As
and
Nat
iona
l Pla
ns
Pos
itive
/No
impa
ct o
n ex
istin
g us
ers
of W
AB
Ach
ieve
men
t of
Pro
ject
Obj
ectiv
es
Eco
nom
ic V
iabi
lity
(Affo
rdab
ility
)
Goo
d E
nviro
nmen
tal
Per
form
ance
Pos
itive
Soc
ial I
mpa
ct
(Em
ploy
men
t/ In
com
e ge
nera
tion)
O
utco
me
Value addition as a raw material
Baling / Densification
Straw Baler No N/A Yes Yes No Yes Yes Not selected
Straw boards manufacturing
Series of conversion processes
Series of equipment including press or extruder
No N/A Yes Yes Yes Yes Yes Not selected
Paper making Paper pulping Hand tools and utensils
No N/A Yes Yes Yes No Yes Not selected
Cooking/Lighting Anaerobic digestion / Biogas Generation
Biogas digester– Continuous type
No N/A Yes Yes Yes Yes Yes Not selected
Fertilizer
Composting
Only hand tools for the handling of waste
No N/A Yes Yes Yes Yes Yes Not selected
Paddy Straw
Value addition as animal fodder (total mixed ration - TMR)
Sizing / Mixing & Densification
Densified TMR Block Making Plant
No N/A Yes Yes Yes Yes Yes Not selected

36
Table5.1: Screening of Technologies (Cont...) Residue Application Technology Equipment
No
Pol
icy
Res
tric
tions
Alig
nmen
t with
ME
As
and
Nat
iona
l Pla
ns
Pos
itive
/No
impa
ct o
n ex
istin
g us
ers
of W
AB
Ach
ieve
men
t of
Pro
ject
Obj
ectiv
es
Eco
nom
ic V
iabi
lity
(Affo
rdab
ility
)
Goo
d E
nviro
nmen
tal
Per
form
ance
Pos
itive
Soc
ial I
mpa
ct
(Em
ploy
men
t/ In
com
e ge
nera
tion)
O
utco
me
Briquette making Briquetting machine Yes N/A Yes Yes Yes Yes Yes Selected Value addition to residue as a fuel Pelletizing Pelletizing machine Yes N/A Yes Yes No Yes Yes Not selected Domestic cooking
Direct combustion for cooking
Improved saw dust cook stove
Yes N/A Yes Yes Yes Yes Yes Selected
Manufacture of Particle boards
Series of conversions
Series of equipment including chipper/press
Yes N/A Yes Yes Yes Yes Yes Selected
Saw dust
Manufacture of Medium density fibre board(MDF)
Series of conversion processes
Series of equipment including chipper, boiler, press, etc.
Yes N/A Yes Yes Yes Yes Yes Selected
Cooking and lighting
Anaerobic digestion / Biogas generation
Biogas digester– Continuous type
Yes N/A N/A Yes Yes Yes Yes Selected Market waste
Fertilizer Composting Only hand tools for the handling of waste
Yes N/A Yes Yes Yes Yes Yes Selected
Banana Rejects
Off-grid electricity generation
Biogas generation for off grid electricity
Biogas Digester Internal combustion engine
Yes N/A Yes Yes Yes Yes Yes Selected
Wild Guinea Grass
Value addition as animal fodder
Sizing / Mixing & Densification
Densified TMR Block Making Plant
Yes2 N/A Yes Yes No Yes Yes Not selected
2 The removal of this grass from certain areas may be restricted.

5.2 Scoping of Technologies
Based on the results of the screening analysis, the resource - technology options selected for
tier 2 level assessment (scoping assessment) are presented in Table 5.2. Note that, as shown
in the table, each technology option is identified through a single letter code, which will be
used to represent the option in the subsequent analysis.
Table 5.2: Technologies Selected for Scoping Analysis Residue Application Technology Equipment
Value addition to residue as a fuel
(A) Briquette making Briquetting machine
(B) Direct combustion Paddy husk cook stove Domestic cooking (C) Gasification Paddy husk gas stove
Process heat for lime smoking
(D) Direct combustion / Direct heating
Paddy husk stove cum cabinet dryer
Process heat for fruit and vegetable drying
(E) Direct combustion / Indirect heating
Paddy husk stove cum tray dryer
Process heat for tobacco curing
(F) Direct combustion / Indirect heating
Tobacco barn
Paddy Husk3
Conversion to cement extender
(G) Carbonization Basket burner
Value addition to residue as a fuel
(H) Briquette making Briquetting machine
Domestic cooking (I) Direct combustion for cooking
Improved saw dust cook stove with multi-fuel capability
Manufacture of Particle boards
(J) Pressing Series of equipment including chipper/press
Saw dust
Manufacture of Medium density fibre board(MDF)
(K) Pressing Series of equipment including chipper, boiler, press, etc.
Cooking and lighting
(L) Biogas generation Biogas digester– Continuous type
Market waste
Fertilizer (M) Composting Only hand tools for the handling of waste
Banana Rejects 4
Off-grid electricity generation
(N) Biogas generation Biogas digester– Continuous type and IC Engine
Short-listed system options from the Tier 1 then go through the comprehensive scoping
assessment (Tier 2) that is more of qualitative in nature. During this stage of SAT, the
stakeholders are required to assess the various technology system options against the generic
and customized criteria and indicators using an appropriate standard methodology. In the
3 Paddy husk generated in Buttala D.S. Division is used by brick kilns in the area. Therefore the paddy husk considered in the above matrix is for Monaragala D.S. Division only. 4 This is applicable in Buttala D.S. Division only as the plantation is in this area.

38
present study, a set of criteria under four different aspects, as (i) Technical, (ii) Financial, (iii)
Social and (iv) Environment, as presented in Table 5.3.
Table 5.3: Criteria Selected for Scoping Analysis Category Criterion Notation
Suitability to characteristics of waste stream TC1 Availability of adequate amount of waste TC2 Compliance with prevailing local environmental laws, regulations and standards TC3 Accessibility of technologies TC4 Availability of local expertise/capacity building requirement for design, operation and maintenance TC5 Level of use of local material and resources for fabrication and operation TC6 Availability of in country technical assistance during commissioning and operation TC7 Level of similar usages and performance records in Sri Lanka TC8 Adaptability - Ability to fit into local (project area) conditions TC9 Adaptability to future situations (scale-up/expansions) TC10
Technical
Ability to replicate TC11 Capital investment FC1 Operational and maintenance costs FC2 Payback period FC3 Value addition to WAB FC4 Investor attractiveness FC5 Availability of co-financing FC6
Financial
Co-benefits FC7 Job creation SC1 Acceptability to local culture SC2 Improvement of quality of life SC3 Occupational safety and health conditions SC4
Social
Improvement of local technical skills and knowledge base SC5 Additional support services/utilities (Water/Energy) EC1 Environmental emissions EC2 Noise, vibration and odour EC3 Space and infrastructure requirement EC4 Contribution to WAB management EC5
Environmental
Net carbon emissions EC6
Each criterion was given a weight in a 0 to 10 scale based on its importance. Each technology
was evaluated against each criterion using four different levels of importance as (i) None, (ii)
Low, (iii) Medium and (iv) High with scores 0, 1, 2, and 3, respectively. The results are
presented in a weighted sum matrix. The total score of each technology is calculated under
each of the four categories of criteria. The results are presented in Table 5.4.

Table 5.4: Weighted sum matrix Technology
A B C D E F G H I J K L M N
Criteria W
eig
ht
Max
. Wt.
Sco
re
Sco
re
Wt
Sco
re
Sco
re
Wt
Sco
re
Sco
re
Wt
Sco
re
Sco
re
Wt
Sco
re
Sco
re
Wt
Sco
re
Sco
re
Wt
Sco
re
Sco
re
Wt
Sco
re
Sco
re
Wt
Sco
re
Sco
re
Wt
Sco
re
Sco
re
Wt
Sco
re
Sco
re
Wt
Sco
re
Sco
re
Wt
Sco
re
Sco
re
Wt
Sco
re
Sco
re
Wt
Sco
re
Technical Criteria
TC1 8 24 2 16 2 16 2 16 2 16 2 16 2 16 2 16 2 16 2 16 2 16 1 8 1 8 2 16 3 24 TC2 10 30 2 20 3 30 3 30 3 30 3 30 3 30 1 10 1 10 2 20 1 10 0 0 2 20 3 30 3 30 TC3 9 27 3 27 2 18 3 27 2 18 2 18 2 18 2 18 3 27 2 18 2 18 2 18 3 27 2 18 3 27 TC4 9 27 1 9 3 27 1 9 2 18 2 18 1 9 1 9 2 18 3 27 1 9 2 18 3 27 3 27 3 27 TC5 8 24 1 8 3 24 1 8 3 24 3 24 2 16 1 8 2 16 3 24 1 8 2 16 3 24 3 24 3 24 TC6 6 18 2 12 3 18 3 18 3 18 3 18 3 18 3 18 2 12 3 18 2 12 1 6 3 18 3 18 3 18 TC7 6 18 1 6 3 18 2 12 3 18 3 18 2 12 1 6 2 12 3 18 2 12 1 6 3 18 3 18 3 18 TC8 7 21 0 0 2 14 1 7 2 14 3 21 3 21 1 7 2 14 3 21 1 7 1 7 2 14 2 14 2 14 TC9 9 27 2 18 1 9 2 18 3 27 3 27 2 18 1 9 2 18 2 18 1 9 1 9 2 18 2 18 3 27 TC10 5 15 1 5 1 5 0 0 2 10 2 10 2 10 1 5 1 5 1 5 2 10 2 10 3 15 3 15 3 15 TC11 8 24 2 16 3 24 2 16 3 24 3 24 2 16 1 8 2 16 2 16 2 16 1 8 3 24 3 24 1 8
Total Score - TC 85 255 137 203 161 217 224 184 114 164 201 127 106 213 222 232
Financial Criteria FC1 9 27 1 9 3 27 2 18 2 18 2 18 2 18 2 18 1 9 3 27 2 18 1 9 2 18 3 27 2 18 FC2 9 27 1 9 3 27 2 18 2 18 2 18 2 18 2 18 1 9 3 27 2 18 1 9 2 18 2 18 3 27 FC3 5 15 1 5 3 15 1 5 2 10 2 10 2 10 2 10 1 5 3 15 2 10 1 5 1 5 2 10 3 15 FC4 7 21 3 21 1 7 2 14 2 14 2 14 2 14 2 14 3 21 1 7 3 21 3 21 3 21 2 14 3 21 FC5 6 18 1 6 0 0 1 6 2 12 2 12 2 12 1 6 1 6 0 0 1 6 0 0 1 6 1 6 2 12 FC6 6 18 1 6 0 0 1 6 2 12 2 12 1 6 1 6 1 6 0 0 1 6 0 0 2 12 2 12 1 6 FC7 5 15 0 0 0 0 0 0 0 0 0 0 0 0 1 5 0 0 0 0 0 0 0 0 2 10 0 0 2 10
Total Score - FC 47 141 56 76 67 84 84 78 77 56 76 79 44 90 87 109

40
Table 5.4: Weighted sum matrix (Cont...) Technology
A B C D E F G H I J K L M N
Criteria W
eig
ht
Max
. Wt.
Sco
re
Sco
re
Wt
Sco
re
Sco
re
Wt
Sco
re
Sco
re
Wt
Sco
re
Sco
re
Wt
Sco
re
Sco
re
Wt
Sco
re
Sco
re
Wt
Sco
re
Sco
re
Wt
Sco
re
Sco
re
Wt
Sco
re
Sco
re
Wt
Sco
re
Sco
re
Wt
Sco
re
Sco
re
Wt
Sco
re
Sco
re
Wt
Sco
re
Sco
re
Wt
Sco
re
Sco
re
Wt
Sco
re
Social Criteria SC1 8 24 2 16 0 0 1 8 3 24 3 24 1 8 1 8 2 16 0 0 2 16 2 16 1 8 2 16 1 8 SC2 7 21 1 7 1 7 1 7 2 14 2 14 2 14 1 7 2 14 1 7 1 7 2 14 2 14 2 14 3 21 SC3 6 18 2 12 1 6 2 12 2 12 2 12 2 12 1 6 2 12 1 6 2 12 1 6 3 18 3 18 1 6 SC4 6 18 1 6 1 6 2 12 2 12 2 12 2 12 1 6 1 6 1 6 1 6 1 6 2 12 1 6 3 18 SC5 6 18 1 6 0 0 1 6 2 12 2 12 1 6 2 12 1 6 0 0 2 12 2 12 2 12 2 12 2 12
Total Score - SC 33 99 7 47 3 19 7 45 11 74 11 74 8 52 6 39 8 54 3 19 8 53 8 54 10 64 10 66 10 65 Environment
Criteria
EC1 5 15 1 5 3 15 2 10 2 10 2 10 2 10 2 10 1 5 3 15 1 5 1 5 2 10 3 15 2 10 EC2 9 27 1 9 1 9 2 18 2 18 2 18 1 9 1 9 1 9 1 9 1 9 1 9 2 18 1 9 2 18 EC3 7 21 2 14 2 14 3 21 3 21 3 21 3 21 2 14 2 14 2 14 2 14 2 14 2 14 1 7 3 21 EC4 4 12 2 8 3 12 3 12 2 8 2 8 2 8 2 8 2 8 3 12 2 8 1 4 2 8 1 4 2 8 EC5 8 24 3 24 1 8 1 8 3 24 3 24 2 16 2 16 3 24 1 8 2 16 3 24 3 24 3 24 3 24 EC6 7 21 2 14 2 14 3 21 2 14 2 14 2 14 2 14 2 14 2 14 2 14 1 7 3 21 1 7 3 21
Total Score - EC 40 120 11 74 12 72 14 90 14 95 14 95 12 78 11 71 11 74 12 72 10 66 9 63 14 95 10 66 15 102
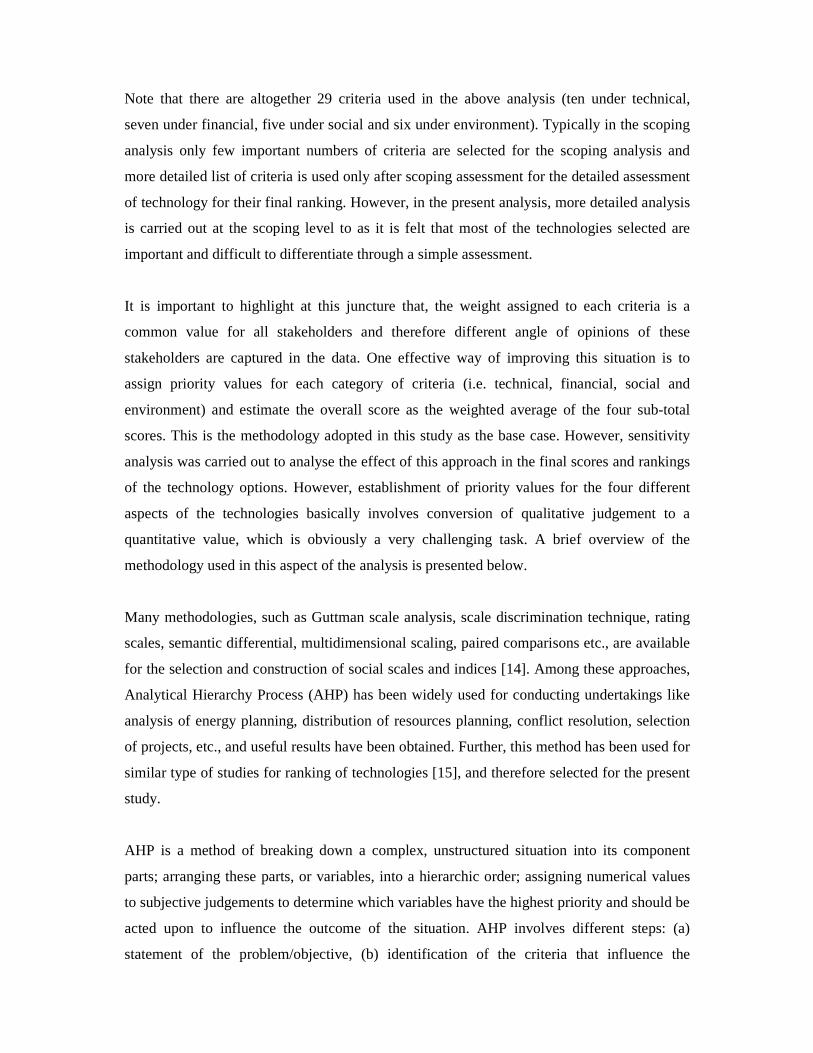
Note that there are altogether 29 criteria used in the above analysis (ten under technical,
seven under financial, five under social and six under environment). Typically in the scoping
analysis only few important numbers of criteria are selected for the scoping analysis and
more detailed list of criteria is used only after scoping assessment for the detailed assessment
of technology for their final ranking. However, in the present analysis, more detailed analysis
is carried out at the scoping level to as it is felt that most of the technologies selected are
important and difficult to differentiate through a simple assessment.
It is important to highlight at this juncture that, the weight assigned to each criteria is a
common value for all stakeholders and therefore different angle of opinions of these
stakeholders are captured in the data. One effective way of improving this situation is to
assign priority values for each category of criteria (i.e. technical, financial, social and
environment) and estimate the overall score as the weighted average of the four sub-total
scores. This is the methodology adopted in this study as the base case. However, sensitivity
analysis was carried out to analyse the effect of this approach in the final scores and rankings
of the technology options. However, establishment of priority values for the four different
aspects of the technologies basically involves conversion of qualitative judgement to a
quantitative value, which is obviously a very challenging task. A brief overview of the
methodology used in this aspect of the analysis is presented below.
Many methodologies, such as Guttman scale analysis, scale discrimination technique, rating
scales, semantic differential, multidimensional scaling, paired comparisons etc., are available
for the selection and construction of social scales and indices [14]. Among these approaches,
Analytical Hierarchy Process (AHP) has been widely used for conducting undertakings like
analysis of energy planning, distribution of resources planning, conflict resolution, selection
of projects, etc., and useful results have been obtained. Further, this method has been used for
similar type of studies for ranking of technologies [15], and therefore selected for the present
study.
AHP is a method of breaking down a complex, unstructured situation into its component
parts; arranging these parts, or variables, into a hierarchic order; assigning numerical values
to subjective judgements to determine which variables have the highest priority and should be
acted upon to influence the outcome of the situation. AHP involves different steps: (a)
statement of the problem/objective, (b) identification of the criteria that influence the

42
behaviour of the problem, (c) structuring a hierarchy of the criteria and alternatives. In AHP,
alternatives refer to the different solutions or choices available, for example the technologies
selected in this study. For the purpose of establishing priority values, AHP uses the pair-wise
comparison - that is to compare the elements in pair against a given criterion. The pair-wise
comparisons for the different criteria and alternatives are obtained through feedback of
different stakeholders (referred to as Actors) [16]. A summary of the AHP methodology is
presented in Appendix B.
The final overall score is calculated as the normalized weighted average of the four scores.
The weights (or priority values) for the four categories were derived from the feed-back from
stakeholders (or actors) by using pair-wise comparison technique defined in Analytical
Hierarchical Process (AHP). The priority values of seven different actors, based on their
responses, are presented in Figure 5.1. The overall priority values (the mean) are calculated
by equal weighted averaging of that of all the actors. The final priority values are given in
Table 5.5. Derivation of these results is presented in Appendix B.
Figure 5.1: Priority values of the four criteria
Table 5.5: Mean priority values of criteria derived from pair-wise comparison Category of Criteria Priority Values
Technical 0.266 Financial 0.105 Social 0.188 Environment 0.441
0.00
0.10
0.20
0.30
0.40
0.50
0.60
TC FC SC EC
Pri
ori
ty V
alu
e
Category of Criteria
Actor 1
Actor 2
Actor 3
Actor 4
Actor 5
Actor 6
Actor 7
Mean
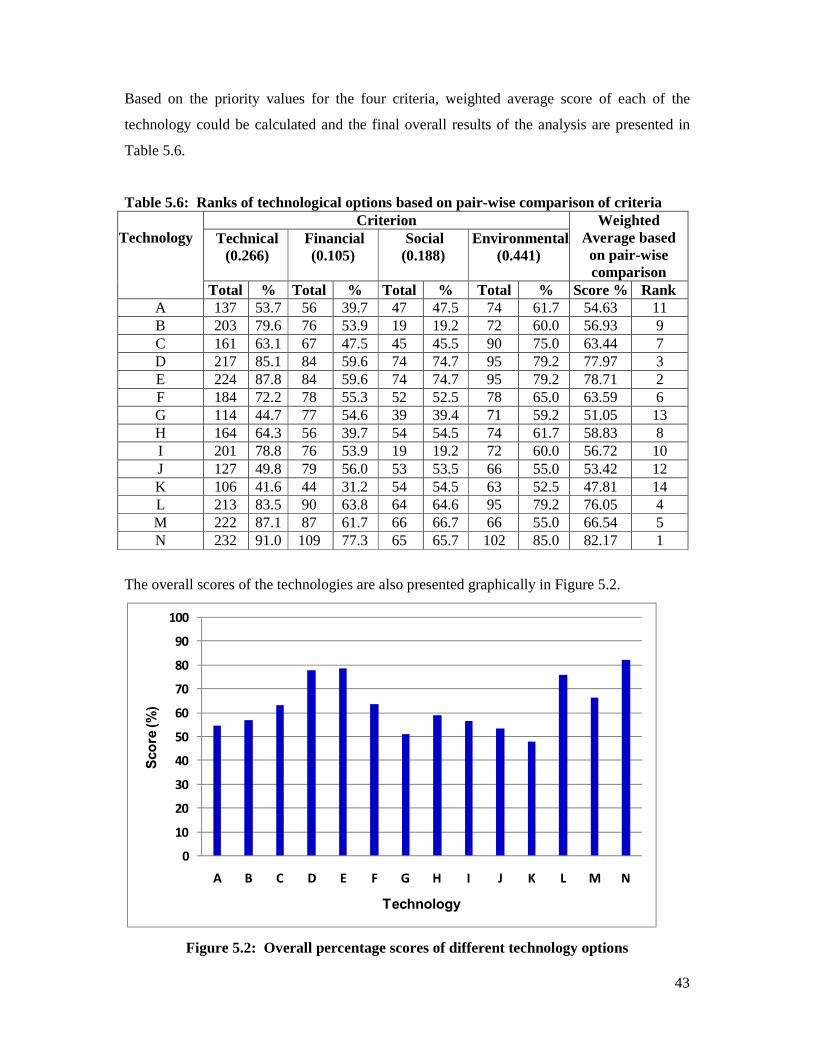
43
Based on the priority values for the four criteria, weighted average score of each of the
technology could be calculated and the final overall results of the analysis are presented in
Table 5.6.
Table 5.6: Ranks of technological options based on pair-wise comparison of criteria Criterion
Technical (0.266)
Financial (0.105)
Social (0.188)
Environmental (0.441)
Weighted Average based on pair-wise comparison
Technology
Total % Total % Total % Total % Score % Rank A 137 53.7 56 39.7 47 47.5 74 61.7 54.63 11 B 203 79.6 76 53.9 19 19.2 72 60.0 56.93 9 C 161 63.1 67 47.5 45 45.5 90 75.0 63.44 7 D 217 85.1 84 59.6 74 74.7 95 79.2 77.97 3 E 224 87.8 84 59.6 74 74.7 95 79.2 78.71 2 F 184 72.2 78 55.3 52 52.5 78 65.0 63.59 6 G 114 44.7 77 54.6 39 39.4 71 59.2 51.05 13 H 164 64.3 56 39.7 54 54.5 74 61.7 58.83 8 I 201 78.8 76 53.9 19 19.2 72 60.0 56.72 10 J 127 49.8 79 56.0 53 53.5 66 55.0 53.42 12 K 106 41.6 44 31.2 54 54.5 63 52.5 47.81 14 L 213 83.5 90 63.8 64 64.6 95 79.2 76.05 4 M 222 87.1 87 61.7 66 66.7 66 55.0 66.54 5 N 232 91.0 109 77.3 65 65.7 102 85.0 82.17 1
The overall scores of the technologies are also presented graphically in Figure 5.2.
Figure 5.2: Overall percentage scores of different technology options
0
10
20
30
40
50
60
70
80
90
100
A B C D E F G H I J K L M N
Sco
re (%
)
Technology
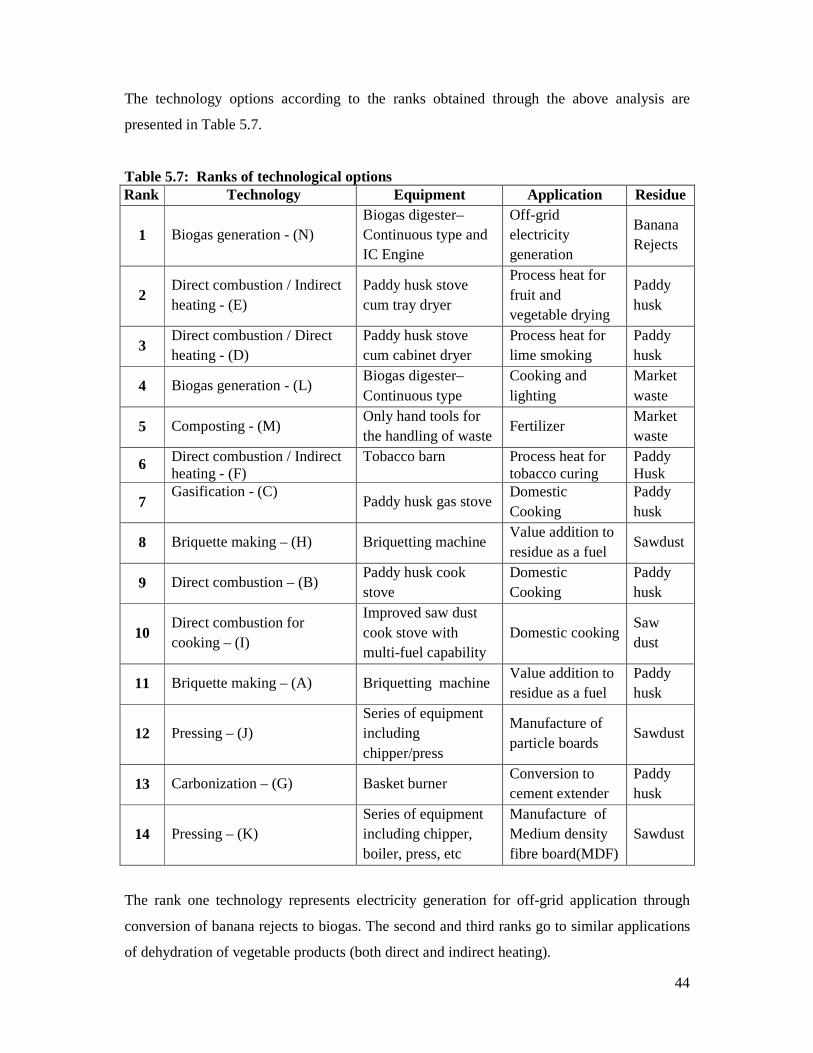
44
The technology options according to the ranks obtained through the above analysis are
presented in Table 5.7.
Table 5.7: Ranks of technological options Rank Technology Equipment Application Residue
1 Biogas generation - (N) Biogas digester– Continuous type and IC Engine
Off-grid electricity generation
Banana Rejects
2 Direct combustion / Indirect heating - (E)
Paddy husk stove cum tray dryer
Process heat for fruit and vegetable drying
Paddy husk
3 Direct combustion / Direct heating - (D)
Paddy husk stove cum cabinet dryer
Process heat for lime smoking
Paddy husk
4 Biogas generation - (L) Biogas digester– Continuous type
Cooking and lighting
Market waste
5 Composting - (M) Only hand tools for the handling of waste
Fertilizer Market waste
6 Direct combustion / Indirect heating - (F)
Tobacco barn Process heat for tobacco curing
Paddy Husk
7 Gasification - (C)
Paddy husk gas stove Domestic Cooking
Paddy husk
8 Briquette making – (H) Briquetting machine Value addition to residue as a fuel
Sawdust
9 Direct combustion – (B) Paddy husk cook stove
Domestic Cooking
Paddy husk
10 Direct combustion for cooking – (I)
Improved saw dust cook stove with multi-fuel capability
Domestic cooking Saw dust
11 Briquette making – (A) Briquetting machine Value addition to residue as a fuel
Paddy husk
12 Pressing – (J) Series of equipment including chipper/press
Manufacture of particle boards
Sawdust
13 Carbonization – (G) Basket burner Conversion to cement extender
Paddy husk
14 Pressing – (K) Series of equipment including chipper, boiler, press, etc
Manufacture of Medium density fibre board(MDF)
Sawdust
The rank one technology represents electricity generation for off-grid application through
conversion of banana rejects to biogas. The second and third ranks go to similar applications
of dehydration of vegetable products (both direct and indirect heating).

45
5.3 Detailed Assessment of Technologies
• Scenario Analysis
As the technologies selected after tier 1 assessment were undergone a detailed evaluation
against 29 criteria in the scoping assessment, in this level of assessment some sensitivity
analyses are carried out to investigate the variations in ranking. Firstly, the effect of priorities
given in Table 5.5 for the four categories of criteria is analysed considering another situation
where each category is given equal priority value of 0.25. The results are presented in Table
5.8. It can be seen that the ranks of the ten technologies, including the first eight, remains the
same. In fact, the change is primarily due to the increase in ranking of J from 12th to 9th.
Table 5.8: Ranks of technological options based on equal weights for criteria Criterion
Technical Financial Social Environmental Average based on
Equal Weights Technology
Total % Total % Total % Total % Score % Rank A 137 53.7 56 39.7 47 47.5 74 61.7 50.65 12 B 203 79.6 76 53.9 19 19.2 72 60.0 53.18 10 C 161 63.1 67 47.5 45 45.5 90 75.0 57.78 7 D 217 85.1 84 59.6 74 74.7 95 79.2 74.65 3 E 224 87.8 84 59.6 74 74.7 95 79.2 75.33 2 F 184 72.2 78 55.3 52 52.5 78 65.0 61.25 6 G 114 44.7 77 54.6 39 39.4 71 59.2 49.47 13 H 164 64.3 56 39.7 54 54.5 74 61.7 55.06 8 I 201 78.8 76 53.9 19 19.2 72 60.0 52.98 11 J 127 49.8 79 56.0 53 53.5 66 55.0 53.59 9 K 106 41.6 44 31.2 54 54.5 63 52.5 44.95 14 L 213 83.5 90 63.8 64 64.6 95 79.2 72.79 4 M 222 87.1 87 61.7 66 66.7 66 55.0 67.61 5 N 232 91.0 109 77.3 65 65.7 102 85.0 79.74 1
During the discussions on the assigning the priority values, the effect of the concept of pair-
wise comparison (of AHP methodology) on the priority values against that of the
simultaneous comparison (where the priorities were assigned simultaneously with detailed
discussions among the participants and after arriving at common consensus) was explored.
The priority values obtained based on simultaneous comparison are given in Table 5.9.
Table 5.9: Priority values of criteria derived from simultaneous comparison Category of Criteria Priority Values
Technical 0.20 Financial 0.10 Social 0.35 Environment 0.35

46
Table 5.10: Ranks of technological options based on simultaneous comparison of criteria Criterion (Priority Weights)
Technical (0.20)
Financial (0.10)
Social (0.35)
Environmental (0.35)
Weighted Average based
on simultaneous comparison
Technology
Total % Total % Total % Total % Score % Rank A 137 53.7 56 39.7 47 47.5 74 61.7 52.92 10 B 203 79.6 76 53.9 19 19.2 72 60.0 49.03 11 C 161 63.1 67 47.5 45 45.5 90 75.0 59.54 7 D 217 85.1 84 59.6 74 74.7 95 79.2 76.85 3 E 224 87.8 84 59.6 74 74.7 95 79.2 77.40 2 F 184 72.2 78 55.3 52 52.5 78 65.0 61.10 6 G 114 44.7 77 54.6 39 39.4 71 59.2 48.90 13 H 164 64.3 56 39.7 54 54.5 74 61.7 57.51 8 I 201 78.8 76 53.9 19 19.2 72 60.0 48.87 14 J 127 49.8 79 56.0 53 53.5 66 55.0 53.55 9 K 106 41.6 44 31.2 54 54.5 63 52.5 48.90 12 L 213 83.5 90 63.8 64 64.6 95 79.2 73.42 4 M 222 87.1 87 61.7 66 66.7 66 55.0 66.17 5 N 232 91.0 109 77.3 65 65.7 102 85.0 78.66 1
The above results show that there is no change in the ranking of nine of the technologies
(including the top eight). Finally, another scenario is considered where total marks derived
from scores under all the 29 criteria, without grouping into the four categories, are taken to
rank the technologies. The resulting total marks and the ranks are presented in Table 5.11.
Table 5.11: Ranks of technological options based on total scores of all criteria Sub-Total Score of Criterion
Technology Technical Financial Social Environmental Total Score Rank
A 137 56 47 74 314 12 B 203 76 19 72 370 7 C 161 67 45 90 363 9 D 217 84 74 95 470 3 E 224 84 74 95 477 2 F 184 78 52 78 392 6 G 114 77 39 71 301 13 H 164 56 54 74 348 10 I 201 76 19 72 368 8 J 127 79 53 66 325 11 K 106 44 54 63 267 14 L 213 90 64 95 462 4 M 222 87 66 66 441 5 N 232 109 65 102 508 1

47
In this case too, the technologies with highest ranks remains at the same standing. There is no
change in the ranking of eight technologies (including the top six). Note that in this case, as
there are eleven criteria considered under the category of technical criterion –TC (against that
of seven in FC, five in SC and six in EC) , there is a considerable higher priority given for TC
in this analysis. In fact, based on the maximum total marks attainable in each category, the
priority values could be estimated as 0.41, 0.23, 0.16 and 0.20 form TC, FC, SC and EC,
respectively.
The results of all the scenario analysis shown above (in which there are considerable
variations in the priority values among different criteria) indicate the insensitivity of the top
ranking technologies to the relative priority values of the criteria. Therefore, it could be
concluded that the top ranking technologies basically have higher scores in all the categories.
Hence it is easier to arrive at a decision for the technology selection.
• Star Diagram for Detailed Assessment of Criteria
The results given in the tabular form through numerical values are usually not very effective
when one need to investigate more closely the reasons for relative ranking of different
technologies and also to identify the critical or important criteria that need more
considerations. One effective method is to employ a graphical representation of the results. In
this section, scores in each of the four categories of criteria for the first four top ranking
technologies are represented in star diagrams. These technologies are, in the order of ranking,
Biogas generation from banana rejects to generate off-grid electricity (N), Process heat
generation from paddy husk for indirect drying of fruit and vegetable (E), Process heat
generation from paddy husk for direct smoking of lime (D) and Biogas generation from
market waste for cooking and lighting applications (L), which basically represent two distinct
technology categories: conversion of waste to biogas and conversion of waste to heat through
direct combustion.
(a) Star Diagram for Environment Aspects
The category of environment criteria has the highest priority value and therefore considered
first in this analysis. There were six criteria considered under environment aspects and Figure
5.3 presents the scores of the top four ranking technologies in a star diagram. In this case,
there are not much different between the four technology options. Out of the maximum score

48
0
5
10
15
20
25
EC1
EC2
EC3
EC4
EC5
EC6
Rank 1
Rank 2
Rank 3
Rank 4
of 120 attainable under this category Rank 1 technology (N) scores 102 marks (i.e. 85%) and
all the other three have equal marks of 95 (i.e. 79%). Therefore all these four technology
interventions will have considerable positive impact on the environment.
Figure 5.3: Star diagram for environment aspects for the top four ranks technologies
(b) Star Diagram for Technical Aspects
The second highest priority is given for technical aspects. Under this, eleven criteria were
included in the analysis and the results are presented in Figure 5.4.
Figure 5.4: Star diagram for technical aspects for the top four ranks technologies
0
5
10
15
20
25
30
TC1
TC2
TC3
TC4
TC5
TC6TC7
TC8
TC9
TC10
TC11
Rank 1
Rank 2
Rank 3
Rank 4

49
It can be seen that all the four technologies have lover score under criterion TC10, which is
the ability to scale-up. Yet, except for Rank 1 technology, all other three technologies have
high potential for replication (i.e. TC11). As Rank 1 technology is based on a very specific
type or residue (banana rejects), the ability for future expansion as well as replication is low.
However, this technology has obtained higher scores against all the other technical criteria,
which contributed for its highest rank. As in the case of environmental aspects, all the four
technologies scored high marks under technical aspects, indicating the high technical
feasibility of the interventions. For example, out of the maximum score of 255, the scores of
the first four technologies are 232 (i.e. 91%), 224 (i.e. 88%), 217 (i.e. 85%) and 214 (i.e.
84%).
(c) Star Diagram for Social Aspects
The social aspects include five criteria as shown in Figure 5.5.
Figure 5.5: Star diagram for social aspects for the top four ranks technologies
In this case Rank 2 and Rank 3 technologies (being a very similar applications) have identical
shape in the star diagram with a total score of 74 out of 99 (i.e. 75%). Rank 1 and Rank 4
technologies have very similar total scores of 65 and 64, respectively. In general, all these
technologies have lower performances in terms of social aspects than environmental and
technical aspects. In particular, scores against SC5, which represents the improvement of
local technical skills and knowledge base, is quite low. Therefore, in order to improve the
0
5
10
15
20
25
SC1
SC2
SC3SC4
SC5Rank 1
Rank 2
Rank 3
Rank 4

50
performances against social criteria, some corrective interventions should be identified with
the implementation of these technical options.
(d) Star Diagram for Financial Aspects
This category has seven criteria and the scores of the four technologies are illustrated in
Figure 5.6. Except for the Rank 1 technology, all the technologies have poor performances
against the financial aspects, particularly when compared to environmental and technical
aspects. Even, Rank 1 technology has lower scores under criteria FC5, FC6 and FC7, which
represent Investor attractiveness, Availability of co-financing and Co-benefits, respectively.
Figure 5.6: Star diagram for financial aspects for the top four ranks technologies
(e) Composite Star Diagram for all Aspects
It is also useful to represent the scores obtained by the four technologies against all the 29
criteria in the same star diagram, as shown in Figure 5.7, so that overall picture of the
situation could be observed. The results primarily indicate weightiness towards technical
aspects in terms of their performances. The weakest area is the social aspects. Even the
environment aspects and some financial aspects show poor scores. In order to optimize the
benefits of these technological interventions, a more detail analysis is required firstly to
identify the root causes and secondly to develop remedial measures. Otherwise, it will not be
able to achieve the overall objective and expected outcome of the project.
0
5
10
15
20
25
30
FC1
FC2
FC3
FC4FC5
FC6
FC7
Rank 1
Rank 2
Rank 3
Rank 4

51
Figure 5.7: Star diagram of all criteria for the top four ranks technologies
(f) Star Diagram for comparison of two distinct technologies
Figure 5.8: Star diagram for two technologies using paddy husk
0
5
10
15
20
25
30
TC1TC2
TC3
TC4
TC5
TC6
TC7
TC8
TC9
TC10
TC11
FC1
FC2FC3
FC4FC5FC6
FC7
SC1
SC2
SC3
SC4
SC5
EC1
EC2
EC3
EC4
EC5EC6
Rank 1
Rank 2
Rank 3
Rank 4
0
5
10
15
20
25
30
TC1TC2
TC3
TC4
TC5
TC6
TC7
TC8
TC9
TC10
TC11
FC1
FC2FC3
FC4FC5FC6
FC7
SC1
SC2
SC3
SC4
SC5
EC1
EC2
EC3
EC4
EC5EC6
Rank 2
Rank 11

52
Another important application of the star diagram representation of the scores is to compare
two different technologies in terms of their performances against all the criteria. For example,
consider two technology options for the management of paddy husk: direct combustion for
process heat generation (Technology E having 2nd rank) and densification through briquetting
(Technology A having 11th rank). The scores are presented in Figure 5.8 above. It is evident
from the diagram that the direct combustion of paddy husk is better in almost all the criteria
that the briquetting, especially in the local context.
Meanwhile, performances of the same technology under different fuel categories could also
be analysed through star diagram. For example, consider briquetting technology option for
the management of paddy husk and sawdust. The corresponding options are denoted by
Technology A (having 11th rank) and Technology H (having 8th rank). Once again, the scores
are presented in the star diagram, as shown in Figure 5.9.
Figure 5.9: Star diagram for two residues (paddy husk and sawdust) using same
technology (briquetting)
The diagram indicates that the sawdust briquetting is a better option than paddy husk
briquetting as a waste management measure in the selected region, primarily due to its better
technical performances. Financial and environmental performances are identical, though
sawdust briquetting show slightly better social benefits.
0
5
10
15
20
25
30
TC1TC2
TC3
TC4
TC5
TC6
TC7
TC8
TC9
TC10
TC11
FC1
FC2FC3
FC4FC5FC6
FC7
SC1
SC2
SC3
SC4
SC5
EC1
EC2
EC3
EC4
EC5EC6
Rank 8
Rank 11
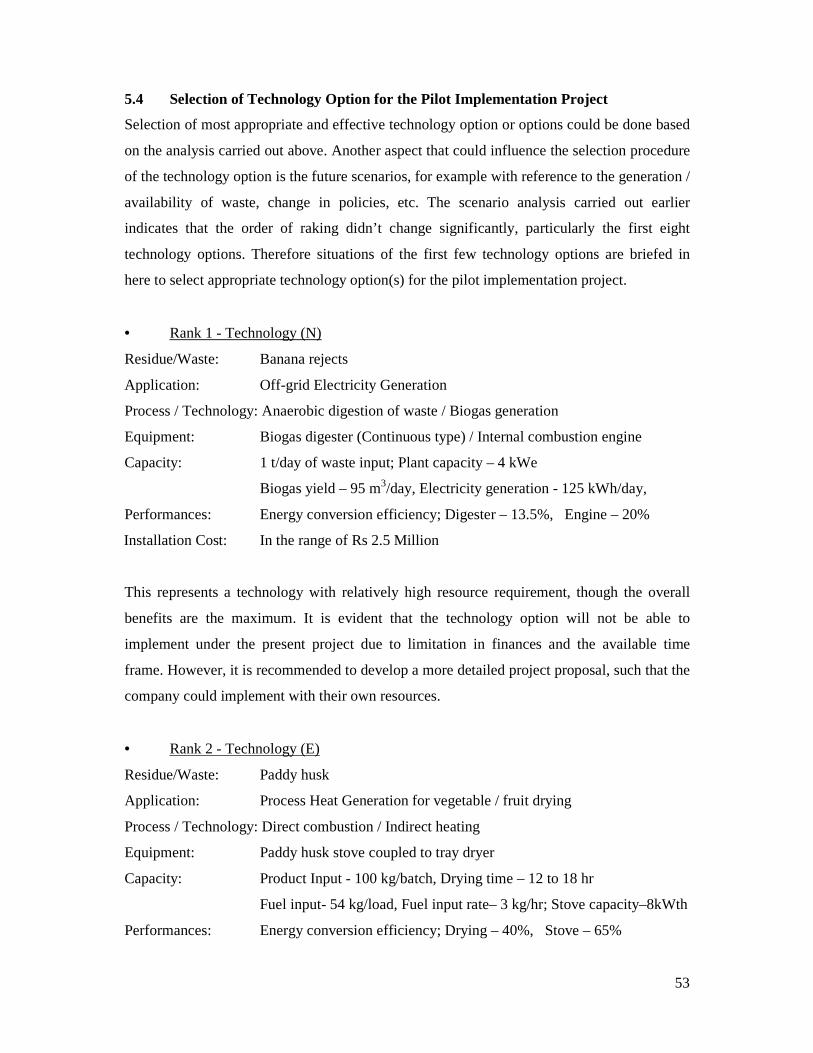
53
5.4 Selection of Technology Option for the Pilot Implementation Project
Selection of most appropriate and effective technology option or options could be done based
on the analysis carried out above. Another aspect that could influence the selection procedure
of the technology option is the future scenarios, for example with reference to the generation /
availability of waste, change in policies, etc. The scenario analysis carried out earlier
indicates that the order of raking didn’t change significantly, particularly the first eight
technology options. Therefore situations of the first few technology options are briefed in
here to select appropriate technology option(s) for the pilot implementation project.
• Rank 1 - Technology (N)
Residue/Waste: Banana rejects
Application: Off-grid Electricity Generation
Process / Technology: Anaerobic digestion of waste / Biogas generation
Equipment: Biogas digester (Continuous type) / Internal combustion engine
Capacity: 1 t/day of waste input; Plant capacity – 4 kWe
Biogas yield – 95 m3/day, Electricity generation - 125 kWh/day,
Performances: Energy conversion efficiency; Digester – 13.5%, Engine – 20%
Installation Cost: In the range of Rs 2.5 Million
This represents a technology with relatively high resource requirement, though the overall
benefits are the maximum. It is evident that the technology option will not be able to
implement under the present project due to limitation in finances and the available time
frame. However, it is recommended to develop a more detailed project proposal, such that the
company could implement with their own resources.
• Rank 2 - Technology (E)
Residue/Waste: Paddy husk
Application: Process Heat Generation for vegetable / fruit drying
Process / Technology: Direct combustion / Indirect heating
Equipment: Paddy husk stove coupled to tray dryer
Capacity: Product Input - 100 kg/batch, Drying time – 12 to 18 hr
Fuel input- 54 kg/load, Fuel input rate– 3 kg/hr; Stove capacity–8kWth
Performances: Energy conversion efficiency; Drying – 40%, Stove – 65%

54
Installation Cost: In the range of Rs. 400,000
This is a very viable technology option for the pilot implementation project. There is a high
potential for replication of this technology, not only within the selected region but also
throughout the country. Since the technology is a small scale one, the sustainable supply of
paddy husk is guaranteed. The technology could be applied to drying of wide variety of
products including other food products as well as non-food items. The technology suppliers
are also available and could be fabricated locally and therefore the technology transfer and
adaptation are possible. Therefore selection of this technology as the pilot implementation
project is highly recommended.
• Rank 3 - Technology (D)
Residue/Waste: Paddy husk
Application: Process Heat Generation for lime smoking
Process / Technology: Direct combustion / Direct heating
Equipment: Paddy husk stove coupled to tray dryer
Capacity: Product Input - 200 kg/batch, Drying time – 36 hr
Fuel input- 72 kg/load, Fuel input rate- 2 kg/hr, Stove capacity–5 kWth
Performances: Energy conversion efficiency; Drying – 60%, Stove – 65%
Installation Cost: In the range of Rs. 600,000
This is a very similar technology option as the previous one and has the same viability and
benefits. As the technology represents smoking of a food product, the application to other
products is limited. Yet, lime is one of the most common agricultural products grown in the
area, dissemination of the technology will have many benefits to the local community, while
achieving other objectives related to waste management. In this case too, the technology
suppliers are available and local fabrication is possible. Therefore selection of this technology
option for the pilot implementation project is recommended.
• Rank 4 - Technology (L)
Residue/Waste: Market waste
Application: Cooking and lighting
Process / Technology: Anaerobic digestion of waste / Biogas Generation

55
Equipment: Biogas digester (Continuous type)
Capacity: 500 kg/day of waste input; Tank volume - 60 m3
Biogas yield – 47 m3/day
Performances: Sufficient for cooking and lighting for 15 families
Installation Cost: In the range of Rs. 900,000
This technology intervention is one of the proven concepts for the management of market
waste, open dumping of which is becoming a growing problem in many part of the country,
especially in the urban sectors. The technology is available locally and the local authorities
are keen on implementing such waste management programme. Therefore, implementation of
this technology intervention is highly required as a solution to waste management activity,
though the previous two technology options are preferred over this one as the pilot
implementation project. As in the case of rank 1 technology, it is recommended to develop a
detailed project proposal to be submitted to the local authority for further actions.
• Other Technologies
The above four technologies represent use of three types of residues/waste: banana rejects,
paddy husk and market waste. Therefore, in selecting the other potential technology options
management of other residue types has to be given a due consideration. This will ensure the
maximum outcome of an overall waste management programme in the Moneragala district.
Therefore the technologies in the next ranks such as composting of market waste (M),
process heat generation from paddy husk for tobacco curing (F), and paddy husk gas stove for
domestic cooking (C), with ranks 5, 6 and 7, respectively will not be considered as potential
candidate technology options for the pilot implementation project. However, the importance
of these technology options in an overall waste management programme should be duly
recognized.
The next ranked (8th) technology is sawdust briquetting (H), which represents a residue and a
technology that are not covered in the earlier selections. Therefore, it is recommended to
analyse further the possibility of selecting this technology option, particularly to mitigate
adverse issues associated with lack of proper management practices of sawdust in
Moneragala district. The details of this technology option are given below:

56
Residue/Waste: Sawdust
Application: Briquette making for the process heat generation in industry
Process / Technology: Densification / Briquetting
Equipment: Screw type briquetting machine, including dryer and vibrating
screening machine
Capacity: 200 kg/hr of sawdust
Performances: Briquette density: 0.8–1.2 t/m3; Energy requirement: 200 kWh/t.
Installation Cost: In the range of Rs. 3.5 Million
Although the initial investment is quite high compared with the earlier technology options
considered, it has the highest value addition to the waste material. As there is a growing
market for biomass based energy generation in industry, the future market for biomass
briquettes is guaranteed. Therefore, although the limitations in financial resource may not
support the selection of this option for the pilot implementation, promotion of the technology
is highly recommended.

57
References
[1] Sugathapala, A.G.T. (2009). Converting Waste Agricultural Biomass to a Fuel/
Resources in Moneragala District, Sri Lanka - 1st Progress Report. Project funded by
UNEP and coordinated by NCPC, October 2009.
[2] Chandak, S.P. (2009). Sustainable Assessment of Technologies: Making the Right
Choices. International Environmental Technology Centre DTIE, UNEP. Presented at
the 1st Stakeholder Consultative Workshop / Training Programme of the Project on
Converting Waste Agricultural Biomass to Fuel/Resources in Moneragala District, Sri
Lanka funded byUNEP and coordinated by NCPC, 21st August 2009.
[3] DTIE-UNEP. EST Assessment Methodology and Implementation - Training Kit
prepared for the support of the project on Environmental Management of the Iraqi
Marshlands. Funded by International Environmental Technology Centre (IETC)
DTIE, UNEP.
[4] Seresinhe, T., Marapana, R.A.U.J. and Weerasinghe, W.M.C.B. (2009). Report
submitted to NCPC under the Project on Converting Waste Biomass into
Energy/Material Resource: Panicum Maximum – Wild Guinea Grass. Department of
Animal Science, Faculty of Agriculture, University of Ruhuna, Sri Lanka, December
2009.
[5] Converting Waste Agricultural Biomass into a Resource-Compendium of
Technologies. Compiled by United Nations Environmental Programme (UNEP)
(http://cshd.dap.edu.ph/unep_biomass).
[6] Bhattacharya, S.C. and Abdul Salam, P. (2006). A Review of Selected Biomass
Energy Technologies: Gasification, Combustion, Carbonization and Densification. A
Publication of Asian Regional Research Programme in Energy, Environment and
Climate (ARRPEEC). Energy Field of Study, AIT, Thailand.
[7] Bhattacharya, S.C. Biomass Energy and Densification: A Global Review with
Emphasis on Developing Countries. Energy Program, AIT, Thailand.
58
[8] Grover, P.D. and Mishra, S.K. Biomass Briquetting: Technology and Practices. Field
Document No.46. FAO Regional Wood Energy Development Programme in Asia,
Bangkok, Thailand, April 1996.
[9] ISAT-GTZ. Biogas Digest. Volume I: Biogas Basics; Volume II: Biogas - Application
and Product Development; Volume III: Biogas - Costs and Benefits and Biogas –
Programme Implementation, GTZ project Information and Advisory Service on
Appropriate Technology (ISAT).
[10] FAO. System Approach to Biogas Technology. FAO/TCP/NEP/4415-T. Consolidated
Management Services Nepal.
[11] Sugathapala, A.G.T. (2007). Biomass Gasification in Sri Lanka. Asia Pacific Tech
Monitor. Vol. 24, No. 4, Jul-Aug 2007, pp 42-50.
[12] DPW (2005). The Conversion Technology Evaluation Report, developed by the
Alternative Technology Advisory Subcommittee of Solid Waste Management
Committee/ Integrated Waste Management Task Force of the County of Los Angeles
Department of Public Works (DPW). August 2005.
[13] Gadde M., Menke C., Siemers W. and Pipatmanomai S. Technologies for Energy
Use of Rice Straw: A Review. Publication of the Joint Graduate School of Energy and
Environment, King Mongkut’s University of Technology, Bangkok, Thailand.
[14] Miller D.C. (1983). Handbook of research design and social measurement. Longman
Inc, New York.
[15] Sugathapala A.G.T. and Amarasinghe A.D.U.S. (2002). Ranking of Biomass Energy
Technologies and Barriers. Final Report Submitted to Asian Institute of Technology.
Asian Regional Research Programme in Energy Environment and Climate Change –
Phase II (ARPEEC-II).
[16] Saaty T.L. (1999). Decision making for leaders. RWS Publications, Pittsburgh.

59
APPENDIX A: ESTIMATION OF THE GENERATION POTENTIAL WILD GUINEA GRASS IN MONERAGALA DISTRICT
A1: Background
During the initial stage of the project, the availability of wild guinea grass (Scientific name:
Panicam Maximum, local name: Ginihirassa) was identified. Though not considered for
detailed assessment, it was concluded that this resource could have considerable potential in
the future. The extent of the land and the available quantity of guinea grass are difficult to
predict as the source is sparsely distributed all over the land. However, based on the
responses from the local farmers, a rough estimation for the generation potential is obtained
based on effective area of extent equivalent to 15% of paddy land and yield of 20 t/ha/yr. The
results were reported in the first progress report, and the values are 3018 t/yr in Moneragala
DS division and 9370 t/yr in Buttala DS division. However, a more detailed study on the
topic has been carried out by a team of researchers, the results of which are used in this report
to update the data [4]. Following section is included to outline the findings of that study. The
estimations were based on the available statistics and information collected from Veterinary
surgeons, Grama Niladharis, and personnel from district secretariats.
A2: Methodology
The extent of wild guinea grass land is estimated based on the following factors:
- Land use pattern in the selected DS division (say Ai in ha, where i represents the land
category),
- Effective fraction of the land covered with wild guinea grass in each land category
(say αi).
Then the extent of land of wild guinea grass in each land category is given by αiAi with a total
land area of ΣαiAi.
The estimation of the quantity of wild guinea grass (at a specified moisture content) is based
on the average yield per ha per year and its initial moisture content. The annual production
potential of wild guinea grass in each DS division is given by ΣyαiAi, where y is the yield in
t/ha/yr at the specified moisture content.

60
A3: Data
It is assumed that a significant extent of wild guinea grass is found in two land categories:
Grassland and Open forest. The land use pattern in each DS division provides the data
presented in Table A1 on the extent of land in each of these two categories.
Table A1: Extend of grassland and open forests Land Area (ha) DS Division
Grassland Open Forest Buttala 352.74 8193.3 Moneragala 90.36 6927.73
In order to estimate the effective area of wild guinea grass growth, it is assumed that the
fraction of the land covered with wild guinea grass in grassland and open forest are 0.25 and
0.30, respectively.
The annual generation potential is estimated with an average yield on 8 dry t/ha/yr or 10
t/ha/yr with 20% moisture content (MC) on wet basis for bath types of land. Note that the
water content of fresh wild guinea grass is estimated to be 70% on wet basis in this study.
Therefore, the above value corresponds to the yield of fresh grass of about 26.7 t/ha/yr.
A4: Results
The estimated the effective growth area of wild guinea grass in each DS division is presented
in Table A2. Further, the annual generation potential is also presented.
Table A2: Extend of grassland and open forests Extend of Wild Guinea Grass (ha) Generation Potential (t/yr) DS Division
Grassland Open Forest Total Dry Matter @ 20% MC Buttala 88.19 2458.00 2546.18 20369.4 25,461.8 Moneragala 22.59 2078.32 2100.91 16807.3 21,009.1
Note that the annual generation potential of wild guinea grass estimated above is that presents
in the field. The total amount will not be available for future applications due to the following
facts:
- Part of this amount should be kept in the field to maintain the natural habitat.
- As the amount is generated in the field, there will be a limitation in accessibility.
- Already the grass is used as animal fodder, and should be allocated to that in future
too.

61
APPENDIX B: PRIORITATION OF CRITERIA FOR RANKING OF TECHNOLOGIES
B1: Analytical Hierarchical Process (AHP)
• Hierarchy System
AHP requires that a hierarchy system be formulated with objective or goal, criteria for
ranking (or factors) and the different options or alternatives (i.e. the technologies in this
study). Information will be collected by interviewing actors/stakeholders. The different steps
involved in AHP are: (a) State the problem/objective; (b) Identify the criteria that influence
the behaviour of the problem; (c) Structure a hierarchy of the criteria and alternatives, as
shown in Figure A1.
Figure B1: General structure of hierarchy system
• Formulation of the Problem/Objective
Objective(s)
The objectives in the present study are to rank the alternatives (i.e. technology options) for
conversion of biomass waste materials to energy / resources.
LEVEL 1
Problem/Objective
Ranking of
Technologies
LEVEL 2
Actors
Actor 1
Actor 2
Actor 3
Actor 4
LEVEL 3
Criteria
Criteria 1
Criteria 2
LEVEL 4
Alternatives
Alternative 1
Alternative 3
Alternative 2
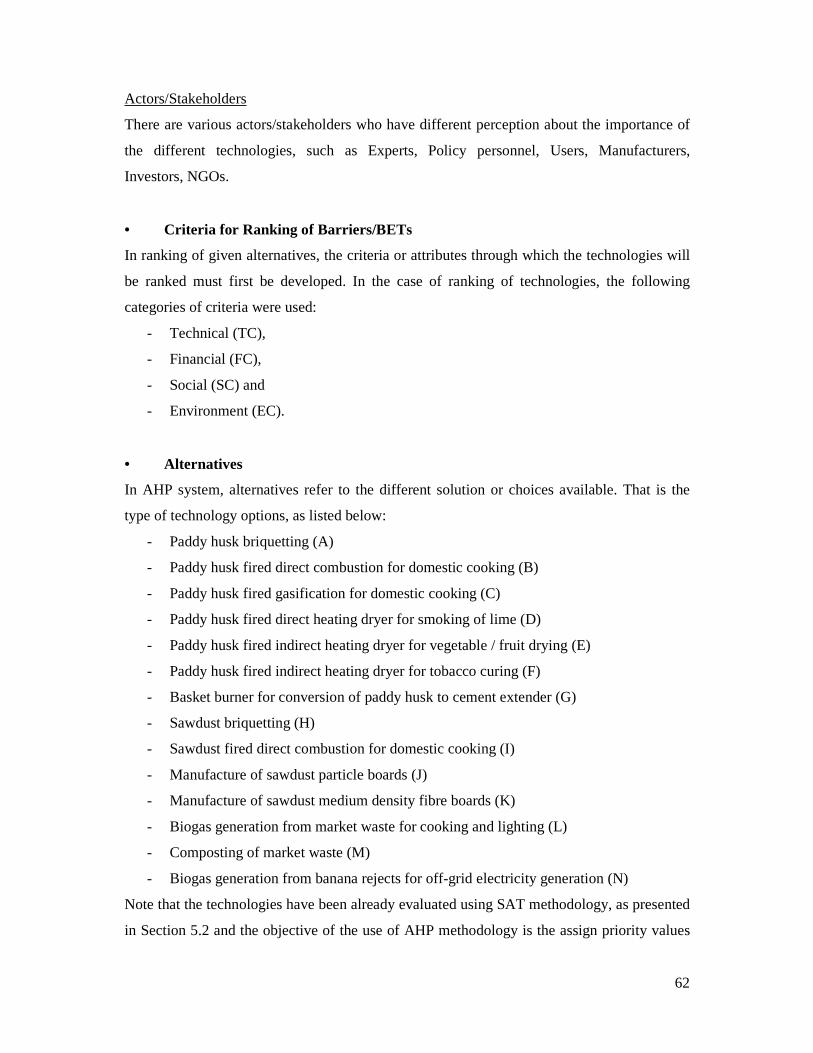
62
Actors/Stakeholders
There are various actors/stakeholders who have different perception about the importance of
the different technologies, such as Experts, Policy personnel, Users, Manufacturers,
Investors, NGOs.
• Criteria for Ranking of Barriers/BETs
In ranking of given alternatives, the criteria or attributes through which the technologies will
be ranked must first be developed. In the case of ranking of technologies, the following
categories of criteria were used:
- Technical (TC),
- Financial (FC),
- Social (SC) and
- Environment (EC).
• Alternatives
In AHP system, alternatives refer to the different solution or choices available. That is the
type of technology options, as listed below:
- Paddy husk briquetting (A)
- Paddy husk fired direct combustion for domestic cooking (B)
- Paddy husk fired gasification for domestic cooking (C)
- Paddy husk fired direct heating dryer for smoking of lime (D)
- Paddy husk fired indirect heating dryer for vegetable / fruit drying (E)
- Paddy husk fired indirect heating dryer for tobacco curing (F)
- Basket burner for conversion of paddy husk to cement extender (G)
- Sawdust briquetting (H)
- Sawdust fired direct combustion for domestic cooking (I)
- Manufacture of sawdust particle boards (J)
- Manufacture of sawdust medium density fibre boards (K)
- Biogas generation from market waste for cooking and lighting (L)
- Composting of market waste (M)
- Biogas generation from banana rejects for off-grid electricity generation (N)
Note that the technologies have been already evaluated using SAT methodology, as presented
in Section 5.2 and the objective of the use of AHP methodology is the assign priority values
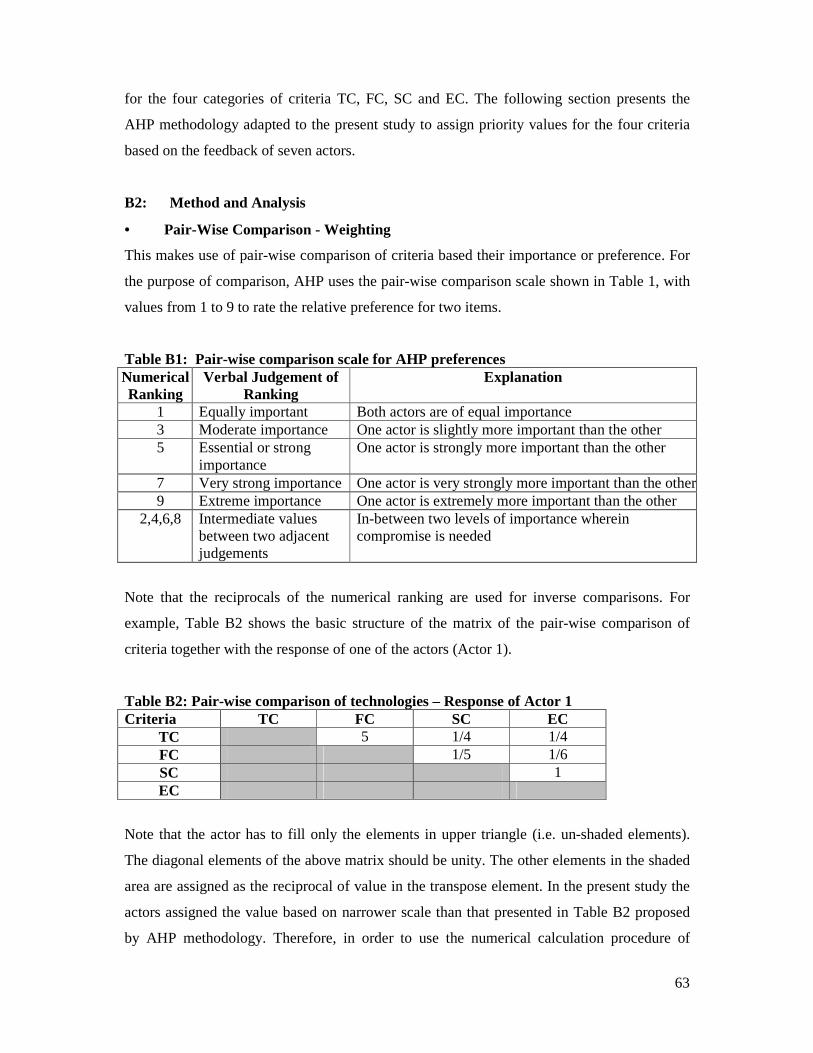
63
for the four categories of criteria TC, FC, SC and EC. The following section presents the
AHP methodology adapted to the present study to assign priority values for the four criteria
based on the feedback of seven actors.
B2: Method and Analysis
• Pair-Wise Comparison - Weighting
This makes use of pair-wise comparison of criteria based their importance or preference. For
the purpose of comparison, AHP uses the pair-wise comparison scale shown in Table 1, with
values from 1 to 9 to rate the relative preference for two items.
Table B1: Pair-wise comparison scale for AHP preferences Numerical Ranking
Verbal Judgement of Ranking
Explanation
1 Equally important Both actors are of equal importance 3 Moderate importance One actor is slightly more important than the other 5 Essential or strong
importance One actor is strongly more important than the other
7 Very strong importance One actor is very strongly more important than the other9 Extreme importance One actor is extremely more important than the other
2,4,6,8 Intermediate values between two adjacent judgements
In-between two levels of importance wherein compromise is needed
Note that the reciprocals of the numerical ranking are used for inverse comparisons. For
example, Table B2 shows the basic structure of the matrix of the pair-wise comparison of
criteria together with the response of one of the actors (Actor 1).
Table B2: Pair-wise comparison of technologies – Response of Actor 1 Criteria TC FC SC EC
TC 5 1/4 1/4 FC 1/5 1/6 SC 1 EC
Note that the actor has to fill only the elements in upper triangle (i.e. un-shaded elements).
The diagonal elements of the above matrix should be unity. The other elements in the shaded
area are assigned as the reciprocal of value in the transpose element. In the present study the
actors assigned the value based on narrower scale than that presented in Table B2 proposed
by AHP methodology. Therefore, in order to use the numerical calculation procedure of

64
AHP, the response of actors were converted into the AHP scale of 1 to 9 and the results
presented in Table B2 (and the entire analysis) are the revised values.
• Establishment of Priorities
Based on the pair-wise comparison scale, the priorities of the different criteria could be set. In
the present study, the following sets of priorities are to be formed:
- The priorities of the actors in terms of the overall objective,
- The priorities of the criteria to the actors,
- The priorities of the each alternative technology in terms of the each criterion.
Note that, as stated earlier, the priorities of the each alternative technology in terms of the
each criterion have been already set through the SAT methodology. Further, it is assumed
that the actors are equally important to the overall objective of the present study and therefore
given equal weights (or priority).
STEP 1: Preparation of pair-wise matrix from the response
Based on the response of the Actor 2 presented in Table B2 above, the pair-wise comparison
matrix could be completed, as given in Table B3. The last row gives the column sum, which
is used in the next step to normalize the matrix.
Table B3: Pair-wise matrix – Actor 1 Criteria TC FC SC EC
TC 1 5 1/4 1/4 FC 1/5 1 1/5 1/6 SC 4 5 1 1 EC 4 6 1 1
Column Sum 9.20 17.00 2.45 2.42
STEP 2: Preparation of normalized pair-wise matrix
The normalized pair-wise matrix is prepared from the pair-wise matrix, by dividing the each
element by the sum of the elements in the corresponding column, which is given in the last
row of Table B3. The result is shown in Figure B4. The priorities of the different criteria
according the response of Actor 1 is then calculated as the average of the row elements, as
given in the last column of Table B4. Note that the total of the priority values becomes unity.

65
Table B4: Normalized pair-wise matrix – Actor 1 Criteria TC FC SC EC Row ΣΣΣΣ/n
TC 0.11 0.29 0.10 0.10 0.152 FC 0.02 0.06 0.08 0.07 0.058 SC 0.43 0.29 0.41 0.41 0.388 EC 0.43 0.35 0.41 0.41 0.402
STEP 3: Calculation of overall priorities based on response all actors
The two steps could be repeated for each actor and the overall priority values were calculated
based on equal weight for all actors. The results are presented in Table B5, in which the last
column represents the overall priority values of the four categories of criteria. According to
the results, the economic criterion has the highest priority followed by technical criterion and
social. The least priority value is assigned for environment criterion. These values are used in
Section 5.3 for the ranking of alternative technologies in the SAT methodology.
Table B5: Priorities of different actors and overall priority values Estimated Priority Values based on Responses of Actors Criteria
Actor 1 Actor 2 Actor 3 Actor 4 Actor 5 Actor 6 Actor 7 Overall
Priority Value TC 0.152 0.291 0.408 0.282 0.202 0.220 0.308 0.266 FC 0.058 0.264 0.119 0.123 0.052 0.056 0.064 0.105 SC 0.388 0.127 0.177 0.129 0.182 0.194 0.119 0.188 EC 0.402 0.319 0.297 0.466 0.564 0.530 0.508 0.441
Prior to the use of response of the actors, it is important to check its validity in terms of
consistency of the pair-wise comparison responses. In AHP methodology, this is facilitated
by defining a parameter referred to as inconsistency ratio (IR), which is a ratio or percentage
of time the actor is inconsistent in making judgement on a set of particular elements.
Originally it was recommended that an IR of 0.10 or less is required to consider the result as
valid. Literatures, however, indicate than an IR of up to 0.20 is acceptable.
The inconsistency ratio IR is given by the expression
where λmax is the maximum eigen value of the pair-wise comparison matrix, n is the size of
the matrix (i.e. n = 4 in the present case), and p is a parameter that depends on n. For n = 4, p
= 0.9.
,1
1IR max
−−
=n
n
p
λ

66
Calculation of IR is demonstrated below based on the response of Actor 1 presented in Figure
B3. Here, two additional columns are added to present eigen values of the pair-wise matrix.
The elements of principal eigen vector are the geometric average of the corresponding raw
elements of the pair-wise matrix. The normalized eigen vector is derived by dividing the
principal eigen vector by its column sum.
Table B6: Pair-wise matrix and eigen vectors – Actor 1 Criteria TC FC SC EC Principal
Eigen Vector Normalized
Eigen Vector TC 1.000 5.000 0.250 0.250 0.748 0.139 FC 0.200 1.000 0.200 0.167 0.286 0.053 SC 4.000 5.000 1.000 1.000 2.115 0.394 EC 4.000 6.000 1.000 1.000 2.213 0.413
Column Sum 9.200 17.000 2.450 2.417
The maximum eigen value λmax is calculated as the product of the column sum vector [9.200
17.000 2.450 2.417] with the normalized eigen vector [0.139 0.053 0.394 0.413]T, and the
result is 4.153. Therefore the inconsistency ratio IR for Actor 1 becomes
As IR < 0.2, the response of Actor 1 could be considered as consistent. Similarly IR values
for the other actors could be estimated and the result is summarized in Table B7.
Table B7: Inconsistency ratio Actor Inconsistency Ratio - IR
Actor 1 0.057 Actor 2 0.233 Actor 3 0.057 Actor 4 0.194 Actor 5 0.064 Actor 6 0.071 Actor 7 0.010
It can be seen that, except for Actor 2, the responses are consistent.
.057.014
4153.4
9.0
1IR1 =
−−=