identification and characterization of proteins by mass...
TRANSCRIPT

Identification and characterization of proteins by mass spectrometric methods
Nisse Kalkkinen
Institute of Biotechnology, University of HelsinkiP.O.Box 65 (Viikinkaari 1)FIN-00014 University of Helsinki
www.biocenter.helsinki.fi/bi/proteinwww.biocenter.helsinki.fi/bi/protein

Needs for protein identification ancharacterization
- Purification of an unknown proteins and their structural characterization
- Confirmation the identity and quality of a producedrecombinant protein
- Identification and characterization for proteomicpurposes.

Methodology in protein chemistry and proteomics
- chromatography
- electrophoresis
- sequence analysis by Edman degradation
- mass spectrometry
- computational methods in result interpretation

Analytical methods for protein identification and characterization at Protein Chemistry laboratory/Bi
- Chromatography (normal-, narrow-, micro- and nanobore)
- Electrophoresis ( 1- and 2-dimensional PAGE, CE)
- Sequence analysis by Edman degradation
( ABI Procise 494A Sequencer)
- Mass spectrometry- MALDI-TOF/TOF( Bruker Ultraflex)
- multiprobe, reflector, TOF/TOF-Electrospray Q-Tof (Micromass Q-Tof )
- mainly used in nanospray mode

Mass spectrometry (MS):Analytical method for determination of the exact mass, or weight, of a molecule. Over the past fifteen years, mass spectrometry has emerged as a powerful research tool in the life sciences, which is mainly due to the development of the new, "soft" ionization techniques ESI and MALDI. Determines directly the identity, amount and structure of small molecules (like drug candidates and metabolites), as well as of large biomolecules (like proteins and DNA).
Mass spectrometers (MS):Devices for measuring the mass, or weight, of a molecule. Mass spectrometers employ an ionization source, which creates chargedmolecules, and a mass separation/detection component, which separates these charged molecules on the basis of mass, to detect their identity and quantity.
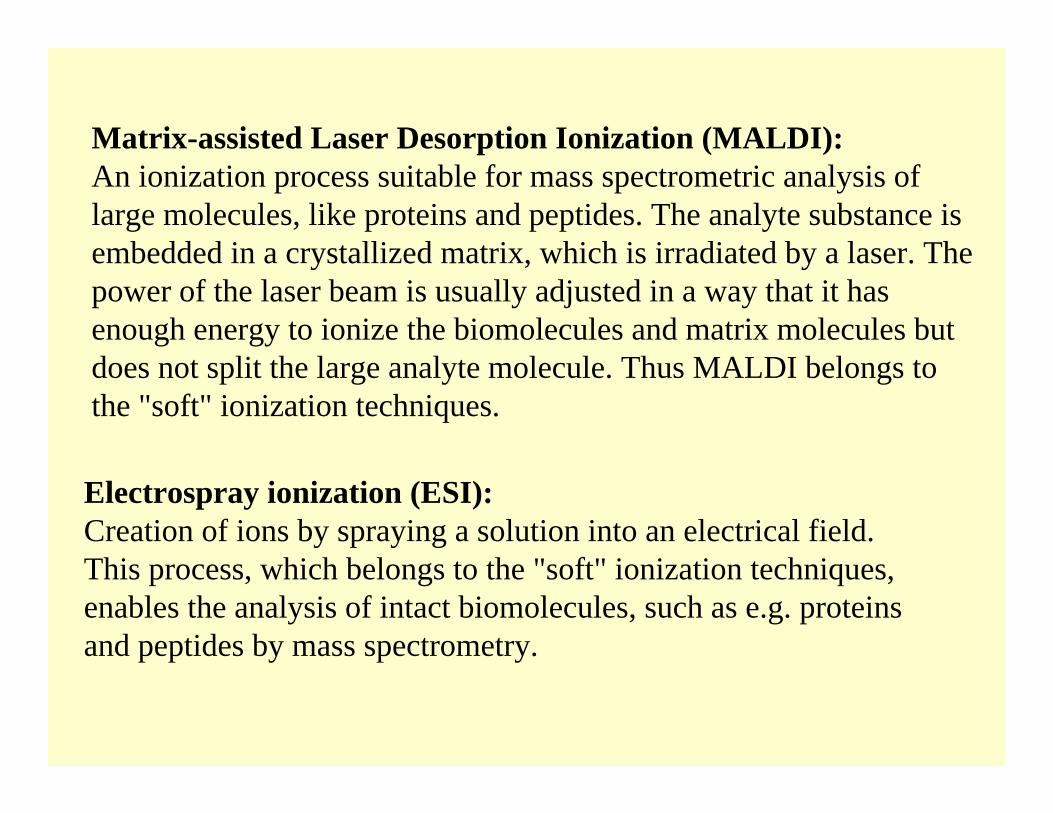
Matrix-assisted Laser Desorption Ionization (MALDI):An ionization process suitable for mass spectrometric analysis of large molecules, like proteins and peptides. The analyte substance is embedded in a crystallized matrix, which is irradiated by a laser. The power of the laser beam is usually adjusted in a way that it hasenough energy to ionize the biomolecules and matrix molecules but does not split the large analyte molecule. Thus MALDI belongs tothe "soft" ionization techniques.
Electrospray ionization (ESI):Creation of ions by spraying a solution into an electrical field. This process, which belongs to the "soft" ionization techniques,enables the analysis of intact biomolecules, such as e.g. proteins and peptides by mass spectrometry.
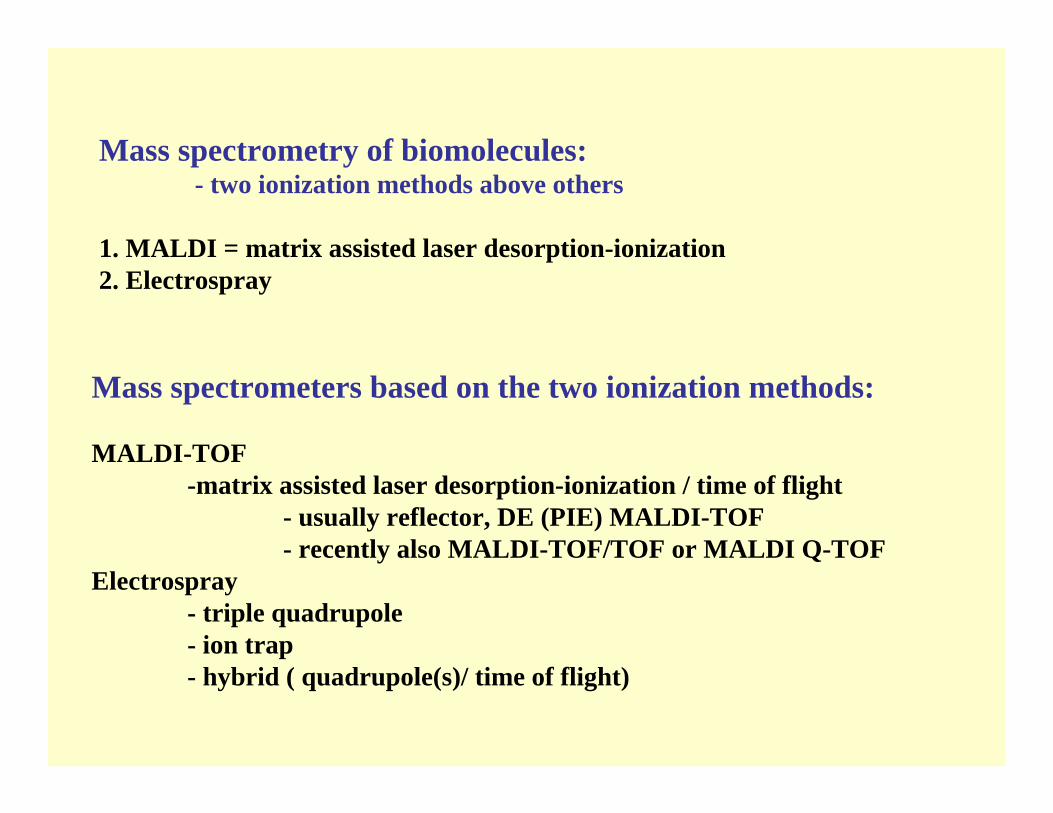
Mass spectrometry of biomolecules:- two ionization methods above others
1. MALDI = matrix assisted laser desorption-ionization2. Electrospray
Mass spectrometers based on the two ionization methods:
MALDI-TOF-matrix assisted laser desorption-ionization / time of flight
- usually reflector, DE (PIE) MALDI-TOF- recently also MALDI-TOF/TOF or MALDI Q-TOF
Electrospray- triple quadrupole- ion trap- hybrid ( quadrupole(s)/ time of flight)

Characterization and identification of proteins bymass-spectrometry
MALDI-TOF /(TOF) MS - intact proteins (characterization)- protein digests ( identification)
Electrospray Q-Tof MS - intact proteins (characterization)- protein digests ( identification)
- mainly LC/MS or LC/MS/MS

Schematic diagram of a linear MALDI-TOF mass spectrometer.Delayed extraction (pulsed ion extraction) occurrs at the ion source

Schematic diagram of a Reflector MALDI-TOF mass spectrometer.
MALDI-TOF = matrix assisted laser desorption/ionization-time of flight
N2 , 337nm

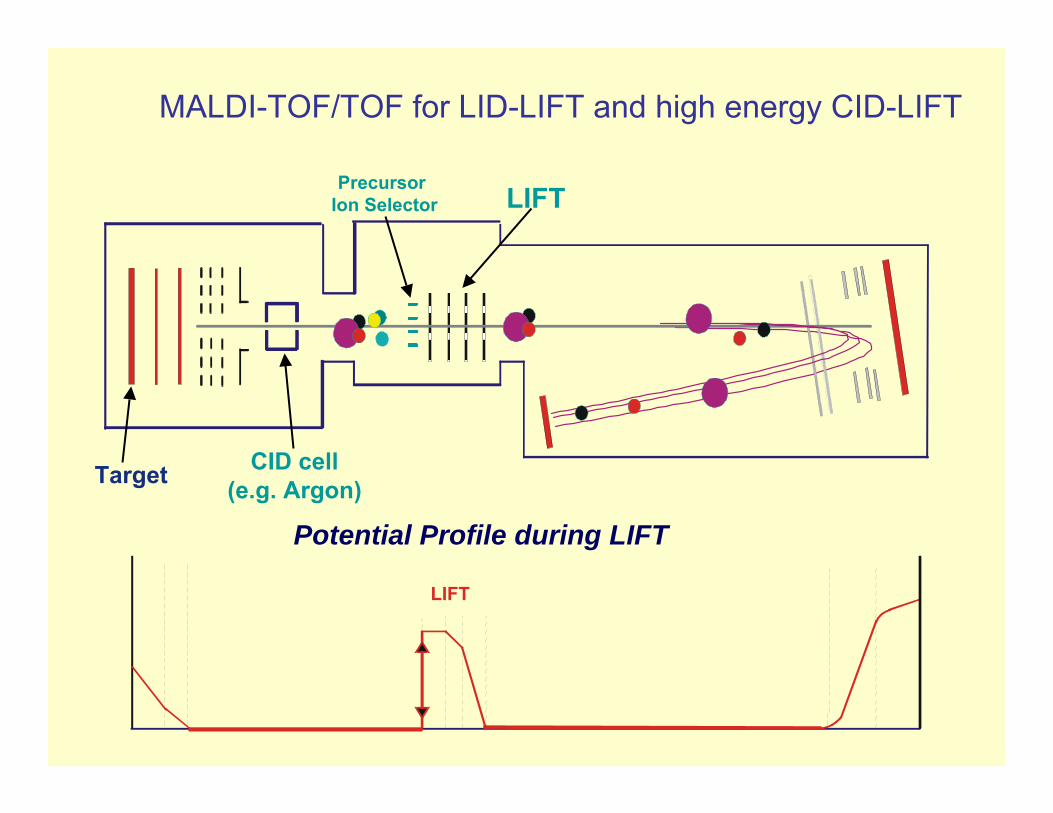
MALDI-TOF/TOF for LID-LIFT and high energy CID-LIFT
Target
LIFT Precursor Ion Selector
CID cell(e.g. Argon)
Potential Profile during LIFT
LIFT
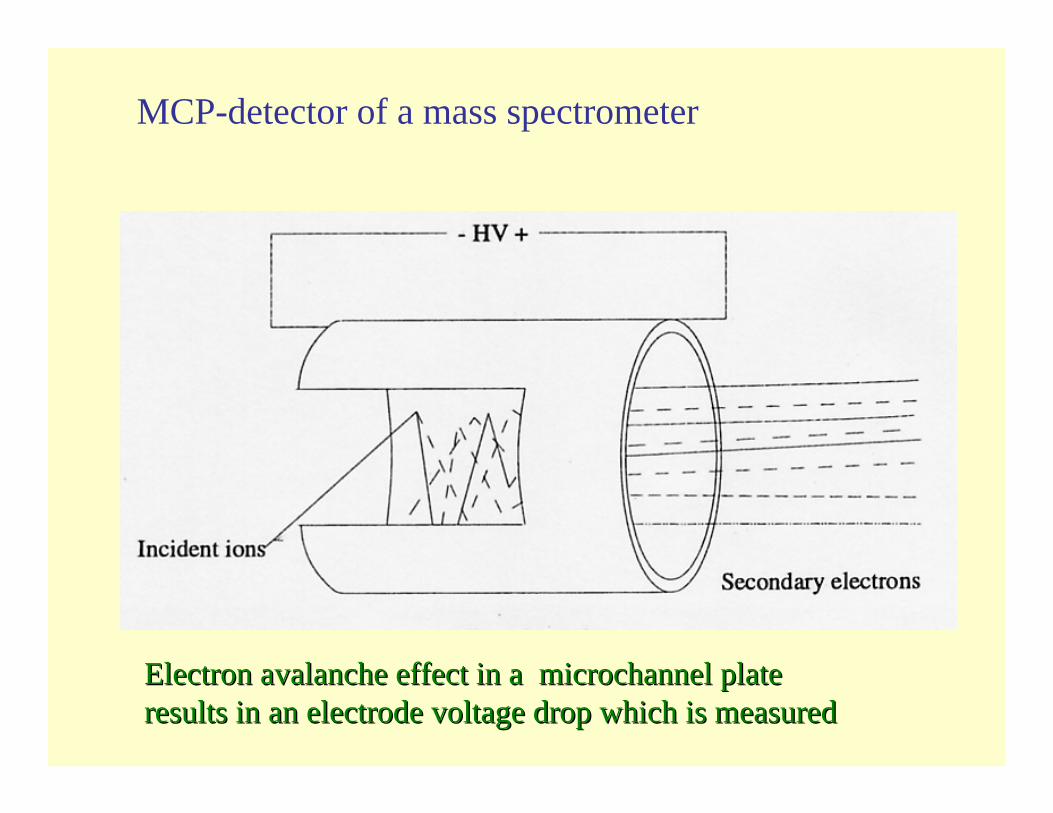
MCP-detector of a mass spectrometer
Electron avalanche effect in a microchannel plate Electron avalanche effect in a microchannel plate results in an electrode voltage drop which is measuredresults in an electrode voltage drop which is measured
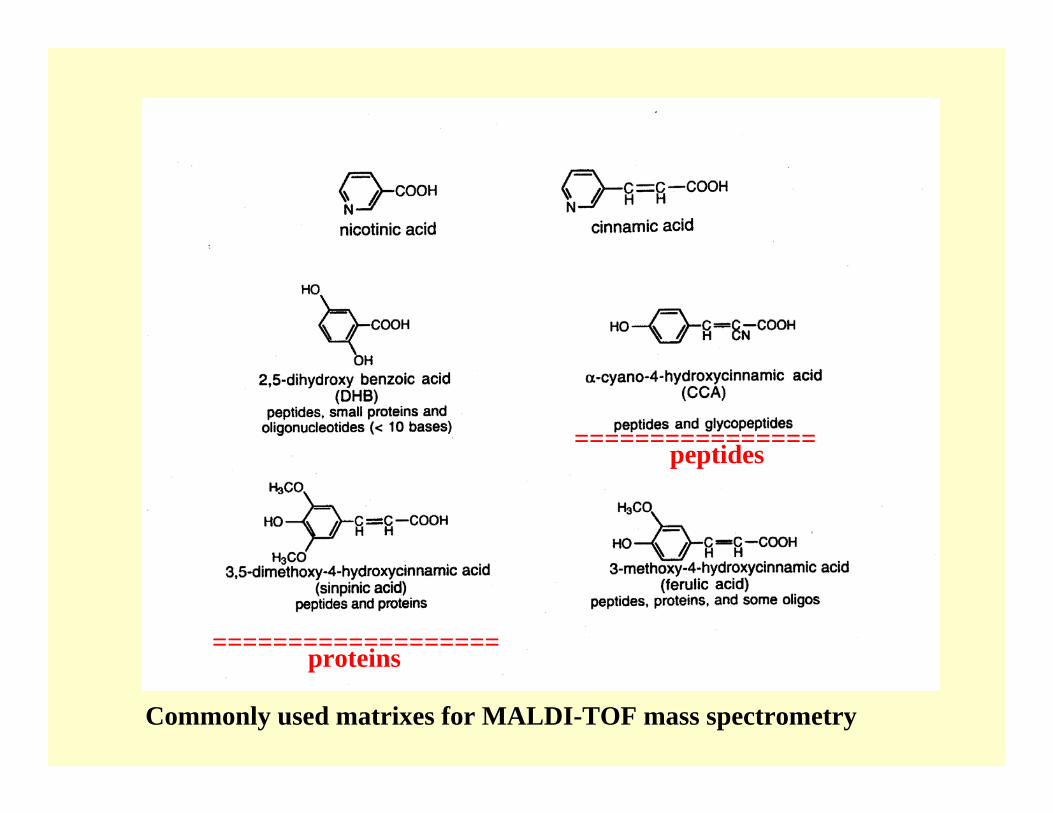
Commonly used matrixes for MALDI-TOF mass spectrometry
================peptides
=================== proteins

A 384 position MALDI-TOF sample target plate. To each position 0,5-1µl of sample together with matrix solution is pipetted and allowed to dry.

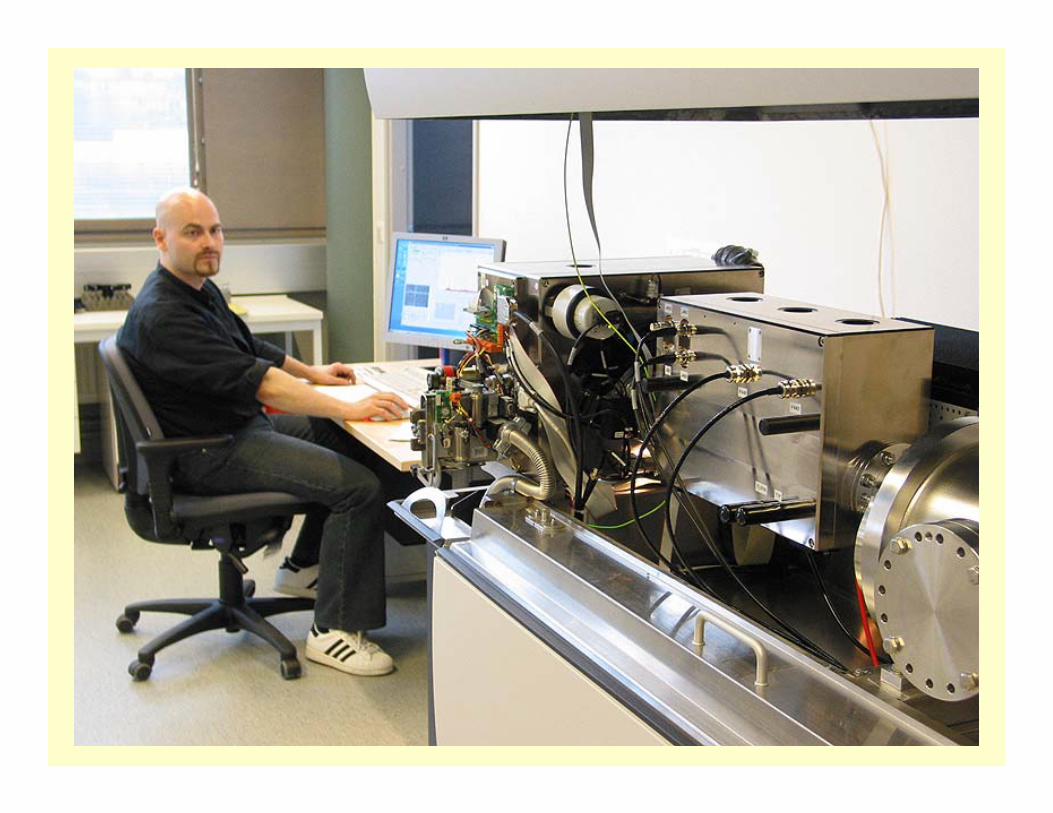
A MALDI-TOF MASS SPECTROMETER ( DE-REFLECTOR, Bruker-Daltonics)
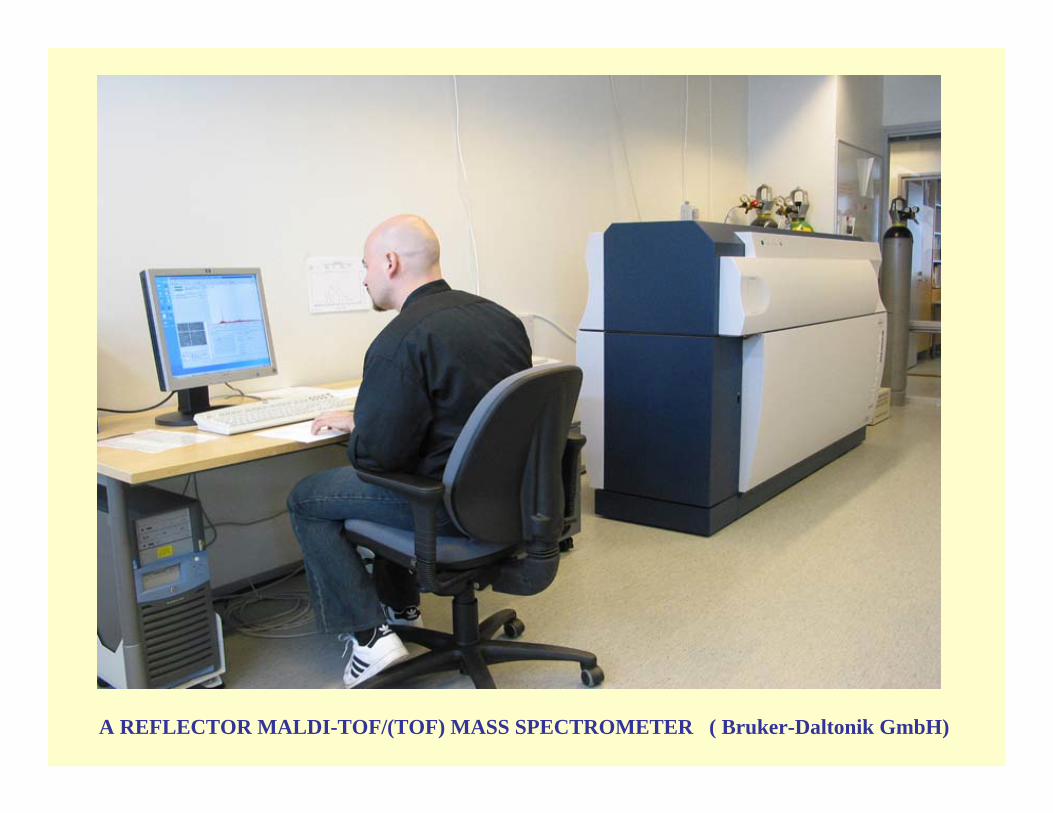
A REFLECTOR MALDI-TOF/(TOF) MASS SPECTROMETER ( Bruker-Daltonik GmbH)


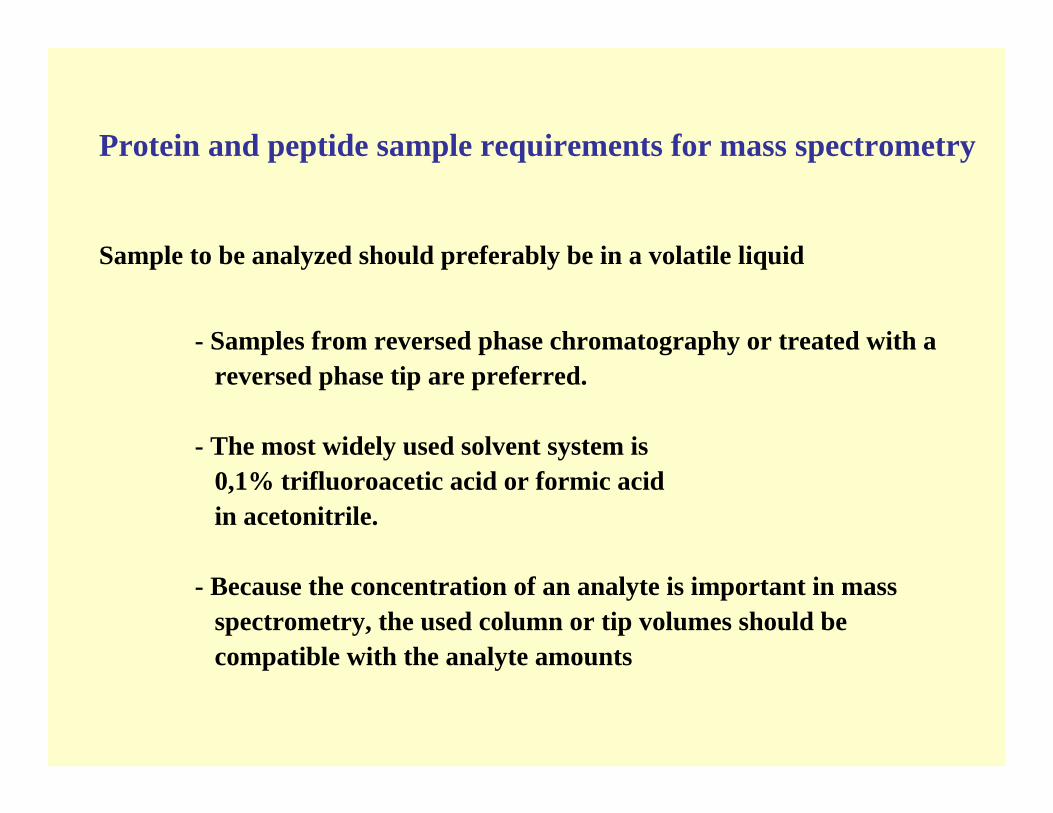
Protein and peptide sample requirements for mass spectrometry
Sample to be analyzed should preferably be in a volatile liquid
- Samples from reversed phase chromatography or treated with areversed phase tip are preferred.
- The most widely used solvent system is 0,1% trifluoroacetic acid or formic acid in acetonitrile.
- Because the concentration of an analyte is important in mass spectrometry, the used column or tip volumes should be compatible with the analyte amounts

Reversed phase chromatography of5ug of natural rubber latex allergenHev b5
Sample in:50mM Tris-Cl, pH 7.5, 250mM NaCl
Column: TSK TMS250 (C1) 0,2x2cm
Flow: 0,2 ml/min
Detection: 214 nm
A: 0,1% TFA in water
B: 0,075% TFA in acetonitrile
Gradient: 0-100%B in 60 min.

Sample pretreatment for mass spectrometry by reversedphase material packed in a pipette tip
Sample cleaning /desalting:
- Adsorb the sample to the tip inaqueous solution
- Wash the tip with e.g. 0,1% TFA
- Elute the sample with0,1% TFA in 50% ACN

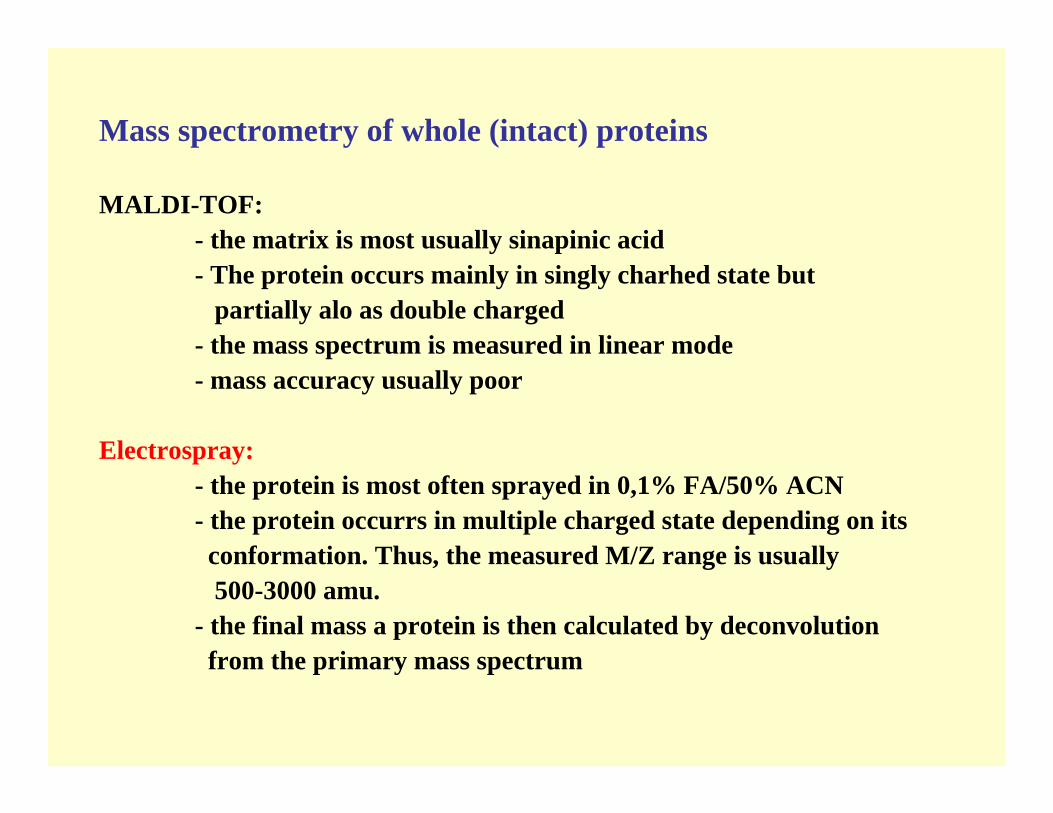
Mass spectrometry of whole (intact) proteins
MALDI-TOF:- the matrix is most usually sinapinic acid- The protein occurrs mainly in singly charhed state but
partially also as double charged- the mass spectrum is measured in linear mode - mass accuracy usually poor
Electrospray:- the protein is most often sprayed in 0,1% FA/50% ACN- the protein occurrs in multiple charged state depending on itsconformation. Thus, the measured M/Z range is usually 500-3000 amu.
- the final mass a protein is then calculated by deconvolution from the primary mass spectrum

MALDI ionization results in singly and doubly charged proteins

Linear MALDI-TOF spectrum of 5 pmol Hevb 5, a natural rubber latexallergen
Mass spectrometry of whole (intact) proteins
MALDI-TOF:- the matrix is most usually sinapinic acid- The protein occurs mainly in singly charhed state but
partially alo as double charged- the mass spectrum is measured in linear mode - mass accuracy usually poor
Electrospray:- the protein is most often sprayed in 0,1% FA/50% ACN- the protein occurrs in multiple charged state depending on itsconformation. Thus, the measured M/Z range is usually 500-3000 amu.
- the final mass a protein is then calculated by deconvolution from the primary mass spectrum

Electrospray of peptides in 0.1% FA /ACN from a 15 µm I.D. fused silica glass needle. The liquid flow is 200 nl/min and the needle has a potential of 2000V as compared to the cone inlet of the mass spectrometer.

Electrospray ionization:

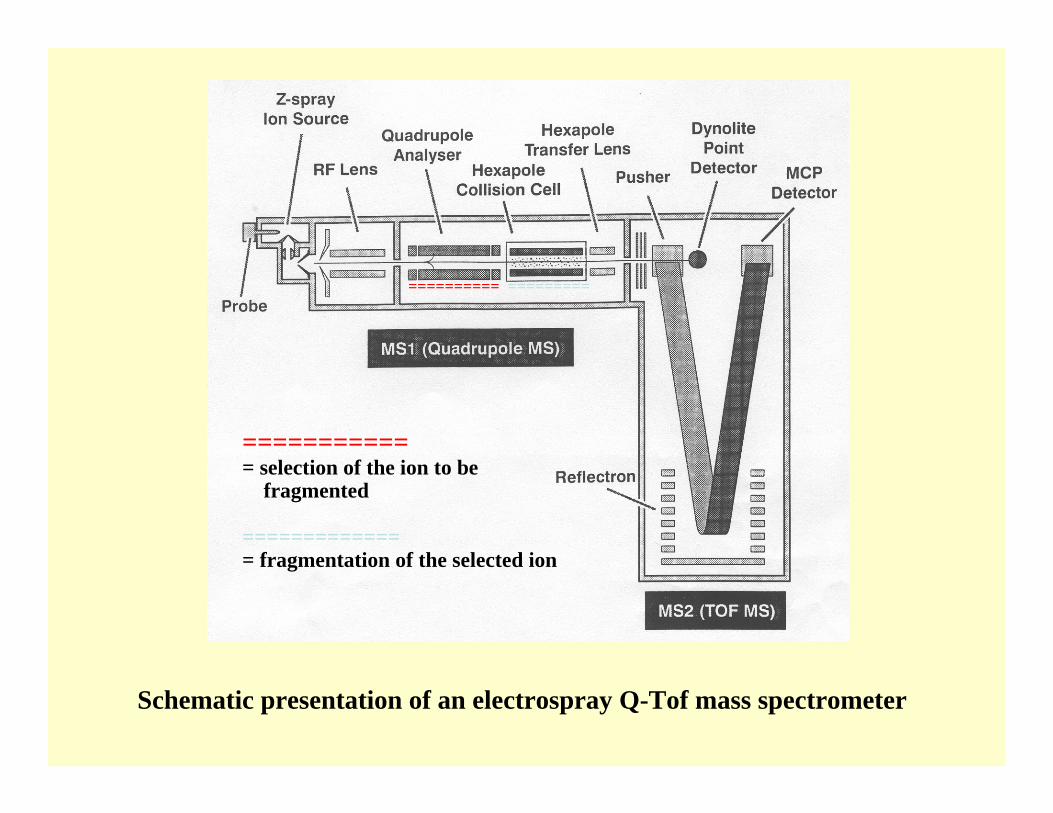
Schematic presentation of an electrospray Q-Tof mass spectrometer
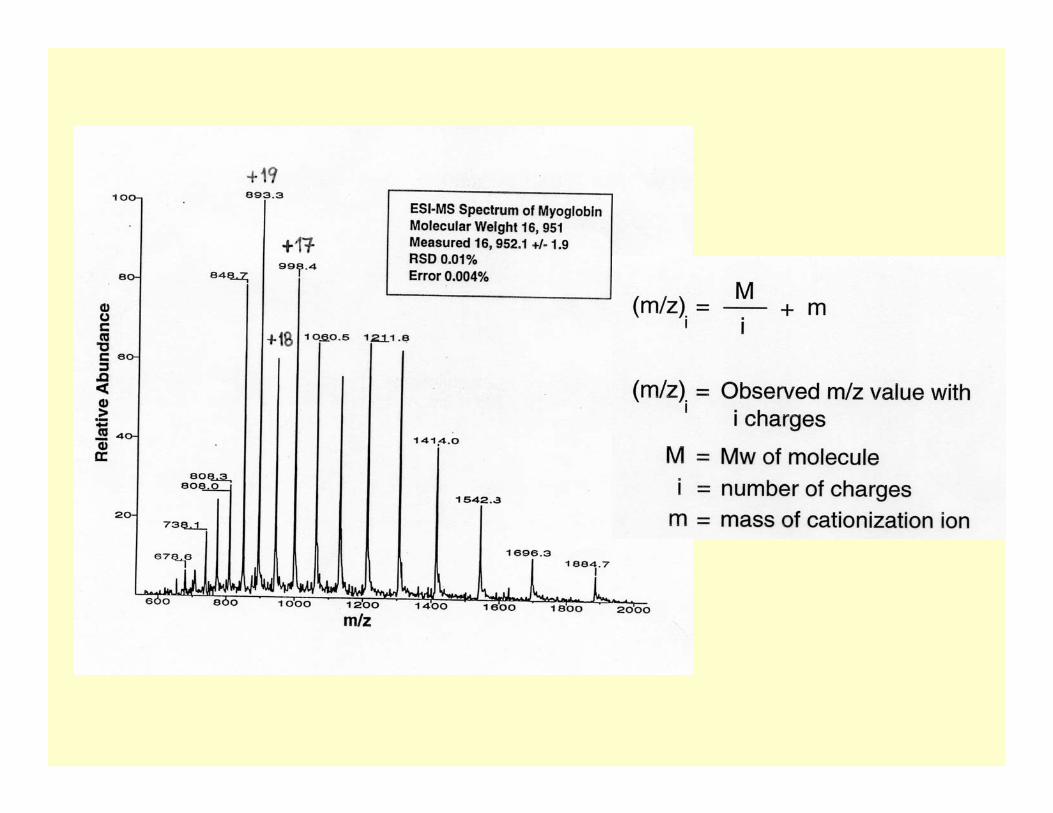

+20+19
+18
+17
+21+22
+16
+15
+14
+23
+24
+25

Deconvoluted electrospray mass spectrum of myoglobin

-- Expression proteomicsExpression proteomics- relative quantification of protein levels under different conditions
- upregulation, downregulation- difficult to correlate to gene expressionbecause protein turnover rates are differentand posttranslational modifications take place
-- PTMPTM--omics, modificatiomicsomics, modificatiomics- phosphorylation, sulfatation- glycosylation
-- Cell map proteomics, interactomicsCell map proteomics, interactomics- who interacts with whom, where and when (stoichiometry of protein complexes, subcellular distribution e.t.c)
IDENTIFICATION AND CHARACTERIZATION OF PROTEINS BY MASS SPECTROMETRIC METHODS FOR DIFFERENT PURPOSES
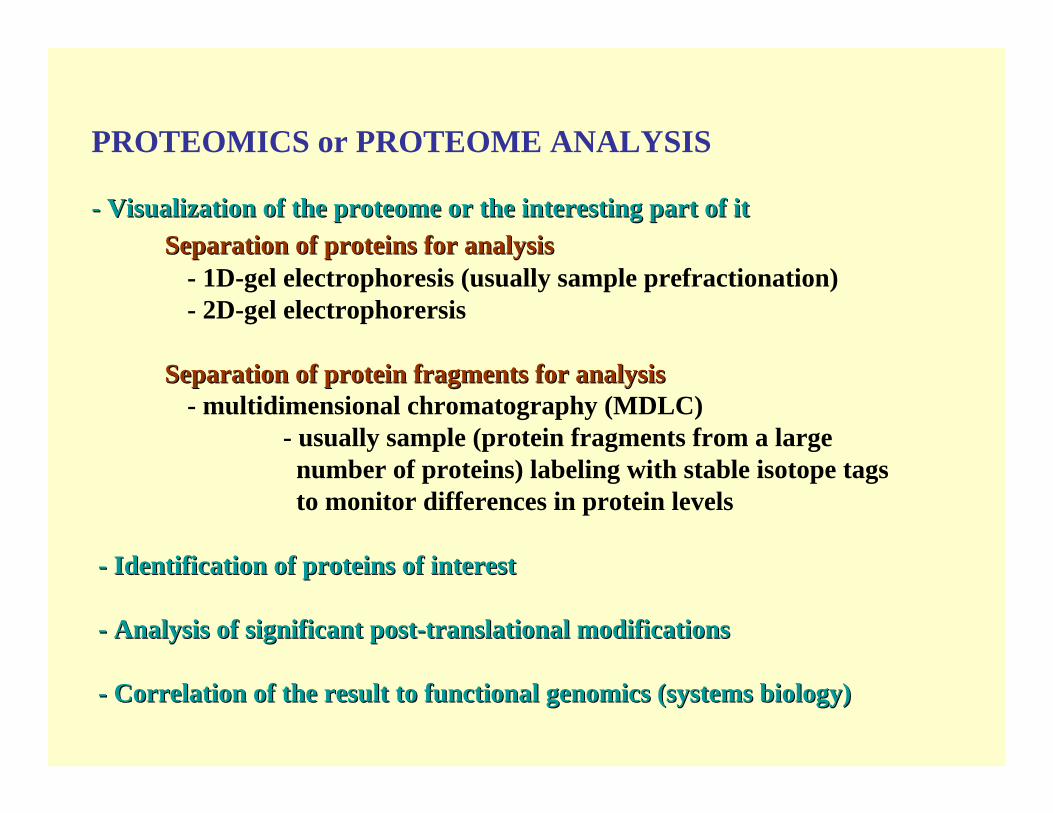
PROTEOMICS or PROTEOME ANALYSIS
-- Visualization of the proteome or the interesting part of itVisualization of the proteome or the interesting part of itSeparation of proteins for analysisSeparation of proteins for analysis
- 1D-gel electrophoresis (usually sample prefractionation)- 2D-gel electrophorersis
Separation of protein fragments for analysisSeparation of protein fragments for analysis- multidimensional chromatography (MDLC)
- usually sample (protein fragments from a large number of proteins) labeling with stable isotope tags to monitor differences in protein levels
-- Identification of proteins of interestIdentification of proteins of interest
-- Analysis of significant postAnalysis of significant post--translational modificationstranslational modifications
-- Correlation of the result to functional genomics (systems bioloCorrelation of the result to functional genomics (systems biology)gy)
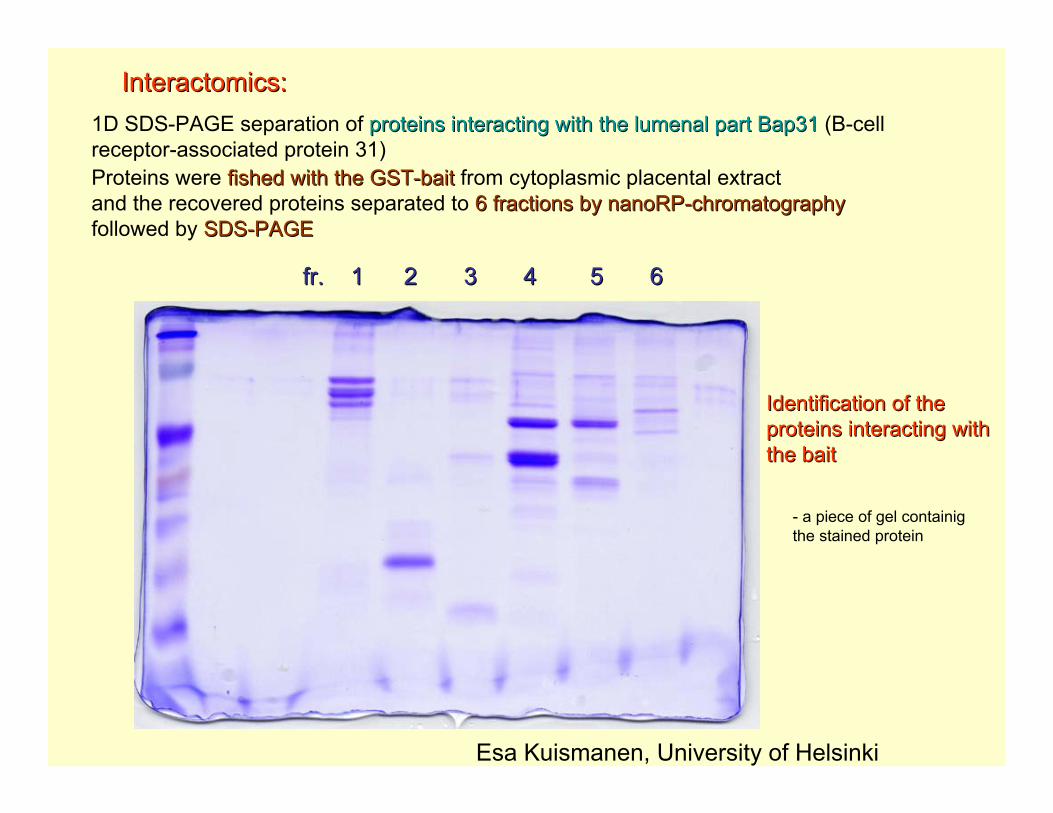
1D SDS-PAGE separation of proteins interacting with the lumenal part Bap31proteins interacting with the lumenal part Bap31 (B-cell receptor-associated protein 31)Proteins were fished with the GSTfished with the GST--baitbait from cytoplasmic placental extractand the recovered proteins separated to 6 fractions by nanoRP6 fractions by nanoRP--chromatographychromatographyfollowed by SDSSDS--PAGEPAGE
fr. 1 2 3 4 5 6fr. 1 2 3 4 5 6
Interactomics:Interactomics:
Esa Kuismanen, University of Helsinki
Identification of the Identification of the proteins interacting withproteins interacting withthe baitthe bait
- a piece of gel containigthe stained protein

VISUALIZATION AND QUANTITATION OF PROTEOME BY 2D-GEL ELECTROPHORESIS
- SolubilizationSolubilization of the sample to be analyzed
- Isoelectric focusingIsoelectric focusing on IPG-strips- IPGphor ( Pharmacia Biotech )- different pH gradients according to needs
- SDSSDS--PAGEPAGE- Protean II , 16cm x 16cm (BioRad)
- Staining Staining of the proteins- Coomassie Blue R250- silver staining- fluorescent staining
SYPRO Orange, Red, RubyCy2, Cy3, Cy5

- QuantificationationQuantificationation of the spots - scanning of the stained gel- analysis of the scanned image
Image Master 2D PlatinumPD-QuestDeCyder Differential Analysis Software
- finding of the spot(s) of interest
Shortcomings of 2D Gels !!- reproducibility (improvement: differential staining, a single gel- poor recovery of membrane proteins- limited pH and molecular weight range- sensitivity to low abundant proteins- laborous and time consuming- no direct on-line coupling with MS- automation difficult in general

Expression proteomics:SILVER STAINED 2D-PAGE PICTURE OF THE SOLUBLE PROTEIN EXTRACT
FROM Saccharomyces cerevisiae GROWN AEROBICALLY ON GLUCOSE (VTT)

QUANTIFICATION OF SELECTED PROTEIN SPOTS FROM THE 2D-PAGE PROTEIN PATTERN OF Sacchartomyces cerevisiae.
THE COLUMNS G1-G5 and X1-X5 REPRESENT CONDITIONS AS BEFORE

QUANTIFICATION OF ADH2 SPOTS FROM
2D-GELS OF YEAST (Saccharomyces cerevisiae)
RESPONDING TO CARBON SOURCE
GROWTH CONDITIONS:
G1 = aerobic glucose chemostat
G2 = 5min after switch off of oxygen
G3 = 30 min after switch off of oxygen
G4 = 60 min after switch off of oxygen
G5 = anaerobic glucose chemostat
X1 = aerobic xylose cultivation
X2 = 5 min after switch of of oxygen
X3 = 30 min after switch of of oxygen
X4 = 60 min after switch of of oxygen
X5 = anaerobic xylose cultivation
61,63

- alkylation and digestionalkylation and digestion of the protein band or spot “in gel”- reduction of the -S-S- by ditiothreitol- alkylation of -SH groups by iodoacetamide- digestion of the alkylated protein by trypsin
- extractionextraction of the generated peptides from the gel piece
- MALDIMALDI--TOF mass map (fingerprint) analysisTOF mass map (fingerprint) analysis of the peptide mixture- MALDIMALDI--TOF/TOF peptide fragment ion analysisTOF/TOF peptide fragment ion analysis of selected peptides
- LC/ESILC/ESI--MS/MS MS/MS de novode novo sequencingsequencing of part of the peptide extract- sequence tag for search among databases- sequence information also for other purposes
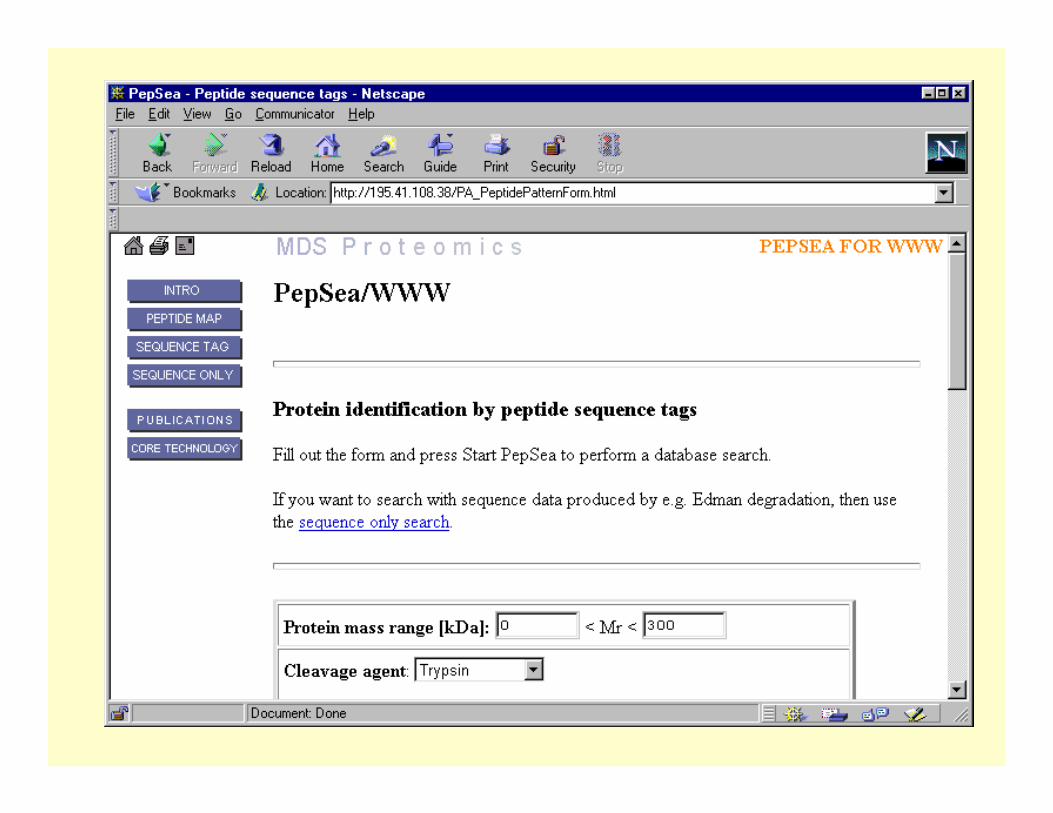
- Search of the proteinsSearch of the proteins among the existing databases usingsome of the existing search programs( see: e.g. http://www.expasy.ch/)
IDENTIFICATION OF THE PROTEINS OF INTEREST

SS
N
C
N
CAlkylation
K
R
KK
K
R
KRTrypsin
ReductionReduction (dithiothreitol), alkylationalkylation (iodoacetamide) and digestiondigestion (trypsin) of aprotein to form tryptic fragmentstryptic fragments. The reactions can be performed ”in gel” or ”in liquid”
”In-gel” or ”in liquid” digestion of a protein
intact protein
Reduction
alkylated protein tryptic fragments from the protein
”In gel” digestion: Shevchenko et al. Anal. Chem. 68, 850-858 (1996)

- A mass map (mass fingerprint) is a set of fragment masses obtained by digestion of a protein by a specific (usually enzymatic) reaction followed by direct mass spectrometric analysis of the resulting protein fragments
-The analysis is usually performed by MALDI-TOF/(TOF) mass spectrometry and the obtained mass spectrum can be considered as a fingerprint of the protein
- Protein identification is performed by using search programswhich compare the obtained results with the computergenerated mass maps for every protein in the databases
MASS MAP (MASS FINGERPRINT)

I37201 nuclear RNA helicaseI37201 nuclear RNA helicase
PAWS:PAWS:A computer program to calculate molecular masses of proteins and their fragments with different rules.
Known posttranslational modifications can be added.
The protein can be chemically or enzymatically cleaved in silico.
The molecular masses of the formed fragments are calculated.
The example:The example:
Nuclear RNA helicase sequence has been copy/pasted to PAWS where all cysteines have been alkylated with iodoacetamide and the alkylated protein cleaved with trypsin.
The monoisotopic masses of the formed theoretical peptides are listed

2D electrophoresis image of proteins from transgenic maus liverMarc Gimenez and Juhani Jänne, University of Kuopio
→
→
←1
2
4

SS
N
C
N
CAlkylation
K
R
KK
K
R
KRTrypsin
ReductionReduction (dithiothreitol), alkylationalkylation (iodoacetamide) and digestiondigestion (trypsin) of aprotein to form tryptic fragmentstryptic fragments. The reactions can be performed ”in gel” or ”in liquid”
”In-gel” or ”in liquid” digestion of a protein
intact protein
Reduction
alkylated protein tryptic fragments from the protein
”In gel” digestion: Shevchenko et al. Anal. Chem. 68, 850-858 (1996)

Sample pretreatment for mass spectrometry by reversedphase material packed in a pipette tip
Sample cleaning /desalting:
- Adsorb the sample to the tip inaqueous solution
- Wash the tip with e.g. 0,1% TFA
- Elute the sample with0,1% TFA in 50% ACN

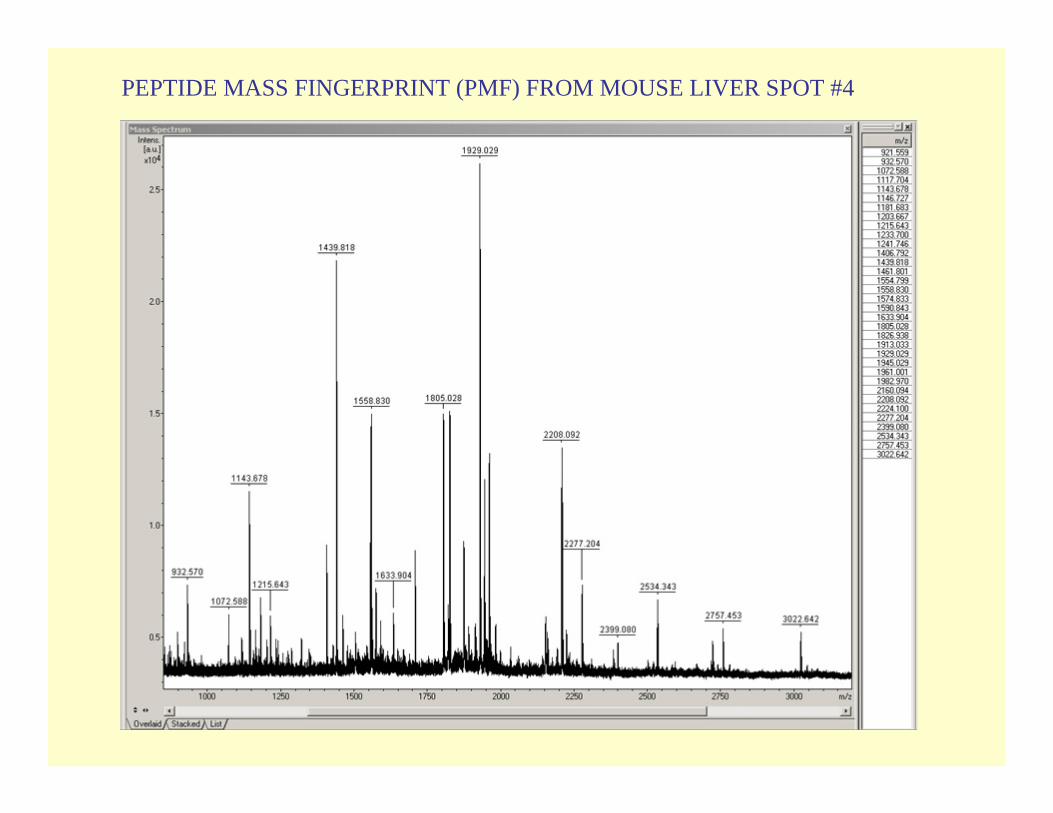
PEPTIDE MASS FINGERPRINT (PMF) FROM MOUSE LIVER SPOT #4

Gimenez spot 4


2D 2D -- PAGEPAGE
DifferentiatedDifferentiatedhuman Bhuman B--cellscells
Differentiation triggered by crosslinking of the B-cellreceptor whichinitiates cellsignallingcascades
IEF (nonlinear pH gradient)pI =3 pI = 10
Gel and topic by: Gel and topic by: Johanna Salonen and Mauno VihinenUniversity of Tampere
↑o
Spot # 133
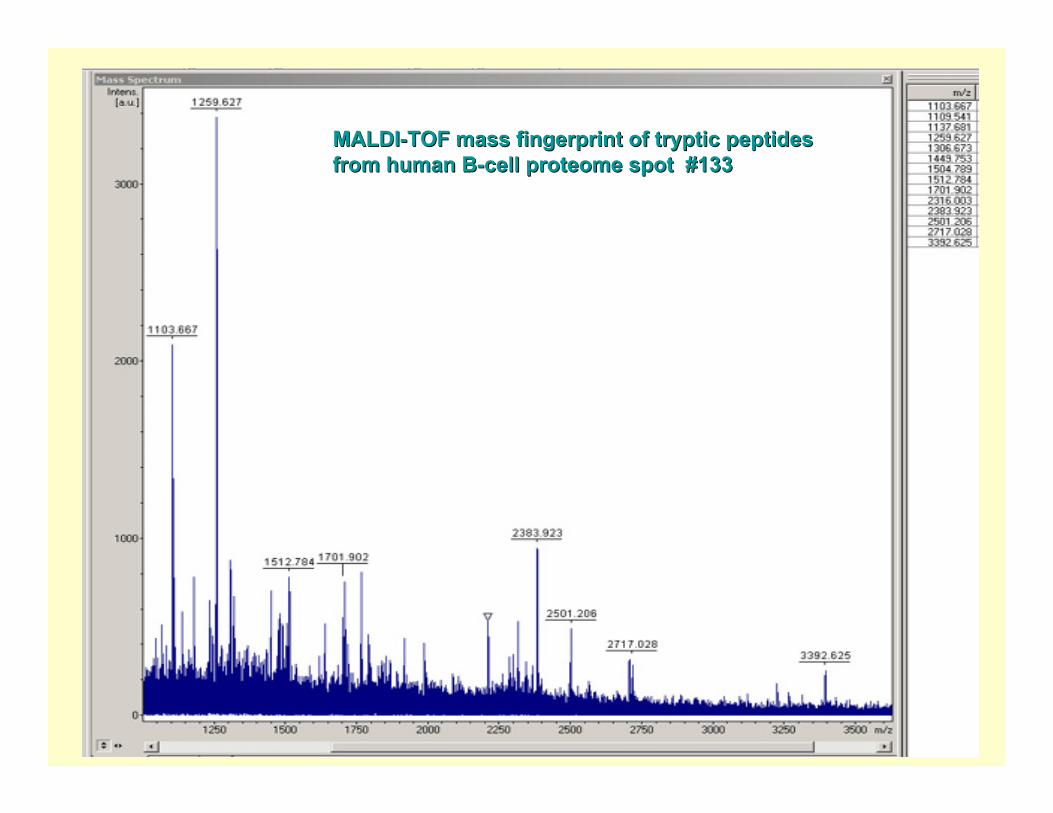
MALDIMALDI--TOF mass fingerprint of tryptic peptides TOF mass fingerprint of tryptic peptides from human Bfrom human B--cell proteome spot #133cell proteome spot #133

Isotopic distributionIsotopic distribution of the peptide with monoisotopic mass of 1259,627monoisotopic mass of 1259,627 from spot #133 from the B-cell proteome
1259,627 All C-atoms in the peptide molecule are C12
(monoisotopic mass)
1260,634 The peptide molecule contains one C13 atom
1261,611 The peptide molecule contains two C13 atoms
1262,618 The peptide molecule contains three C13 atoms


→

20 top score proteins from the Mascot 20 top score proteins from the Mascot search with peptide masses obtained from search with peptide masses obtained from spot #133 and the occurrance of the spot #133 and the occurrance of the obtained peptide masses in the listed obtained peptide masses in the listed proteinsproteins


Protein identification by MALDIProtein identification by MALDI--TOF/TOF tandem mass spectromety TOF/TOF tandem mass spectromety of selected peptides from the mass fingerprintof selected peptides from the mass fingerprint
← Peptide 1259,627 selected in the instrumentPeptide 1259,627 selected in the instrumentfor fragmentation (same sample as for the fingerprint)for fragmentation (same sample as for the fingerprint)
MALDI-TOF/TOF for LID-LIFT and high energy CID-LIFT
Target
LIFT Precursor Ion Selector
CID cell(e.g. Argon)
Potential Profile during LIFT
LIFT
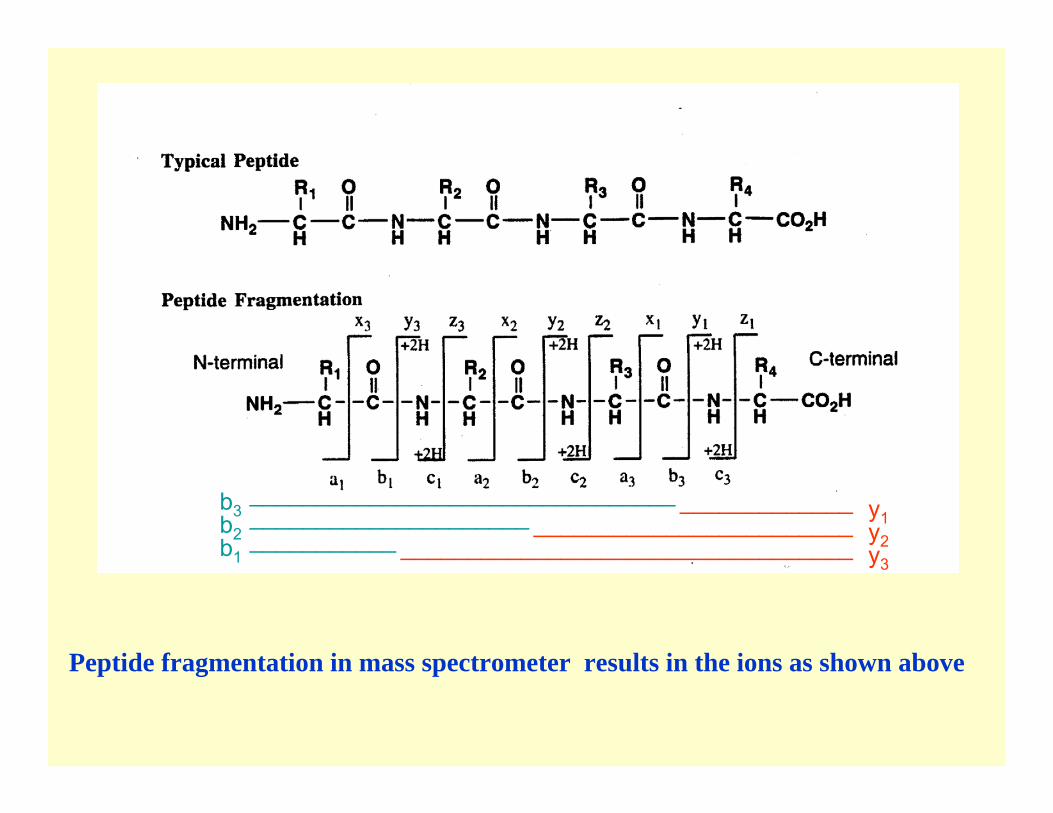
Peptide fragmentation in mass spectrometer results in the ions as shown above
_____________ ________________________
__________________________________
________________________________________________________________
b3b2b1
y1y2y3

Protein identification by MALDi-TOF/TOF peptide fragment analysis: A peptide from the digested spot #133 has been selected by the mass spectrometer, digested by laser energy (and CID) and the geenerated fragment masses analyzed.

Protein identification by fragment ions from one selected peptide using Mascot MS/MS Ion Search


Protein identification by sequence-tag analysis by electrosprayLC/ESI-MS/MS (peptide de novo sequencing)
- Starting material: usually an aliquot of the peptide mixture already subjected to mass mapping
- concentration and partial separation (LC) of the peptides beforespraying into the ESI- mass spectrometer
- fragmentation of selected peptides in the mass spectrometer to form a fragment ion ladder resulting in sequence information from the peptide:
- the molecular mass of the whole peptide- a partial sequence from the peptide- the position of the partial sequence
in the peptide
- identification of the protein by using search programs

AN ELECTROSPRAY Q-TOF MASS SPECTROMETER ( Micromass, LTD)
COUPLED TO A NANO-LIQUID CHROMATOGRAPH ( LC Packings)


Reversed phase separation of tryptic peptides on a 0.075 mm column
Sample: Tryptic peptides from about 2 pmol sample to be anlyzed
Column: 0.075 x 150 mm PepMap (C18, LC-Packings)
Gradient: Acetonitrile ( 0-40% in 50 min) in 0.1% formic acid
Flow rate: 0.2 µl/ min
Detection: 214 nmUsed exclusively for LCUsed exclusively for LC--MS/(MS) applicationsMS/(MS) applications
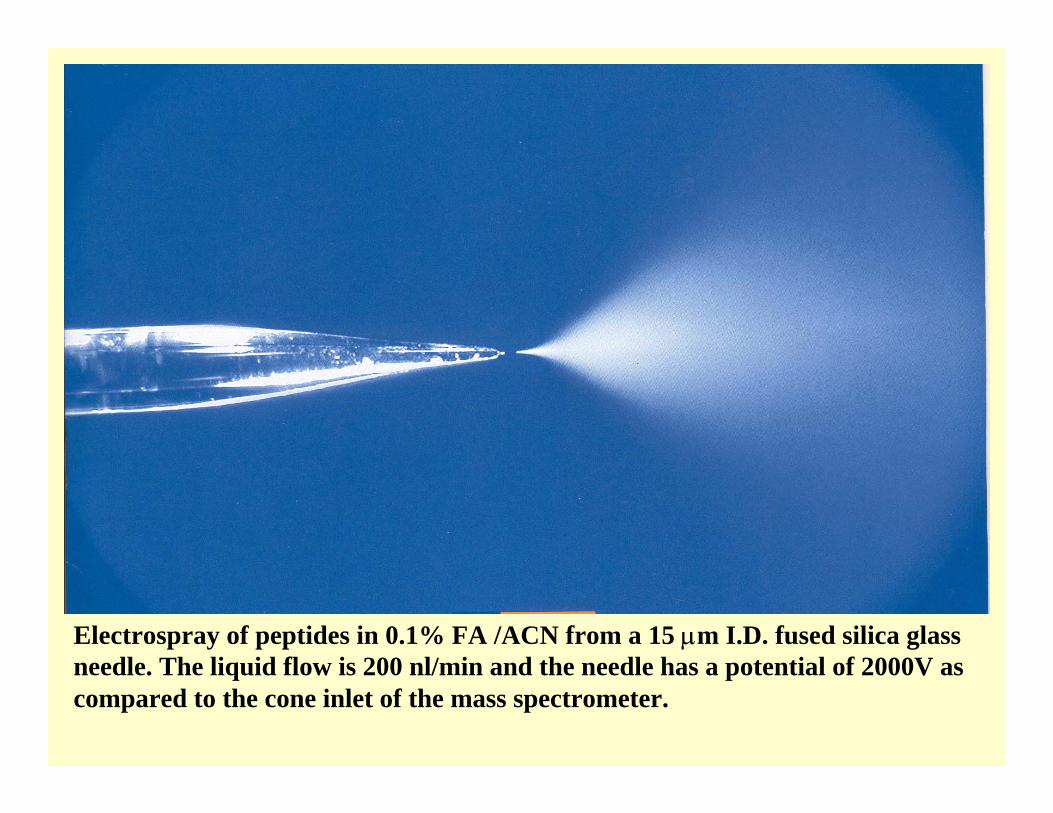
Electrospray of peptides in 0.1% FA /ACN from a 15 µm I.D. fused silica glass needle. The liquid flow is 200 nl/min and the needle has a potential of 2000V as compared to the cone inlet of the mass spectrometer.

THE ELECTROSPRAY INLET OF A Q-TOF MASS SPECTROMETER

A silver stained gel of solubilized proteins from Bacillus subtilis
2.

Schematic presentation of an electrospray Q-Tof mass spectrometer
========== =========
============ selection of the ion to be
fragmented
============== fragmentation of the selected ion
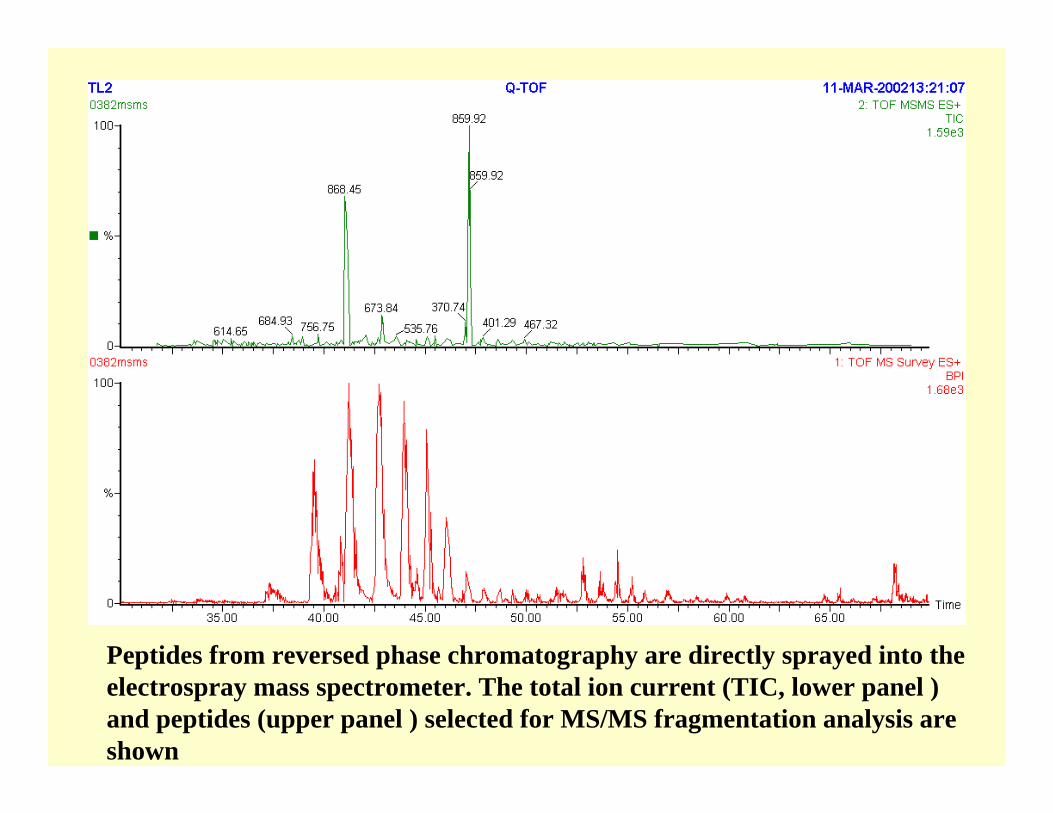
Peptides from reversed phase chromatography are directly sprayed into the electrospray mass spectrometer. The total ion current (TIC, lower panel ) and peptides (upper panel ) selected for MS/MS fragmentation analysis are shown

MW = 1734,88
Isotopic distribution of a doubly charged peptide selected for MS/MS analysis

Peptide fragmentation in electrospray MS/MS results in the fragment ions as shown above
_____________ ________________________
__________________________________
________________________________________________________________
b3b2b1
y1y2y3

The electrospray MS/MS spectrum obtained from one peptide (MW=1734,88)from the digest of the 2D-gel spot 2 From Bacillus subtilis

Sequence tag information used to identify protein spot 2.


Starting material: Starting material: Rather an “in liquid” purified protein than astained band from a gel (gel preselects theavailable fragments)
- acylation- proteolytic processing- protein phosphorylation or sulphatation
- radio-sequencing strategy- mass spectrometric approach (MALDI-TOF/TOF)and LC/ESI-MS/MS
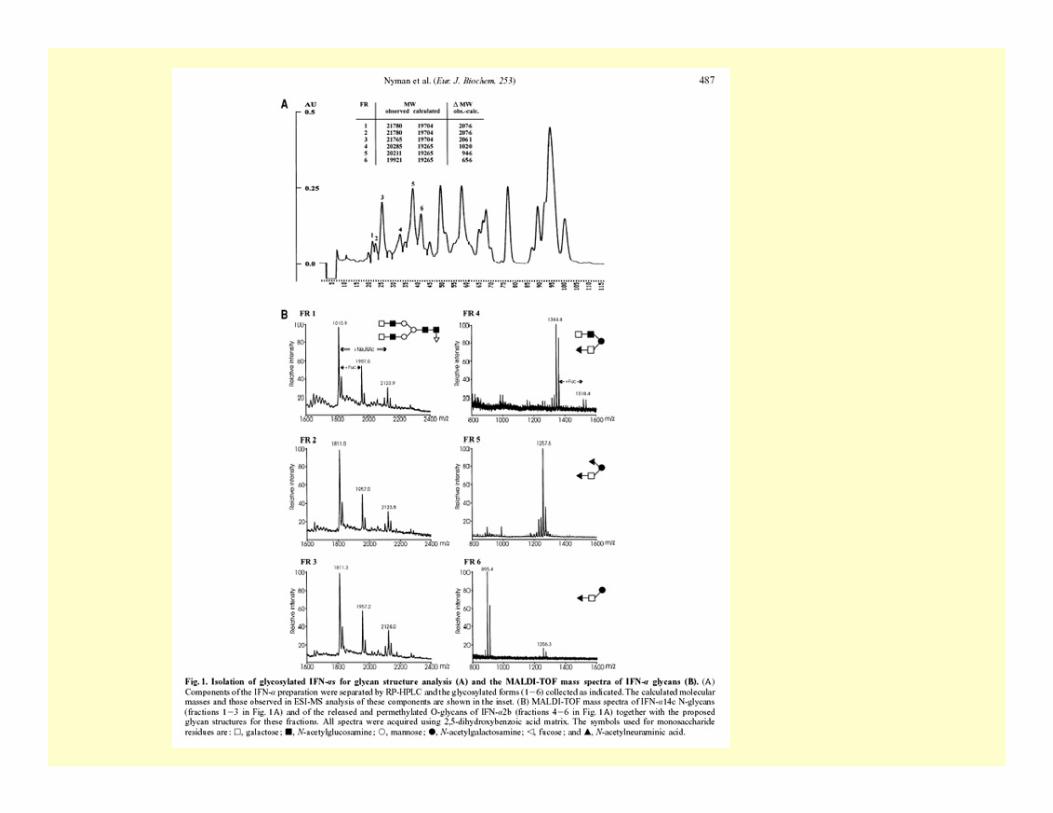
- glycosylation (site and type of)- carbohydrate profiling by MALDI-TOF/TOF- structural analysis by enzymatic digestion /MS
Analysis of post-translational modifications in proteins(PTM(PTM--omics, modifiomics ) omics, modifiomics )

Starting material: Starting material: Rather an “in liquid” purified protein than astained band from a gel (gel preselects theavailable fragments)
- acylation- proteolytic processing- protein phosphorylation or sulphatation
- radio-sequencing strategy- mass spectrometric approach (MALDI-TOF/TOF)and LC/ESI-MS/MS
- glycosylation (site and type of)- carbohydrate profiling by MALDI-TOF/TOF- structural analysis by enzymatic digestion /MS
Analysis of post-translational modifications in proteins(PTM(PTM--omics, modifiomics ) omics, modifiomics )


Acknowledgements:Protein Chemistry Research Unit and Core Facility:Institute of Biotechnology University of Helsinki
Elina AholaMarko HukkaAnnika KotovuoriAnne OlonenTero RiipiGunilla RönnholmJuho Lukkari
Nisse Kalkkinen