identification and characterization of novel nucleoid...
TRANSCRIPT

- 1
Doctoral Thesis
Identification and Characterization of Novel Nucleoid Protein
(NNP) in Anaerobic Growth Escherichia coli
Jun Teramoto
Graduate School, Hosei University
Division of Material Chemistry

- i
CONTENTS
CONTENTS......................................................................................................... I
SUMMARY...................................................................................................... 1
INTRODUCITON................................................................................................ 3
MATERIALS AND METHODS ............................................................................ 8
BACTERIAL STRAINS AND CULTURE CONDITIONS.................................................... 8
PLASMID CONSTRUCTION.................................................................................... 8
PURIFICATION OF NNP PROTEIN.......................................................................... 9
SELEX SEARCH FOR NNP-BINDING SEQUENCES ................................................11
GEL MOBILITY SHIFT ASSAY ............................................................................... 12
DNA PROTECTION ASSAYS AGAINST NUCLEASES................................................. 13
QUANTITATIVE IMMUNOBLOT ANALYSIS ............................................................... 14
INDIRECT IMMUNO-FLUORESCENCE MICROSCOPY ............................................... 15
AFM SAMPLE PREPARATION.............................................................................. 17
AFM IMAGING ................................................................................................. 18
RESULTS......................................................................................................... 19

- ii
ISOLATION OF NNP-BINDING SEQUENCES BY GENOMIC SELEX ........................... 19
TABLES......................................................................................................... 23
IDENTIFICATION OF NNP-BINDING ACTIVITY TO SELEX DNA FRAGMENTS: GEL-SHIFT
ASSAY............................................................................................................. 29
ANALYSIS OF YGIP-BINDING DNA SEQUENCES: DNASE-I FOOT-PRINTING ASSAY ... 32
INFLUENCE OF NNP ON THE NUCLEASE SENSITIVITY OF DNA: DNASE-I................ 37
INFLUENCE OF NNP ON THE NUCLEASE SENSITIVITY OF DNA: EXONUCLEASE III AND
S1 NUCLEASE.................................................................................................. 41
AFM ANALYSIS OF NNP-DNA COMPLEXES ........................................................ 46
INTRACELLULAR LEVEL OF NNP UNDER AEROBIC, HYPOXIC, AND ANAEROBIC
CONDITIONS .................................................................................................... 52
INTRACELLULAR LOCALIZATION OF NNP............................................................. 55
DISCUSSION................................................................................................... 59
ACKNOWLEDGMENTS................................................................................... 67
REFERENCES................................................................................................. 69
PUBLICATION LIST ......................................................................................... 75
- 1
SUMMARY
A systematic search for the regulation targets by YgiP, an
uncharacterized LysR-family transcription factor in E. coli, has been
performed using the genomic SELEX screening. A total of 333 independent
clones have been isolated from 126 different loci in the E. coli genome. No
consensus recognition sequence has been obtained after gel shift and
DNase-I foot-printing assays, implying that YgiP is a DNA-binding protein
with no sequence specificity as the major nucleoid proteins, HU and IHF.
One unique activity of NNP is marked enhancement of the sensitivity of
associated DNA to nucleolytic digestion. The intracellular level of NNP is
very low in E. coli cells grown under aerobic conditions, leaving it hitherto
unidentified as a nucleoid protein, but increased more than 100-fold as
high as those of HU and IHF under anaerobic culture conditions. Taken
together we propose that YgiP is a novel nucleoid protein (hence renamed
to NNP) in anaerobic growth E. coli. When fully induced, NNP is located not
only within the nucleoid but also in the cytoplasm as detected by indirect
immuno-fluorescent microscopy. To get more insight into the mechanism
- 2
of NNP-DNA interaction, we employed atomic force microscopy (AFM) to
directly investigate the structure of NNP-DNA complexes. In the presence
of saturated amounts of NNP, DNA was converted into a compact rod-like
conformation. Thus NNP may play a role of DNA compaction under
anaerobic growth conditions as does Dps in starved cells.
- 3
INTRODUCITON
The complete sequence of Escherichia coli genome has revealed the
presence of 4,452 protein-coding sequences shared between two laboratory
strains, MG1655 and W3110, of K-12 lineage (Riley et al., 2006). The function of
gene product has been experimentally determined or indicated for about half of
the genes, but a large number of genes are still left uncharacterized even though
E. coli has long been used as a model organism in the modern molecular biology.
One major research subject to make a breakthrough is the identification of
functions for all these uncharacterized genes. The difficulty is arisen from the
fact that most of these genes are not expressed under standard laboratory
culture conditions and thus may be needed for E. coli survival under stressful
conditions in nature.
In the E. coli genome, there are approximately 4,500 genes (Riley et al.,
2006), but only a part of the genes are expressed in a given culture condition.
The second subject of post-genome sequence era is to reveal the molecular
basis of regulation underlying expression of the whole set of genes on the E. coli
genome. The genome expression is under the control of a total of about 300

- 4
species of DNA-binding transcription factors (Perez-Rueda and Collado-Vides,
2000; Ishihama, 2000), which altogether determine the distribution of about
2,000 molecules of RNA polymerase within the genome (Ishihama, 1999: 2000).
Of a total of 300 transcriptiton factors, approximately 100 species belong to the
putative regulators that have been predicted, without experimental evidence, on
the basis of presence of DNA-binding and other protein motifs commonly
identified in the known transcription factors. The binding sites of E. coli
transcription factors are generally located within or near the promoters of target
genes or operons. For quick identification of the regulation target genes or
operons by these putative transcription factors, we have established the
genomic SELEX (systematic evolution of ligands by exponential enrichment)
screening system (Shimada et al., 2005) and have been successfully applied for
identification of the whole sets of genes under the control of some known or
unknown factors (Ogasawara et al., 2007a; 2007b; Shimada et al., 2007; Yang
et al., 2007). Once the consensus recognition sequence is predicted after
genomic SELEX screening, one can extend the search for other targets using
the information of whole genome sequence.
One of the putative regulators, YgiP, belongs to the LysR-type

- 5
transcriptional factor family based on its protein sequence. The LysR-type
regulators are the most abundant transcription factor family in E. coli (Ishihama,
2007), and are present in diverse bacterial genera, archaea and algal
chloroplasts and involved in extremely diverse cellular functions including
nitrogen fixation, oxidative stress response and bacterial virulence (Schell, 1993).
LysR family proteins are generally composed of an N-terminal helix-turn-helix
motif, but no consensus sequence has been identified for the DNA-binding
sequences among LysR family members. In this study, a systematic search for
the YgiP-binding sequences has been performed by using the genomic SELEX
system (Shimada et al., 2005). After SELEX screening, we have obtained a
number of different YgiP-binding sequences from a number of loci within the E.
coli genome, but failed to identify the consensus sequence of YgiP binding. Gel
mobility shift and DNase-I foot-printing assays indicated that YgiP is rather
similar to the major nucleoid proteins, HU and IHF, with non-specific DNA
binding activity. However, one significant difference was its marked activity of
enhancing the sensitivity of probe DNA to nucleolytic digestion. The intracellular
level of YgiP is very low in E. coli cells grown under regular aerobic conditions,
leaving YgiP unidentified as a nucleoid protein (Azam and Ishihama, 1999;

- 6
Azam et al., 2000; Ishihama, 2007). Under hypoxic or anaerobic culture
conditions, however, the YgiP level increased more than 100-fold, reaching to
the concentration as high as those of HU and IHF. As in the case of HU and IHF,
YgiP showed a uniform distribution within the entire nucleoid, but under fully
induced state, it also exists in the cytoplasm. Besides, we approached to
elucidate a single-molecule imaging technique (Atomic Force Microscopy: AFM)
(Hansma et al., 1988; Takeyasu et al., 2004; Morikawa et al., 2006) to directly
visualize a single molecule of YgiP-DNA interaction. The result from gel mobility
shift assay and DNase-I foot-printing assays in in vtro, YgiP have indicated
nucleoid protein like diagnostic behavior. Imaging and analyses of DNA-YgiP
complexes at the single molecule level can reveal conformational changes which
are concentration-dependent condensation of DNA by YgiP. The conformational
change has two structural formations, low molecules of YgiP have bond to DNA,
and high molecules of one have formed compaction of DNA. Taken all the
observations together, we will propose that YgiP is a hitherto unidentified
nucleoid protein in E. coli under anaerobic growth conditions, and thus propose
to rename it to NNP (novel nucleoid protein). During the preparation of this report,
Oshima and Biville (2006) reported, based on the location of the ygiP gene, that

- 7
YgiP regulates the expression of neighboring ttdA-ttdB-ygiE operon. The major
nucleoid proteins, HU, IHF, H-NS and Fis, in exponential growth phase E. coli
under aerobic conditions are all known to have functional dichotomy (Ishihama,
2007). Likewise NNP appears to play dual roles, i.e., an architectural role and a
global regulator of transcription.

- 8
MATERIALS AND METHODS
Bacterial strains and culture conditions
The E. coli strains used in this work were: KP7600 (W3110 typeA lacIq
lacZ ΔM15 galK2 galK22) and JD24074, KP7600 nnp, which was constructed by
a transposon insertion method (a gift from T. Miki). Cells were grown at 37℃ in
Luria-Bertani (LB) or M9-0.4% glucose medium. Overnight culture in LB medium
was diluted 1000-fold into fresh LB or M9 medium. For the aerobic culture, the
incubation was carried out at 37OC with a constant sharking to an appropriate
cell density. The cell density was determined by measuring the absorbance at
600 nm. For hypoxic culture, bacteria were suspended in 15 ml centrifuge tubes
with silicone stoppers to make the initial cell density of 0.1 OD600 and anoxia was
achieved to expel any remaining air by chemical duty pump (Millipore) for 60 min.
Cell culture was kept standing at 37OC without shaking.
Plasmid construction

- 9
The promoter assay vector TFP carries two types of fluorescent protein
genes, one for red fluorescent protein (RFP) under the control of reference
promoter lacUV5 and the other for green fluorescent protein (GFP) under the
control of a test promoter (Makinoshima et al., 2002; Shimada et al., 2004). The
SELEX fragment containing ygiP-ttdA sequence upstream from the initiation
codon of ygiP was amplified by PCR using the genomic DNA from E. coli
KP7600 as a template and a pair of primers, H021S (5’-GGCCAGCTATTATGC
ATCGTTAATT-3’) and H021T (5’-GCTTTTTGCAAGATCTCGAACATCG-3’).
These primers contain EcoT22I, BglⅡ sites suitable for cloning into vector pGRP
at the initiation codon of the GFP coding frame. The PCR products were
digested with restriction enzymes and the ligated into the EcoT22I and BglⅡ
sites of TFP. The sequences of the inserted promoter and junction with GFP
coding frame were confirmed by sequencing. The plasmids thus constructed
were named pGRH021. For the construction of plasmid was used AFM analysis.
Purification of NNP protein
For construction of plasmid pNNP for NNP expression, a DNA fragment

- 10
corresponding to the NNP-coding region was amplified by PCR using E. coli
W3110 genome DNA as a template and a pair of primers, which were designed
so as to hybridize upstream or downstream of the NNP-coding sequence. After
digestion with NdeI and NotI, PCP products were cloned into pET21a(+)
(Novagen) between NdeI and NotI sites. The plasmid construct was confirmed
by DNA sequencing. For protein expression, the pNNP plasmid was transformed
into E. coli BL21 (DE3). Transformants were grown in 200 ml of LB medium and
at the cell density of 0.6 at 600 nm, IPTG was added at the final concentration of
1 mM. After 3 hr incubation, cells were harvested by centrifugation, washed with
a lysis buffer (50 mM Tris-HCl, pH 8.0 at 4OC, and 100 mM NaCl), and then
stored at -80 OC until use.
For protein purification, frozen cells were suspended in 3 ml of lysis
buffer containing 100 mM PMSF. Cells were treated with lysozyme and then
subjected to sonication for cell disruption. After centrifugation at 15,000 rpm for
20 min at 4 OC, the resulting supernatant was mixed with 2 ml of 50% Ni-NTA
agarose solution (Qiagen) and loaded onto a column. After washing with 10 ml of
lysis buffer, the column was washed with 10 ml of washing buffer (50 mM
Tris-HCl, pH 8.0 at 4 OC, and 100 mM NaCl), and then 10 ml of washing buffer

- 11
containing 10 mM imidazole. Proteins were then eluted with 2 ml of an elution
buffer (lysis buffer plus 200 mM imidazole), and peak fractions were pooled and
dialyzed against a storage buffer (50 mM Tris-HCl, pH 7.6 at 4 OC, 200 mM KCl,
10 mM MgCl2, 0.1 mM EDTA, 1 mM DTT, and 50% glycerol), and stored at -80
OC until use. Protein purity was checked on SDS-PAGE.
SELEX search for NNP-binding sequences
The genomic SELEX screening was performed as described previously
(Shimada et al., 2005). In brief, genome DNA of E. coli W3110 was sonicated to
generate fragments of 150 to 300 bp in length. The E. coli DNA library was
constructed after cloning of these DNA fragments into plasmid pBR322 at
EcoRV site. In each experiment, a collection of these DNA fragments was
regenerated by PCR-amplification using the E. coli DNA library plasmids as
templates and a set of primers, EcoRV-F (5’-CTTGGTTATGCCGGTACTGC-3’)
and EcoRV-R (5’-GCGATGCTGTCGGAATGGAC-3’), which hybridize to
pBR322 vector at EcoRV junctions. PCR products thus generated were purified
by 6% polyacrylamide gel electrophoresis (PAGE). For the genomic SELEX

- 12
screening of NNP-binding sequences, 5 pmol of DNA fragments and 10 pmol
His-tagged NNP were mixed in a binding buffer (10 mM Tris-HCl, pH 8.0 at 4OC,
3 mM Mg-acetate, 150 mM NaCl, and 0.1 mM EDTA) and incubated for 30 min
at 37OC. The mixture was applied onto Ni-NTA column and after washing
unbound DNA with the binding buffer containing 10 mM imidazole, DNA-NNP
complexes were eluted with an elution buffer containing 200 mM imidazole. DNA
fragments recovered from the complexes were ligated into pBR322 and
PCR-amplified as above. For sequencing of NNP-bound DNA fragments, PCR
products were cloned into pT7 Blue-T vector (Novagen) and transformed into E.
coli DH5α. Sequencing analysis was carried out using T7-primer
(5’-TAATACGACTCACTATAGGG-3’) with ABI DNA sequencer 3130x.
Gel mobility shift assay
Probes were generated by PCR amplification of NNP-binding
sequences in SELEX using a pair of primers, 5’ fluorescein isothiocyanate
(FITC)–labeled T7-F primer (5’-TAATACGACTACTATAGGG-3’) and T7-R primer
(5’-GGTTTTCCCAGTCACACGACG-3’), the genomic SELEX plasmids

- 13
containing the respective NNP recognition sequences as templates, and Ex Taq
DNA polymerase. PCR products with FITC at their termini were purified by PAGE.
For gel shift assays, 0.5 pmol each of the FITC-labeled probes was incubated at
37OC for 30 min with various amounts of NNP in 15 μl of gel shift buffer
consisting of 10 mM Tris-HCl, pH 7.8 at 4OC, 150 mM NaCl, 3 mM Mg acetate.
After the addition of DNA dye solution, the mixture was directly subjected to 6%
PAGE. Fluorescent-labeled DNA in gels was detected using Pharos FX plus
system (Bio-Rad).
DNA protection assays against nucleases
DNase-I footprinting assay was carried out using FITC-labeled DNA
fragments as described previously (Ogasawara et al., 2007a; 2007b). In brief,
1.0 pmol each of FITC-labeled probes was incubated at 37OC for 30 min with
various amounts of NNP in DNase-I foot-printing buffer consisting of 25 μl of 10
mM Tris-HCl, pH 7.8, 150 mM NaCl, 3 mM magnesium acetate, and 5 mM CaCl2.
After incubation for 30 min, DNA digestion was initiated by the addition of 10 ng
of DNaseⅠ (TaKaRa). After digestion for 30 s at 25OC, the reaction was

- 14
terminated by the addition 25 μl phenol-chloroform. Digested products were
precipitated with ethanol, dissolved in formamide dye, and analyzed by
electrophoresis on a 6% polyacrylamide gel containing 8 M urea. Gel patterns
were recorded using Slab gel DNA sequencer (SHIMADZU).
DNA protection assay against exonuclease III and S1 nuclease was also
carried out using FITC-labeled DNA fragment probes. One pmol each of
FITC-labeled probes was incubated at 37OC for 30 min with various amounts of
NNP. After addition of 1/4 volume of 4x exonuclease III mixture [10x exonuclease III
buffer containing 1 U/μl exonuclease III (TaKaRa)], the digestion reaction was
carried out at 25OC for 1 hr. For DNA protection assay against S1 nuclease, 1/4
volume of 4x S1 nuclease mixture [10x S1 nuclease buffer and 1 U/μl S1
nuclease (TaKaRa)] was added to the NNP-DNA complexes and the S1
digestion was carried out 25OC for 10 min.
Quantitative immunoblot analysis
A quantitative Western blot analysis was carried out by standard method
as described previously (Jishage et al., 1999). In brief, E. coli cells grown in 10
ml of either LB or M9-0.4% glucose medium were harvested by cenrifugation

- 15
and resuspended in 0.3 ml lysis buffer (50 mM Tris-HCl, pH 7.5, 50 mM NaCl,
5% glycerol, and 1 mM dithiothreitol), and then lysozyme was added to a final
concentration of 20 μg/ml. Total proteins were subjected to 12% SDS-PAGE and
blotted on to PVDF membranes using semi-dry transfer apparatus. Membranes
were first immuno-detected with anti-NNP and then developed with an enhanced
chemiluminescence kit (Amersham-Pharmacia Biotech). The image was
analysed with a LAS-1000 Plus lumino-image analyzer and IMAGE GAUGE
(Fuji Film).
Indirect immuno-fluorescence microscopy
The procedure for indirect immuno-fluorescence microscopy was
essentially the same as previously described (Hiraga et al., 1998; Azam et al.,
2000). In brief, 1 ml of cell culture was added directly into 10 ml of 80% methanol,
mixed very gently by hand (avoiding a vortex), and left for 1 hr at 25 OC. The
fixed cells were collected by centrifugation and resuspended in 0.5-1 ml of 80%
methanol. The methanol-fixed cell suspension (10 μl) was deposited on to a
slide, which was coated with poly L-lysine (1 mg/ml, Mr 150,000-300,000, Wako,

- 16
Japan), and air-dried for 20 min in a clean bench to fix the cells tightly on the
slide. The dried cell area was covered with 50 μl of lysozyme solution (2 mg/ml in
25 mM Tris-HCl, pH 8.0, 50 mM glucose, and 10 mM EDTA) and incubated at
room temperature for 5 min. The slide was covered with 4 ml of 99% methanol
for 1 min, and then with 4 ml of acetone for 1 min until complete dryness. The
dried sample area was surrounded by a paraffin square (23×23 mm), and 50 μl
of PBST (140 mM NaCl, 2 mM KCl, 8 mM Na2HPO4, 1.5 mM KH2PO4 and 0.05%
Tween 20) containing 2% bovine serum albumin (BSA) was placed on the slide
for 15 min for blocking the sample. An aliquot (20-50 μl) of 200~500-fold diluted
anti-NNP antibodies was placed on the sample, and left for 1 hr at room
temperature in a moisture chamber. After washing three times with 5 ml each of
PBST, the sample was treated at room temperature for 1 hr in the moisture
controlled chamber with a 20-50 μl aliquot of 500-fold diluted goat anti-rabbit IgG
antibodies conjugated with a fluorescence compound Cy3. After washing three
times with PBST, the immuno-stained sample was stained with 10 μl of DAPI
(4’,6-diamidino-2-phenylindole dihydrochloride, 10 μg/ml) for 1 min, and covered
with one drop of mountain medium (1 mg/ml p-phenylenediamine, 90% glycerol
in PBS, pH 9.0). The immuno-stained samples were observed with a

- 17
fluorescence and phase-contrast microscope (100×objective lens; Olympus,
Japan) equipped with a chilled, high sensitive digital CCD camera, Regita EXi
(NIPPON ROPER, Japan), connected to a computer. Different filter cassettes
were used corresponding fluorescence compounds. The images were
transferred directly to a Windows XP and processed using Image-Pro Plus
ver.6.0 software. The specificity of the observed immuno-stained fluorescent
signal was verified by the absence of the signal in corresponding
immuno-stained samples prepared using the respective nnp null mutant cells.
AFM sample preparation
Complexes of protein and pGRNNP-10 were formed by incubation of
200 ng of DNA with 10 to 800 ng of NNP, as indicated in the text, in 10 x binding
buffer [50 mM HEPES-KOH (pH 7.6), 1 mM EDTA, 500 mM NaCl, 1 mM DTT ]
for 30 min at 37 OC. This incubation mixture was then fixed 0.1% glutaraldehyde
for 1 hr at 4 OC. After the fixation products were 1/20 dilutions (5 ng/μl of DNA)
[dilution buffer; to final concentration of 5 mM HEPES-KOH (pH 7.6), 2 mM
MgCl2] and pedosited onto a spermidine (1 mM)-treated mica surface. In ten

- 18
minutes, the mica was gently washed with distilled water and dried under
nitrogen gas.
AFM imaging
Imaging was performed in Tapping ModeTM with a MultimodeTM AFM
(Veeco, Santa Barbara, CA) operation with a Nanoscope IIIaTM controller. We
used Olympus silicon cantilevers with spring constants between 36 to 75 N/m.
The scan frequency was typically 1.5 Hz per line and the modulation amplitude
was a few nanometers. Analysis of the DNA-NNP complex was done with the
‘Analyse Section’ function in the Nanoscope software. Two-demensional images
in brightness and contrast were optimized for the purpose of clarity.
Three-dimensional images were created with the Nanoscope software and
exported in TIFF format.

- 19
RESULTS
Isolation of NNP-binding sequences by genomic SELEX
For the identification of DNA sequences that are recognized by E. coli
NNP, we employed the genomic SELEX method (Shimada et al., 2005), which
uses a complete library of E. coli genome DNA fragments, instead of synthetic
oligonucleotides with all possible sequences used in the original SELEX method
(Ellington and Szostak, 1990; Tuerk and Gold, 1990; Singer et al., 1997). First,
we constructed the plasmid library, each carrying a piece of the size-fractionated
DNA fragment (150 to 300 bp in length) from a pool of sonicated E. coli W3110
genome DNA. In each experiment, the DNA fragment mixture was regenerated
after amplification of the inserted DNA fragments by PCR. From a mixture of
these DNA fragments and a fourfold molar excess of the purified His-tagged
NNP protein, the NNP-DNA complexes were affinity purified. In the early stage of
this genomic SELEX cycle, the NNP-bound DNA fragments gave smear bands
on PAGE as did the original genome fragment mixture. After five and six SELEX
cycles, however, the width of the gel band decreased, indicating enrichment of
- 20
specific DNA fragments with NNP-binding activity. The SELEX DNA fragments
were recovered from the gel and cloned into the pT7 Blue plasmid (Novagen) for
sequencing.
A total of 333 independent clones were isolated and classified into two
different groups (Table 1). Group A included 147 independent clones, each
carrying a unique sequence from 31 different spacer regions between two
neighboring genes in the E. coli genome. The most abundant 69 clones were
from nnp-ttdA spacer, followed by 22 clones from ffh-ypjD, 10 clones from
maoC-paaA, 4 clone each from yfaZ-yfaO, ygdH-sdaC, fimB-fimE, 3 clones from
the cadB-cadC, 2 clone each from 7 different loci, and only 1 clone each from
other 17 loci (Table 2). In prokaryotes, the recognition DNA sequences by
transcription regulatory factors are generally located around promoters. If NNP is
such a DNA-binding transcription factor, the regulation targets may be the genes
that are transcribed towards opposite direction from the respective NNP-binding
site (shown in bold in Table 1).
A total of 69 clones from the nnp-ttdA spacer contained two different
segments from a 305 bp-long sequence between nucleotides 3205836 and
3205897 in the revised E. coli genome (Riley et al., 2006). NNP might have a

- 21
strong affinity to this nnp-ttdA spacer region because the number of SELEX
isolates by a test transcription factor correlates with its affinity to the target
sequence (Shimada et al., 2005; Ogasawara et al., 2007a; 2007b). This
sequence with strong affinity to NNP is located upstream of nnp (encoding a
putative transcriptional regulator) [leftward transcription] and upstream of ttdA
(encoding L-tartrate dehydratase subunit) [rightward transcription]. One possible
function of this site is the autogenous control of nnp expression by NNP, but the
expression of the ttdA-ttdB-ygjE operon was shown to be reduced after
disruption of the nnp gene (Oshima and Biville, 2006), indicating that NNP is a
positive regulator of L-tartrate-dependent induction of this operon.
On the other hand, group B included 186 independent clones (Table 1),
which were derived from a total of 96 protein-coding regions, including 19 clones
from nrfE, 15 clones from yhfS, 10 clones from ebgA, 4 clones each from yagM,
mltB, yegB, and yiiG, 3 clones each from kdpB, yegB, and yfcN, and 2 clones
each from 15 different loci (Table 2). By using the genomic SELEX analyses, the
binding DNA sites by transcription factors are often identified within
protein-coding sequences (Shimada et al., 2005; Ogasawara et al., 2007a;
2007b). Possible influence on transcription elongation, termination and/or

- 22
anti-termination remains to be examined.
One unique feature of the genomic SELEX with NNP is the variety of its
recognition sequences along the E. coli genome. A total of 333 independent
clones were isolated from 126 different locations. This may indicate that NNP is
one of the global regulators controlling a number of genes. However, this level
variety of the recognition DNA sequence has never been observed among the
well-characterized global regulators so far examined by the genomic SELEX,
including CRP (Fujita, N., unpubliched data), Cra (Shimada et al., 2005), PdhR
(Ogasawara et al., 2007b), RutR (Shimada et al., 2007) and TyrR (Yang et al.,
2007). This finding supports the concept that NNP plays a role in structuring the
nucleoid under yet uncharacterized environmental conditions.

- 23
TABLES
TABLE 1. NNP-bound DNA fragmentsa
----------------------------------------------------------------------------------------------------------
Group No. of No. of Total no. Group No. of No. of Total no.
clones loci of clones clones loci of clones
----------------------------------------------------------------------------------------------------------
A 69 1 69 B 19 1 19
22 1 22 15 1 15
10 1 10 10 1 10
4 3 12 4 3 12
3 1 3 3 3 9
2 7 14 2 35 70
1 17 17 1 51 51
------------------------------ -------------------------------------------
31 147 95 186
----------------------------------------------------------------------------------------------------------
a Using the genomic SELEX method, a total of 333 DNA fragments have been
isolated as complexes with the purified NNP protein. A total of 147 group A
clones contained the sequences from spacer regions between the neighboring

- 24
genes, while a total of 190 group B clones carried the sequences within the
coding frames. The location of all these SELEX fragments on the genome is
described in Table 2.

- 25
TABLE 2. Location of NNP-binding Sitesa
yjhR → ( 4535728) ( 4535985) ← yjhS1 S
allA → ( 531701 ) ( 531911 ) → allR2 S
yhiM → ( 3635488) ( 3635757) ← yhiN1 SmalS → ( 3738935) ( 3739191) → avtA1 SyicO ← ( 3843357) ( 3843543) → yicP1 SyjbI → ( 4251570) ( 4251774) → ubiC1 S
ompC ← ( 2317295) ( 2317546) → yojN1 SygfJ → ( 3015432) ( 3015694) → ygfK1 SpitB ← ( 3136082) ( 3136260) ← gsp1 SgltD → ( 3360408) ( 3360585) → gltF1 S
ompF ← ( 987209 ) ( 987440 ) ← asnS1 Sdcp ← ( 1629907) ( 1630108) → ydfG1 SfadD ← ( 1892260) ( 1892474) ← yeaY1 SintZ → ( 2558200) ( 2558410) → yffL1 S
proS ← ( 218396 ) ( 218569 ) → yaeB1 SyafT → ( 237914 ) ( 238081 ) ← yafU1 ScyoA ← ( 450685 ) ( 450903 ) ← ampG1 SclpX → ( 457498 ) ( 457687 ) → lon1 S
nanA ← ( 3372949) ( 3373146) ← nanR2 S
ykgC ← ( 318930 ) ( 319113 ) → ykgD2 ScobU ← ( 457498 ) ( 457687 ) → yi522 S
nth → ( 1714950) ( 1715145) → ydgR2 SyejG ← ( 2282437) ( 2282655) ← bcr2 S
ygiP ← ( 3205705) ( 3206011) → ttdA69 Sffh ← ( 2746945) ( 2747146) → ypjD22 S
maoC ← ( 1456223) ( 1456408) → paaA10 SyfaZ ← ( 2369883) ( 2370053) ← yfaO4 SygdH → ( 2927325) ( 2927487) → sdaC4 SfimB → ( 4540962) ( 4541151) → fimE4 ScadB ← ( 4359682) ( 4359901) ← cadC3 SnhaR ← ( 19300 ) ( 19473 ) → insB2 S
No. of clones
Left gene
(Direction) (Direction) Right gene
SELEXfragment
A

- 26
alsE(yjcU) ← ( 4308156 ) S(alsC ) ( 4308369 ) ← alsA(yjcW)2rpiR ← ( 4312943 ) S(rpiB ) ( 4313143 ) ← phnQ2
ilvE → ( 3954019 ) S(ilvD ) ( 3954145 ) → ilvA2rhaT ← ( 4100341 ) S(sodA )( 4100488 ) → kdgT2iclR ← ( 4225813 ) S(metH )( 4226095 ) → yjbB2
malM → ( 4251570 ) S(yjbI ) ( 4251774 ) → ubiC2
tldD ← ( 3393150 ) S(yhdP )( 3393340 ) ← yhdR2yhdY → ( 3421974 ) S(yhdZ )( 3422181 ) ← rrfF2bcsC ← ( 3689310 ) S(bcsZ )( 3689528 ) ← bcsB2yieE → ( 3894560 ) S(yieF ) ( 3894726 ) ← yieG2
yfcG → ( 2427678 ) S(folX ) ( 2427939 ) → yfcH2evgA → ( 2490983 ) S(evgS )( 2491159 ) ← yfdE2yfhP ← ( 2662520 ) S(yfhQ )( 2662803 ) → suhB2yghB → ( 3154054 ) S(yqhC )( 3154243 ) → yqhD2
yodC ← ( 2031414 ) S(yedI ) ( 2031645 ) → yedA2sanA → ( 2239167 ) S(yeiT ) ( 2239426 ) → yeiA2ompC ← ( 2319129 ) S(yojN ) ( 2319369 ) → rcsB2yfaQ ← ( 2335728 ) S(yfaS ) ( 2335898 ) ← yfaS2
ompN ← ( 1440538 ) S(ydbK )( 1440791 ) ← hslJ2ydiJ ← ( 1772386 ) S(ydiK ) ( 1772548 ) → ydiL2ynjI ← ( 1848944 ) S(topB ) ( 1849142 ) ← selD2
yecO → ( 1956353 ) S(yecP )( 1956598 ) ← torZ2
aqpZ ← ( 917438 ) S(ybjD ) ( 917699 ) ← ybjX2ymcB ← ( 1048824 ) S(ymcC) ( 1048999 ) ← ymcD2ymfM ← ( 1206523 ) S(ymfN )( 1206714 ) → ymfR2ycjX → ( 1388664 ) S(ycjF ) ( 1388889 ) → tyrR2
secM → ( 109289 ) S(secA )( 109566 ) → mutT2yacG ← ( 111663 ) S(yacF )( 111911 ) ← coaE2panC ← ( 148535 ) S(panB )( 148751 ) ← yadC2mltD ← ( 233850 ) S(gloB ) ( 234048 ) → yafS2tauD → ( 387678 ) S(hemB) ( 387943 ) → yaiT2ybaK ← ( 506372 ) S(ybaP )( 506616 ) → ybaQ2ybaQ → ( 509633 ) S(copA )( 509891 ) → ybaS2ybbS ← ( 531701 ) S(allA ) ( 531911 ) → allR2
kdpC ← ( 725421 ) S(kdpB )( 725635 ) ← kdpA3yegO ← ( 2164860 ) S(yegB )( 2165055 ) → baeS3yfcB ← ( 2455123 ) S(yfcN ) ( 2455386 ) ← yfcO3caiD ← ( 37548 ) S(caiC ) ( 37785 ) ← caiB2
yagL ← ( 293192 ) S(yagM )( 293411 ) ← yagN4ygaD ← ( 2824831 ) S(yegB )( 2825033 ) → srlE4fdhD → ( 4086780 ) S(yiiG ) ( 4086965 ) ← frvR4
ebgR → ( 3224992 ) S(ebgA )( 3224378 ) → ebgC10
nrfD → ( 4294066 ) S(nrfE ) ( 4296753 ) → nrfF19yhfR → ( 3504888 ) S(yhfS ) ( 3505060 ) ← yhfT15
No. of clones
Left gene
(Direction) (Direction) Right gene
SELEXfragment
B

- 27
malM → ( 4251570 ) S (yjbI ) ( 4251774 ) → ubiC1yjeB → ( 4406794 ) S (rnr ) ( 4407105 ) → yjfH1yjgR ← ( 4490031 ) S (idnR ) ( 4490283 ) ← idnT1fimH → ( 4549835 ) S (gntP ) ( 4550035 ) → uxuA1yjiJ ← ( 4562158 ) S (yjiK ) ( 4562402 ) ← yjiL1
mcrD ← ( 4577218 ) S (mcrC )( 4577474 ) → mcrB1riml ← ( 4608405 ) S (yjjG ) ( 4608606 ) → prfC1
yicG → ( 3820017 ) S (yicF ) ( 3820274 ) → gmk1wecB ← ( 3971159 ) S (wecC )( 3971344 ) → rffG1mobB ← ( 4040866 ) S (mobA )( 4041046 ) → yihD1glpF ← ( 4117901 ) S (yiiU ) ( 4118115 ) ← menG1
rplN ← ( 3447848 ) S (rpsQ ) ( 3448126 ) ← rpmC1aroB ← ( 3518216 ) S (aroK ) ( 3518461 ) ← hofQ1yhhW ← ( 3579170 ) S (yhhX ) ( 3579419 ) → yhhY1tdh ← ( 3791893 ) S (kbl ) ( 3792174 ) ← htrL1
tdcE ← ( 3262480 ) S (tdcD ) ( 3262763 ) ← tdcC1infB ← ( 3316214 ) S (nusA ) ( 3316430 ) ← yhbC1mdh ← ( 3384291 ) S (argR ) ( 3384490 ) → yhcN1yhdW → ( 3420328 ) S (yhdX ) ( 3420616 ) → yhdY1
ygdR → ( 2971234 ) S (tas) ( 2971469 ) ← ygeD1yghY ← ( 3147858 ) S (yghZ ) ( 3147959 ) ← yahA1ygiC → ( 3181189 ) S (ygiD ) ( 3181476 ) → ygiE1rpsU ← ( 3211261 ) S (dnaG )( 3211424 ) → rpoD1
gyrA ← ( 2345578 ) S (ubiG ) ( 2345831 ) ← yfaL1yfeN → ( 2532516 ) S (yfeR ) ( 2532780 ) → yfeH1yfgC → ( 2617317 ) S (yfgD ) ( 2617460 ) ← yfgE1grpE ← ( 2750781 ) S (ppnK ) ( 2751003 ) → recN1
ydhP ← ( 1741095 ) S (purR ) ( 1741371 ) ← ydhB1yejG ← ( 2283190 ) S (bcr ) ( 2283409 ) ← rsuA1ccmH ← ( 2296502 ) S (dsbE ) ( 2296764 ) ← ccmF1yfaT ← ( 2341705 ) S (yfaA ) ( 2341886 ) ← gyrA1
yciN ← ( 1334499 ) S (topA ) ( 1334720 ) → cysB1yneL ← ( 1594360 ) S (hipA ) ( 1594584 ) ← hipB1speG → ( 1659282 ) S (ynfC ) ( 1659526 ) → ynfD1ydgK → ( 1708310 ) S (rsxA ) ( 1708588 ) → rsxB1
ompX → ( 851728 ) S (ybiP ) ( 851955 ) → mntR1ycaD → ( 947247 ) S (ycaM )( 947555 ) ← ycaN1ymfM → ( 1206523 ) S (ymfN ) ( 1206714 ) → ymfR1hns ← ( 1296454 ) S (tdk) ( 1296693 ) ← ychG1
envY ← ( 586171 ) S (ybcH ) ( 586443 ) ← nfrA1citX ← ( 647089 ) S (citF ) ( 647347 ) ← citE1citF ← ( 649035 ) S (citE ) ( 649263 ) ← citD1ybhH → ( 801991 ) S (ybhI ) ( 802307 ) → ybhJ1
cueO → ( 139751 ) S (gcd ) ( 139930 ) → hpt1lpcA → ( 244095 ) S (yafJ ) ( 244364 ) ← yafK1yagB ← ( 280165 ) S (yagA ) ( 280365 ) → yagE1ybbL → ( 515749 ) S (ybbM )( 516003 ) ← ybbN1
ftsA → ( 105506 ) S (ftsZ ) ( 105778 ) → lpxC1acnB → ( 134201 ) S (yacL ) ( 134432 ) → speD1
yabQ → ( 59764 ) S (rluA ) ( 59966 ) ← hepA1ftsQ → ( 103836 ) S (ftsA ) ( 104038 ) → ftsZ1

- 28
a Using the genomic SELEX method, a total of 333 DNA fragments have been
isolated as complexes with the purified NNP protein (see Table 1). For the major
SELEX fragments which were isolated more than 3 times, the location on the E.
coli genome are indicated. Minor clones that ware isolated less than twice are
described in the Supplemental Data. Group A clones contained the sequences
from spacer regions between two neighboring genes as indicated, while group B
clones carried the sequences within the indicated coding frames. The numbers
on both sides of each SELEX (S) fragment indicate the boundaries in the revised
E. coli genome map (Riley et al., 2006). The arrows indicate the direction of
transcription of the neighboring genes.

- 29
Identification of NNP-binding activity to SELEX DNA fragments: Gel-shift
assay
For confirmation of NNP binding to these NNP-binding DNA sequences
identified by the genomic SELEX, we performed the gel mobility shift assay for
six representative DNA sequences, nnp-ttdA, maoC-paaA, yfaZ-yfaO, and
intZ-yffL from group A and ygaD-[mltB]-srlE from group B (see Table 2), and a
reference DNA fragment containing perR-insN spacer sequence, that was not
included in this SELEX clone library.
The NNP binding to the putative NNP box within the nnp-ttdA sequence
may exert either negative control of nnp or positive control of ttdA (see above).
This nnp-ttdA probe, however, formed a ladder of multiple bands on PAGE (Fig.
1A), indicating that multiple molecules of NNP bind to this region in a sequential
manner without significant cooperativity of protein-protein interaction.
Surprisingly similar pattern of NNP binding was observed for all other SELEX
DNA fragments tested, including four group-A probes, maoC-paaA (Fig. 1B),
yfaZ-yfaO (Fig. 1C), intZ-yffL (Fig. 1D) and one group-B probe, ygaD-[mltB]-srlA
(Fig. 1E). The gel shift assay indicates that the sequence selectivity of NNP

- 30
binding is very weak or NNP binds to DNA in non-specific manner. The gel
mobility shift pattern of multi step-complex formation is essentially the same with
those of the major nucleoid proteins, HU and IHF (Azam and Ishihama, 1999),
indicating that the sequence recognition properties of NNP is as broad as that of
these nucleoid structuring proteins. Accordingly one unrelated reference probe,
perR-insN, also formed the ladder of NNP complexes (Fig. 1F), implying that an
increasing number of NNP-binding sequences may be obtained after repeating
the genomic SELEX screening.

- 31
Figure 1. Gel mobility shift assay. Fluorescent-labeled DNA probes, each
containing a SELEX segment from the ygiP-ttdA (A), maoC-paaA (B), yfaZ-yfaO
(C), intZ-yffL (D), and ygaD-[mltB]-srlE (E) regions, or an unrelated reference
fragment from perR-insN (F) were incubated at 37OC for 30 min with the
indicated amounts (lane 1, 0; lane 2, 5 pmol; lane 3, 10 pmol; lane 4, 20 pmol;
and lane 5, 30 pmol) of NNP. The reaction mixtures were directly subjected to
PAGE.
ygiP-ttdA
1 2 3 4 5
A ygiP-ttdA
1 2 3 4 51 2 3 4 5
A maoC-paaA
1 2 3 4 5
B maoC-paaA
1 2 3 4 51 2 3 4 5
B yfaZ-yfaO
1 2 3 4 5
C yfaZ-yfaO
1 2 3 4 51 2 3 4 5
C
intZ-yffL
1 2 3 4 5
D intZ-yffL
1 2 3 4 51 2 3 4 5
D ygaD-[mltB]-srlA
1 2 3 4 5
E ygaD-[mltB]-srlA
1 2 3 4 51 2 3 4 5
E perR-insN
1 2 3 4 5
F perR-insN
1 2 3 4 51 2 3 4 5
F

- 32
Analysis of YgiP-binding DNA sequences: DNase-I foot-printing assay
The gel shift assay indicated the binding of NNP to a number of sites on
each DNA probe. The NNP-binding sites on the nnp-ttdA and maoC-paaA
spacer regions were examined by DNase-I foot-printing assay. After forming
complexes in the presence of a fixed amount of fluorescent-labeled DNA probes
and increasing amounts of NNP, DNase-I was added for a short periodm and the
partially digested DNA products were analyzed by PAGE. On the nnp-ttdA
spacer DNA fragment, clear protection by NNP was found only in the presence
of high concentrations of NNP apparently at two regions (Fig. 2A), a 17-bp
sequence between positions -195 and -211 and a 53-bp sequence between
positions -83 and -135 upstream from the ttdA initiation codon (for sequence see
Fig. 2B). The initiation codon-proximal 53 bp sequence (-83 to -135) overlaps
with a 63-bp segment (-81 and -146 from the ttdA initiation codon) that was
included in all 69 NNP SELEX clones (Table 2), indicating that the genomic
SELEX herewith employed allowed to isolate specific DNA fragments recognized
by NNP. However, there is no homologous sequence between the initiation
codon-proximal and -distal sequences significantly protected by NNP from

- 33
DNase-I digestion.
On the other maoC-paaA spacer DNA fragment, the protected regions
from DNase-I treatment was again observed only in the presence of high
concentrations of NNP at two regions (Fig. 3A), a 21-bp sequence between
positions -12 and -32, and a 25-bp sequence between positions -75 and -99
upstream from the maoC initiation codon (for sequence see Fig. 3B). The
initiation codon-proximal sequence includes the promoter for the maoC operon.
Among all four sequences protected by NNP, we failed to identify the consensus
sequence of putative NNP box.
During this DNase-I protection assay, we realized such an unexpected
strange phenomenon that in the presence of low concentrations of NNP, the
probe DNAs disappeared or were rapidly degraded to short fragments (Fig. 2A
and Fig. 3A). Both the gel mobility shift (Fig. 1) and DNase-I foot-printing assays
(Figs. 2 and 3) were performed at the same input ratio of probe DNA and NNP
protein. When low NNP concentrations (protein/DNA ratio of 6.5:1 and 13:1)
were used in gel mobility shift assay, NNP-complex bands were detected on
PAGE (see Fig. 1). Under the same conditions (NNP/DNA ratio of 6.5:1 and
13:1), probe DNAs were digested upon brief treatment with DNase I (see Figs.

- 34
2A and 3A). In the absence of NNP addition, the ladder of degradation products
by DNase-I was observed (see lane 1 in Figs. 2A and 3A), indicating that the
reaction conditions herein employed are adequate for the DNase-I foot-printing
assay. One possibility is that NNP carries an activity of DNA degradation, but this
is unlikely because by raising the NNP concentration, the regular sequence
ladder reappeared (see lanes 4-6 in Figs. 2A and 3A), allowing the identification
of protected regions from DNase-I digestion. The protection effect of NNP from
DNase-I digestion increased concomitantly with the increase in NNP
concentration. Thus, we interpreted that small amounts of NNP binding
enhances the sensitivity of NNP-associated DNA to DNase-I digestion, but upon
increase of NNP, the DNA surface could be fully covered to interfere with attack
by DNase I. The enhancing effect of DNase-I sensitivity has never been
detected for all the major nucleoid proteins even though the mode of DNA
binding by the major nucleoid proteins, HU and IHF, is similar to that of NNP as
detected by the gel shift assay (Azam and Ishihama, 1999).
Taken these observations together we reached to a prediction that the
binding of small numbers of NNP molecule at low protein concentrations
increases the sensitivity of DNA to digestion by DNase I.

- 35
Figure 2. DNase-I foot-printing of the ygiP-ttdA probe. [A] The
fluorescent-labeled SELEX segment from the ygiP-ttdA region was incubated
with increasing amounts of purified NNP (lane 1, 0 pmol; lane 2, 10 pmol; lane 3,
20 pmol; lane 4, 40 pmol; lane 5, 60 pmol; lane 6, 80 pmol) and subjected to
DNase-I foot-printing assays. Lanes A, T, G, and C represent the respective
sequence ladders. The black bars on right indicate the NNP-binding region. [B]
Two DNase-I foot-print sequences by NNP (NNP-I and NNP-II) are indicated
along the nnp-ttdA spacer region sequence. The initiation codons of the nnp and
ttdA genes are boxed. The numbers indicates the distance (bp) from the ttdA
initiation codon.
A T G CA T G C 1 2 3 4 5 61 2 3 4 5 6
NNPATTCAGCATCGTTAATTATCCGCAGTTGTGATAAGCGCAGTAAGTCGTAGCAATTAATAGGCGACAACACTATTCGCGTC
TCTTTGGCTAAAGGCCATCGATTCAGCATCGTTAATTATCAGAAACCGATTTCCGGTCGATAAGTCGTAGCAATTAATAG
AGCAGTTGTGATAAGCGCAGTGTATTTCGCAAAACATTGCGCGACAACACTATTCGCGTCACATAAAGCGTTTTGTAACG
TACATATTCACGGTGGCAAAAAATATAAAACCACATTTTTATGCATAAGTGCCACCGTTTTTTATATTTTGGTGTAAAAA
AGTGGTAGTTTGTGGCGGTGAATTTTTCCAGACAAATACATCACCATCAAACACCGCCACTTAAAAAGGTCTGTTTATGT
AAAACTGGAGTTGCCATGATGAGCGAAAGTAATAAGCAACTTTTGACCTCAACGGTACTACTCGCTTTCATTATTCGTTG
ttdA
nnp
-195-211 NNP-II
-83
-135
NNP-I
NN
P-I
NN
P-II

- 36
Figure 3. DNase-I foot-printing of the maoC-paaA region. [A] The
fluorescent-labeled ygiP-ttdA region was incubated with increasing amounts of
purified NNP (lane 1, 0 pmol; lane 2, 10 pmol; lane 3, 20 pmol; lane 4, 40 pmol;
lane 5, 60 pmol; lane 6, 80 pmol) and subjected to DNaseⅠfoot-printing assays.
Lanes A, T, G, and C represent the sequence ladders. The black bar on the right
indicates the NNP-binding region. [B] Two DNase-I foot-print sequences by NNP
(NNP-I and NNP-II) are indicated along the maoC-paaA spacer region sequence.
Initiation codon of the maoC gene is boxed while the transcription initiation sites
are indicated by dotted arrows. The numbers indicate the distance (bp) from the
maoC initiation codon.
A T G CA T G C 1 2 3 4 5 61 2 3 4 5 6
NNP
TTGTTTTATGAAAGTTACACAATAGTTAAGTAAAATCACAAACAAAATACTTTCAATGTGTTATCAATTCATTTTAGTGT
AATTTTGTATGTTTGAACTGTGACGGATTTCGCACCCTATTTAAAACATACAAACTTGACACTGCCTAAAGCGTGGGATA
TTTTATAAATCATTATTTATCAGTGCATTAATGTTTTCCGAAAATATTTAGTAATAAATAGTCACGTAATTACAAAAGGC
CAGTTGCTATACAGATCGCATAGTTAACATTTCGTTAAAAGTCAACGATATGTCTAGCGTATCAATTGTAAAGCAATTTT
GATCCTTTGCTTTTTATGATTCGCGATTTAACTATTAGCACTAGGAAACGAAAAATACTAAGCGCTAAATTGATAATCGT
ACAGAAATGTGAAACATCTGGAGAGTAGCGATGCAGCAGTTGTGTTTACACTTTGTAGACCTCTCATCGCTACGTCGTCA
maoC
paaA p
maoC p -12
-32
NNP-I
-75-99 NNP-II
NN
P-I
NN
P-II

- 37
Influence of NNP on the nuclease sensitivity of DNA: DNase-I
To confirm the influence of NNP on the sensitivity of DNA against
DNase-I treatment, we next analyzed in details the DNase-I digestion pattern at
various concentrations of NNP and for different time periods. First, we checked
the time course of DNA digestion at fixed concentrations of NNP (10 pmol) and
DNase I (5 mU). In the absence of NNP addition, a low level digestion of DNA
was observed only after 9 min incubation (Fig. 4A, lane 1). In the presence of 10
pmol NNP, the DNA digestion was observed as early as 10 sec (Fig. 4A, lane 2),
indicating about 100-fold increase in the DNase-I sensitivity. Complete digestion
took place within a few minutes (Fig. 4A, lane 6).
Next we performed a systematic analysis of the influence of NNP
concentration on DNA digestion by DNase I. For this purpose, a fixed amount of
DNA and increasing amounts of NNP (up to 80 pmol) were mixed and after
addition of 20 mU DNase I, incubated for 20 sec (Fig. 4B). At NNP
concentrations below 20 pmol (Fig. 4B, lane 7), DNA was almost digested to
smaller fragments, and above 30 pmol (Fig. 4B, lane 8), some protected bands
started to appear. At NNP concentrations above 60 pmol (Fig. 4B, lane 11),

- 38
probe DNA was almost completely protected, indicating that the DNA was fully
covered by NNP, preventing the access of DNase I to the probe DNA.
Using two representative NNP concentrations, i.e., 10 pmol (see Fig. 4B,
lane 6) and 80 pmol (see Fig. 4B, lane 12), the time course of DNA digestion by
5 mU DNase I was repeated. At the low NNP concentrations, the DNA digestion
pattern was essentially the same as that in Fig. 3A. The digestion was observed
as early as at 30 sec (Fig. 4C, lane 2), and long-sized DNA disappeared after
240 (Fig. 4C, lane 5) and 360 sec (Fig. 4C, lane 6) incubation. At the high NNP
concentrations, the sensitivity of probe DNA to DNase I markedly decreased (Fig.
4D). The gel pattern of probe DNA after 10 min incubation (lane 8) was
essentially the same as that in the absence of NNP (lane 2) even though the
intensity of each DNA band was reduced to certain extents.
Taken the time course experiments together we reached to a conclusion
that NNP exerts two different effects on DNA: at low concentrations, DNA
becomes sensitive to DNase-I digestion, while at high concentrations, it
protected DNA from DNase-I digestion.

- 39
Figure 4. DNase-I foot-printing assays of the nnp-ttdA fragment. [A] The
fluorescent-labeled nnp-ttdA spacer region fragment (0.4 μM) was incubated
with 10 pmol NNP for min at 37C and then treated with 5 mU of DNase I for
various times (lanes 1, 9 min; lane 2, 10 sec; lane 3, 20 sec; lane 4, 30 sec; lane
5, 40 sec; lane 6, 5 min; and lane 7, 9 min). The reaction mixture was directly
subjected to PAGE. [B] The fluorescent-labeled nnp-ttdA fragment (0.4 μM) was
incubated for 30 min with the increasing amounts of NNP, and then treated for 2
min (lane 1) or 20 sec (lanes 2 to 11) with 20 mU of DNase I. The amounts of
1 2 3 4 5 6 71 2 3 4 5 6 71 2 3 4 5 6 7 1 2 3 4 5 6 7 8 9 10 111 2 3 4 5 6 7 8 9 10 111 2 3 4 5 6 7 8 9 10 11 1 2 3 4 5 6 7 81 2 3 4 5 6 7 81 2 3 4 5 6 7 8 1 2 3 4 5 6 7 81 2 3 4 5 6 7 81 2 3 4 5 6 7 8
A B C DTime course(10 pmol NNP)
NNP concentration(120 sec reaction)
Time course(10 pmol NNP)
Time course(80 pmol NNP)

- 40
NNP added were: Lane 1, 0 pmol; lane 2, 0 pmol; lane 3, 1.25 pmol; lane 4, 2.5
pmol; lane 5, 5 pmol; lane 6, 10 pmol; lane 7, 20 pmol; lane 8, 30 pmol; lane 9,
40 pmol; lane 10, 60 pmol and lane 11, 80 pmol. [C] The fluorescent-labeled
nnp-ttdA fragment (0.4 μM) was incubated for 30 min in the absence (lane 1)
or presence of 10 pmol NNP (lanes 2 to 8), and then treated with 5 mU of DNase
I for various times. Lane 1, 10 min; lane 2, 0.5 min; lane 3, 1 min; lane 4, 2 min:
lane 5, 4 min; lane 6, 6 min; lane 7, 8 min; lane 8, 10 min. [D] The
fluorescent-labeled nnp-ttdA fragment (0.4 μM) was incubated for 30 min with 0
pmol (lane 1) or 80 pmol (lanes 2 to 8) NNP, and then treated with 5 mU of
DNase I for various times. Lane 1, 10 min; lane 2, 0.5 min; lane 3, 1 min; lane 4,
2 min: lane 5, 4 min; lane 6, 6 min; lane 7, 8 min; and lane 8, 10 min.

- 41
Influence of NNP on the nuclease sensitivity of DNA: Exonuclease III and
S1 nuclease
The foot-printing assay indicated that NNP has a very distinct feature of
modulating the DNA structure so as to make it sensitive to DNase I, which
degrades both single- and double-strand DNAs to nucleotides in non-specific
manner. To examine whether this effect is specific to DNase I, we next analyzed
possible influence of NNP on the sensitivity of DNA to other nucleases with
different specificity.
Exonuclease III catalyzes the stepwise removal of mononucleotides
from 3’ hydroxyl termini of double-stranded DNA toward 5’ direction. This
enzyme has a strict specificity for double-strand DNA and has been used for
determination of the site of protein-binding site from DNA 3’ terminus. If NNP
binds at various sites in random fashion on the probe DNA, the exonuclease III
treatment should yield various products of different chain length on PAGE. Then
exonuclease III foot-printing was carried out in the presence of various
concentrations of NNP. At low NNP concentrations, the pattern of DNA digestion
by exonucleae III (Fig. 5A and 5B, lanes 3-7) was essentially the same as that in

- 42
its absence (Fig. 5A and 5B, lane 2), implying that NNP is not associated at
specific positions along the DNA. Upon increase of NNP addition, however, the
level of small-sized degradation products decreased (Fig. 5A, lane 8) and
concomitantly, a number of protected DNA bands were detected (Fig. 5B, lane 8),
supporting the prediction that NNP covers the entire surface of probe DNA in a
non-specific manner.
To get insight into the mechanism how NNP induces the conformational
change in DNA, we next analyzed the sensitivity of probe DNA to S1 nuclease.
This enzyme is a single-strand DNA-specific endonuclease releasing
5’-phosphoryl mono- or oligonucleotides, but is also active against
single-stranded regions within double-strand DNA. In the presence of low
concentrations of NNP, the sensitivity of DNA against S1 nuclease increased,
leading to reduction of the intact DNA molecules on the top of gel (Fig. 5C amd
5D, lane 3~5), implying that NNP induced single-stranded regions within the
probe DNA. Since intermediate-sized degradation products were hardly
detected, it appears that the probe DNA is rapidly degraded by S1 nuclease
once DNA opening is induced by NNP. At high NNP concentrations, most of the
DNA probe was again protected from S1 nuclease (Fig. 5C and 5D, lanes 6 and 7).

- 43
Taken all these observations together, we propose that NNP is a novel
hitherto uncharacterized nucleoid protein with the strong activity of inducing the
conformational changes in DNA, presumably inducing the local opening of DNA
duplex.

- 44
Figure 5. DNA protection assay against exonuclease III and S1 nuclease. [A]
The fluorescent-labeled nnp-ttdA fragment (0.4 μM) was incubated for 30 min at
with the increasing amounts of NNP, and then treated with 1 U of exonuclease III
for 60 min. The amounts of NNP added were: Lane 1, 0 pmol (in the absence of
NNP and without exonuclease III treatment); lane 2, 0 pmol (in the absence of
NNP); lane 3, 2.5 pmol; lane 4, 5 pmol; lane 5, 10 pmol; lane 6, 20 pmol; lane 7,
40 pmol; and lane 8, 80 pmol. [B] The fluorescent-labeled nnp-ttdA fragment (0.4
A B C DExonuclease III Exonuclease III S1 nuclease S1 nuclease
1 2 3 4 5 6 7 81 2 3 4 5 6 7 8 1 2 3 4 5 6 7 81 2 3 4 5 6 7 8 1 2 3 4 5 6 7 81 2 3 4 5 6 7 8 1 2 3 4 5 6 7 81 2 3 4 5 6 7 8

- 45
μM) was incubated for 30 min with the increasing amounts of NNP, and then
treated with 1 U of exonuclease III for 60 min. The amounts of NNP added were:
Lane 1, 0 pmol (in the absence of NNP and without exonuclease III treatment);
lane 2, 0 pmol (in the absence of NNP); lane 3, 2.5 pmol; lane 4, 5 pmol; lane 5,
10 pmol; lane 6, 20 pmol; lane 7, 40 pmol; and lane 8, 80 pmol. [C] The
fluorescent-labeled nnp-ttdA fragment (0.4 μM) was incubated for 30 min with
the increasing amounts of NNP, and then treated with 1 U of S1 nuclease for 10
min. The amounts of NNP added were: Lane 1, 0 pmol (in the absence of NNP
and without S1 nuclease treatment); lane 2, 0 pmol (in the absence of NNP);
lane 3, 2.5 pmol; lane 4, 5 pmol; lane 5, 10 pmol; lane 6, 20 pmol; lane 7, 40
pmol; and lane 8, 80 pmol. [D] The fluorescent-labeled nnp-ttdA fragment (0.4
μM) was incubated for 30 min with the increasing amounts of NNP, and then
treated with 1 U of S1 nuclease for 10 min. The amounts of NNP added were:
Lane 1, 0 pmol (in the absence of NNP and without S1 nuclease treatment); lane
2, 0 pmol (in the absence of NNP); lane 3, 2.5 pmol; lane 4, 5 pmol; lane 5, 10
pmol; lane 6, 20 pmol; lane 7, 40 pmol; and lane 8, 80 pmol.

- 46
AFM analysis of NNP-DNA complexes
Atomic force microscopy (AFM) is a powerful tool for imaging DNA and
DNA-proteins complexes (Dame et al., 2000; Ceci et al., 2004; Chan et al.,
2007). AFM analysis provides some distinct advantages over bulk biochemical
assays, particularly when studying proteins that do not interact with specific DNA
sequences. Individual DNA-protein complexes can be observed, leading to
qualitatively categorize the complexes and quantitatively measure the amount of
each complex form. Thus the distribution of complexes with specific features in a
mixture can be determined rather than a bulk average usually determined in
biochemical assays. The mode of NNP binding to DNA was studied using a
circular pTFP plasmid, which contains the ygiP-ttdA spacer region with NNP
binding activity as identified by SELEX (see Table 1). By gel retardation assay,
this sequence formed multiple bands of NNP-DNA complexes at moderate
protein concentrations below the aggregation thresholds (see Fig. 1).
NNP-DNA complexes were observed with AFM in the presence of
various concentrations of NNP (Fig. 6A-6G). At low NNP concentrations below
the NNP/DNA molar ratio of 1/10, NNP bound to various positions along the

- 47
entire plasmid DNA (Fig. 6A-6C). The site of NNP binding is non-specific as
analyzed by DNase-I foot-printing. Upon increase in NNP concentrations above
1/10, the NNP-DNA complexes were converted into rod-like structures (Fig.
6D-6G). The sizes of NNP-DNA complexes were smaller than the plasmid DNA,
indicating that NNP binding induces DNA compaction. The size of rods of
NNP-plasmid complexes, however, appeared to increase concomitantly with
further increase in NNP concentrations. One possibility of the NNP
concentration-dependent increase in the size of NNP-DNA complex rods is the
tail-to-head association of NNP-DNA complexes.
The horizontal and vertical sizes of NNP-DNA complexes were
measured for individual images, and the size distributions are plotted against
NNP concentrations (Fig. 7). The peak of horizontal width as determined for
the different protein concentrations was 23.00~29.50 nm, but the horizontal
width of NNP-DNA rods increased with increase in the NNP/DNA ratio above 1
(Fig. 7A). The peak of vertical length was 0.00~2.00 nm at NNP/DNA ratio of
1/40 and 1/20, but at NNP/DNA ratio between 1/10 and 1/4, the peak of the
height of NNP-DNA complexes shifted to 4.00~6.00 nm with a shoulder of
0.00~2.00 peak (Fig. 7B). Upon increase of NNP above 1/2, only a single peak

- 48
of rod height was observed at the same level of 4.00~6.00 nm, which may
indicate the size of plasmid DNA fully covered with NNP.
The peak of DNA length was 2.2~3.3 μm at low NNP/DNA ratio (1/40
and 1/20), but multiple peaks with longer length appeared upon increase of NNP
addition (Fig. 7C). The NNP concentration-coupled change in the contour map of
horizontal width (Fig. 7A), vertical height (Fig. 7B) and length of NNP-DNA
complexes (Fig. 7C) indicates the structural transitions of NNP-DNA complexes
concomitantly with increase in the level of associated NNP.

- 49
A
B
C
D
NNP/DNA= 1/40
NNP/DNA= 1/20
NNP/DNA= 1/10
NNP/DNA= 1/4
E
F
G
NNP/DNA= 1/0.25
NNP/DNA= 1/1
NNP/DNA= 1/2

- 50
Figure 6. AFM images of NNP–DNA complexes at different NNP/DNA ratios. The
ratio of NNP/DNA is ng distinction. (A)~(G) of NNP-DNA complexes is the ratio of
NNP/DNA= 1/40, 1/20, 1/10, 1/4, 1/2, 1/1, and 1/0.25, respectively. All close-up
images of condensed molecules show a 500 x 500 nm surface area. (A)~(F) of
the color scale range from 0.0 to 5.0 nm, and (G) range from 0.0 to 25.0 nm
(from dark to bright).

- 51
Figure 7. Distribution curve of measurements performed on NNP-DNA
complexes. (A) Distribution of the horizontal length of NNP/DNA complexes. (B)
Distribution of the vertical length of NNP/DNA complexes. (C) DNA contour
length distributions of NNP/DNA complexes length.
0.00~
2.00
2.00~
4.00
4.00~
6.00
6.00~
8.00
8.00~
10.0
10.0~
12.0
12.0~
14.0
14.0~
16.0
16.0~
18.0
18.0~
20.0
20.0~
22.0
22.0~
24.0
24.0~
26.0
26.0~
28.0
28.0~
30.0
30.0~
32.0
32.0~
34.0
34.0~
36.0
36.0~
38.0
38.0~
40.0
0.00
0.20
0.40
0.60
0.80
1.00
1.20
Rel
ativ
e Fr
eque
ncy
(nm)
NNP/DNA = 1/40 (n=668)NNP/DNA = 1/20 (n=442)NNP/DNA = 1/10 (n=188)NNP/DNA = 1/4 (n=425)NNP/DNA = 1/2 (n=565)NNP/DNA = 1/1 (n=842)NNP/DNA = 1/0.25 (n=258)
0.00~
2.00
2.00~
4.00
4.00~
6.00
6.00~
8.00
8.00~
10.0
10.0~
12.0
12.0~
14.0
14.0~
16.0
16.0~
18.0
18.0~
20.0
20.0~
22.0
22.0~
24.0
24.0~
26.0
26.0~
28.0
28.0~
30.0
30.0~
32.0
32.0~
34.0
34.0~
36.0
36.0~
38.0
38.0~
40.0
0.00
0.20
0.40
0.60
0.80
1.00
1.20
Rel
ativ
e Fr
eque
ncy
0.00~
2.00
2.00~
4.00
4.00~
6.00
6.00~
8.00
8.00~
10.0
10.0~
12.0
12.0~
14.0
14.0~
16.0
16.0~
18.0
18.0~
20.0
20.0~
22.0
22.0~
24.0
24.0~
26.0
26.0~
28.0
28.0~
30.0
30.0~
32.0
32.0~
34.0
34.0~
36.0
36.0~
38.0
38.0~
40.0
0.00~
2.00
2.00~
4.00
4.00~
6.00
6.00~
8.00
8.00~
10.0
10.0~
12.0
12.0~
14.0
14.0~
16.0
16.0~
18.0
18.0~
20.0
20.0~
22.0
22.0~
24.0
24.0~
26.0
26.0~
28.0
28.0~
30.0
30.0~
32.0
32.0~
34.0
34.0~
36.0
36.0~
38.0
38.0~
40.0
0.00
0.20
0.40
0.60
0.80
1.00
1.20
Rel
ativ
e Fr
eque
ncy
0.00
0.20
0.40
0.60
0.80
1.00
1.20
Rel
ativ
e Fr
eque
ncy
(nm)
NNP/DNA = 1/40 (n=668)NNP/DNA = 1/20 (n=442)NNP/DNA = 1/10 (n=188)NNP/DNA = 1/4 (n=425)NNP/DNA = 1/2 (n=565)NNP/DNA = 1/1 (n=842)NNP/DNA = 1/0.25 (n=258)
NNP/DNA = 1/40 (n=668)NNP/DNA = 1/40 (n=668)NNP/DNA = 1/20 (n=442)NNP/DNA = 1/20 (n=442)NNP/DNA = 1/10 (n=188)NNP/DNA = 1/10 (n=188)NNP/DNA = 1/4 (n=425)NNP/DNA = 1/4 (n=425)NNP/DNA = 1/2 (n=565)NNP/DNA = 1/2 (n=565)NNP/DNA = 1/1 (n=842)NNP/DNA = 1/1 (n=842)NNP/DNA = 1/0.25 (n=258)NNP/DNA = 1/0.25 (n=258)
0.00~
550550
~1100
1100~
16501650
~2200
2200~
27502750
~3300
3300~
38503850
~4400
4400~
49504950
~5500
5500~
60506050
~6600
6600~
71507150
~7700
7700~
82508250
~8800
8800~
93509350
~9900
9900~
1045010450
~11000
0.00
0.10
0.20
0.30
0.40
0.50
0.60
0.70
0.80
Rel
ativ
e Fr
eque
ncy
(nm)
NNP/DNA = 1/40 (n=47)NNP/DNA = 1/20 (n=40)NNP/DNA = 1/10 (n=36)NNP/DNA = 1/4 (n=63)NNP/DNA = 1/2 (n=84)NNP/DNA = 1/1 (n=123)NNP/DNA = 1/0.25 (n=23)
0.00~
550550
~1100
1100~
16501650
~2200
2200~
27502750
~3300
3300~
38503850
~4400
4400~
49504950
~5500
5500~
60506050
~6600
6600~
71507150
~7700
7700~
82508250
~8800
8800~
93509350
~9900
9900~
1045010450
~11000
0.00
0.10
0.20
0.30
0.40
0.50
0.60
0.70
0.80
Rel
ativ
e Fr
eque
ncy
0.00~
550550
~1100
1100~
16501650
~2200
2200~
27502750
~3300
3300~
38503850
~4400
4400~
49504950
~5500
5500~
60506050
~6600
6600~
71507150
~7700
7700~
82508250
~8800
8800~
93509350
~9900
9900~
1045010450
~11000
0.00~
550550
~1100
1100~
16501650
~2200
2200~
27502750
~3300
3300~
38503850
~4400
4400~
49504950
~5500
5500~
60506050
~6600
6600~
71507150
~7700
7700~
82508250
~8800
8800~
93509350
~9900
9900~
1045010450
~11000
0.00
0.10
0.20
0.30
0.40
0.50
0.60
0.70
0.80
Rel
ativ
e Fr
eque
ncy
0.00
0.10
0.20
0.30
0.40
0.50
0.60
0.70
0.80
Rel
ativ
e Fr
eque
ncy
(nm)
NNP/DNA = 1/40 (n=47)NNP/DNA = 1/20 (n=40)NNP/DNA = 1/10 (n=36)NNP/DNA = 1/4 (n=63)NNP/DNA = 1/2 (n=84)NNP/DNA = 1/1 (n=123)NNP/DNA = 1/0.25 (n=23)
NNP/DNA = 1/40 (n=47)NNP/DNA = 1/40 (n=47)NNP/DNA = 1/20 (n=40)NNP/DNA = 1/20 (n=40)NNP/DNA = 1/10 (n=36)NNP/DNA = 1/10 (n=36)NNP/DNA = 1/4 (n=63)NNP/DNA = 1/4 (n=63)NNP/DNA = 1/2 (n=84)NNP/DNA = 1/2 (n=84)NNP/DNA = 1/1 (n=123)NNP/DNA = 1/1 (n=123)NNP/DNA = 1/0.25 (n=23)NNP/DNA = 1/0.25 (n=23)
A B
C
10.00~
16.50
16.50~
23.00
23.00~
29.50
29.50~
36.00
36.00~
42.50
42.50~
49.00
49.00~
55.50
55.50~
62.00
62.00~
68.50
68.50~
75.00
75.00~
81.50
81.50~
88.00
88.00~
94.50
94.50~
101.0101.0
~107.5
107.5~
114.0
114.0~
120.5
120.5~
127.0
127.0~
133.5
133.5~
140.0
0.00
0.10
0.20
0.30
0.40
0.50
0.60
0.70
0.80
Rel
ativ
e Fr
eque
ncy
(nm)
NNP/DNA = 1/40 (n=213)NNP/DNA = 1/20 (n=218)NNP/DNA = 1/10 (n=127)NNP/DNA = 1/4 (n=230)NNP/DNA = 1/2 (n=307)NNP/DNA = 1/1 (n=494)NNP/DNA = 1/0.25 (n=162)
10.00~
16.50
16.50~
23.00
23.00~
29.50
29.50~
36.00
36.00~
42.50
42.50~
49.00
49.00~
55.50
55.50~
62.00
62.00~
68.50
68.50~
75.00
75.00~
81.50
81.50~
88.00
88.00~
94.50
94.50~
101.0101.0
~107.5
107.5~
114.0
114.0~
120.5
120.5~
127.0
127.0~
133.5
133.5~
140.0
0.00
0.10
0.20
0.30
0.40
0.50
0.60
0.70
0.80
Rel
ativ
e Fr
eque
ncy
10.00~
16.50
16.50~
23.00
23.00~
29.50
29.50~
36.00
36.00~
42.50
42.50~
49.00
49.00~
55.50
55.50~
62.00
62.00~
68.50
68.50~
75.00
75.00~
81.50
81.50~
88.00
88.00~
94.50
94.50~
101.0101.0
~107.5
107.5~
114.0
114.0~
120.5
120.5~
127.0
127.0~
133.5
133.5~
140.0
10.00~
16.50
16.50~
23.00
23.00~
29.50
29.50~
36.00
36.00~
42.50
42.50~
49.00
49.00~
55.50
55.50~
62.00
62.00~
68.50
68.50~
75.00
75.00~
81.50
81.50~
88.00
88.00~
94.50
94.50~
101.0101.0
~107.5
107.5~
114.0
114.0~
120.5
120.5~
127.0
127.0~
133.5
133.5~
140.0
0.00
0.10
0.20
0.30
0.40
0.50
0.60
0.70
0.80
Rel
ativ
e Fr
eque
ncy
0.00
0.10
0.20
0.30
0.40
0.50
0.60
0.70
0.80
Rel
ativ
e Fr
eque
ncy
(nm)
NNP/DNA = 1/40 (n=213)NNP/DNA = 1/20 (n=218)NNP/DNA = 1/10 (n=127)NNP/DNA = 1/4 (n=230)NNP/DNA = 1/2 (n=307)NNP/DNA = 1/1 (n=494)NNP/DNA = 1/0.25 (n=162)
NNP/DNA = 1/40 (n=213)NNP/DNA = 1/40 (n=213)NNP/DNA = 1/20 (n=218)NNP/DNA = 1/20 (n=218)NNP/DNA = 1/10 (n=127)NNP/DNA = 1/10 (n=127)NNP/DNA = 1/4 (n=230)NNP/DNA = 1/4 (n=230)NNP/DNA = 1/2 (n=307)NNP/DNA = 1/2 (n=307)NNP/DNA = 1/1 (n=494)NNP/DNA = 1/1 (n=494)NNP/DNA = 1/0.25 (n=162)NNP/DNA = 1/0.25 (n=162)

- 52
Intracellular level of NNP under aerobic, hypoxic, and anaerobic conditions
The protein composition of nucleoids has been studied in details for E.
coli grown under laboratory culture conditions (Azam et al., 1999; Azam and
Ishihama, 1999), but NNP has not been identified. We then measured the
intracellular concentration of NNP by using the quantitative Western blot analysis.
When E. coli cells were grown under aerobic conditions in either rich (LB) or
poor (M9 containing 0.4% glucose) medium, the level of NNP was less than 10%
the level of RNA polymerase α subunit (Fig. 8A). Under the same culture
conditions, the level of RpoA is approximately 5,000 molecules per genome
equivalent of DNA (Ishihama, 1990), while the major nucleoid proteins (Fis, HU,
IHF and H-NS) in exponentially growing E. coli cells range from 10,000 to
100,000 molecules per genome (Azam et al., 2000). Thus, a relatively small
amount of NNP (less than 1% of the major nucleoid proteins) must have been
left unidentified.
Next we measured the NNP level in E. coli cells grown under a hypoxias
condition. Surprisingly, the level of NNP was 1.5- to 2.0-fold higher than the
RpoA level in both rich and poor media and from exponential growth to stationary

- 53
phase (Fig. 8B). On the basis of RpoA level (approximately 5,000 molecules per
genome equivalent DNA) (Ishihama, 1999: 2000), the level of NNP was
estimated to range 7,000-9,000 molecules per genome. In late stationary phase,
the NNP level was significantly higher in the poor medium than in the rich
medium (Fig. 8B, 96 to 144 hr culture). This finding suggests that NNP plays a
role in either maintenance of the nucleoid architecture or expression of the
nucleoid function under the anaerobic conditions.
NNP
RpoA
1 2 3 4 5 6 7 8 9 10 11 121 2 3 4 5 6 7 8 9 10 11 12
NNP
RpoA
A1 B1 1 2 3 4 5 6 7 8 9 10 11 121 2 3 4 5 6 7 8 9 10 11 12
LB mediumM9 medium LB mediumM9 medium
Culture time (hr)2 2.5 4 24 48 722 2.5 4 24 48 72
0
0.5
1.0
1.5
2.0
2.5
NN
P/R
poA
2 2.5 4 24 48 722 2.5 4 24 48 722 2.5 4 24 48 722 2.5 4 24 48 720
0.5
1.0
1.5
2.0
2.5
NN
P/R
poA
0
0.5
1.0
1.5
2.0
2.5
NN
P/R
poA
Culture time (hr)
24 48 72 96 120 14424 48 72 96 120 14424 48 72 96 120 14424 48 72 96 120 1440
0.5
1.0
1.5
2.0
2.5
NN
P/R
poA
0
0.5
1.0
1.5
2.0
2.5
NN
P/R
poA
LB mediumM9 medium LB mediumM9 medium
A2 B2

- 54
Figure 8. Western blot analysis of whole-cell lysates with anti-NNP serum. [A1]
Wild-type E. coli KP7600 and its nnp disruptant JD24074 were grown in LB and
M9-0.4% glucose media at 37OC for various times under aerobic conditions.
Cell lysates were subjected to Western blots analysis againt anti-NNP and
anti-RpoA antibodies. Lanes 1 and 7, OD600=0.3; lanes 2 and 8, OD600=0.6;
lanes 3 and 9, OD600=1.0; lanes 4 and 10, 24 hr; lane 5 and 11, 48 hr; lanes 6
and 12, 72 hr. [A2] The intensity of immuno-blot bands was measured with. [B1]
Wild-type E. coli KP7600 and its nnp disruptant JD24074 were grown in LB and
M9-0.4% glucose media at 37OC for various times under hypoxic culture
conditions. Cell lysates were subjected to Western blots analysis against
anti-NNP and anti-RpoA antibodies. Lanes 1 and 7, OD600=0.3; lanes 2 and 8,
OD600=0.6; lanes 3 and 9, OD600=1.0; lanes 4 and 10, 24 hr; lane 5 and 11, 48 hr;
lanes 6 and 12, 72 hr. [B2] The intensity of immuno-blot bands was measured
with a LAS-1000 Plus lumino-image analyzer and IMAGE GAUGE (Fuji Film).
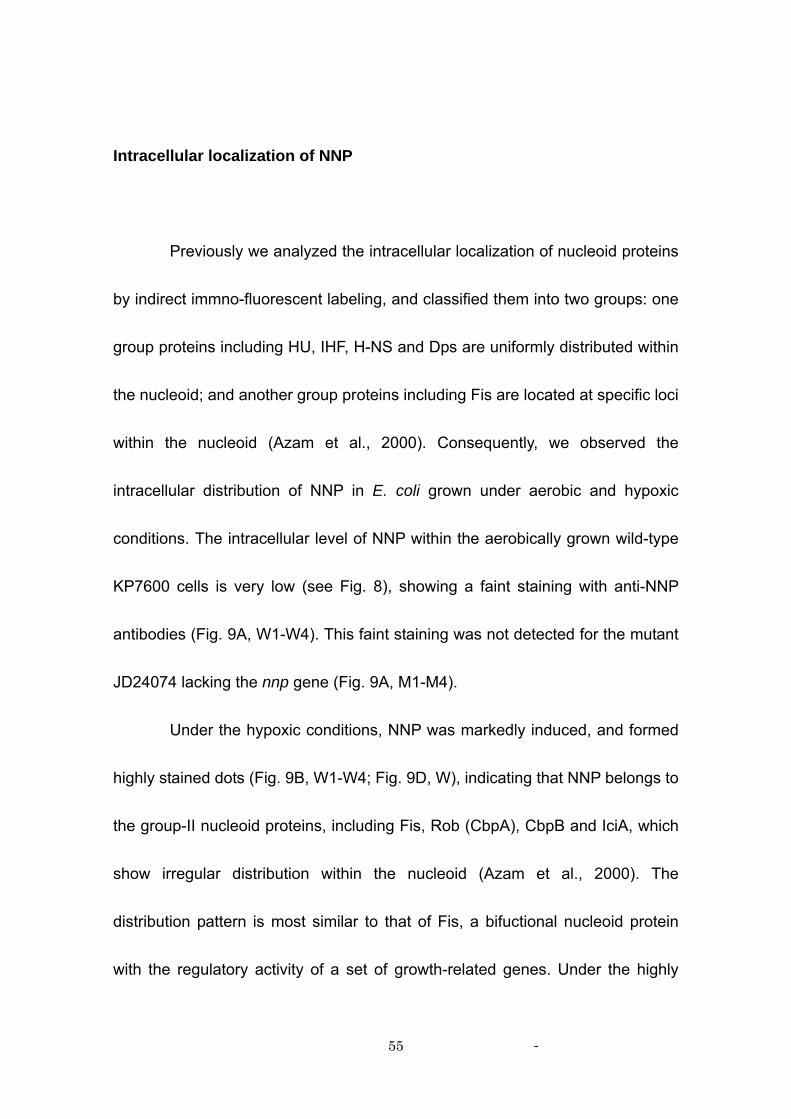
- 55
Intracellular localization of NNP
Previously we analyzed the intracellular localization of nucleoid proteins
by indirect immno-fluorescent labeling, and classified them into two groups: one
group proteins including HU, IHF, H-NS and Dps are uniformly distributed within
the nucleoid; and another group proteins including Fis are located at specific loci
within the nucleoid (Azam et al., 2000). Consequently, we observed the
intracellular distribution of NNP in E. coli grown under aerobic and hypoxic
conditions. The intracellular level of NNP within the aerobically grown wild-type
KP7600 cells is very low (see Fig. 8), showing a faint staining with anti-NNP
antibodies (Fig. 9A, W1-W4). This faint staining was not detected for the mutant
JD24074 lacking the nnp gene (Fig. 9A, M1-M4).
Under the hypoxic conditions, NNP was markedly induced, and formed
highly stained dots (Fig. 9B, W1-W4; Fig. 9D, W), indicating that NNP belongs to
the group-II nucleoid proteins, including Fis, Rob (CbpA), CbpB and IciA, which
show irregular distribution within the nucleoid (Azam et al., 2000). The
distribution pattern is most similar to that of Fis, a bifuctional nucleoid protein
with the regulatory activity of a set of growth-related genes. Under the highly

- 56
induced wild-type E. coli cells under the hypoxic conditions, NNP is enriched
near the interface between the nucleoid and cytoplasm (or the surface of
nucleoid), but it is also present in the cytoplasm, implying that some of the
over-produced NNP stays in the cytoplasm. In the nnp mutant, no
immuno-stained NNP dots were not detected (Fig. 9B, M1-M4; Fig. 9D, M),
indicating that NNP could be detected by the immuno-staining method and with
use of the anti-NNP antibody.
Taken all these results we conclude that NNP is a nucleoid protein
specific in anaerobically grown E. coli cells. As in the case of other major
nucleoid proteins (Ishihama, 2007), NNP may have functional dichotomy,
controlling both the structure and function of the nucleoid. In fact, NNP was
proposed to regulate the neighboring ttdA-ttdB-ygiE operon (Oshima and Biville,
2006).

- 57
A
B
C
D
W1
W1
W
W
M1
M1
W2
W2
W
W
M2
M2
W3
W3
M
M
M3
M3
W4
W4
M
M
M4
M4
- 58
Figure 9. Intracellular localization of the NNP protein. Wild-type E. coli KP7600
and its nnp mutant JD24074 were grown in M9-0.4% glucose media for 24 hr at
37OC under hypoxic conditions, and subjected to the indirect
immuno-fluorescent microscopy according to the standard procedure described
in Experimental procedures. [A] Wild–type strain KP7600 (W1-W4) and the nnp
mutant JD24074 (M1-M4) were grown under aerobic [A] or hypoxic [B]
conditions. W1 and M1 represent; W2 and M2, Indirect immuno-immunoblot
against anti-NNP; W3 and M3, DAPI-staining; W4 and M4, merged images of
DAPI and immuno-stained patterns. [C] and [D], the area shown by dotted
square are expanded. Anti-NNP antibody was raised in rabbits using the purified
NNP as an antigen. Cys3-labeled anti-rabbit IgG antibody was used as the
secondary antibody. White bars indicate 5 μm.

- 59
DISCUSSION
DNA binding specificity of NNP: The aim of this research was conducted
for the identification of target genes or promotes by an uncharacterized putative
transcription factor NNP (renamed from YgiP) of LysR family. A collection of DNA
fragments isolated after the genomic SELEX screening included a number of
different sequences, indicating that NNP is a non-specific DNA binding protein.
The non-sequence specific nature of DNA recognition is similar to those of the
major nucleoid proteins, HU and IHF. The lack of co-operatively in DNA binding
is also similar to these nucleoid proteins (Azam et al., 1999). Accordingly, NNP
gave a concentration-dependent multiple ladders in gel shift assay (see Fig. 2).
This mode of DNA binding is similar to those of the major nucleoid proteins, HU
and IHF, of growing E. coli cells.
Enhancement of DNase-I sensitivity by NNP: One unique feature of NNP is
the enhancement of DNase-I sensitivity of associated DNA. In the presence of
low concentrations of NNP, DNase I completely digested the probe DNA at
concentrations as low as that did not degrade the DNA in the absence of NNP
(see Figs. 2-4). The influence of NNP on the sensitivity of exonuclese III was,

- 60
however, not so striking (see Fig. 5), indicating that the influence of NNP on the
DNA conformation is local within a neighboring narrow region. As predicted from
this hypothesis, the sensitivity to S1 nuclease is enhanced (see Fig. 5), implying
that NNP induces a local opening of DNA. Once the probe DNA was fully
saturated, however, the probe DNA became resistant to DNase I and S1
nuclease digestion. In DNase I foot-printing assays, some apparently protected
regions were detected at high NNP concentrations. However, the possibility
cannot be excluded that the apparently protected regions represent the
sequences, which are converted to highly sensitive to DNase I due to NNP
binding surrounding these regions.
Two forms of NNP-DNA complexes: In agreement with the biochemical
analyses of NNP-DNA interaction, the AFM images indicated NNP
concentration-dependent conformational transition of NNP-DNA complexes
(see Fig. 8). At low NNP concentrations below 1/10 NNP/DNA ratio, NNP is
associated at various sites on the substrate pTFP plasmid, supporting the
non-specific mode of NNP binding. At NNP-associated sites, clamp structures
were observed, that is not inconsistent with the local melting model of
double-strand DNA, generating high sensitivity to DNase I and S1 nuclease. At

- 61
high NNP concentrations, rod-like structures were formed (see Fig. 8), which
were elongated upon further addition of NNP supposedly by forming tail-to-head
linkages between a unit rod of NNP-saturated plasmid DNA. The NNP mediate
conformational transition agrees with the formation of totally retarded aggregates
in the GMSA (see Fig. 1 and Fig. 6).
After statistical analysis of AFM images formed with increasing
concentrations of NNP, we propose two forms of NNP-DNA complexes (Fig. 10).
At low NNP concentrations, NNP binds to various positions on plasmid DNA in
non-specific manner (Form 1) and upon increase in the NNP concentration,
more NNP molecules binds through protein-protein interactions, ultimately
forming the NNP-saturated complexes (Form 2).
Conformation of NNP-saturated DNA: The contour distribution of vertical
length of NNP-DNA complexes is rather constant independent of the protein
concentrations, but that of horizontal length increased with the increase in
protein concentration (see Fig. 7). This extension in the contour length of horizon
suggests the hierarchy of condensed architectures of DNA by NNP, probably by
forming tail-to-head joining of the unit rod-like structure of NNP-plasmid DNA
complex (see Fig. 10 for the model). After measurement of the vertical and
- 62
horizontal lengths and the total length for a number of Form-2 NNP-DNA
complexes, we reached to figure its conformation of native rod in solution as
follows: The width and the height are 26±3 nm and 6±1 nm, respectively, and
the length of unit rod is about 2 μm. The conformation of NNP-DNA rods is
similar to that of TMV capsid with the diameter of 18 nm. The section dimension
of NNP-DNA rod is about 150 nm2 while that of TMV capsid is about 250 nm2.
The length of NNP-DNA is smaller than that of pTFP plasmid, supporting our
proposal that NNP plays a role in DNA compaction.
Direct observation of nucleoid protein-DNA complexes with AFM has
been successfully employed for analysis of protein-DNA complexes with E. coli
H-NS (Dame et al., 2000), Dps (Ceci et al., 2004) and Fis (Maure et al., 2006) as
well as HU-like protein HCc3 of dianoflagellate (Chan et al., 2007), The pattern
of DNA compaction by NNP is rather similar to that of HCc3 from dianoflagellate,
which lacks histones and retains permanently condensed chromosome (Chan et
al., 2007). Both NNP and HCc3 proteins form bundle architectures for DNA
compaction in protein concentration-dependent manner.
Induction of NNP under anaerobic conditions: NNP is apparently similar to
the major nucleoid proteins, but it has never been identified in the isolated

- 63
nucleoids from E. coli cells grown under laboratory culture conditions (Azam and
Ishihama, 2000; Ishihama, 2007). After testing various culture conditions, we
reached to the finding that NNP is highly expressed in cells grown under hypoxic
or anaerobic conditions. This finding indicates that NNP plays a role in
structuring the nucleoid in cells under anaerobic conditions as in the cases of Fis
in rapidly growing cells and Dps in stationary-phase cells. Fis is synthesized
preferentially in growing cells (Ball et al., 1992; Azam and Ishihama, 2000) and
plays an essential role for transcription of the growth-related genes (Ishihama,
2007). Fis is one of the key global regulators of a number of genes for adaptation
to external conditions such as the availability of oxygen and nutrients (Nilsson et
al., 1990; Ross et al., 1990; Ishihama, 2007). On the other hand, Dps
(DNA-binding protein form starved cells) is the major nucleoid protein only in
starved stationary-phase cells (Almiron et al., 992; Azam et al., 1999) and plays
roles in protecting of resting bacterial cells from environmental stresses such as
a high level of toxic iron. Transformation of the nucleoids from exponential
growth-specific fibrous structures to stationary phase-specific rod forms (Kim et
al., 2004) depends on the association of Dps to the genome DNA. This group of
nucleoid proteins may be stored on the nucleoid surface, forming dots as

- 64
detected by indirect immuno-staining (Azam et al., 2000; also see Fig. 9).
Since NNP is highly expressed under anaerobic and starved conditions, it may
play a role in protection of the genome DNA from oxidization stress and nutrient
starvation. NNP contains two sets of Cys-Cys pair, one consisting of Cys170 and
Cys193, and another consisting of Cys288 and Cys296. Since the Cys-Cys pair is
involved in redox sensing (Zheng et al., 1998), NNP may also play a role in
redox sensing. This motif is also involved in metal chelating, implying a role in
resistance of metals as did Dps against iron. A group of Gram-positive bacteria
such as Bacillus, Clostridium, Sporosarcina, and Anphibacillus form spores for
survival under harmful stresses, but Gram-negative bacteria such as E. coli must
harbour another system for survival under stressful conditions. NNP and Dps
play essential roles for protection of the genome during dormant stage.
Regulatory role of NNP: In prokaryotes, the genes encoding transcription
factors are generally located on the genome adjoining to the target genes for
regulation. Relying on this rule, Oshima and Biville (2006) identified that YgiP,
here renamed to NNP, is involved in regulation of the adjacent ttdA-ttdB-ygiE
operon. Interestingly, tartrate dehydratase encoded by ttdA-ttdB for tartrate
uptake is required for anaerobic growth on glycerol as carbon source in the

- 65
presence of tartrate. Our findings extend this concept and further indicate that
NNP is a bifunctional nucleoid protein under anaerobic growth, playing dual roles
in both structuring the nucleoid and regulation of a set of genes needed for
growth under anaerobiosis. Along this line, the genes under the control of NNP
must be present besides the ttdA-ttdB-ygiE operon, which altogether contribute
to the E. coli surviral under the anaerobiotic conditions such as in animals.

- 66
Figure 10. A diagram showing the structural change of NNP-induced DNA
condensation. NNP-DNA complexes formed in the presence of increasing
concentrations of NNP were observed with AFM. Typical figures are shown in
panel A-D. Based on the AFM pattern analysis, we propose two distinct forms of
NNP-DNA complex (see text). The diagrams shown below the AFM figures
represent the NNP concentration-dependent transition model between two forms.
DNA strand is shown by a black line while NNP is shown by orange colour.
NNP/DNA =1/4NNP/DNA =1/4 NNP/DNA =1/1NNP/DNA =1/1
NNP/DNA =1/0.25NNP/DNA =1/0.25
NNP/DNA =1/0.25NNP/DNA =1/0.25
NNP/DNA =1/2NNP/DNA =1/2 NNP/DNA =1/1NNP/DNA =1/1NNP/DNA =1/2NNP/DNA =1/2 NNP/DNA =1/1NNP/DNA =1/1
DNA
DNA DNA
DNA
DNA
DNA
A B
C D
NNP/DNA =1/10NNP/DNA =1/40NNP/DNA =1/10NNP/DNA =1/40

- 67
ACKNOWLEDGMENTS
I wish to express my sincerest gratitude to Professor Akira Ishihama,
Graduate School of Division of Material Chemistry, Hosei University, for kind
guidance, valuable suggestion and discussions, and continuous encouragement
throughout the course of this work and critical reading of the manuscript.
I am grateful to Assistant Professor Shigehiro Yoshimura and Professer
Kunio Takeyasu, School of Biosciences, University of Kyoto, for valuable
suggestions and discussions throughout the word of AFM analysis. I would also
thank to the members of Professor Takeyasu’s laboratory for kindness help.
I am also deeply indebted to Dr. Kaneyoshi Yamamoto, Hosei University
for valuable suggestions and discussions throughout the work.
I would also like to thank to Dr. Takenori Miki for providing the E. coli
mutant lacking the nnp gene.
Many thanks are due to Miss Kiyo Hirao, Miss Ayako Kori, Mr. Yoshito
Ogawa, Miss Kayoko Yamada, Dr. Hiroshi Ogasawara, Mr. Tomohiro Shimada,
Miss. Minami Naruse, Mr. Naoki Kobayashi and other members of Division of
Material Chemistry, Hosei University.

- 68
Finally, very special thanks are forwarded to my parents for their continuous
support and cooperation, without which this work was never possible.
- 69
REFERENCES
Almiron, M., A. J. Link, D. Furlog, and R. Kolter. 1992. A novel DNA-binding
protein with regulatory and protective roles in starved Escherichia coli. Genes
Dev. 6: 2624-2654.
Azam, T. A., S. Hiraga, and A. Ishihama. 2000. Two types of localization of the
DNA-binding proteins within the Escherichia coli nucleoid. Genes Cells 5:
613-626.
Azam, T. A., and A. Ishihama. 1999. Twelve Species of the
Nucleoid-associated Protein from Escherichia coli. J. Biol. Chem. 274:
33105-33113.
Azam, T. A., A. Iwata., A. Nishimura., S. Ueda, and A. Ishihama. 1999.
Growth phase-dependent variation in protein composition of the Escherichia
coli nucleoid. J. Bacteriol. 181: 6361-6370.
Ball, C. A., R. Osuna, K. C. Ferguson, and R. C. Johnson. 1992. Dramatic
changes in Fis levels upon nutrient upshift in Escherichia coli. J. Bacteriol.
174: 8042-8056.
Ceci, P., Cellai, S., Falvo, E., Rivetti, C., Rossi, G.L. and Chianocone, E. 2004.

- 70
DNA condensation and self-aggregation of Escherichia coli Dps are coupled
phenomena related to the properties of the N-terminus. Nucleic Acid Res.,
32: 5935-5944.
Chan, Y. H., and Wong, J. T. 2007. Concentration-dependent organization of
DNA by the dinoflagellate histone-like protein HCc3. Nucleic Acid Res., 35:
2573-2583.
Dame, R. T., Wyman, C., and Goosen, N. 2000. H-NS mediated compaction of
DNA visualized by atomic force microscopy. Nucleic Acid Res., 28:
3504-3510.
Ellington, A.D., and Szostak, J.W. 1990. In vitro selection of DNA molecules
that bind specific ligands. Nature 346: 818-822.
Hansma, P. K., V. B. Elings., O. Marti and C. E. Bracker. 1988. Scanning
tunneling microscopy and atomic force microscopy: application to biology
and technology. Science. 242: 209-216.
Hiraga, S., C. Ichinose, H. Niki, and M. Yamazoe. 1998. Cell cycle-dependent
duplication and bidiectional migration of SeqA-associated DNA-protein
complexes in E. coli. Mol. Cell 1: 381-387.
Ishihama, A. 2007. The nucleoid. In Escherichia coli and Salmonella, second

- 71
edition (Neidhardt, F. C. et al., ed.), American Society for Microbiology, in
press.
Ishihama, A. 2000. Functional modulation of Escherichia coli RNA polymerase.
Ann. Rev. Microbiol. 54: 499-518.
Ishihama, A. 1999. Modulation of the nucleoid, the transcription apparatus, and
the translation machinery in bacteria for stationary phase survival. Genes
Cells 4: 135-143.
Ishihama, A. 1997. Adaptation of gene expression in stationary phase bacteria.
Curr. Opn. Microbiol. 7: 582-588.
Jishage, M., A. Iwata, S. Ueda, and Ishhama, A. 1996. Regulation of RNA
polymerase sigma subunit synthesis in Escherichia coli: Intracellular levels of
four species of sigma subunit under various growth conditions. J. Bacteriol.
178: 2507-2513.
Kim, J., S. H. Yoshimura, K. Hizume, R. L. Ohniwa, A. Ishihama, and K.
Takeyasu. 2004. Fundamental structural units of the Escherichia coli
nucleoid revealed by atomic force microscopy. Nucleid Acids Res. 32:
1982-1992.
Makinoshima, H., A. Nishimura, and A. Ishihama. 2002. Fractionation of

- 72
Escherichia coli cell populations at different stages during growth transition to
stationary phase. Mol. Microbiol. 43:269-279.
Maure, S., J. Fritz., G. Muskhelishvili. and A. Travers. 2006. RNA polymerase
and an activator form discrete subcomplexes in a transcription initiation
complex. EMBO J. 25: 3784-3790.
Morikawa, K., R. Ohniwa., J. Kim., A. Maruyama., T. Ohta. and K. Takeyasu.
2006. Bacterial nucleoid dynamics: oxidative stress response in
Staphylococcus aureus. Gene Cells. 11: 409-423.
Nilsson, L. A., A. Vanet, E. Vijgenboom, and L. Bosch. 1990. The role of Fist
in transcription activation of stable RNA operons. EMBO J. 9: 727-737.
Ogasawara., H., A. Hasegawa, E. Kanda, T. Miki, K. Yamamoto, and A.
Ishihama. 2007. Genomic SELEX search for target promoters under the
control of the PhoQP-RstBA signal cascade. J. Bacteriol. 187:4791-4799.
Oshima, T., and F. Biville. 2006. Functional identification of ygiP as a positive
regulator of the ttdA-ttdB-ygjE operon. Microbiol. 152: 2129-2135.
Perez-Rueda, E. and J. Collado-Vides. 2000. The repertoire of DNA-binding
transcriptional regulators in Escherichia coli K-12. Nucleic Acids Res. 28:
1838-1847.
- 73
Riley, M., T. Abe, M. B. Arnaud, M. K. B. Berlyn, F. R. Blattner, R. R.
Chaudhuri, J. D. Glasner, T. Horiuchi, I. M. Keseler, T. Kosuge, H. Mori, N.
T. Perna, G. Plunkett Ⅲ, K. E. Rudd, M. H. Serres, G. H. Thomas, N. R.
Thomson, D. Wishart, and B. L. Wanner. 2006. Escherichia coli K-12: a
cooperatively developed annotation snapshot – 2005. Nucleic Acids Res.:
34:1-9
Ross, W., J. F. Thomspon, J. T. Newlands, and R. L. Gourse. 1990. E. coli Fis
protein activates rRNA transcription in vitro and in vivo. EMBO J. 9:
3733-3742.
Schell, M. A. 1993. Molecular biology of the LysR family of transcriptional
regulators. Annu. Rev. Microbiol. 47: 597-626.
Shimada, T., N. Fujita, M. Maeda and A. Ishihama. 2005. Systematic search
for the Cra-binding promoters using genomic SELEX systems. Genes Cells
10:907-918.
Singer, B. S., T. Shtatland, D. Brown, and L. Gold. 1997. Libraries for genomic
SELEX. Nucleic Acids Res. 25:781-786.
Takeyasu, K., J. Kim., R. Ohniwa., T. Kobori., Y. Inose., K. Morikawa., T.
Ohta., A. Ishihama. and S. Yoshimura. 2004. Genome architecture studied

- 74
by nanoscale imaging: analyses among bacterial phyla and their implication
to eukaryotic genome folding. Cytogenet Genome Res. 107: 38-48.
Tuerk, C., and Gold, L. (1990) Systematic evolution of ligands by exponential
enrichment: RNA ligands to bacteriophage T4 DNA polymerase. Science
249:505-510.
Zheng, M., F. Aslund. and G. Storz. 1998. Activation of the OxyR transcription
factor by reversible disulfide bond formation. Science. 279: 1718-1721.
Zheng, M., F. Aslund. and G. Storz. 1998. Activation of the OxyR transcription
factor by reversible disulfide bond formation. Science. 279: 1718-1721.

- 75
Publication list
Acceptance Treatise
1) Negative Regulation of DNA Repair Gene (ung) Expression by the
CpxR/CpxA Two-Component System in Escherichia coli K-12 and Induction
of Mutations by Increased Expression of CpxR
Ogasawara. H., Teramoto. J., Hirao. K., Yamamoto. K., Ishihama. A.,
Utsumi. R. 2004. 186(24). Journal of Bacteriology.
2) Negative regulation of DNA repair gene (uvrA) expression by ArcA/ArcB
two-component system in Escherichia coli
Ogasawara. H., Teramoto. J., Yamamoto. S., Hirao. K., Yamamoto. K.,
Ishihama. A., Utsumi. R. 2005. 251. FEMS Microbiology Letters.
3) Transcription Factor-Promoter Interaction Networks
A. Ishihama., T. Shimada., H. Ogasawara., J. Teramoto., K. Yamamoto. 2005.
Micro- and Nano-Mechatronics and Human Science.

- 76
J. Bacteriol., submmitted for preparation.
1) Novel Nucleoid Protein (NNP) with Enhancing Activity of DNA Sensitivity to
Nucleases in Anaerobic Growth E. coli.
Teramoto. J and A. Ishihama.
In preparation
1) Novel Nucleoid Protein (NNP) from Escherichia coli: Mode of NNP-DNA
interaction.
Teramoto, J., S. H. Yoshimura. and A. Ishihama.
Verbal & Poster Presentation
1) 日本ゲノム微生物学会第 1 回 :かずさアーク
口頭演題「大腸菌単一細胞のプロモーター強度の測定」
寺本 潤、長谷川明子、曲山幸生、Elshimy Haitham、
市川明彦、新井史人、福田敏男、石浜 明
- 77
2) 18th IEEE International Symposium on Micro-NanoMechatronics and Human
Science
Multi-Scale Genetics of Transcription Network: Understanding the Regulator
All 300 Transcription Factors from a Single Organism Escherichia Coli.
A. Ishihama, H. Ogasawara, T. Shimada, J. Teramoto, A. Hasegawa, Y.
Umezawa, K. Yabuki, Y. Ishida, T. Inaba, A. Kori, K. Yamada, Y. Kitai, N.
Kobayashi, D. Kato and K. Yamamoto.
3) 特定領域女性研究者第一回ワークショップ
大腸菌単一細胞観測系の構築とプロモーター強度測定
長谷川明子、寺本潤、曲山幸生、新井史人、福田敏男、石浜明
4) 第 30 回日本分子生物学会・第 80 回日本生化学会
「大腸菌新規核様体タンパク質の同定」
寺本潤、吉村成弘、郡彩子、竹安邦夫、石浜明
5) 第 30 回日本分子生物学会・第 80 回日本生化学会
「大腸菌単一細胞観測系の構築とプロモーター強度測定」

- 78
長谷川明子、寺本潤、郡彩子、曲山幸生、El-Shimy H. Magdy、中島正博、林
育菁、新井史人、福田敏男、石浜明
6) 第 30 回日本分子生物学会・第 80 回日本生化学会
「大腸菌転写因子 TorR の新規標的遺伝子群の探索と制御」
稲葉達也、寺本潤、三木健良、石浜明