identification,weak instruments and statistical inference...
TRANSCRIPT
Identification, weak instruments and statistical inference ineconometrics ∗
Jean-Marie Dufour †
Université de Montréal
First version: May 2003Revised: August 2003
This version: August 17, 2003Compiled: August 17, 2003, 5:13pm
∗ This paper is based on the author’s Presidential Address to the Canadian Economics Association given on May31, 2003, at Carleton University (Ottawa). The author thanks Bryan Campbell, Tarek Jouini, Lynda Khalaf, William Mc-Causland, Nour Meddahi, Benoît Perron and Mohamed Taamouti for several useful comments. This work was supportedby the Canada Research Chair Program (Chair in Econometrics, Université de Montréal), the Alexander-von-HumboldtFoundation (Germany), the Canadian Network of Centres of Excellence [program on Mathematics of Information Tech-nology and Complex Systems (MITACS)], the Canada Council for the Arts (Killam Fellowship), the Natural Sciences andEngineering Research Council of Canada, the Social Sciences and Humanities Research Council of Canada, the Fondsde recherche sur la société et la culture (Québec), and the Fonds de recherche sur la nature et les technologies (Québec).
† Canada Research Chair Holder (Econometrics). Centre interuniversitaire de recherche en analyse des organisa-tions (CIRANO), Centre interuniversitaire de recherche en économie quantitative (CIREQ), and Département de scienceséconomiques, Université de Montréal. Mailing address: Département de sciences économiques, Université de Montréal,C.P. 6128 succursale Centre-ville, Montréal, Québec, Canada H3C 3J7. TEL: 1 514 343 2400; FAX: 1 514 343 5831;e-mail: [email protected]. Web page: http://www.fas.umontreal.ca/SCECO/Dufour .
ABSTRACT
We discuss statistical inference problems associated with identification and testability in econo-metrics, and we emphasize the common nature of the two issues. After reviewing the relevantstatistical notions, we consider in turn inference in nonparametric models and recent developmentson weakly identified models (or weak instruments). We point out that many hypotheses, for whichtest procedures are commonly proposed, are not testable at all, while some frequently used econo-metric methods are fundamentally inappropriate for the models considered. Such situations lead toill-defined statistical problems and are often associated with a misguided use of asymptotic distri-butional results. Concerning nonparametric hypotheses, we discuss three basic problems for whichsuch difficulties occur: (1) testing a mean (or a moment) under (too) weak distributional assump-tions; (2) inference under heteroskedasticity of unknown form; (3) inference in dynamic modelswith an unlimited number of parameters. Concerning weakly identified models, we stress that validinference should be based on proper pivotal functions — a condition not satisfied by standard Wald-type methods based on standard errors — and we discuss recent developments in this field, mainlyfrom the viewpoint of building valid tests and confidence sets. The techniques discussed includealternative proposed statistics, bounds, projection, split-sampling, conditioning, Monte Carlo tests.The possibility of deriving a finite-sample distributional theory, robustness to the presence of weakinstruments, and robustness to the specification of a model for endogenous explanatory variablesare stressed as important criteria assessing alternative procedures.
Key-words : hypothesis testing; confidence set; confidence interval; identification; testability;asymptotic theory; exact inference; pivotal function; nonparametric model; Bahadur-Savage; het-eroskedasticity; serial dependence; unit root; simultaneous equations; structural model; instrumen-tal variable; weak instrument; weak identification; simultaneous inference; projection; split-sample;conditional test; Monte Carlo test; bootstrap.
JEL classification numbers: C1, C12, C14, C15, C3, C5.
i
RÉSUMÉ
Nous analysons les problèmes d’inférence associés à l’identification et à la testabilité enéconométrie, en soulignant la similarité entre les deux questions. Après une courte revue des no-tions statistiques requises, nous étudions tour à tour l’inférence dans les modèles non-paramétriquesainsi que les résultats récents sur les modèles structurels faiblement identifiés (ou les instrumentsfaibles). Nous remarquons que beaucoup d’hypothèses, pour lesquelles des tests sont régulièrementproposés, ne sont pas en fait testables, tandis que plusieurs méthodes économétriques fréquem-ment utilisées sont fondamentalement inappropriées pour les modèles considérés. De telles situa-tions conduisent à des problèmes statistiques mal posés et sont souvent associées à un emploi malavisé de résultats distributionnels asymptotiques. Concernant les hypothèses non-paramétriques,nous analysons trois problèmes de base pour lesquels de telles difficultés apparaissent: (1) testerune hypothèse sur un moment avec des restrictions trop faibles sur la forme de la distribution;(2) l’inférence avec hétéroscédasticité de forme non spécifiée; (3) l’inférence dans les modèlesdynamiques avec un nombre illimité de paramètres. Concernant les modèles faiblement identifiés,nous insistons sur l’importance d’utiliser des fonctions pivotales — une condition qui n’est pas sat-isfaite par les méthodes usuelles de type Wald basées sur l’emploi d’écart-types — et nous passonsen revue les développements récents dans ce domaine, en mettant l’accent sur la construction de testet régions de confiance valides. Les techniques considérées comprennent les différentes statistiquesproposées, l’emploi de bornes, la subdivision d’échantillon, les techniques de projection, le condi-tionnement et les tests de Monte Carlo. Parmi les critères utilisés pour évaluer les procédures, nousinsistons sur la possibilité de fournir une théorie distributionnelle à distance finie, sur la robustessepar rapport à la présence d’instruments faibles ainsi que sur la robustesse par rapport la spécificationd’un modèle pour les variables explicatives endogènes du modèle.
Mots clés : test d’hypothèse; région de confiance; intervalle de confiance; identification; testabil-ité; théorie asymptotique; inférence exacte; fonction pivotale; modèle non-paramétrique; Bahadur-Savage; hétéroscédasticité; dépendance sérielle; racine unitaire; équations simultanées; modèlestructurel; variable instrumentale; instrument faible; inférence simultanée; projection; subdivisiond’échantillon; test conditionnel; test de Monte Carlo; bootstrap.
Classification JEL: : C1, C12, C14, C15, C3, C5.
ii
Contents
List of Propositions and Theorems iii
1. Introduction 1
2. Models 4
3. Statistical notions 53.1. Hypotheses . . . . . . . . . . . . . . . . . . . . . . . . . . . . . . . . . . . . 53.2. Test level and size . . . . . . . . . . . . . . . . . . . . . . . . . . . . . . . . . 73.3. Confidence sets and pivots . . . . . . . . . . . . . . . . . . . . . . . . . . . . 83.4. Testability and identification . . . . . . . . . . . . . . . . . . . . . . . . . . . 9
4. Testability, nonparametric models and asymptotic methods 94.1. Procedures robust to nonnormality . . . . . . . . . . . . . . . . . . . . . . . . 94.2. Procedures robust to heteroskedasticity of unknown form . . . . . . . . . . . . . 124.3. Procedures robust to autocorrelation of arbitrary form . . . . . . . . . . . . . . 13
5. Structural models and weak instruments 145.1. Standard simultaneous equations model . . . . . . . . . . . . . . . . . . . . . . 145.2. Statistical problems associated with weak instruments . . . . . . . . . . . . . . 165.3. Characterization of valid tests and confidence sets . . . . . . . . . . . . . . . . 17
6. Approaches to weak instrument problems 186.1. Anderson-Rubin statistic . . . . . . . . . . . . . . . . . . . . . . . . . . . . . 186.2. Projections and inference on parameter subsets . . . . . . . . . . . . . . . . . . 206.3. Alternatives to the AR procedure . . . . . . . . . . . . . . . . . . . . . . . . . 21
7. Extensions 267.1. Multivariate regression, simulation-based inference and nonnormal errors . . . . 267.2. Nonlinear models . . . . . . . . . . . . . . . . . . . . . . . . . . . . . . . . . 27
8. Conclusion 28
List of Propositions and Theorems
4.1 Theorem : Mean non-testability in nonparametric models . . . . . . . . . . . . . . 104.2 Theorem : Characterization of heteroskedasticity robust tests . . . . . . . . . . . . . 124.4 Theorem : Unit root non-testability in nonparametric models . . . . . . . . . . . . . 135.1 Theorem : Characterization of valid confidence set for a possibly unidentified parameter 17
iii
1. Introduction
The main objective of econometrics is to supply methods for analyzing economic data, buildingmodels, and assessing alternative theories. Over the last 25 years, econometric research has ledto important developments in many areas, such as: (1) new fields of applications linked to theavailability of new data, financial data, micro-data, panels, qualitative variables; (2) new models:multivariate time series models, GARCH-types processes; (3) a greater ability to estimate nonlinearmodels which require an important computational capacity; (4) methods based on simulation: boot-strap, indirect inference, Markov chain Monte Carlo techniques; (5) methods based on weak distri-butional assumptions: nonparametric methods, asymptotic distributions based on “weak regularityconditions”; (6) discovery of various nonregular problems which require nonstandard distributionaltheories, such as unit roots and unidentified (or weakly identified) models.
An important component of this work is the development of procedures for testing hypotheses(or models). Indeed, a view widely held by both scientists and philosophers is that testability or theformulation of testable hypotheses constitutes a central feature of scientific activity — a view weshare. With the exception of mathematics, it is not clear a discipline should be viewed as scientific ifit does not lead to empirically testable hypotheses. But this requirement leaves open the question offormulating operational procedures for testing models and theories. To date, the only coherent — or,at least, the only well developed — set of methods are those supplied by statistical and econometrictheory.
Last year, on the same occasion, MacKinnon (2002) discussed the use of simulation-based in-ference methods in econometrics, specifically bootstrapping, as a way of getting more reliable testsand confidence sets. In view of the importance of the issue, this paper also considers questions as-sociated with the development of reliable inference procedures in econometrics. But our expositionwill be, in a way, more specialized, and in another way, more general — and critical. Specifically,we shall focus on general statistical issues raised by identification in econometric models, and morespecifically on weak instruments in the context of structural models [e.g., simultaneous equationsmodels (SEM)]. We will find it useful to bring together two separate streams of literature: namely,results (from mathematical statistics and econometrics) on testability in nonparametric models, andthe recent econometric research on weak instruments.1 In particular, we shall emphasize that identi-fication problems arise in both literatures and have similar consequences for econometric methodol-ogy. Further, the literature on nonparametric testability sheds light on various econometric problemsand their solutions.
Simultaneous equations models (SEM) are related in a natural way to the concept of equilib-rium postulated by economic theory, both in microeconomics and macroeconomics. So it is notsurprising that SEM were introduced and most often employed in the analysis of economic data.Methods for estimating and testing such models constitute a hallmark of econometric theory andrepresent one of its most remarkable achievements. The problems involved are difficult, raisingamong various issues the possibility of observational equivalence between alternative parametervalues (non-identification) and the use of instrumental variables (IV). Further, the finite-sample
1By a nonparametric model (or hypothesis), we mean a set of possible data distributions such that a distribution [e.g.,the “true” distribution] cannot be singled out by fixing a finite number of parameter values.
1
distributional theory of estimators and test statistics is very complex, so inference is typically basedon large-sample approximations.2
IV methods have become a routine part of econometric analysis and, despite a lot of looseends (often hidden by asymptotic distributional theory), the topic of SEM was dormant until afew years ago. Roughly speaking, an instrument should have two basic properties: first, it shouldbe independent (or, at least, uncorrelated) with the disturbance term in the equation of interest(exogeneity); second, it should be correlated with the included endogenous explanatory variablesfor which it is supposed to serve as an instrument (relevance). The exogeneity requirement hasbeen well known from the very beginning of IV methods. The second one was also known from thetheory of identification, but its practical importance was not well appreciated and often hidden fromattention by lists of instruments relegated to footnotes (if not simply absent) in research papers. Itreturned to center stage with the discovery of so-called weak instruments, which can be interpretedas instruments with little relevance (i.e., weakly correlated with endogenous explanatory variables).Weak instruments lead to poor performance of standard econometric procedures and cases wherethey have pernicious effects may be difficult to detect.3 Interest in the problem also goes far beyondIV regressions and SEM, because it underscores the pitfalls in using large-sample approximations,as well as the importance of going back to basic statistical theory when developing econometricmethods.
A parameter (or a parameter vector) in a model is not identified when it is not possible todistinguish between alternative values of the parameter. In parametric models, this is typicallyinterpreted by stating that the postulated distribution of the data — as a function of the parametervector (the likelihood function) — can be the same for different values of the parameter vector.4
An important consequence of this sort of situation is a statistical impossibility: we cannot designa data-based procedure for distinguishing between equivalent parameter values (unless additionalinformation is introduced). In particular, no reasonable test can be produced.5 In nonparametricmodels, identification is more difficult to characterize because a likelihood function (involving afinite number of parameters) is not available and parameters are often introduced through moreabstract techniques (e.g., functionals of distribution functions). But the central problem is the same:can we distinguish between alternative values of the parameter? So, quite generally, an identificationproblem can be viewed as a special form of non-testability. Specifically,
• identification involves the possibility of distinguishing different parameter values on the basisof the corresponding data distributions, while
• testability refers to the possibility of designing procedures that can discriminate between sub-sets of parameter values.
2For reviews, see Phillips (1983) and Taylor (1983).3Early papers which called attention to the problem include: Nelson and Startz (1990a, 1990b), Buse (1992), Choi
and Phillips (1992), Maddala and Jeong (1992), and Bound, Jaeger, and Baker (1993, 1995).4For general expositions of the theory of identification in econometrics and statistics, the reader may consult Rothen-
berg (1971), Fisher (1976), Hsiao (1983), Prakasa Rao (1992), Bekker, Merckens, and Wansbeek (1994) and Manski(1995, 2003).
5By a reasonable test, we mean here a test that both satisfies a level constraint and may have power superior to thelevel when the tested hypothesis (the null hypothesis) does not hold. This will be discussed in greater detail below.
2
Alternatively, a problem of non-testability can be viewed as a form of non-identification (or un-deridentification). These problems are closely related. Furthermore, it is well known that one cancreate a non-identified model by introducing redundant parameters, and conversely identificationproblems can be eliminated by transforming the parameter space (e.g., by reducing the number ofparameters). Problems of non-identification are associated with bad parameterizations, inappro-priate choices of parameter representations. We will see below that the same remark applies quitegenerally to non-testability problems, especially in nonparametric setups.
In this paper, we pursue two main objectives: first, we analyze the statistical problems associatedwith non-identification within the broader context of testability; second, we review the inferentialissues linked to the possible presence of weak instruments in structural models. More precisely,regarding the issue of testability, the following points will be emphasized:
1. many models and hypotheses are formulated in ways that make them fundamentally non-testable; in particular, this tends to be the case in nonparametric setups;
2. such difficulties arise in basic apparently well-defined problems, such as: (a) testing an hy-pothesis about a mean when the observations are independent and identically distributed (i.i.d.; (b) testing an hypothesis about a mean (or a median) with heteroskedasticity of unknownform; (c) testing the unit root hypothesis on an autoregressive model whose order can bearbitrarily large;
3. some parameters tend to be non-testable (badly identified) in nonparametric models whileothers are not; in particular, non-testability easily occurs for moments (e.g., means, variances)while it does not for quantiles (e.g., medians); from this viewpoint, moments are not a goodway of representing the properties of distributions in nonparametric setups, while quantilesare;
4. these phenomena underscore parametric nonseparability problems: statements about a givenparameter (often interpreted as the parameter of interest) are not empirically meaningful with-out supplying information about other parameters (often called nuisance parameters); but hy-potheses that set both the parameter of interest and some nuisance parameters may well betestable in such circumstances, so that the development of appropriate inference proceduresshould start from a joint approach;
5. to the extent that asymptotic distributional theory is viewed as a way of producing statisticalmethods which are valid under “weak” distributional assumptions, it is fundamentally mis-leading because, under nonparametric assumptions, such approximations are arbitrarily badin finite samples.
Concerning weak instruments, we will review the associated problems and proposed solutions,with an emphasis on finite-sample properties and the development of tests and confidence sets whichare robust to the presence of weak instruments. In particular, the following points will be stressed:
1. in accordance with basic statistical theory, one should always look for pivots as the funda-mental ingredient for building tests and confidence sets; this principle appears to be especiallyimportant when identification problems are present;
3
2. parametric nonseparability arises in striking ways when some parameters may not be iden-tified, so that proper pivots may easily involve many more parameters than the parameter ofinterest; this also indicates that the common distinction between parameters of interest andnuisance parameters can be quite arbitrary, if not misleading;
3. important additional criteria for evaluating procedures in such contexts include various formsof invariance (or robustness), such as: (a) robustness to weak instruments; (b) robustnessto instrument exclusion; (c) robustness to the specification of the model for the endogenousexplanatory variables in the equation(s) of interest;
4. weak instrument problems underscore in a striking way the limitations of large-sample argu-ments for deriving and evaluating inference procedures;
5. very few informative pivotal functions have been proposed in the context of simultaneousequations models;
6. the early statistic proposed by Anderson and Rubin (1949, AR) constitutes one of the (veryrare) truly pivotal functions proposed for SEM; furthermore, it satisfies all the invarianceproperties listed above, so that it may reasonably be viewed as a fundamental building blockfor developing reliable inference procedures in the presence of weak instruments;
7. a fairly complete set of inference procedures that allow one to produce tests and confidencesets for all model parameters can be obtained through projection techniques;
8. various extensions and improvements over the AR method are possible, especially in improv-ing power; however, it is important to note that these often come at the expense of usinglarge-sample approximations or giving up robustness.
The literature on weak instruments is growing rapidly, and we cannot provide here a completereview. In particular, we will not discuss in any detail results on estimation, the detection of weakinstruments, or asymptotic theory in this context. For that purpose, we refer the reader to theexcellent survey recently published by Stock, Wright, and Yogo (2002).
The paper is organized as follows. In the next two sections, we review succinctly some basicnotions concerning models (section 2) and statistical theory (section 3), which are important forour discussion. In section 4, we study testability problems in nonparametric models. In section 5,we review the statistical difficulties associated with weak instruments. In section 6, we examine anumber of possible solutions in the context of linear SEM, while extensions to nonlinear or non-Gaussian models are considered in Section 7. We conclude in section 8.
2. Models
The purpose of econometric analysis is to develop mathematical representations of data, which wecall models or hypotheses (models subject to restrictions). An hypothesis should have two basicfeatures.
4

1. It must restrict the expected behavior of observations, be informative. A non-restrictive hy-pothesis says nothing and, consequently, does not teach us anything: it is empirically empty,void of empirical content. The more restrictive a model is, the more informative it is, and themore interesting it is.
2. It must be compatible with available data; ideally, we would like it to be true.
However, these two criteria are not always compatible:
1. the information criterion suggests the use of parsimonious models that usually take the formof parametric models based on strong assumptions; note the information criterion is empha-sized by an influential view in philosophy of science which stresses falsifiability as a criterionfor the scientific character of a theory [Popper (1968)];
2. in contrast, compatibility with observed data is most easily satisfied by vague models whichimpose few restrictions; vague models may take the form of parametric models with a largenumber of free parameters or nonparametric models which involve an infinite set of freeparameters and thus allow for weak assumptions.
Models can be classified as being either deterministic or stochastic. Deterministic models ,which claim to make arbitrarily precise predictions, are highly falsifiable but always inconsistentwith observed data. Accordingly, most models used in econometrics are stochastic. Such models areunverifiable: as with any theory that makes an indefinite number of predictions, we can never be surethat the model will not be put in jeopardy by new data. Moreover, they are logically unfalsifiable:in contrast with deterministic models, a probabilistic model is usually logically compatible with allpossible observation vectors.
Given these facts, it is clear any criterion for assessing whether an hypothesis is acceptable mustinvolve a conventional aspect. The purpose of hypothesis testing theory is to supply a coherentframework for accepting or rejecting probabilistic hypotheses. It is a probabilistic adaptation of thefalsification principle.6
3. Statistical notions
In this section, we review succinctly basic statistical notions which are essential for understandingthe rest of our discussion. The general outlook follows modern statistical testing theory, derivedfrom the Neyman-Pearson approach and described in standard textbooks, such as Lehmann (1986).
3.1. Hypotheses
Consider an observational experiment whose result can be represented by a vector of observations
X(n) = (X1, . . . , Xn)′ (3.1)
6For further discussion on the issues discussed in this section, the reader may consult Dufour (2000).
5
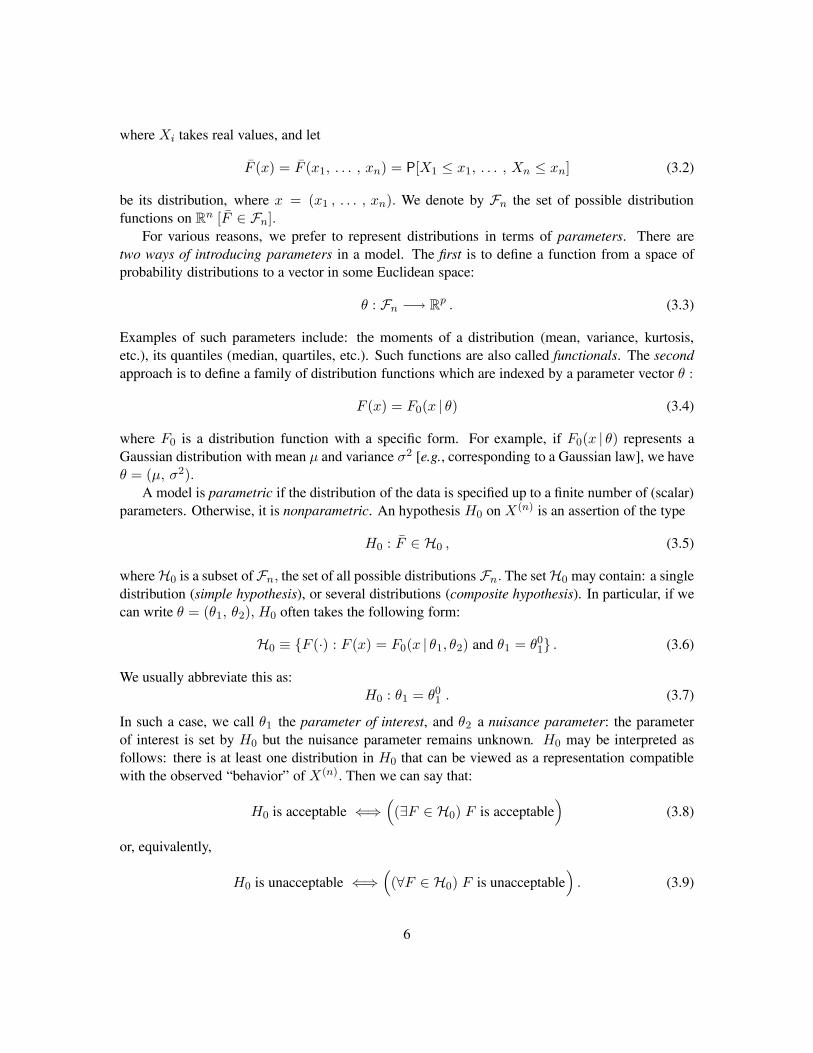
where Xi takes real values, and let
F (x) = F (x1, . . . , xn) = P[X1 ≤ x1, . . . , Xn ≤ xn] (3.2)
be its distribution, where x = (x1 , . . . , xn). We denote by Fn the set of possible distributionfunctions on R
n [F ∈ Fn].For various reasons, we prefer to represent distributions in terms of parameters. There are
two ways of introducing parameters in a model. The first is to define a function from a space ofprobability distributions to a vector in some Euclidean space:
θ : Fn −→ Rp . (3.3)
Examples of such parameters include: the moments of a distribution (mean, variance, kurtosis,etc.), its quantiles (median, quartiles, etc.). Such functions are also called functionals. The secondapproach is to define a family of distribution functions which are indexed by a parameter vector θ :
F (x) = F0(x | θ) (3.4)
where F0 is a distribution function with a specific form. For example, if F0(x | θ) represents aGaussian distribution with mean μ and variance σ2 [e.g., corresponding to a Gaussian law], we haveθ = (μ, σ2).
A model is parametric if the distribution of the data is specified up to a finite number of (scalar)parameters. Otherwise, it is nonparametric. An hypothesis H0 on X(n) is an assertion of the type
H0 : F ∈ H0 , (3.5)
where H0 is a subset ofFn, the set of all possible distributions Fn. The set H0 may contain: a singledistribution (simple hypothesis), or several distributions (composite hypothesis). In particular, if wecan write θ = (θ1, θ2), H0 often takes the following form:
H0 ≡ {F (·) : F (x) = F0(x | θ1, θ2) and θ1 = θ01} . (3.6)
We usually abbreviate this as:H0 : θ1 = θ0
1 . (3.7)
In such a case, we call θ1 the parameter of interest, and θ2 a nuisance parameter: the parameterof interest is set by H0 but the nuisance parameter remains unknown. H0 may be interpreted asfollows: there is at least one distribution in H0 that can be viewed as a representation compatiblewith the observed “behavior” of X(n). Then we can say that:
H0 is acceptable ⇐⇒((∃F ∈ H0) F is acceptable
)(3.8)
or, equivalently,
H0 is unacceptable ⇐⇒((∀F ∈ H0) F is unacceptable
). (3.9)
6
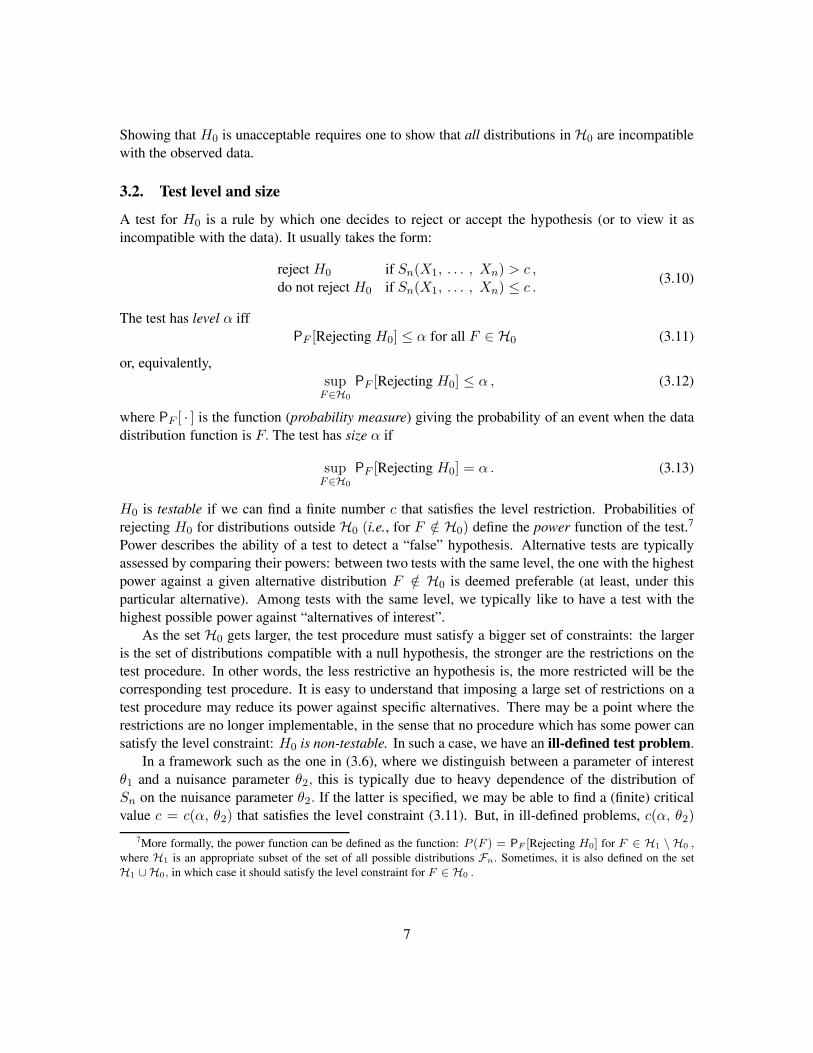
Showing that H0 is unacceptable requires one to show that all distributions in H0 are incompatiblewith the observed data.
3.2. Test level and size
A test for H0 is a rule by which one decides to reject or accept the hypothesis (or to view it asincompatible with the data). It usually takes the form:
reject H0 if Sn(X1, . . . , Xn) > c ,do not reject H0 if Sn(X1, . . . , Xn) ≤ c .
(3.10)
The test has level α iffPF [Rejecting H0] ≤ α for all F ∈ H0 (3.11)
or, equivalently,sup
F∈H0
PF [Rejecting H0] ≤ α , (3.12)
where PF [ · ] is the function (probability measure) giving the probability of an event when the datadistribution function is F. The test has size α if
supF∈H0
PF [Rejecting H0] = α . (3.13)
H0 is testable if we can find a finite number c that satisfies the level restriction. Probabilities ofrejecting H0 for distributions outside H0 (i.e., for F /∈ H0) define the power function of the test.7
Power describes the ability of a test to detect a “false” hypothesis. Alternative tests are typicallyassessed by comparing their powers: between two tests with the same level, the one with the highestpower against a given alternative distribution F /∈ H0 is deemed preferable (at least, under thisparticular alternative). Among tests with the same level, we typically like to have a test with thehighest possible power against “alternatives of interest”.
As the set H0 gets larger, the test procedure must satisfy a bigger set of constraints: the largeris the set of distributions compatible with a null hypothesis, the stronger are the restrictions on thetest procedure. In other words, the less restrictive an hypothesis is, the more restricted will be thecorresponding test procedure. It is easy to understand that imposing a large set of restrictions on atest procedure may reduce its power against specific alternatives. There may be a point where therestrictions are no longer implementable, in the sense that no procedure which has some power cansatisfy the level constraint: H0 is non-testable. In such a case, we have an ill-defined test problem.
In a framework such as the one in (3.6), where we distinguish between a parameter of interestθ1 and a nuisance parameter θ2, this is typically due to heavy dependence of the distribution ofSn on the nuisance parameter θ2. If the latter is specified, we may be able to find a (finite) criticalvalue c = c(α, θ2) that satisfies the level constraint (3.11). But, in ill-defined problems, c(α, θ2)
7More formally, the power function can be defined as the function: P (F ) = PF [Rejecting H0] for F ∈ H1 \ H0 ,where H1 is an appropriate subset of the set of all possible distributions Fn. Sometimes, it is also defined on the setH1 ∪H0, in which case it should satisfy the level constraint for F ∈ H0 .
7
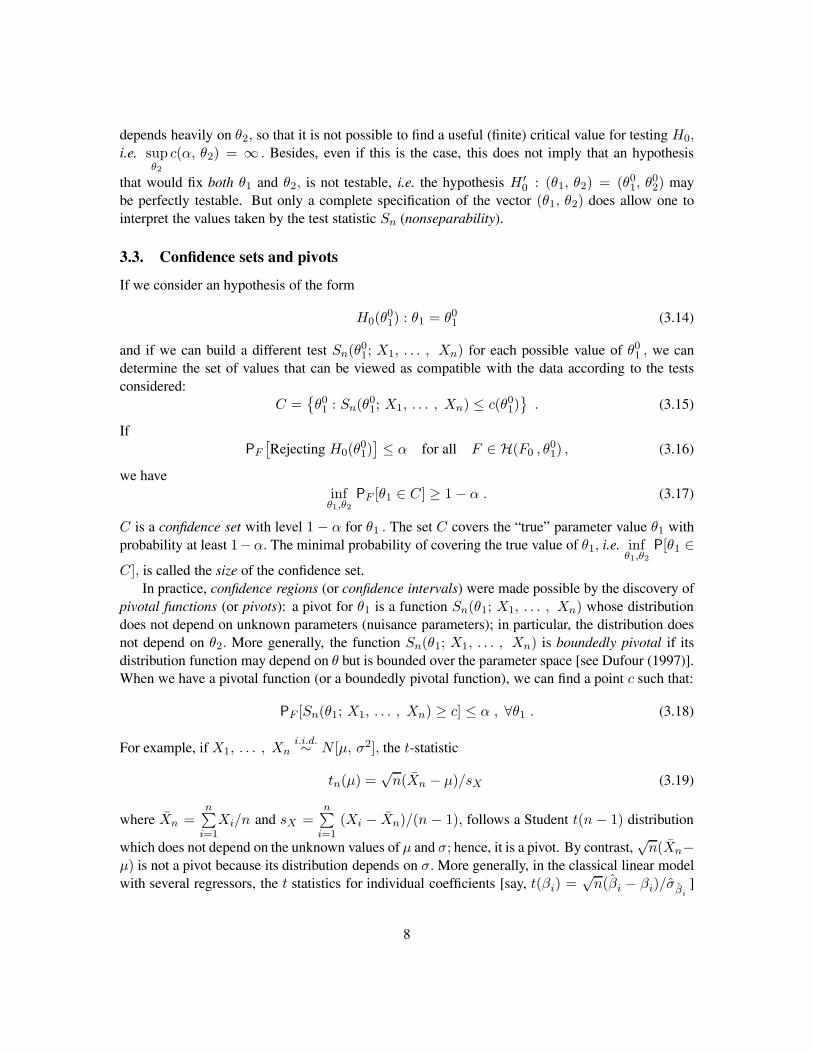
depends heavily on θ2, so that it is not possible to find a useful (finite) critical value for testing H0,i.e. sup
θ2
c(α, θ2) = ∞ . Besides, even if this is the case, this does not imply that an hypothesis
that would fix both θ1 and θ2, is not testable, i.e. the hypothesis H ′0 : (θ1, θ2) = (θ0
1, θ02) may
be perfectly testable. But only a complete specification of the vector (θ1, θ2) does allow one tointerpret the values taken by the test statistic Sn (nonseparability).
3.3. Confidence sets and pivots
If we consider an hypothesis of the form
H0(θ01) : θ1 = θ0
1 (3.14)
and if we can build a different test Sn(θ01; X1, . . . , Xn) for each possible value of θ0
1 , we candetermine the set of values that can be viewed as compatible with the data according to the testsconsidered:
C ={θ01 : Sn(θ0
1; X1, . . . , Xn) ≤ c(θ01)
}. (3.15)
IfPF
[Rejecting H0(θ0
1)]≤ α for all F ∈ H(F0 , θ0
1) , (3.16)
we haveinf
θ1,θ2
PF [θ1 ∈ C] ≥ 1 − α . (3.17)
C is a confidence set with level 1 − α for θ1 . The set C covers the “true” parameter value θ1 withprobability at least 1−α. The minimal probability of covering the true value of θ1, i.e. inf
θ1,θ2
P[θ1 ∈C], is called the size of the confidence set.
In practice, confidence regions (or confidence intervals) were made possible by the discovery ofpivotal functions (or pivots): a pivot for θ1 is a function Sn(θ1; X1, . . . , Xn) whose distributiondoes not depend on unknown parameters (nuisance parameters); in particular, the distribution doesnot depend on θ2. More generally, the function Sn(θ1; X1, . . . , Xn) is boundedly pivotal if itsdistribution function may depend on θ but is bounded over the parameter space [see Dufour (1997)].When we have a pivotal function (or a boundedly pivotal function), we can find a point c such that:
PF [Sn(θ1; X1, . . . , Xn) ≥ c] ≤ α , ∀θ1 . (3.18)
For example, if X1, . . . , Xni.i.d.∼ N [μ, σ2], the t-statistic
tn(μ) =√
n(Xn − μ)/sX (3.19)
where Xn =n∑
i=1Xi/n and sX =
n∑i=1
(Xi − Xn)/(n − 1), follows a Student t(n − 1) distribution
which does not depend on the unknown values of μ and σ; hence, it is a pivot. By contrast,√
n(Xn−μ) is not a pivot because its distribution depends on σ. More generally, in the classical linear modelwith several regressors, the t statistics for individual coefficients [say, t(βi) =
√n(βi − βi)/σβi
]
8
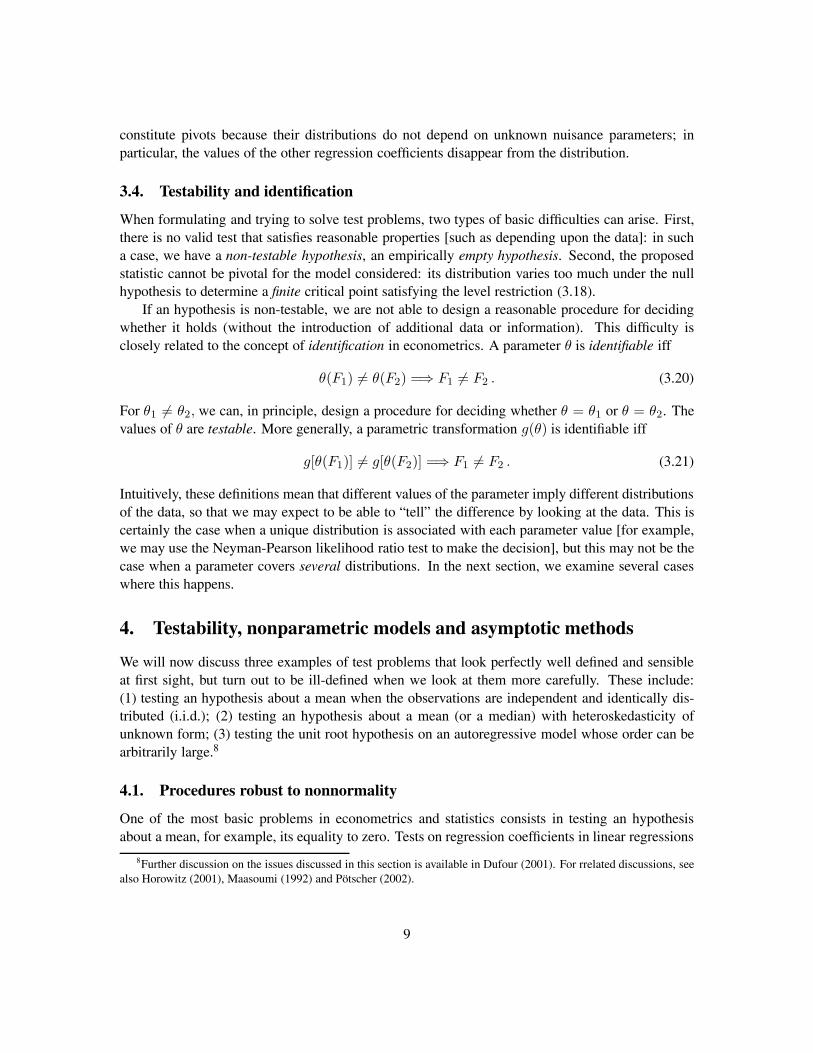
constitute pivots because their distributions do not depend on unknown nuisance parameters; inparticular, the values of the other regression coefficients disappear from the distribution.
3.4. Testability and identification
When formulating and trying to solve test problems, two types of basic difficulties can arise. First,there is no valid test that satisfies reasonable properties [such as depending upon the data]: in sucha case, we have a non-testable hypothesis, an empirically empty hypothesis. Second, the proposedstatistic cannot be pivotal for the model considered: its distribution varies too much under the nullhypothesis to determine a finite critical point satisfying the level restriction (3.18).
If an hypothesis is non-testable, we are not able to design a reasonable procedure for decidingwhether it holds (without the introduction of additional data or information). This difficulty isclosely related to the concept of identification in econometrics. A parameter θ is identifiable iff
θ(F1) �= θ(F2) =⇒ F1 �= F2 . (3.20)
For θ1 �= θ2, we can, in principle, design a procedure for deciding whether θ = θ1 or θ = θ2. Thevalues of θ are testable. More generally, a parametric transformation g(θ) is identifiable iff
g[θ(F1)] �= g[θ(F2)] =⇒ F1 �= F2 . (3.21)
Intuitively, these definitions mean that different values of the parameter imply different distributionsof the data, so that we may expect to be able to “tell” the difference by looking at the data. This iscertainly the case when a unique distribution is associated with each parameter value [for example,we may use the Neyman-Pearson likelihood ratio test to make the decision], but this may not be thecase when a parameter covers several distributions. In the next section, we examine several caseswhere this happens.
4. Testability, nonparametric models and asymptotic methods
We will now discuss three examples of test problems that look perfectly well defined and sensibleat first sight, but turn out to be ill-defined when we look at them more carefully. These include:(1) testing an hypothesis about a mean when the observations are independent and identically dis-tributed (i.i.d.); (2) testing an hypothesis about a mean (or a median) with heteroskedasticity ofunknown form; (3) testing the unit root hypothesis on an autoregressive model whose order can bearbitrarily large.8
4.1. Procedures robust to nonnormality
One of the most basic problems in econometrics and statistics consists in testing an hypothesisabout a mean, for example, its equality to zero. Tests on regression coefficients in linear regressions
8Further discussion on the issues discussed in this section is available in Dufour (2001). For rrelated discussions, seealso Horowitz (2001), Maasoumi (1992) and Pötscher (2002).
9
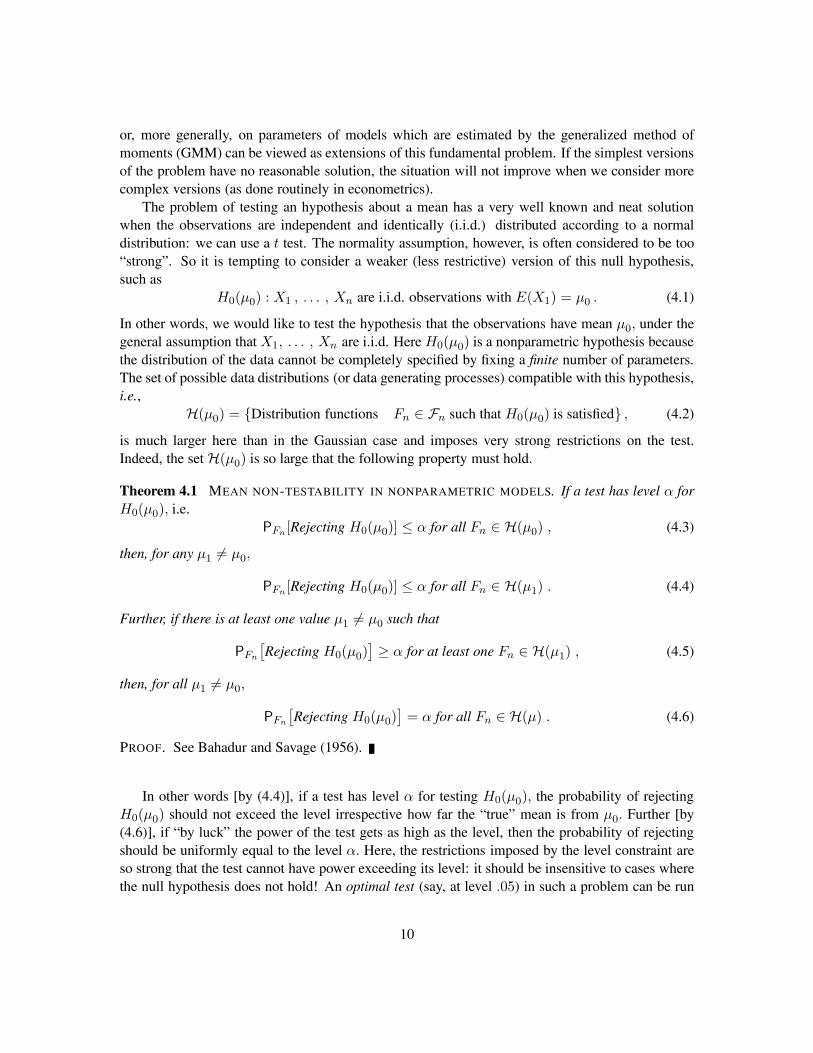
or, more generally, on parameters of models which are estimated by the generalized method ofmoments (GMM) can be viewed as extensions of this fundamental problem. If the simplest versionsof the problem have no reasonable solution, the situation will not improve when we consider morecomplex versions (as done routinely in econometrics).
The problem of testing an hypothesis about a mean has a very well known and neat solutionwhen the observations are independent and identically (i.i.d.) distributed according to a normaldistribution: we can use a t test. The normality assumption, however, is often considered to be too“strong”. So it is tempting to consider a weaker (less restrictive) version of this null hypothesis,such as
H0(μ0) : X1 , . . . , Xn are i.i.d. observations with E(X1) = μ0 . (4.1)
In other words, we would like to test the hypothesis that the observations have mean μ0, under thegeneral assumption that X1, . . . , Xn are i.i.d. Here H0(μ0) is a nonparametric hypothesis becausethe distribution of the data cannot be completely specified by fixing a finite number of parameters.The set of possible data distributions (or data generating processes) compatible with this hypothesis,i.e.,
H(μ0) = {Distribution functions Fn ∈ Fn such that H0(μ0) is satisfied} , (4.2)
is much larger here than in the Gaussian case and imposes very strong restrictions on the test.Indeed, the set H(μ0) is so large that the following property must hold.
Theorem 4.1 MEAN NON-TESTABILITY IN NONPARAMETRIC MODELS. If a test has level α forH0(μ0), i.e.
PFn [Rejecting H0(μ0)] ≤ α for all Fn ∈ H(μ0) , (4.3)
then, for any μ1 �= μ0,
PFn [Rejecting H0(μ0)] ≤ α for all Fn ∈ H(μ1) . (4.4)
Further, if there is at least one value μ1 �= μ0 such that
PFn
[Rejecting H0(μ0)
]≥ α for at least one Fn ∈ H(μ1) , (4.5)
then, for all μ1 �= μ0,
PFn
[Rejecting H0(μ0)
]= α for all Fn ∈ H(μ) . (4.6)
PROOF. See Bahadur and Savage (1956).
In other words [by (4.4)], if a test has level α for testing H0(μ0), the probability of rejectingH0(μ0) should not exceed the level irrespective how far the “true” mean is from μ0. Further [by(4.6)], if “by luck” the power of the test gets as high as the level, then the probability of rejectingshould be uniformly equal to the level α. Here, the restrictions imposed by the level constraint areso strong that the test cannot have power exceeding its level: it should be insensitive to cases wherethe null hypothesis does not hold! An optimal test (say, at level .05) in such a problem can be run
10
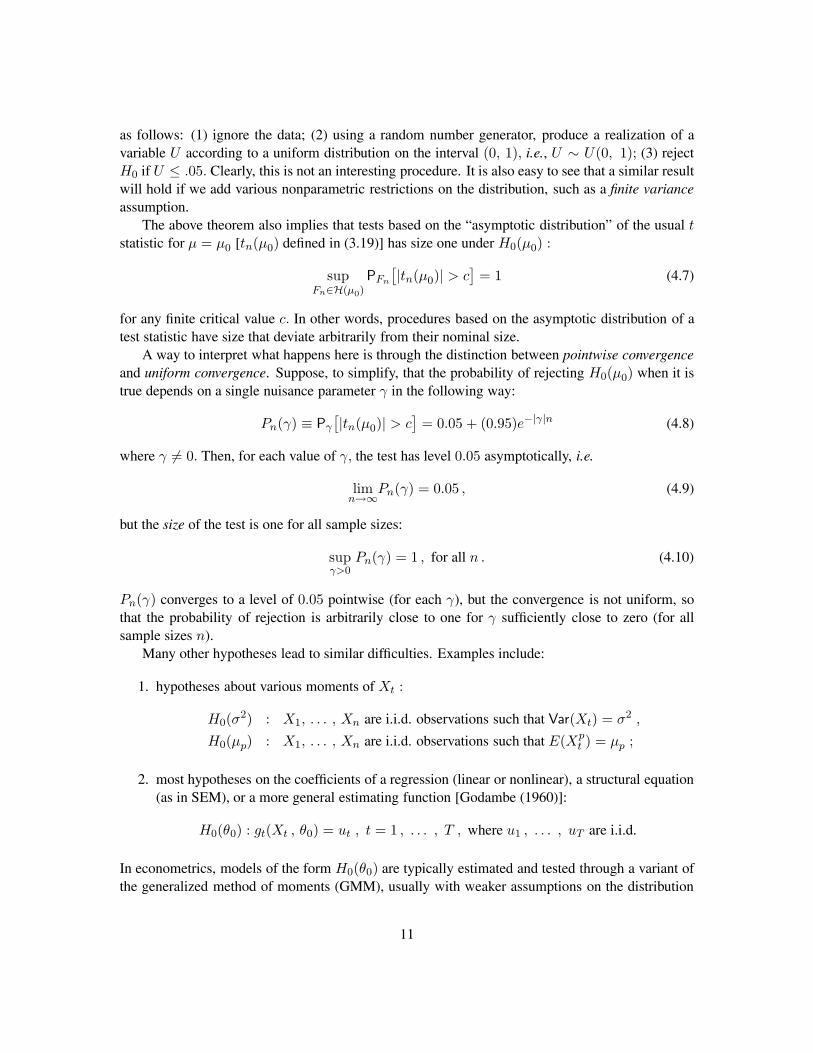
as follows: (1) ignore the data; (2) using a random number generator, produce a realization of avariable U according to a uniform distribution on the interval (0, 1), i.e., U ∼ U(0, 1); (3) rejectH0 if U ≤ .05. Clearly, this is not an interesting procedure. It is also easy to see that a similar resultwill hold if we add various nonparametric restrictions on the distribution, such as a finite varianceassumption.
The above theorem also implies that tests based on the “asymptotic distribution” of the usual tstatistic for μ = μ0 [tn(μ0) defined in (3.19)] has size one under H0(μ0) :
supFn∈H(μ0)
PFn
[|tn(μ0)| > c
]= 1 (4.7)
for any finite critical value c. In other words, procedures based on the asymptotic distribution of atest statistic have size that deviate arbitrarily from their nominal size.
A way to interpret what happens here is through the distinction between pointwise convergenceand uniform convergence. Suppose, to simplify, that the probability of rejecting H0(μ0) when it istrue depends on a single nuisance parameter γ in the following way:
Pn(γ) ≡ Pγ
[|tn(μ0)| > c
]= 0.05 + (0.95)e−|γ|n (4.8)
where γ �= 0. Then, for each value of γ, the test has level 0.05 asymptotically, i.e.
limn→∞
Pn(γ) = 0.05 , (4.9)
but the size of the test is one for all sample sizes:
supγ>0
Pn(γ) = 1 , for all n . (4.10)
Pn(γ) converges to a level of 0.05 pointwise (for each γ), but the convergence is not uniform, sothat the probability of rejection is arbitrarily close to one for γ sufficiently close to zero (for allsample sizes n).
Many other hypotheses lead to similar difficulties. Examples include:
1. hypotheses about various moments of Xt :
H0(σ2) : X1, . . . , Xn are i.i.d. observations such that Var(Xt) = σ2 ,
H0(μp) : X1, . . . , Xn are i.i.d. observations such that E(Xpt ) = μp ;
2. most hypotheses on the coefficients of a regression (linear or nonlinear), a structural equation(as in SEM), or a more general estimating function [Godambe (1960)]:
H0(θ0) : gt(Xt , θ0) = ut , t = 1 , . . . , T , where u1 , . . . , uT are i.i.d.
In econometrics, models of the form H0(θ0) are typically estimated and tested through a variant ofthe generalized method of moments (GMM), usually with weaker assumptions on the distribution
11
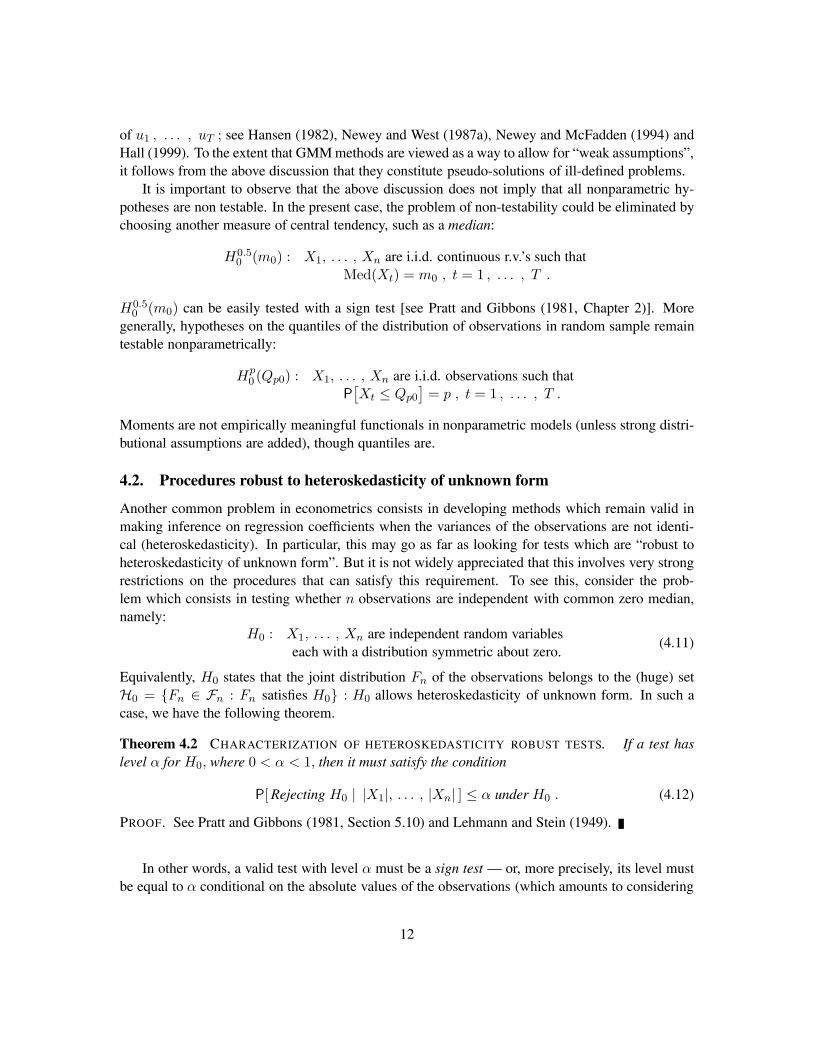
of u1 , . . . , uT ; see Hansen (1982), Newey and West (1987a), Newey and McFadden (1994) andHall (1999). To the extent that GMM methods are viewed as a way to allow for “weak assumptions”,it follows from the above discussion that they constitute pseudo-solutions of ill-defined problems.
It is important to observe that the above discussion does not imply that all nonparametric hy-potheses are non testable. In the present case, the problem of non-testability could be eliminated bychoosing another measure of central tendency, such as a median:
H0.50 (m0) : X1, . . . , Xn are i.i.d. continuous r.v.’s such that
Med(Xt) = m0 , t = 1 , . . . , T .
H0.50 (m0) can be easily tested with a sign test [see Pratt and Gibbons (1981, Chapter 2)]. More
generally, hypotheses on the quantiles of the distribution of observations in random sample remaintestable nonparametrically:
Hp0 (Qp0) : X1, . . . , Xn are i.i.d. observations such that
P[Xt ≤ Qp0
]= p , t = 1 , . . . , T .
Moments are not empirically meaningful functionals in nonparametric models (unless strong distri-butional assumptions are added), though quantiles are.
4.2. Procedures robust to heteroskedasticity of unknown form
Another common problem in econometrics consists in developing methods which remain valid inmaking inference on regression coefficients when the variances of the observations are not identi-cal (heteroskedasticity). In particular, this may go as far as looking for tests which are “robust toheteroskedasticity of unknown form”. But it is not widely appreciated that this involves very strongrestrictions on the procedures that can satisfy this requirement. To see this, consider the prob-lem which consists in testing whether n observations are independent with common zero median,namely:
H0 : X1, . . . , Xn are independent random variableseach with a distribution symmetric about zero.
(4.11)
Equivalently, H0 states that the joint distribution Fn of the observations belongs to the (huge) setH0 = {Fn ∈ Fn : Fn satisfies H0} : H0 allows heteroskedasticity of unknown form. In such acase, we have the following theorem.
Theorem 4.2 CHARACTERIZATION OF HETEROSKEDASTICITY ROBUST TESTS. If a test haslevel α for H0, where 0 < α < 1, then it must satisfy the condition
P[Rejecting H0 | |X1|, . . . , |Xn| ] ≤ α under H0 . (4.12)
PROOF. See Pratt and Gibbons (1981, Section 5.10) and Lehmann and Stein (1949).
In other words, a valid test with level α must be a sign test — or, more precisely, its level mustbe equal to α conditional on the absolute values of the observations (which amounts to considering
12
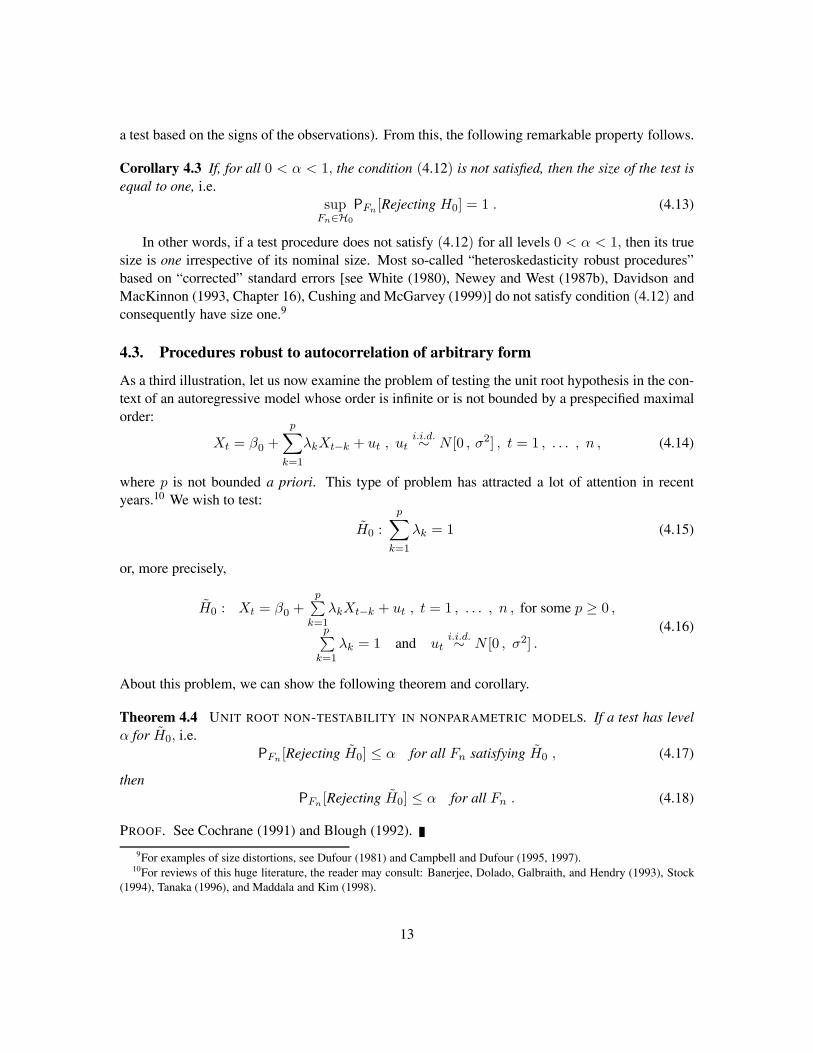
a test based on the signs of the observations). From this, the following remarkable property follows.
Corollary 4.3 If, for all 0 < α < 1, the condition (4.12) is not satisfied, then the size of the test isequal to one, i.e.
supFn∈H0
PFn [Rejecting H0] = 1 . (4.13)
In other words, if a test procedure does not satisfy (4.12) for all levels 0 < α < 1, then its truesize is one irrespective of its nominal size. Most so-called “heteroskedasticity robust procedures”based on “corrected” standard errors [see White (1980), Newey and West (1987b), Davidson andMacKinnon (1993, Chapter 16), Cushing and McGarvey (1999)] do not satisfy condition (4.12) andconsequently have size one.9
4.3. Procedures robust to autocorrelation of arbitrary form
As a third illustration, let us now examine the problem of testing the unit root hypothesis in the con-text of an autoregressive model whose order is infinite or is not bounded by a prespecified maximalorder:
Xt = β0 +p∑
k=1
λkXt−k + ut , uti.i.d.∼ N [0 , σ2] , t = 1 , . . . , n , (4.14)
where p is not bounded a priori. This type of problem has attracted a lot of attention in recentyears.10 We wish to test:
H0 :p∑
k=1
λk = 1 (4.15)
or, more precisely,
H0 : Xt = β0 +p∑
k=1
λkXt−k + ut , t = 1 , . . . , n , for some p ≥ 0 ,
p∑k=1
λk = 1 and uti.i.d.∼ N [0 , σ2] .
(4.16)
About this problem, we can show the following theorem and corollary.
Theorem 4.4 UNIT ROOT NON-TESTABILITY IN NONPARAMETRIC MODELS. If a test has levelα for H0, i.e.
PFn [Rejecting H0] ≤ α for all Fn satisfying H0 , (4.17)
thenPFn [Rejecting H0] ≤ α for all Fn . (4.18)
PROOF. See Cochrane (1991) and Blough (1992).
9For examples of size distortions, see Dufour (1981) and Campbell and Dufour (1995, 1997).10For reviews of this huge literature, the reader may consult: Banerjee, Dolado, Galbraith, and Hendry (1993), Stock
(1994), Tanaka (1996), and Maddala and Kim (1998).
13
Corollary 4.5 If, for all 0 < α < 1, the condition (4.18) is not satisfied, then the size of the test isequal to one, i.e.
supFn∈H0
PFn [Rejecting H0] = 1
where H0 is the set of all data distributions Fn that satisfy H0.
As in the mean problem, the null hypothesis is simply too “large” (unrestricted) to allow testingfrom a finite data set. Consequently, all procedures that claim to offer corrections for very generalforms of serial dependence [e.g., Phillips (1987), Phillips and Perron (1988)] are affected by theseproblems: irrespective of the nominal level of the test, the true size under the hypothesis H0 is equalto one.
To get a testable hypothesis, it is essential to fix jointly the order of the AR process (i.e., anumerical upper bound on the order) and the sum of the coefficients: for example, we could considerthe following null hypothesis where the order of the autoregressive process is equal to 12:
H0(12) : Xt = β0 +12∑
k=1
λkXt−k + ut , t = 1 , . . . , n ,
12∑k=1
λk = 1 and uti.i.d.∼ N [0 , σ2] .
(4.19)
The order of the autoregressive process is an essential part of the hypothesis: it is not possible toseparate inference on the unit root hypothesis from inference on the order of the process. Similardifficulties will also occur for most other hypotheses on the coefficients of (4.16). For furtherdiscussion of this topic, the reader may consult Sims (1971a, 1971b), Blough (1992), Faust (1996,1999) and Pötscher (2002).
5. Structural models and weak instruments
Several authors in the past have noted that usual asymptotic approximations are not valid or lead tovery inaccurate results when parameters of interest are close to regions where these parameters areno longer identifiable. The literature on this topic is now considerable.11 In this section, we shallexamine these issues in the context of SEM.
11See Sargan (1983), Phillips (1984, 1985, 1989), Gleser and Hwang (1987), Koschat (1987), Phillips (1989), Hillier(1990), Nelson and Startz (1990a, 1990b), Buse (1992), Choi and Phillips (1992), Maddala and Jeong (1992), Bound,Jaeger, and Baker (1993, 1995), Dufour and Jasiak (1993, 2001), McManus, Nankervis, and Savin (1994), Angrist andKrueger (1995), Hall, Rudebusch, and Wilcox (1996), Dufour (1997), Shea (1997), Staiger and Stock (1997), Wang andZivot (1998), Zivot, Startz, and Nelson (1998), Hall and Peixe (2000), Stock and Wright (2000), Hahn and Hausman(2002a, 2002b, 2002c), Hahn, Hausman, and Kuersteiner (2001), Dufour and Taamouti (2000, 2001b, 2001a), Startz,Nelson, and Zivot (2001), Kleibergen (2001b, 2001a, 2002a, 2002b, 2003), Bekker (2002), Bekker and Kleibergen (2001),Chao and Swanson (2001, 2003), Moreira (2001, 2003a, 2003b), Moreira and Poi (2001), Stock and Yogo (2002, 2003),Stock, Wright, and Yogo (2002)], Wright (2003, 2002), Imbens and Manski (2003), Kleibergen and Zivot (2003), Perron(2003), and Zivot, Startz, and Nelson (2003).
14
5.1. Standard simultaneous equations model
Let us consider the standard simultaneous equations model:
y = Y β + X1γ + u , (5.1)
Y = X1Π1 + X2Π2 + V , (5.2)
where y and Y are T × 1 and T × G matrices of endogenous variables, X1 and X2 are T × k1
and T × k2 matrices of exogenous variables, β and γ are G × 1 and k1 × 1 vectors of unknowncoefficients, Π1 and Π2 are k1×G and k2×G matrices of unknown coefficients, u = (u1, . . . , uT )′
is a T × 1 vector of structural disturbances, and V = [V1, . . . , VT ]′ is a T × G matrix of reduced-form disturbances. Further,
X = [X1, X2] is a full-column rank T × k matrix (5.3)
where k = k1 + k2. Finally, to get a finite-sample distributional theory for the test statistics, weshall use the following assumptions on the distribution of u :
u and X are independent; (5.4)
u ∼ N[0, σ2
u IT
]. (5.5)
(5.4) may be interpreted as the strict exogeneity of X with respect to u.Note that the distribution of V is not otherwise restricted; in particular, the vectors V1, . . . , VT
need not follow a Gaussian distribution and may be heteroskedastic. Below, we shall also considerthe situation where the reduced-form equation for Y includes a third set of instruments X3 whichare not used in the estimation:
Y = X1Π1 + X2Π2 + X3Π3 + V (5.6)
where X3 is a T ×k3 matrix of explanatory variables (not necessarily strictly exogenous); in partic-ular, X3 may be unobservable. We view this situation as important because, in practice, it is quiterare that one can consider all the relevant instruments that could be used. Even more generally, wecould also assume that Y obeys a general nonlinear model of the form:
Y = g(X1, X2, X3, V, Π) (5.7)
where g(·) is a possibly unspecified nonlinear function and Π is an unknown parameter matrix.The model presented in (5.1) - (5.2) can be rewritten in reduced form as:
y = X1π1 + X2π2 + v , (5.8)
Y = X1Π1 + X2Π2 + V , (5.9)
15
where π1 = Π1β + γ , v = u + V β , and
π2 = Π2β . (5.10)
Suppose now that we are interested in making inference about β.(5.10) is the crucial equation governing identification in this system: we need to be able to
recover β from the values of the regression coefficients π2 and Π2. The necessary and sufficientcondition for identification is the well-known rank condition for the identification of β :
β is identifiable iff rank(Π2) = G . (5.11)
We have a weak instrument problem when either rank(Π2) < k2 (non-identification), or Π2 isclose to having deficient rank [i.e., rank(Π2) = k2 with strong linear dependence between the rows(or columns) of Π2]. There is no compelling definition of the notion of near-nonidentification, butreasonable characterizations include the condition that det(Π ′
2Π2) is “close to zero”, or that Π ′2Π2
has one or several eigenvalues “close to zero”.Weak instruments are notorious for causing serious statistical difficulties on several fronts: (1)
parameter estimation; (2) confidence interval construction; (3) hypothesis testing. We now considerthese problems in greater detail.
5.2. Statistical problems associated with weak instruments
The problems associated with weak instruments were originally discovered through its conse-quences for estimation. Work in this area includes:
1. theoretical work on the exact distribution of two-stage least squares (2SLS) and other “con-sistent” structural estimators and test statistics [Phillips (1983), Phillips (1984), Rothenberg(1984), Phillips (1985), Phillips (1989), Hillier (1990), Nelson and Startz (1990a), Nelsonand Startz (1990a), Buse (1992), Maddala and Jeong (1992), Choi and Phillips (1992), Du-four (1997)];
2. weak-instrument (local to non-identification) asymptotics [Staiger and Stock (1997), Wangand Zivot (1998), Stock and Wright (2000)];
3. empirical examples [Bound, Jaeger, and Baker (1995)].
The main conclusions of this research can be summarized as follows.
1. Theoretical results show that the distributions of various estimators depend in a complicatedway on unknown nuisance parameters. Thus, they are difficult to interpret.
2. When identification conditions are not satisfied, standard asymptotic theory for estimatorsand test statistics typically collapses.
3. With weak instruments,
16
(a) the 2SLS estimator becomes heavily biased [in the same direction as ordinary leastsquares (OLS)];
(b) the distribution of the 2SLS estimator is quite far from the normal distribution (e.g.,bimodal).
4. A striking illustration of these problems appears in the reconsideration by Bound, Jaeger, andBaker (1995) of a study on returns to education by Angrist and Krueger (1991). Using 329000observations, these authors found that replacing the instruments used by Angrist and Krueger(1991) with randomly generated (totally irrelevant) instruments produced very similar pointestimates and standard errors. This result indicates that the original instruments were weak.
For a more complete discussion of estimation with weak instruments, the reader may consult Stock,Wright, and Yogo (2002).
5.3. Characterization of valid tests and confidence sets
Weak instruments also lead to very serious problems when one tries to perform tests or build confi-dence intervals on the parameters of the model. Consider the general situation where we have twoparameters θ1 and θ2 [i.e., θ = ( θ1, θ2)] such that θ2 is no longer identified when θ1 takes a certainvalue, say θ1 = θ0
1 :L(y | θ1, θ2) ≡ L(y | θ0
1) . (5.12)
Theorem 5.1 CHARACTERIZATION OF VALID CONFIDENCE SET FOR A POSSIBLY UNIDENTI-FIED PARAMETER. If θ2 is a parameter whose value is not bounded, then the confidence region Cwith level 1 − α for θ2 must have the following property:
Pθ[C is unbounded] > 0 (5.13)
and, if θ1 = θ01,
Pθ[C is unbounded] ≥ 1 − α . (5.14)
PROOF. See Dufour (1997).
Corollary 5.2 If C does not satisfy the property given in the previous theorem, its size must be zero.
This will be the case, in particular, for any Wald-type confidence interval, obtained by assumingthat
tθ2
=θ2 − θ2
σθ2
approx∼ N(0, 1) , (5.15)
which yields confidence intervals of the form θ2 − cσθ2 ≤ θ2 ≤ θ2 + cσθ2 , where P[|N(0, 1)| >c] ≤ α . By the above corollary, this type of interval has level zero, irrespective of the critical valuec used:
infθ
Pθ
[θ2 − cσθ2 ≤ θ2 ≤ θ2 + cσθ2
]= 0 . (5.16)
17
In such situations, the notion of standard error loses its usual meaning and does not constitute a validbasis for building confidence intervals. In SEM, for example, this applies to standard confidenceintervals based on 2SLS estimators and their asymptotic “standard errors”.
Correspondingly, if we wish to test an hypothesis of form H0 : θ2 = θ02 , the size of any test of
the form ∣∣∣tθ2(θ0
2)∣∣∣ =
∣∣∣∣∣ θ2 − θ02
σθ2
∣∣∣∣∣ > c(α) (5.17)
will deviate arbitrarily from its nominal size. No unique large-sample distribution for tθ2
can providevalid tests and confidence intervals based on the asymptotic distribution of t
θ2. From a statistical
viewpoint, this means that tθ2
is not a pivotal function for the model considered. More generally,this type of problem affects the validity of all Wald-type methods, which are based on comparingparameter estimates with their estimated covariance matrix.
By contrast, in models of the form (5.1) - (5.5), the distribution of the LR statistics for mosthypotheses on model parameters can be bounded and cannot move arbitrarily: likelihood ratios areboundedly pivotal functions and provide a valid basis for testing and confidence set construction[see Dufour (1997)].
The central conclusion here is: tests and confidence sets on the parameters of a structural modelshould be based on proper pivots.
6. Approaches to weak instrument problems
What should be the features of a satisfactory solution to the problem of making inference in struc-tural models? We shall emphasize here four properties: (1) the method should be based on properpivotal functions (ideally, a finite-sample pivot); (2) robustness to the presence of weak instruments;(3) robustness to excluded instruments; (4) robustness to the formulation of the model for the ex-planatory endogenous variables Y (which is desirable in many practical situations).
In the light of these criteria, we shall first discuss the Anderson-Rubin procedure, which in ourview is the reference method for dealing with weak instruments in the context of standard SEM,second the projection technique which provides a general way of making a wide spectrum of testsand confidence sets, and third several recent proposals aimed at improving and extending the ARprocedure.
6.1. Anderson-Rubin statistic
A solution to testing in the presence of weak instruments has been available for more than 50years [Anderson and Rubin (1949)] and is now center stage again [Dufour (1997), Staiger andStock (1997)]. Interestingly, the AR method can be viewed as an alternative way of exploiting“instruments” for inference on a structural model, although it pre-dates the introduction of 2SLSmethods in SEM [Theil (1953), Basmann (1957)], which later became the most widely used methodfor estimating linear structural equations models.12 The basic problem considered consists in testing
12The basic ideas for using instrumental variables for inference on structural relationships appear to go back to Working(1927) and Wright (1928). For an interesting discussion of the origin of IV methods in econometrics, see Stock and Trebbi
18
the hypothesisH0(β0) : β = β0 (6.1)
in model (5.1) - (5.4). In order to do that, we consider an auxiliary regression obtained by subtractingY β0 from both sides of (5.1) and expanding the right-hand side in terms of the instruments. Thisyields the regression
y − Y β0 = X1θ1 + X2θ2 + ε (6.2)
where θ1 = γ +Π1(β −β0), θ2 = Π2(β −β0) and ε = u+V (β−β0) . Under the null hypothesisH0(β0), this equation reduces to
y − Y β0 = X1θ1 + ε , (6.3)
so we can test H0(β0) by testing H ′0(β0) : θ2 = 0, in the auxiliary regression (6.2). This yields the
following F-statistic — the Anderson-Rubin statistic — which follows a Fisher distribution underthe null hypothesis:
AR(β0) =[SS0(β0) − SS1(β0)]/k2
SS1(β0)/(T − k)∼ F (k2, T − k) (6.4)
where SS0(β0) = (y −Y β0)′M(X1)(y −Y β0) and SS1(β0) = (y − Y β0)′M(X)(y − Y β0); forany full-rank matrix A, we denote P (A) = A(A′A)−1A′ and M(A) = I− P (A). What plays thecrucial role here is the fact that we have instruments (X2) that can be related to Y but are excludedfrom the structural equation. To draw inference on the structural parameter β, we “hang” on thevariables in X2 : if we add X2 to the constrained structural equation (6.3), its coefficient should bezero. For these reasons, we shall call the variables in X2 auxiliary instruments.
Since the latter statistic is a proper pivot, it can be used to build confidence sets for β :
Cβ(α) = {β0 : AR(β0) ≤ Fα(k2, T − k)} (6.5)
where Fα(k2, T − k) is the critical value for a test with level α based on the F (k2, T − k) distri-bution. When there is only one endogenous explanatory variable (G = 1), this set has an explicitsolution involving a quadratic inequation, i.e.
Cβ(α) = {β0 : aβ20 + bβ0 + c ≤ 0} (6.6)
where a = Y ′HY, H ≡ M(X1) − M(X) [1 + k2Fα(k2, T − k)/(T − k)] , b = −2Y ′Hy, andc = y′Hy . The set Cβ(α) may easily be determined by finding the roots of the quadratic polynomialin equation (6.6); see Dufour and Jasiak (2001) and Zivot, Startz, and Nelson (1998) for details.
When G > 1, the set Cβ(α) is not in general an ellipsoid, but it remains fairly manageableby using the theory of quadrics [Dufour and Taamouti (2000)]. When the model is correct and itsparameters are well identified by the instruments used, Cβ(α) is a closed bounded set close to anellipsoid. In other cases, it can be unbounded or empty. Unbounded sets are highly likely whenthe model is not identified, so they point to lack of identification. Empty confidence sets can occur(with a non-zero probability) when we have more instruments than parameters in the structural
(2003).
19
equation (5.1), i.e. the model is overidentified. An empty confidence set means that no value ofthe parameter vector β is judged to be compatible with the available data, which indicates that themodel is misspecified. So the procedure provides as an interesting byproduct a specification test.13
It is also easy to see that the above procedure remains valid even if the extended reduced form(5.6) is the correct model for Y. In other words, we can leave out a subset of the instruments (X3)and use only X2 : the level of the procedure will not be affected. Indeed, this will also hold ifY is determined by the general — possibly nonlinear — model (5.7). The procedure is robust toexcluded instruments as well as to the specification of the model for Y. The power of the test maybe affected by the choice of X2, but its level is not. Since it is quite rare an investigator can be surerelevant instruments have not been left out, this is an important practical consideration.
The AR procedure can be extended easily to deal with linear hypotheses which involve γ aswell. For example, to test an hypothesis of the form
H0(β0, γ0) : β = β0 and γ = γ0 , (6.7)
we can consider the transformed model
y − Y β0 − X1γ0 = X1θ1 + X2θ2 + ε . (6.8)
Since, under H0(β0, γ0),y − Y β0 − X1γ0 = ε , (6.9)
we can test H0(β0, γ0) by testing H ′0(β0, γ0) : θ1 = 0 and θ2 = 0 in the auxiliary regression (6.8);
see Maddala (1974). Tests for more general restrictions of the form
H0(β0, ν0) : β = β0 and Rγ = ν0 , (6.10)
where R is a r × K fixed full-rank matrix, are discussed in Dufour and Jasiak (2001).The AR procedure thus enjoys several remarkable features. Namely, it is: (1) pivotal in finite
samples; (2) robust to weak instruments; (3) robust to excluded instruments; (4) robust to the spec-ification of the model for Y (which can be nonlinear with an unknown form); further, (5) the ARmethod provides asymptotically “valid” tests and confidence sets under quite weak distributionalassumptions (basically, the assumptions that cover the usual asymptotic properties of linear regres-sion); and (6) it can be extended easily to test restrictions and build confidence sets which alsoinvolve the coefficients of the exogenous variables, such as H0(β0, ν0) in (6.10).
But the method also has its drawbacks. The main ones are: (1) the tests and confidence setsobtained in this way apply only to the full vector β [or (β′, γ′)′]; what can we do, if β has more thanone element? (2) power may be low if too many instruments are added (X2 has too many variables)to perform the test, especially if the instruments are irrelevant; (3) the error normality assumption isrestrictive and we may wish to consider other distributional assumptions; (4) the structural equationsare assumed to be linear. We will now discuss a number of methods which have been proposed inorder to circumvent these drawbacks.
13For further discussion of this point, see Kleibergen (2002b).
20
6.2. Projections and inference on parameter subsets
Suppose now that β [or (β′, γ′)′] has more than one component. The fact that a procedure with afinite-sample theory has been obtained for “joint hypotheses” of the form H0(β0) [or H0(β0, γ0)]is not due to chance: since the distribution of the data is determined by the full parameter vector,there is no reason in general why one should be able to decide on the value of a component ofβ independently of the others. Such a separation is feasible only in special situations, e.g. in theclassical linear model (without exact multicollinearity). Lack of identification is precisely a situationwhere the value of a parameter may be determined only after various restrictions (e.g., the valuesof other parameters) have been imposed. So parametric nonseparability arises here, and inferenceshould start from a simultaneous approach. If the data generating process corresponds to a modelwhere parameters are well identified, precise inferences on individual coefficients may be feasible.This raises the question how one can move from a joint inference on β to its components.
A general approach to this problem consists in using a projection technique. If
P[β ∈ Cβ(α)] ≥ 1 − α , (6.11)
then, for any function g(β),P[g(β) ∈ g [Cβ(α)]
]≥ 1 − α . (6.12)
If g(β) is a component of β or (more generally) a linear transformation g(β) = w′β, the confidenceset for a linear combination of the parameters, say w′β takes the usual form [w′β− σzα, w′β+ σzα]with β a k-class type estimator of β; see Dufour and Taamouti (2000).14
Another interesting feature comes from the fact that the confidence sets obtained in this way aresimultaneous in the sense of Scheffé. More precisely, if {ga(β) : a ∈ A} is a set of functions of β,then
P[ga(β) ∈ g [Cβ(α)] for all a ∈ A
]≥ 1 − α . (6.13)
If these confidence intervals are used to test different hypotheses, an unlimited number of hypothesescan be tested without losing control of the overall level.
6.3. Alternatives to the AR procedure
In view of improving the power of AR procedures, a number of alternative methods have beenrecently suggested. We will now discuss several of them.
a. Generalized auxiliary regression A general approach to the problem of testing H0(β0) con-sists in replacing X2 in the auxiliary regression
y − Y β0 = X1θ1 + X2θ2 + ε (6.14)
14g [Cβ(α)] takes the form of a bounded confidence interval as soon as the confidence set g [Cβ(α)] is unbounded.For further discussion of projection methods, the reader may consult Dufour (1990, 1997), Campbell and Dufour (1997),Abdelkhalek and Dufour (1998), Dufour, Hallin, and Mizera (1998), Dufour and Kiviet (1998), and Dufour and Jasiak(2001).
21

by an alternative set of auxiliary instruments, say Z of dimension T × k2. In other words, weconsider the generalized auxiliary regression
y − Y β0 = X1θ1 + Zθ2 + ε (6.15)
where θ2 = 0 under H0(β0). So we can test H0(β0) by testing θ2 = 0 in (6.15). Then the problemconsists in selecting Z so that the level can be controlled and power may be improved with respectto the AR auxiliary regression (6.14). For example, it is easy to see that the power of the AR testcould become low if a large set of auxiliary instruments is used, especially if the latter are weak.So several alternative procedures can be generated by reducing the number of auxiliary instruments(the number of columns in Z).
At the outset, we should note that, if (5.2) were the correct model and Π = [Π1, Π2] wereknown, then an optimal choice from the viewpoint of power consists in choosing Z = X2Π2;see Dufour and Taamouti (2001b). The practical problem, of course, is that Π2 is unknown. Thissuggests that we replace X2Π2 by an estimate, such as
Z = X2Π2 (6.16)
where Π2 is an estimate of the reduced-form coefficient Π2 in (5.2). The problem then consists inchoosing Π. For that purpose, it is tempting to use the least squares estimator Π = (X ′X)−1X ′Y.However, Π and ε are not independent and we continue to face a simultaneity problem with messydistributional consequences. Ideally, we would like to select an estimate Π2 which is independentof ε.
b. Split-sample optimal auxiliary instruments If we can assume that the error vectors(ut, V
′t )′, t = 1, . . . , T, are independent, this approach to estimating Π may be feasible by using
a split-sample technique: a fraction of the sample is used to obtain Π and the rest to estimate theauxiliary regression (6.15) with Z = X2Π2. Under such circumstances, by conditioning on Π, wecan easily see that the standard F test for θ2 = 0 is valid. Further, this procedure is robust to weakinstruments, excluded instruments as well as the specification of the model for Y [i.e., under thegeneral assumptions (5.6) or (5.7)], as long as the independence between Π and ε can be main-tained. Of course, using a split-sample may involve a loss of the effective number of observationsand there will be a trade-off between the efficiency gain from using a smaller number of auxiliaryinstruments and the observations that are “sacrificed” to get Π. Better results tend to be obtained byusing a relatively small fraction of the sample to obtain Π — 10% for example — and the rest forthe main equation. For further details on this procedure, the reader may consult Dufour and Jasiak(2001) and Kleibergen (2002a).15
A number of alternative procedures can be cast in the framework of equation (6.15).
c. LM-type GMM-based statistic If we take Z = ZWZ with
ZWZ = P [M(X1)X2]Y = P [M(X1)X2]M(X1)Y = [M(X1)X2]Π2 , (6.17)
15Split-sample techniques often lead to important distributional simplifications; for further discussion of this type ofmethod, see Angrist and Krueger (1995) and Dufour and Torrès (1998, 2000).
22
Π2 = [X ′2M(X1)X2]−1X ′
2M(X1)Y , (6.18)
the F-statistic [say, FGMM (β0)] for θ2 = 0 is a monotonic transformation of the LM-type statisticLMGMM (β0) proposed by Wang and Zivot (1998). Namely,
FGMM (β0) =(
T − k1 − G
GT
)LMGMM (β0)
1 − (1/T )LMGMM (β0)(6.19)
where
LMGMM (β0) =(y − Y β0)′P [ZWZ ](y − Y β0)
(y − Y β0)′M(X1)(y − Y β0)/T. (6.20)
Note that Π2 above is the ordinary least squares (OLS) estimator of Π2 from the multivariate re-gression (5.2), so that FGMM (β0) can be obtained by computing the F-statistic for θ∗2 = 0 in theregression
y − Y β0 = X1θ∗1 + (X2Π2)θ∗2 + u . (6.21)
When k2 ≥ G, the statistic FGMM (β0) can also be obtained by testing θ∗∗2 = 0 in the auxiliaryregression
y − Y β0 = X1θ∗∗1 + Y θ∗∗2 + u (6.22)
where Y = XΠ. It is also interesting to note that the OLS estimates of θ∗∗1 and θ∗∗2 , obtained byfitting the latter equation, are identical to the 2SLS estimates of θ∗∗1 and θ∗∗2 in the equation
y − Y β0 = X1θ∗∗1 + Y θ∗∗2 + u . (6.23)
The LMGMM test may thus be interpreted as an approximation to the optimal test based on re-placing the optimal auxiliary instrument X2Π2 by X2Π2. The statistic LMGMM (β0) is also nu-merically identical to the corresponding LR-type and Wald-type tests, based on the same GMMestimator (in this case, the 2SLS estimator of β).
As mentioned above, the distribution of this statistic will be affected by the fact that X2Π2 andu are not independent. In particular, it is influenced by the presence of weak instruments. ButWang and Zivot (1998) showed that the distribution of LMGMM(β0) is bounded by the χ2(k2)asymptotically. When k2 = G (usually deemed the “just-identified” case, although the model maybe under-identified in that case), we see easily [from (6.21)] that FGMM (β0) is (almost surely)identical with the AR statistic, i.e.
FGMM (β0) = AR(β0) if k2 = G , (6.24)
so that FGMM (β0) follows an exact F (G, T − k) distribution, while for k2 > G,
GFGMM (β0) ≤(
T − k1 − G
T − k1 − k2
)k2 AR(β0) , (6.25)
so that the distribution of LMGMM (β0) can be bounded in finite samples by the distribution of amonotonic transformation of a F (k2, T −k) variable [which, for T large, is very close to the χ2(k2)
23
distribution]. But, for T reasonably large, AR(β0) will always reject when FGMM (β0) rejects (at agiven level), so the power of the AR test is uniformly superior to that of the LMGMM bound test.16
d. Kleibergen’s K test If we take Z = ZK with
ZK = P (X)[Y − (y − Y β0)
sεV (β0)sεε(β0)
]= XΠ(β0) ≡ Y (β0) , (6.26)
Π(β0) = Π − π(β0)sεV (β0)sεε(β0)
, Π = (X ′X)−1X ′Y , (6.27)
π(β0) = (X ′X)−1X ′(y − Y β0) , sεV (β0) =1
T − k(y − Y β0)
′M(X)Y , (6.28)
sεε(β0) =(y − Y β0)′M(X)(y − Y β0)
T − k, (6.29)
we obtain a statistic, which reduces to the one proposed by Kleibergen (2002a) for k1 = 0. Moreprecisely, with k1 = 0, the F-statistic FK(β0) for θ2 = 0 is equal to Kleibergen’s statistic K(β0)divided by G :
FK(β0) = K(β0)/G . (6.30)
This procedure tries to correct the simultaneity problem associated with the use of Y inthe LMGMM statistic by “purging” it from its correlation with u [by subtracting the termπ(β0)sεV (β0)/sεε(β0) in ZK ] . In other words, FK(β0) and K(β0) ≡ GFK(β0) can be obtainedby testing θ2 = 0 in the regression
y − Y β0 = X1θ1 + Y (β0)θ2 + ε (6.31)
where the fitted values Y , which appear in the auxiliary regression (6.22) for the LMGMM test, havebeen replaced by Y (β0) = Y −Xπ(β0)sεV (β0)/sεε(β0), which are closer to being orthogonal withu.
If k2 = G, we have FK(β0) = AR(β0) ∼ F (G, T − k), while in the other cases (k2 ≥ G),we can see easily that the bound for FGMM (β0) in (6.25) also applies to FK(β0) :
GFK(β0) ≤(
T − k1 − G
T − k1 − k2
)k2 AR(β0) , (6.32)
Kleibergen (2002a) did not supply a finite-sample distributional theory but showed (assumingk1 = 0) that K(β0) follows a χ2(G) distribution asymptotically under H0(β0), irrespective ofthe presence of weak instruments. This entails that the K(β0) test will have power higher thanthe one of LMGMM test [based on the χ2(k2) bound], at least in the neighborhood of the nullhypothesis, although not necessarily far away from the null hypothesis.
It is also interesting to note that the inequality (6.32) indicates that the distribution of K(β0) ≡GFK(β0) can be bounded in finite samples by a [k2(T−k1−G)/(T−k)]F (k2, T−k) distribution.
16The χ2(k2) bound also follows in a straightforward way from (6.25). Note that Wang and Zivot (1998) do not providethe auxiliary regression interpretation (6.21) - (6.22) of their statistics. For details, see Dufour and Taamouti (2001b).
24

However, because of the stochastic dominance of AR(β0), there would be no advantage in usingthe bound to get critical values for K(β0), for the AR test would then have better power.
In view of the fact that the above procedure is based on estimating the mean of XΠ (usingXΠ) and the covariances between the errors in the reduced form for Y and u [using sεV (β0)], itcan become quite unreliable in the presence of excluded instruments.
e. Likelihood ratio test The likelihood ratio (LR) statistic for β = β0 was also studied by Wangand Zivot (1998). The LR test statistic in this case takes the form:
LRLIML = T[ln
(κ(β0)
)− ln
(κ(βLIML)
)](6.33)
where βLIML is the limited information maximum likelihood estimator (LIML) of β and
κ(β) =(y − Y β)
′M(X1)(y − Y β)
(y − Y β)′M(X)(y − Y β). (6.34)
Like LMGMM , the distribution of LRLIML depends on unknown nuisance parameters underH0(β0), but its asymptotic distribution is χ2(k2) when k2 = G and bounded by the χ2(k2) dis-tribution in the other cases [a result in accordance with the general LR distributional bound given inDufour (1997)]. This bound can also be easily derived from the following inequality:
LRLIML ≤(
T
T − k
)k2 AR(β0) , (6.35)
so that the distribution of LRLIML is bounded in finite samples by the distribution of a [Tk2/(T −k)]F (k2, T − k) variable; for details, see Dufour and Khalaf (2000). For T reasonably large, thisentails that the AR(β0) test will have power higher than the one of LRLIML test [based on theχ2(k2) bound], at least in the neighborhood of the null hypothesis. So the power of the AR test isuniformly superior to the one of the LRLIML bound test. Because the LR test depends heavily onthe specification of the model for Y , it is not robust to excluded instruments.
f. Conditional tests A promising approach was recently proposed by Moreira (2003a). His sug-gestion consists in conditioning upon an appropriately selected portion of the sufficient statistics fora gaussian SEM. On assuming that the covariance matrix of the errors is known, the correspondingconditional distribution of various test statistics for H0(β0) does not involve nuisance parameters.The conditional distribution is typically not standard but may be established by simulation. Suchan approach may lead to power gains. On the other hand, the assumption that error covariancesare known is rather implausible, and the extension of the method to the case where the error co-variance matrix is unknown is obtained at the expense of using a large-sample approximation. LikeKleibergen’s procedure, this method yields an asymptotically similar test. For further discussion,see Moreira and Poi (2001) and Moreira (2003b).
g. Instrument selection procedures Systematic search methods for identifying relevant instru-ments and excluding unimportant instruments have been discussed by several authors; see Hall,Rudebusch, and Wilcox (1996), Hall and Peixe (2000), Dufour and Taamouti (2001a), and Donald
25
and Newey (2001). In this setup, the power of AR-type tests depends on a function of model param-eters called the concentration coefficient. One way to approach instrument selection is to maximizethe concentration coefficient towards maximizing test power. Robustness to instrument exclusionis very handy in this context. For further discussion, the reader may consult Dufour and Taamouti(2001a).
To summarize, in special situations, alternatives to the AR procedure may allow some powergains with respect to the AR test with an unreduced set of instruments. They themselves may havesome important drawbacks. In particular, (1) only an asymptotic distributional theory is supplied,(2) the statistics used are not pivotal in finite samples, although Kleibergen’s and Moreira’s statisticsare asymptotically pivotal, (3) they are not robust to instrument exclusion or to the formulation ofthe model for the explanatory endogenous variables. It is also of interest to note that finite-sampleversions of several of these asymptotic tests may be obtained by using split-sample methods.
All the problems and techniques discussed above relate to sampling-based statistical methods.SEM can also be analyzed through a Bayesian approach, which may alleviate the indeterminaciesassociated with identification via the introduction of a prior distribution on the parameter space.Bayesian inferences always depend on the choice of prior distribution (a property viewed as undesir-able in the sampling approach), but this dependence becomes especially strong when identificationproblems are present [see Gleser and Hwang (1987)]. This paper only aims at discussing prob-lems and solutions which arise within the sampling framework, and it is beyond its scope to debatethe advantages and disadvantages of Bayesian methods under weak identification. For additionaldiscussion on this issue, see Kleibergen and Zivot (2003) and Sims (2001).
7. Extensions
We will discuss succinctly some extensions of the above results to multivariate setups (where severalstructural equations may be involved), models with non-Gaussian errors, and nonlinear models.
7.1. Multivariate regression, simulation-based inference and nonnormal errors
Another approach to inference on a linear structural equation model is based on observing that thestructural model (5.1) - (5.4) can be put in the form of a multivariate linear regression (MLR):
Y = XB + U (7.1)
where Y = [y, Y ], B = [π, Π], U = [u, V ] = [U1, . . . , UT ]′, π = [π′1, π′
2]′, Π = [Π ′
1, Π ′2]′,
π1 = Π1β+γ and π2 = Π2β.17 This model is linear except for the nonlinear restriction π2 = Π2β.Let us now make the assumption that the errors in the different equations for each observation, Ut,satisfy the property:
Ut = JWt , t = 1, . . . , T , (7.2)
17Most of this section is based on Dufour and Khalaf (2000, 2001, 2002).
26
where the vector w = vec(W1, . . . , Wn) has a known distribution and J is an unknown nonsin-gular matrix (which enters into the covariance matrix Σ of the error vectors Ut). This distributionalassumption is, in a way, more restrictive than the one made in section 5.1 — because of the assump-tion on V — and in another way, less restrictive, because the distribution of u is not taken to benecessarily N
[0, σ2
u IT
].
Consider now an hypothesis of the form
H0 : RBC = D (7.3)
where R, C and D are fixed matrices. This is called a uniform linear (UL) hypothesis; for example,the hypothesis β = β0 tested by the AR test can be written in this form [see Dufour and Khalaf(2000)]. The corresponding gaussian LR statistic is
LR(H0) = T ln(|Σ0|/|Σ|) (7.4)
where Σ = U ′U/T and Σ0 = U ′0U0/T are respectively the unrestricted and restricted estimates of
the error covariance matrix. The AR test can also be obtained as a monotonic transformation of astatistic of the form LR(H0). An important feature of LR(H0) in this case is that its distributionunder H0 does not involve nuisance parameters and may be easily simulated (it is a pivot); seeDufour and Khalaf (2002). In particular, its distribution is completely invariant to the unknownJ matrix (or the error covariance matrix). In such a case, even though this distribution may becomplicated, we can use Monte Carlo test techniques — a form of parametric bootstrap — to obtainexact test procedures.18 Multivariate extensions of AR tests, which impose restrictions on severalstructural equations, can be obtained in this way. Further, this approach allows one to consider any(possibly non-gaussian) distribution on w.
More generally, it is of interest to note that the LR statistic for about any hypothesis on B canbe bounded by a LR statistic for an appropriately selected UL hypothesis: setting b = vec(B) and
H0 : Rb ∈ Δ0 (7.5)
where R an arbitrary q × k(G + 1) matrix and Δ0 is an arbitrary subset of Rq, the distribution of
the corresponding LR statistic can be bounded by the LR statistic for a UL hypothesis (which ispivotal). This covers as special cases all restrictions on the coefficients of SEM (as long as they arewritten in the MLR form). To avoid the use of such bounds (which may be quite conservative), it isalso possible to use maximized Monte Carlo tests [Dufour (2002)].
All the above procedures are valid for parametric models that specify the error distribution up toan unknown linear transformation (the J matrix) which allows an unknown covariance matrix. It iseasy to see that these (including the exact procedures discussed in section 6) yield “asymptoticallyvalid” procedures under much weaker assumptions than those used to obtain finite-sample results.However, in view of the discussion in section 4, the pitfalls and limitations of such arguments shouldbe remembered: there is no substitute for a provably exact procedure.
If we aim at getting tests and confidence sets for nonparametric versions of the SEM (where the
18For further discussion of Monte Carlo test methods, see Dufour and Khalaf (2001) and Dufour (2002).
27
error distribution involves an infinite set of nuisance parameters), this may be achievable by lookingat distribution-free procedures based on permutations, ranks or signs. There is very little work onthis topic in the SEM. For an interesting first look, however, the reader should look at an interestingrecent paper by Bekker (2002).
7.2. Nonlinear models
It is relatively difficult to characterize identification and study its consequences in nonlinear struc-tural models. But problems similar to those noted for linear SEM do arise. Nonlinear structuralmodels typically take the form:
ft(yt, xt, θ) = ut , Eθ[ut |Zt] = 0 , t, . . . , T, (7.6)
where ft(·) is a vector of possibly nonlinear relationships, yt is a vector endogenous variables, xt isa vector of exogenous variables, θ is vector of unknown parameters, Zt is a vector of conditioningvariables (or instruments) — usually with a number of additional distributional assumptions — andEθ[ · ] refers to the expected value under a distribution with parameter value θ. In such models, θcan be viewed as identifiable if there is only one value of θ [say, θ = θ] that satisfies (7.6), and wehave weak identification (or weak instruments) when the expected values Eθ[ft(yt, xt, θ) |Zt] = 0 ,t, . . . , T, are “weakly sensitive” to the value of θ.
Research on weak identification in nonlinear models remains scarce. Nonlinearity makes it dif-ficult to construct finite-sample procedures even in models where identification difficulties do notoccur. So it is not surprising that results in this area has been mostly based on large-sample approx-imations. Stock and Wright (2000) studied the asymptotic distributions of GMM-based estimatorsand test statistics under conditions of weak identification (and weak “high level” asymptotic distri-butional assumptions). While GMM estimators of θ have nonstandard asymptotic distributions, theobjective function minimized by the GMM procedure follows an asymptotic distribution which isunaffected by the presence of weak instruments: it is asymptotically pivotal. So tests and confidencesets based on the objective function can be asymptotically valid irrespective of the presence of weakinstruments. These results are achieved for the full parameter vector θ, i.e. for hypotheses of theform θ = θ0 and the corresponding joint confidence sets. This is not surprising: parametric non-separability arises here for two reasons, model nonlinearity and the possibility of non-identification.Of course, once a joint confidence set for θ has been built, inference on individual parameters canbe drawn via projection methods. Other contributions in this area include papers by Kleibergen(2001a, 2003), who proposed an extension of the K(β0) test, and Wright (2003, 2002) proposedtests of underidentification and identification.
In view the discussion in section 4, the fact that all these methods are based on large-sample ap-proximations without a finite-sample theory remains a concern. However, a first attempt at derivingfinite-sample procedures is available in Dufour and Taamouti (2001b). Under parametric assump-tions on the errors, the hypothesis θ = θ0 is tested by testing γ = 0 in an auxiliary regression of theform:
ft(yt, xt, θ0) = zt(θ0, θ1)γ + εt , t, . . . , T, (7.7)
28

where the zt(θ0, θ1) are instruments in a way that maximizes power against a reference alternative(point-optimal instruments). In this way, one gets point-optimal tests [see King (1988) and Dufourand King (1991)]. Inference on nonlinear regressions are also covered by this setup. As in the caseof linear SEM, sample-split techniques may be exploited to approximate optimal instruments, andprojection methods can be used to draw inference on subvectors of θ.
8. Conclusion
By way of conclusion, we will summarize the main points made in this paper.
1. There are basic pitfalls and limitations faced in developing inference procedures in economet-rics. If we are not careful, we can easily be led into ill-defined problems and find ourselves:
(a) trying to test a non-testable hypothesis, such as an hypothesis on a moment in the contextof an insufficiently restrictive nonparametric model, or an hypothesis (e.g., a unit roothypothesis) on a dynamic model while allowing a dynamic structure with an unlimited(not necessarily infinite) number of parameters;
(b) trying to solve an inference problem using a technique that cannot deliver a solutionbecause of the very structure of the technique, as in (i) testing an hypothesis on a mean(or median) under heteroskedasticity of unknown form, via standard least-square-based“heteroskedasticity-robust” standard errors, or (ii) building a confidence interval for aparameter which is not identifiable in a structural model, via the usual technique basedon standard errors. In particular, this type of difficulty arises for Wald-type statistics inthe presence of weak instruments (or weakly identified models)
2. In many econometric problems (such as, inference on structural models), several of the intu-itions derived from the linear regression model and standard asymptotic theory can easily bemisleading.
(a) Standard errors do not constitute a valid way of assessing parameter uncertainty andbuilding confidence intervals.
(b) In many models, such as structural models where parameters may be underidentified,individual parameters in statistical models are not generally meaningful, but parametervectors can be (at least in parametric models). We called this phenomenon parametricnonseparability. As a result, restrictions on individual coefficients may not be testable,while restrictions on the whole parameter vector are. This feature should play a centralrole in designing methods for dealing with weakly identified models.
3. The above difficulties underscore the pitfalls of large-sample approximations, which are typ-ically based on pointwise (rather than uniform) convergence results and may be arbitrarilyinaccurate in finite samples.
29

4. Concerning solutions to such problems, and more specifically in the context of weakly iden-tified models, we have emphasized the following points.
(a) In accordance with basic statistical theory, one should always look for pivots as thefundamental ingredient for building tests and confidence sets.
(b) Pivots are not generally available for individual parameters, but they can be obtained ina much wider set of cases for appropriately selected vectors of parameters.
(c) Given a pivot for a parameter vector, we can construct valid tests and confidence setsfor the parameter vector.
(d) Inference on individual coefficients may then be derived through projection methods.
5. In the specific example of SEM, the following general remarks are in our view important.
(a) Besides being pivotal, the AR statistic enjoys several remarkable robustness properties,such as robustness to the presence of weak instruments, to excluded instruments or tothe specification of a model for the endogenous explanatory variables.
(b) It is possible to improve the power of AR-type procedures (especially by reducing thenumber of instruments), but power improvements may come at the expense of using apossibly unreliable large-sample approximation or losing robustness (such as robustnessto excluded instruments). As usual, there is a trade-off between power (which is typi-cally increased by considering more restrictive models) and robustness (which involvesconsidering a wider hypothesis).
(c) Trying to adapt and improve AR-type procedures (without ever forgetting basic statisti-cal principles) constitutes the most promising avenue for dealing with weak instruments.
30
References
ABDELKHALEK, T., AND J.-M. DUFOUR (1998): “Statistical Inference for Computable GeneralEquilibrium Models, with Application to a Model of the Moroccan Economy,” Review of Eco-nomics and Statistics, LXXX, 520–534.
ANDERSON, T. W., AND H. RUBIN (1949): “Estimation of the Parameters of a Single Equation ina Complete System of Stochastic Equations,” Annals of Mathematical Statistics, 20, 46–63.
ANGRIST, J. D., AND A. B. KRUEGER (1991): “Does Compulsory School Attendance AffectSchooling and Earning?,” Quarterly Journal of Economics, CVI, 979–1014.
ANGRIST, J. D., AND A. B. KRUEGER (1995): “Split-Sample Instrumental Variables Estimates ofthe Return to Schooling,” Journal of Business and Economic Statistics, 13, 225–235.
BAHADUR, R. R., AND L. J. SAVAGE (1956): “The Nonexistence of Certain Statistical Proceduresin Nonparametric Problems,” Annals of Mathematical Statistics, 27, 1115–1122.
BANERJEE, A., J. DOLADO, J. W. GALBRAITH, AND D. F. HENDRY (1993): Co-Integration, Er-ror Correction, and the Econometric Analysis of Non-Stationary Data. Oxford University PressInc., New York.
BASMANN, R. L. (1957): “A General Classical Method of Linear Estimation of Coefficients in aStructural Equation,” Econometrica, 25, 77–83.
BEKKER, P. A. (2002): “Symmetry-Based Inference in an Instrumental Variable Setting,” Discus-sion paper, Department of Economics, University of Groningen, Groningen, The Netherlands.
BEKKER, P. A., AND F. KLEIBERGEN (2001): “Finite-Sample Instrumental Variables InferenceUsing an Asymptotically Pivotal Statistic,” Discussion Paper TI 2001-055/4, Tinbergen Institute,University of Amsterdam, Amsterdam, The Netherlands.
BEKKER, P. A., A. MERCKENS, AND T. J. WANSBEEK (1994): Identification, Equivalent Models,and Computer Algebra. Academic Press, Boston.
BLOUGH, S. R. (1992): “The Relationship between Power and Level for Generic Unit Root Testsin Finite Samples,” Journal of Applied Econometrics, 7, 295–308.
BOUND, J., D. A. JAEGER, AND R. BAKER (1993): “The Cure can be Worse than the Disease:A Cautionary Tale Regarding Instrumental Variables,” Technical Working Paper 137, NationalBureau of Economic Research, Cambridge, MA.
BOUND, J., D. A. JAEGER, AND R. M. BAKER (1995): “Problems With Instrumental VariablesEstimation When the Correlation Between the Instruments and the Endogenous ExplanatoryVariable Is Weak,” Journal of the American Statistical Association, 90, 443–450.
BUSE, A. (1992): “The Bias of Instrumental Variables Estimators,” Econometrica, 60, 173–180.
31
CAMPBELL, B., AND J.-M. DUFOUR (1995): “Exact Nonparametric Orthogonality and RandomWalk Tests,” Review of Economics and Statistics, 77, 1–16.
(1997): “Exact Nonparametric Tests of Orthogonality and Random Walk in the Presenceof a Drift Parameter,” International Economic Review, 38, 151–173.
CHAO, J., AND N. R. SWANSON (2001): “Bias and MSE Analysis of the IV Estimator Under WeakIdentification with Application to Bias Correction,” Discussion paper, Department of Economics,Rutgers University, New Brunswick, New Jersey.
(2003): “Alternative Approximations of the Bias and MSE of the IV Estimator UnderWeak Identification With an Application to Bias Correction,” Discussion paper, Department ofEconomics, Rutgers University, New Brunswick, New Jersey.
CHOI, I., AND P. C. B. PHILLIPS (1992): “Asymptotic and Finite Sample Distribution Theory forIV Estimators and Tests in Partially Identified Structural Equations,” Journal of Econometrics,51, 113–150.
COCHRANE, J. H. (1991): “A Critique of the Application of Unit Root Tests,” Journal of EconomicDynamics and Control, 15, 275–284.
CUSHING, M. J., AND M. G. MCGARVEY (1999): “Covariance Matrix Estimation,” in Mátyás(1999), chap. 3, pp. 63–95.
DAVIDSON, R., AND J. G. MACKINNON (1993): Estimation and Inference in Econometrics. Ox-ford University Press, New York.
DONALD, S. G., AND W. K. NEWEY (2001): “Choosing the Number of Instruments,” Economet-rica, 69, 1161–1191.
DUFOUR, J.-M. (1981): “Rank Tests for Serial Dependence,” Journal of Time Series Analysis, 2,117–128.
(1990): “Exact Tests and Confidence Sets in Linear Regressions with Autocorrelated Er-rors,” Econometrica, 58, 475–494.
(1997): “Some Impossibility Theorems in Econometrics, with Applications to Structuraland Dynamic Models,” Econometrica, 65, 1365–1389.
(2000): “Économétrie, théorie des tests et philosophie des sciences,” in Présentationsde l’Académie des lettres et des sciences humaines, vol. 53, pp. 166–182. Royal Society ofCanada/Société royale du Canada, Ottawa.
(2001): “Logique et tests d’hypothèses: réflexions sur les problèmes mal posés enéconométrie,” L’Actualité économique, 77(2), 171–190.
32
(2002): “Monte Carlo Tests with Nuisance Parameters: A General Approach to Finite-Sample Inference and Nonstandard Asymptotics in Econometrics,” Journal of Econometrics,forthcoming.
DUFOUR, J.-M., M. HALLIN, AND I. MIZERA (1998): “Generalized Runs Tests for Heteroskedas-tic Time Series,” Journal of Nonparametric Statistics, 9, 39–86.
DUFOUR, J.-M., AND J. JASIAK (1993): “Finite Sample Inference Methods for SimultaneousEquations and Models with Unobserved and Generated Regressors,” Discussion paper, C.R.D.E.,Université de Montréal, 38 pages.
DUFOUR, J.-M., AND J. JASIAK (2001): “Finite Sample Limited Information Inference Methodsfor Structural Equations and Models with Generated Regressors,” International Economic Re-view, 42, 815–843.
DUFOUR, J.-M., AND L. KHALAF (2000): “Simulation-Based Finite-Sample Inference in Simul-taneous Equations,” Discussion paper, C.R.D.E., Université de Montréal.
(2001): “Monte Carlo Test Methods in Econometrics,” in Companion to Theoretical Econo-metrics, ed. by B. Baltagi, Blackwell Companions to Contemporary Economics, chap. 23, pp.494–519. Basil Blackwell, Oxford, U.K.
(2002): “Simulation Based Finite and Large Sample Tests in Multivariate Regressions,”Journal of Econometrics, 111(2), 303–322.
DUFOUR, J.-M., AND M. L. KING (1991): “Optimal Invariant Tests for the Autocorrelation Coef-ficient in Linear Regressions with Stationary or Nonstationary AR(1) Errors,” Journal of Econo-metrics, 47, 115–143.
DUFOUR, J.-M., AND J. F. KIVIET (1998): “Exact Inference Methods for First-Order Autoregres-sive Distributed Lag Models,” Econometrica, 66, 79–104.
DUFOUR, J.-M., AND M. TAAMOUTI (2000): “Projection-Based Statistical Inference in LinearStructural Models with Possibly Weak Instruments,” Discussion paper, C.R.D.E., Université deMontréal.
(2001a): “On Methods for Selecting Instruments,” Discussion paper, C.R.D.E., Universitéde Montréal.
(2001b): “Point-Optimal Instruments and Generalized Anderson-Rubin Procedures forNonlinear Models,” Discussion paper, C.R.D.E., Université de Montréal.
DUFOUR, J.-M., AND O. TORRÈS (1998): “Union-Intersection and Sample-Split Methods inEconometrics with Applications to SURE and MA Models,” in Handbook of Applied EconomicStatistics, ed. by D. E. A. Giles, and A. Ullah, pp. 465–505. Marcel Dekker, New York.
(2000): “Markovian Processes, Two-Sided Autoregressions and Exact Inference for Sta-tionary and Nonstationary Autoregressive Processes,” Journal of Econometrics, 99, 255–289.
33
ENGLE, R. F., AND D. L. MCFADDEN (eds.) (1994): Handbook of Econometrics, Volume 4.North-Holland, Amsterdam.
FAUST, J. (1996): “Near Observational Equivalence Problems and Theoretical Size Problems withUnit Root Tests,” Econometric Theory, 12, 724–732.
FAUST, J. (1999): “Theoretical confidence level problems with confidence intervals for the spec-trum of a time series,” Econometrica, 67, 629–637.
FISHER, F. M. (1976): The Identification Problem in Econometrics. Krieger Publishing Company,Huntington (New York).
GLESER, L. J., AND J. T. HWANG (1987): “The Nonexistence of 100(1 − α) Confidence Sets ofFinite Expected Diameter in Errors in Variables and Related Models,” The Annals of Statistics,15, 1351–1362.
GODAMBE, V. P. (1960): “An Optimum Property of Regular Maximum Likelihood Estimation,”The Annals of Mathematical Statistics, 31, 1208–1212, Ackowledgement 32 (1960), 1343.
GRILICHES, Z., AND M. D. INTRILLIGATOR (eds.) (1983): Handbook of Econometrics, Volume1. North-Holland, Amsterdam.
HAHN, J., AND J. HAUSMAN (2002a): “A New Specification Test for the Validity of InstrumentalVariables,” Econometrica, 70, 163–189.
(2002b): “Notes on Bias in Estimators for Simultaneous Equation Models,” EconomicsLetters, 75, 237–241.
(2002c): “Weak Instruments: Diagnosis and Cures in Empirical Econometrics,” Discus-sion paper, Department of Economics, Massachusetts Institute of Technology, Cambridge, Mas-sachusetts.
HAHN, J., J. HAUSMAN, AND G. KUERSTEINER (2001): “Higher Order MSE of Jackknife 2SLS,”Discussion paper, Department of Economics, Massachusetts Institute of Technology, Cambridge,Massachusetts.
HALL, A. R. (1999): “Hypothesis Testing in Models Estimated by GMM,” in Mátyás (1999),chap. 4, pp. 96–127.
HALL, A. R., AND F. P. M. PEIXE (2000): “A Consistent Method for the Selection of RelevantInstruments,” Discussion paper, Department of Economics, North Carolina State University,Raleigh, North Carolina.
HALL, A. R., G. D. RUDEBUSCH, AND D. W. WILCOX (1996): “Judging Instrument Relevancein Instrumental Variables Estimation,” International Economic Review, 37, 283–298.
HANSEN, L. (1982): “Large Sample Properties of Generalized Method of Moments Estimators,”Econometrica, 50, 1029–1054.
34
HILLIER, G. H. (1990): “On the Normalization of Structural Equations: Properties of DirectionEstimators,” Econometrica, 58, 1181–1194.
HOROWITZ, J. L. (2001): “The Bootstrap and Hypothesis Tests in Econometrics,” Journal ofEconometrics, 100(1), 37–40.
HSIAO, C. (1983): “Identification,” in Griliches and Intrilligator (1983), chap. 4, pp. 223–283.
IMBENS, G. W., AND C. F. MANSKI (2003): “Confidence Intervals for Partially Identified Pa-rameters,” Discussion paper, Department of Economics, University of California at Berkeley,Berkeley, California.
KING, M. L. (1988): “Towards a Theory of Point Optimal Testing,” Econometric Reviews, 6, 169–218, Comments and reply, 219-255.
KLEIBERGEN, F. (2001a): “Testing Parameters in GMM Without Assuming That They are Identi-fied,” Discussion Paper TI 01-067/4, Tinbergen Institute, Amsterdam, The Netherlands.
(2001b): “Testing Subsets of Structural Coefficients in the IV Regression Model,” Discus-sion paper, Department of Quantitative Economics, University of Amsterdam.
(2002a): “Pivotal Statistics for Testing Structural Parameters in Instrumental VariablesRegression,” Econometrica, 70(5), 1781–1803.
(2002b): “Two Independent Statistics That Test Location and Misspecification and Add-Up to the Anderson-Rubin Statistic,” Discussion paper, Department of Quantitative Economics,University of Amsterdam.
(2003): “Expansions of GMM Statistics That Indicate their Properties under Weak and/orMany Instruments,” Discussion paper, Department of Quantitative Economics, University of Am-sterdam.
KLEIBERGEN, F., AND E. ZIVOT (2003): “Bayesian and Classical Approaches to InstrumentalVariable Regression,” Journal of Econometrics, 114(1), 29–72.
KOSCHAT, M. A. (1987): “A Characterization of the Fieller Solution,” The Annals of Statistics, 15,462–468.
LEHMANN, E. L. (1986): Testing Statistical Hypotheses, 2nd edition. John Wiley & Sons, NewYork.
LEHMANN, E. L., AND C. STEIN (1949): “On the Theory of some Non-Parametric Hypotheses,”Annals of Mathematical Statistics, 20, 28–45.
MAASOUMI, E. (1992): “Fellow’s Opinion: Rules of Thumb and Pseudo-Science,” Journal ofEconometrics, 53, 1–4.
35

MACKINNON, J. G. (2002): “Bootstrap Inference in Econometrics,” Canadian Journal of Eco-nomics, 35(4), 615–645.
MADDALA, G. S. (1974): “Some Small Sample Evidence on Tests of Significance in SimultaneousEquations Models,” Econometrica, 42, 841–851.
MADDALA, G. S., AND J. JEONG (1992): “On the Exact Small Sample Distribution of the Instru-mental Variable Estimator,” Econometrica, 60, 181–183.
MADDALA, G. S., AND I.-M. KIM (1998): Unit Roots, Cointegration and Structural Change.Cambridge University Press, Cambridge, U.K.
MANSKI, C. (1995): Identification Problems in the Social Sciences. Harvard University Press,Cambridge and London.
MANSKY, C. (2003): Partial Identification of Probability Distributions, Springer Series in Statis-tics. Springer-Verlag, New York.
MÁTYÁS, L. (ed.) (1999): Generalized Method of Moments Estimation. Cambridge UniversityPress, Cambridge, U.K.
MCMANUS, D. A., J. C. NANKERVIS, AND N. E. SAVIN (1994): “Multiple Optima and Asymp-totic Approximations in the Partial Adjustment Model,” Journal of Econometrics, 62, 91–128.
MOREIRA, M. J. (2001): “Tests With Correct Size When Instruments Can Be Arbitrarily Weak,”Discussion paper, Department of Economics, Harvard University, Cambridge, Massachusetts.
(2003a): “A Conditional Likelihood Ratio Test for Structural Models,” Econometrica,71(4), 1027–1048.
(2003b): “A General Theory of Hypothesis Testing in the Simultaneous Equations Model,”Discussion paper, Department of Economics, Harvard University, Cambridge, Massachusetts.
MOREIRA, M. J., AND B. P. POI (2001): “Implementing Tests with Correct Size in the Simultane-ous Equations Model,” The Stata Journal, 1(1), 1–15.
NELSON, C. R., AND R. STARTZ (1990a): “The Distribution of the Instrumental Variable Estimatorand its t-ratio When the Instrument is a Poor One,” Journal of Business, 63, 125–140.
(1990b): “Some Further Results on the Exact Small Properties of the Instrumental VariableEstimator,” Econometrica, 58, 967–976.
NEWEY, W. K., AND D. MCFADDEN (1994): “Large Sample Estimation and Hypothesis Testing,”in Engle and McFadden (1994), chap. 36, pp. 2111–2245.
NEWEY, W. K., AND K. D. WEST (1987a): “Hypothesis Testing with Efficient Method of MomentsEstimators,” International Economic Review, 28, 777–787.
36
(1987b): “A Simple, Positive Semi-Definite, Heteroskedasticity and Autocorrelation Con-sistent Covariance Matrix,” Econometrica, 55, 703–708.
PERRON, B. (2003): “Semiparametric Weak Instrument Regressions with an Application to theRisk Return Tradeoff,” Review of Economics and Statistics, 85(2), 424–443.
PHILLIPS, P. C. B. (1983): “Exact Small Sample theory in the Simultaneous Equations Model,” inGriliches and Intrilligator (1983), chap. 8, pp. 449–516.
(1984): “The Exact Distribution of LIML: I,” International Economic Review, 25, 249–261.
(1985): “The Exact Distribution of LIML: II,” International Economic Review, 26, 21–36.
(1987): “Time Series Regression with Unit Root,” Econometrica, 55(2), 277–301.
(1989): “Partially Identified Econometric Models,” Econometric Theory, 5, 181–240.
PHILLIPS, P. C. B., AND P. PERRON (1988): “Testing for a Unit Root in Time Series Regression,”Biometrika, 75, 335–346.
POPPER, K. (1968): The Logic of Scientific Discovery. Harper Torchbooks, New York, revised edn.
PÖTSCHER, B. (2002): “Lower Risk Bounds and Properties of Confidence Sets for Ill-Posed Esti-mation Problems with Applications to Spectral Density and Persistence Estimation, Unit Rootsand Estimation of Long Memory Parameters,” Econometrica, 70(3), 1035–1065.
PRAKASA RAO, B. L. S. (1992): Identifiability in Stochastic Models: Characterization of Proba-bility Distributions. Academic Press, New York.
PRATT, J. W., AND J. D. GIBBONS (1981): Concepts of Nonparametric Theory. Springer-Verlag,New York.
ROTHENBERG, T. J. (1971): “Identification in Parametric Models,” Econometrica, 39, 577–591.
(1984): “Approximating the Distributions of Econometric Estimators and Test Statistics,”in Handbook of Econometrics, Volume 2, ed. by Z. Griliches, and M. D. Intrilligator, chap. 15,pp. 881–935. North-Holland, Amsterdam.
SARGAN, J. D. (1983): “Identification and Lack of Identification,” Econometrica, 51, 1605–1633.
SHEA, J. (1997): “Instrument Relevance in Multivariate Linear Models: A Simple Measure,” Re-view of Economics and Statistics, LXXIX, 348–352.
SIMS, C. (1971a): “Distributed Lag Estimation When the Parameter Space is Explicitly Infinite-Dimensional,” Annals of Mathematical Statistics, 42, 1622–1636.
SIMS, C. A. (1971b): “Discrete Approximations to Continuous Time Distributed Lags in Econo-metrics,” Econometrica, 39, 545–563.
37
(2001): “Thinking About Instrumental Variables,” Discussion paper, Department of Eco-nomics, Priceton University, Princeton, New Jersey.
STAIGER, D., AND J. H. STOCK (1997): “Instrumental Variables Regression with Weak Instru-ments,” Econometrica, 65, 557–586.
STARTZ, R., C. R. NELSON, AND E. ZIVOT (2001): “Improved Inference for the InstrumentalVariable Estimator,” Discussion paper, Department of Economics, University of Washington.
STOCK, J. H. (1994): “Unit Root, Structural Breaks and Trends,” in Engle and McFadden (1994),chap. 46, pp. 2740–2841.
STOCK, J. H., AND F. TREBBI (2003): “Who Invented IV Regression?,” The Journal of EconomicPerspectives, forthcoming.
STOCK, J. H., AND J. H. WRIGHT (2000): “GMM with Weak Identification,” Econometrica, 68,1097–1126.
STOCK, J. H., J. H. WRIGHT, AND M. YOGO (2002): “A Survey of Weak Instruments and WeakIdentification in Generalized Method of Moments,” Journal of Business and Economic Statistics,20(4), 518–529.
STOCK, J. H., AND M. YOGO (2002): “Testing for Weak Instruments in Linear IV Regression,”Discussion Paper 284, N.B.E.R., Harvard University, Cambridge, Massachusetts.
(2003): “Asymptotic Distributions of Instrumental Variables Statistics with Many Weak In-struments,” Discussion paper, Department of Economics, Harvard University, Cambridge, Mas-sachusetts.
TANAKA, K. (1996): Time Series Analysis: Nonstationary and Noninvertible Distribution Theory.John Wiley & Sons, New York.
TAYLOR, W. E. (1983): “On the Relevance of Finite Sample Distribution Theory,” EconometricReviews, 2, 1–39.
THEIL, H. (1953): “Repeated Least-Squares Applied to Complete Equation Systems,” Discussionpaper, Central Planing Bureau, The Hague, The Netherlands.
WANG, J., AND E. ZIVOT (1998): “Inference on Structural Parameters in Instrumental VariablesRegression with Weak Instruments,” Econometrica, 66, 1389–1404.
WHITE, H. (1980): “A Heteroskedasticity-Consistent Covariance Matrix and a Direct Test for Het-eroskedasticity,” Econometrica, 48, 817–838.
WORKING, E. J. (1927): “What Do Statistical Demand Curves Show?,” The Quarterly Journal ofEconomics, 41, 212–235.
38
WRIGHT, J. H. (2002): “Testing the Null of Identification in GMM,” Discussion Paper 732, Inter-national Finance Discussion Papers, Board of Governors of the Federal Reserve System, Wash-ington, D.C.
(2003): “Detecting Lack of Identification in GMM,” Econometric Theory, 19(2), 322–330.
WRIGHT, P. G. (1928): The Tariff on Animal and Vegetable Oils. Macmillan, New York.
ZIVOT, E., R. STARTZ, AND C. R. NELSON (1998): “Valid Confidence Intervals and Inference inthe Presence of Weak Instruments,” International Economic Review, 39, 1119–1144.
(2003): “Inference in Partially Identified Instrumental Variables Regression with WeakInstruments,” Discussion paper, Department of Economics, University of Washington.
39