idaho fish and game · director’s report to the commission 2017 3 idaho fish and game:...
TRANSCRIPT

IDAHO FISH AND GAMEDirector’s Annual Report to the Commission
FY2017January 2018

2 Director’s Report to the Commission 2017Cover Photos: courtesy Glenn Oakley (front) and Mike Demick (back)
2017 Idaho Fish & Game Organizational ChartC.L. “Butch” Otter
Governor
Virgil Moore Director
Human Resources
Ed Schriever Deputy Director of Operations
Sharon Kiefer Deputy Director of Programs/Policy
Panhandle Region
Coeur d’Alene
Clearwater Region Lewiston
Southwest Region
Nampa & McCall Subregion
Magic Valley Region Jerome
Southeast Region
Pocatello
Upper Snake Region
Idaho Falls
Salmon Region Salmon
IFWF Coordinator
Information Systems
Engineering Administration CommunicationsLegal
CounselTechnical Services
Enforcement Wildlife Fisheries Regions
2017 Commissioners
Brad CorkillCataldo
(208) 682-3253 (h)(208) 682-4602 (w)
bradcorkill@ whitemanlumber.com
Pan
han
dle
Derick AtteburyIdaho Falls
(208) [email protected]
Up
per
Sn
ake
Blake FischerMeridian
(208) [email protected]
So
uth
wes
t
Daniel BlancoMoscow
(208) 816-0746 [email protected]
Cle
arw
ater
Greg CameronRupert
(208) 312-4465MagicValley.Commissioner@
idfg.idaho.gov
Mag
ic V
alle
y
Jerry MeyersNorth Fork
(208) 303-0559Salmon.Commissoner@
idfg.idaho.gov
Sal
mo
n
Lane CleziePocatello
(208) [email protected]
So
uth
east
Director’s Report to the Commission 2017 3
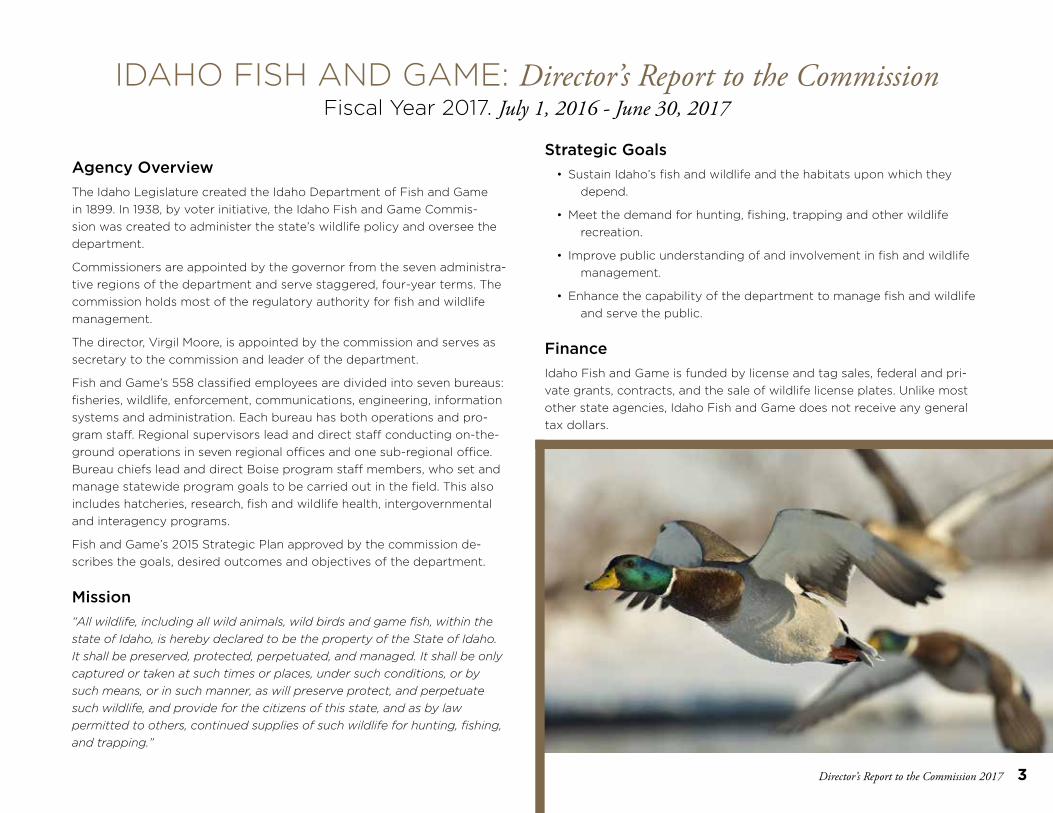
IDAHO FISH AND GAME: Director’s Report to the CommissionFiscal Year 2017. July 1, 2016 - June 30, 2017
Agency OverviewThe Idaho Legislature created the Idaho Department of Fish and Game in 1899. In 1938, by voter initiative, the Idaho Fish and Game Commis-sion was created to administer the state’s wildlife policy and oversee the department.
Commissioners are appointed by the governor from the seven administra-tive regions of the department and serve staggered, four-year terms. The commission holds most of the regulatory authority for fish and wildlife management.
The director, Virgil Moore, is appointed by the commission and serves as secretary to the commission and leader of the department.
Fish and Game’s 558 classified employees are divided into seven bureaus: fisheries, wildlife, enforcement, communications, engineering, information systems and administration. Each bureau has both operations and pro-gram staff. Regional supervisors lead and direct staff conducting on-the-ground operations in seven regional offices and one sub-regional office. Bureau chiefs lead and direct Boise program staff members, who set and manage statewide program goals to be carried out in the field. This also includes hatcheries, research, fish and wildlife health, intergovernmental and interagency programs.
Fish and Game’s 2015 Strategic Plan approved by the commission de-scribes the goals, desired outcomes and objectives of the department.
Mission“All wildlife, including all wild animals, wild birds and game fish, within the state of Idaho, is hereby declared to be the property of the State of Idaho. It shall be preserved, protected, perpetuated, and managed. It shall be only captured or taken at such times or places, under such conditions, or by such means, or in such manner, as will preserve protect, and perpetuate such wildlife, and provide for the citizens of this state, and as by law permitted to others, continued supplies of such wildlife for hunting, fishing, and trapping.”
Strategic Goals• Sustain Idaho’s fish and wildlife and the habitats upon which they
depend.
• Meet the demand for hunting, fishing, trapping and other wildlife recreation.
• Improve public understanding of and involvement in fish and wildlife management.
• Enhance the capability of the department to manage fish and wildlife and serve the public.
FinanceIdaho Fish and Game is funded by license and tag sales, federal and pri-vate grants, contracts, and the sale of wildlife license plates. Unlike most other state agencies, Idaho Fish and Game does not receive any general tax dollars.
4 Director’s Report to the Commission 2017
will have the resources to be effective for a longer time before the need arises for a future fee increase.
Those Idahoans who are “price locked” also pay lower 2017 prices for all tags and permits in addition to their annual license.
The Fish and Game Commission is also applying Price Lock to all 3-year resident licenses, meaning if you missed out on Price Lock by not purchasing an annual license in 2017, you can purchase a 3-year license in 2018 or during any of the following four years and get locked in at 2017 prices for licenses, tags & permits. Three year license purchasers will also see a one-third discount on their Access/Depredation fee.
Nothing like Price Lock has ever been tried by another fish and wildlife agency. The Idaho Legislature and the Fish and Game Commission will review Price Lock after at least five years to determine whether it should continue.
Here’s how Fish and Game is using the Price Lock license revenue:
• Modernizing hatcheries and increasing fish production
• Conducting more population surveys to support game management decisions
• Spending more to improve and maintain public shooting ranges
• Improving Fish and Game’s website and communication with sportsmen and women
• Increasing fish and wildlife predation management and noxious weed control
In recent years, Idaho hunters have enjoyed some of the best big game hunting in decades. Most of them recognize that by managing deer and elk at high levels, Idaho Fish and Game must respond effectively when those animals cause problems for private property owners.
The new access/depredation fee provides benefits both for sportsmen and for farmers and ranchers. The surcharge ($5 for residents, $10 for nonresidents) is paid prior to a person purchasing his or her first annual Idaho hunting or fishing license each year. The fee will provide an additional $1 million each year sportsman’s access and $1 million annually for wildlife depredation compensation and prevention.
With the added resources from Price Lock and the Access/Depredation fee, Idaho Fish and Game is better equipped and positioned to increase fish and wildlife populations, to manage deer and elk impacts to private landowners, and to continue Idaho’s hunting and fishing legacy for our kids and grandkids.
Thank you for supporting Idaho Fish and Game and wildlife conservation in Idaho. I wish you great hunting, fishing and trapping in 2018
Virgil Moore, Director Idaho Department of Fish and Game
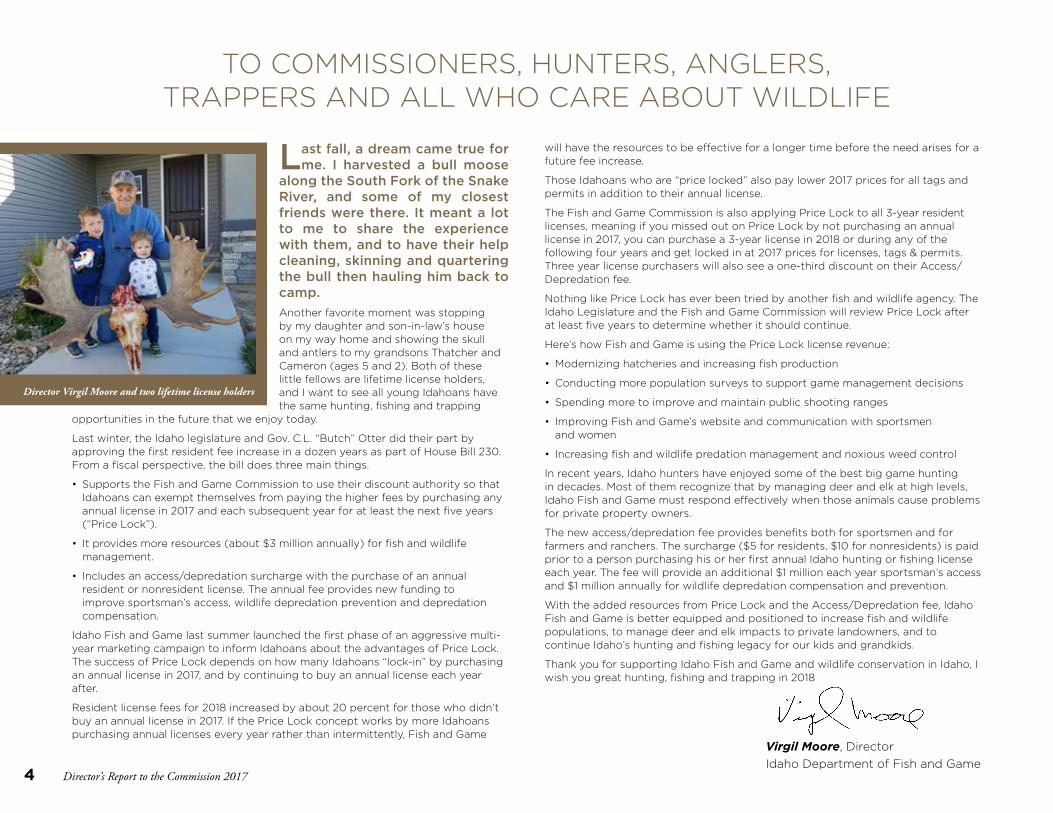
TO COMMISSIONERS, HUNTERS, ANGLERS, TRAPPERS AND ALL WHO CARE ABOUT WILDLIFE
Last fall, a dream came true for me. I harvested a bull moose
along the South Fork of the Snake River, and some of my closest friends were there. It meant a lot to me to share the experience with them, and to have their help cleaning, skinning and quartering the bull then hauling him back to camp.Another favorite moment was stopping by my daughter and son-in-law’s house on my way home and showing the skull and antlers to my grandsons Thatcher and Cameron (ages 5 and 2). Both of these little fellows are lifetime license holders, and I want to see all young Idahoans have the same hunting, fishing and trapping
opportunities in the future that we enjoy today.
Last winter, the Idaho legislature and Gov. C.L. “Butch” Otter did their part by approving the first resident fee increase in a dozen years as part of House Bill 230. From a fiscal perspective, the bill does three main things.
• Supports the Fish and Game Commission to use their discount authority so that Idahoans can exempt themselves from paying the higher fees by purchasing any annual license in 2017 and each subsequent year for at least the next five years (“Price Lock”).
• It provides more resources (about $3 million annually) for fish and wildlife management.
• Includes an access/depredation surcharge with the purchase of an annual resident or nonresident license. The annual fee provides new funding to improve sportsman’s access, wildlife depredation prevention and depredation compensation.
Idaho Fish and Game last summer launched the first phase of an aggressive multi-year marketing campaign to inform Idahoans about the advantages of Price Lock. The success of Price Lock depends on how many Idahoans “lock-in” by purchasing an annual license in 2017, and by continuing to buy an annual license each year after.
Resident license fees for 2018 increased by about 20 percent for those who didn’t buy an annual license in 2017. If the Price Lock concept works by more Idahoans purchasing annual licenses every year rather than intermittently, Fish and Game
Director Virgil Moore and two lifetime license holders

Director’s Report to the Commission 2017 5Director’s Office
ContentsDirector’s Letter ........................................................4
Challenges ...................................................................6
Director’s Office ........................................................7
Fisheries ........................................................................8
Wildlife ..........................................................................12
Enforcement ...............................................................16
Conservation Officer Recognition ......................17
Engineering .................................................................18
Communication .........................................................20
Administration ............................................................22
Information Systems ................................................24
IDFG Actual Expenditures Report ......................25
Resident License, Tag, Permit Sales ..................28
Non-Resident License, Tag, Permit Sales ................. 34
License and Tag Sales/Receipts ..........................38
Cost to Hunt and Fish .............................................39
Big Game Harvest History .....................................40
Fish and Game Contacts ........................................43

6 Director’s Report to the Commission 2017
CHALLENGES
That is why Fish and Game will increase efforts to explain the science and policy behind wild steelhead and Chinook salmon management in Idaho, and provide scientifically based information to guide decisions on regulations related to handling wild fish.
Fish and Game is also committed to exploring issues associated with wild steelhead and Chinook salmon while updating its 2019-2025 Fisheries Management Plan.
New License Vendor
For the first time since 2005, Fish and Game will upgrade its licensing and controlled hunt draw system to a new vendor in spring of 2018. This is a significant effort that involves configuring a complex licensing system that will implement the new “Price Lock” program and transition the controlled hunt draw process from the Idaho State Controller’s system to a third party. Also part of this rollout is the equipment delivery and training for over 400 license vendors on new terminals with a new sales flow and upgrading the license sales website with enhanced security features. Fish and Game is committed to making this transition as seamless as possible so it is invisible to our customers.
Upland Game Management Plan
Many Idaho hunters enjoy pursuing upland game. We want to do all we can to improve upland game opportunity throughout our and it starts with our management plan. Our wildlife staff is working on updating the plan – the first in 30 years, and we expect to have it finished this year.
Fish and Game HQ Office Space
Construction will begin this year on Fish and Game’s new Southwest Regional office in Nampa. The new facility will be centrally located in the Treasure Valley alongside Interstate-84, helping us better serve area hunters, anglers and trappers while providing updated office space for staff. Once the new facility is finished, Fish and Game’s regional office space needs throughout the state will have been met. However, in two years, our ability to extend the lease on space for about half of our headquarters staff in Boise is uncertain and needs addressed. The other half of the HQ staff is housed in our aging 54-year old headquarters building in Boise that is inadequate; focus will be securing adequate space.
Maintaining and Improving Public Access to Private Property for Hunting, Fishing and Trapping
As a license buyer, you are the Face of Conservation in Idaho. Much of what you spend on your licenses and tags is put to use restoring and improving fish and wildlife populations across our state. The money you spend on the new Access/Depredation Fee will help Idaho Fish and Game keep and maintain hunting, fishing and trapping opportunities open on private land too. The fee generates $1 million annually to be used to secure access to prime hunting and fishing locations on private land. We are already working with landowners and expect to make some announcements later this year.
Managing Elk and Deer Populations and Impacts
Last winter was the harshest we’d seen in years and it was a wake-up call for Idaho Fish and Game. I am proud of our staff for how we responded to wildlife depredation problems on private property across Southern Idaho. We learned a lot and we have made significant changes to help us respond even more effectively in the future. For instance, we have doubled the size of the staff responsible for responding to depredation problems and we are working to develop more innovative ways to keep depredations from occurring. With revenue from the Access/Depredation Fee, we now have the people and more resources in place to reduce impacts to private property caused by big game animals and to compensate landowners when damages do occur. That in turn creates more tolerance for abundant herds and that means better hunting for sportsmen and women.
The Science behind Steelhead Management
The fall 2017 steelhead run came later than usual. The delay prompted postponement of opening the take season on hatchery steelhead until fisheries managers had a better sense of whether enough hatchery-raised fish would return to allow for a steelhead harvest. The forecasted run did materialize and the harvest season was reopened. While many anglers were delighted at the development, some anglers expressed concerns about potential effects of harvest for hatchery steelhead on wild fish. State and federal fishery biologists continually evaluate sport fishery impacts on wild steelhead and have concluded Idaho’s steelhead fishery does not pose a conservation risk as currently managed. Despite assurances to the contrary, some individuals and organizations still express concern.
Director’s Report to the Commission 2017 7Director’s Office
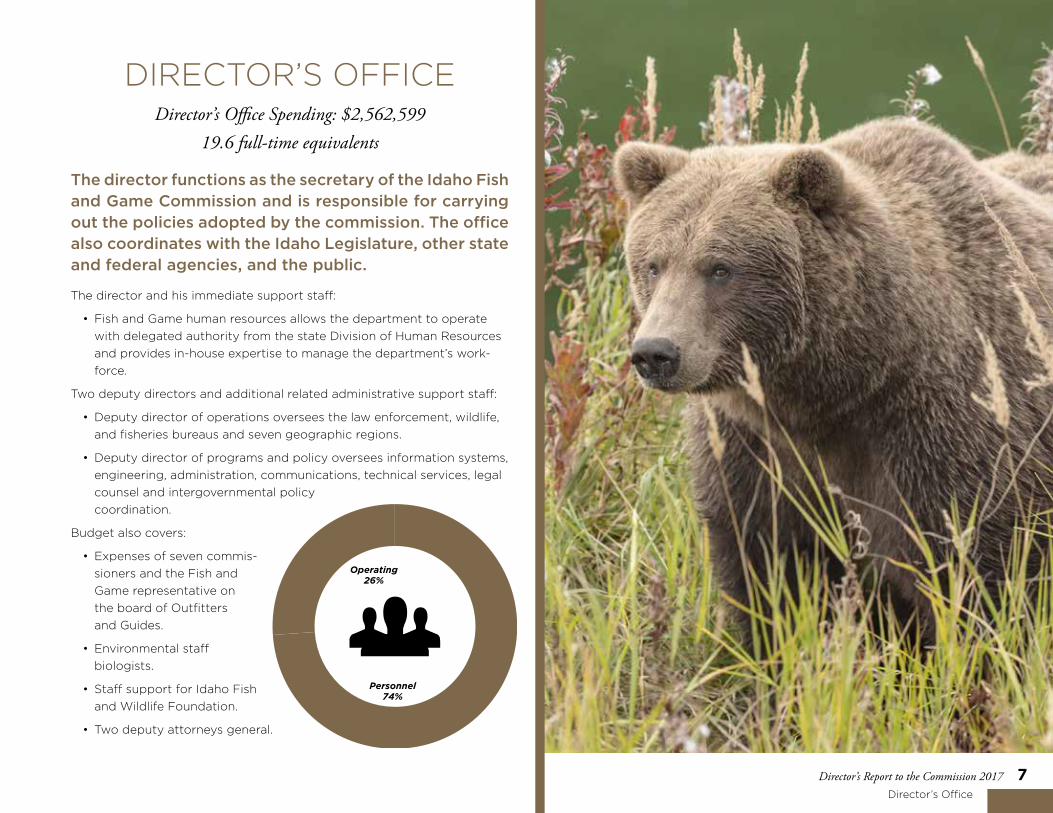
DIRECTOR’S OFFICEDirector’s Office Spending: $2,562,599
19.6 full-time equivalents
The director functions as the secretary of the Idaho Fish and Game Commission and is responsible for carrying out the policies adopted by the commission. The office also coordinates with the Idaho Legislature, other state and federal agencies, and the public.
The director and his immediate support staff:
• Fish and Game human resources allows the department to operate with delegated authority from the state Division of Human Resources and provides in-house expertise to manage the department’s work-force.
Two deputy directors and additional related administrative support staff:
• Deputy director of operations oversees the law enforcement, wildlife, and fisheries bureaus and seven geographic regions.
• Deputy director of programs and policy oversees information systems, engineering, administration, communications, technical services, legal counsel and intergovernmental policy coordination.
Budget also covers:
• Expenses of seven commis-sioners and the Fish and Game representative on the board of Outfitters and Guides.
• Environmental staff biologists.
• Staff support for Idaho Fish and Wildlife Foundation.
• Two deputy attorneys general.
Personnel74%
Operating26%
8 Director’s Report to the Commission 2017Fisheries
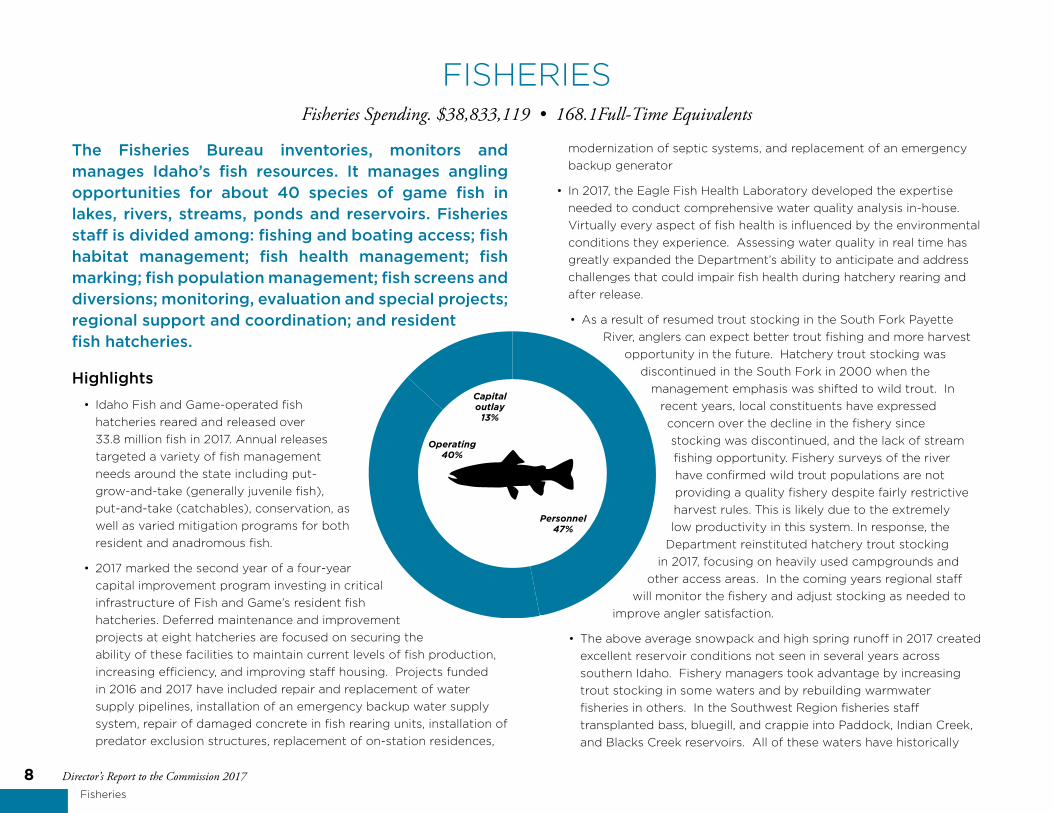
The Fisheries Bureau inventories, monitors and manages Idaho’s fish resources. It manages angling opportunities for about 40 species of game fish in lakes, rivers, streams, ponds and reservoirs. Fisheries staff is divided among: fishing and boating access; fish habitat management; fish health management; fish marking; fish population management; fish screens and diversions; monitoring, evaluation and special projects; regional support and coordination; and resident fish hatcheries.
Highlights• Idaho Fish and Game-operated fish
hatcheries reared and released over 33.8 million fish in 2017. Annual releases targeted a variety of fish management needs around the state including put-grow-and-take (generally juvenile fish), put-and-take (catchables), conservation, as well as varied mitigation programs for both resident and anadromous fish.
• 2017 marked the second year of a four-year capital improvement program investing in critical infrastructure of Fish and Game’s resident fish hatcheries. Deferred maintenance and improvement projects at eight hatcheries are focused on securing the ability of these facilities to maintain current levels of fish production, increasing efficiency, and improving staff housing. Projects funded in 2016 and 2017 have included repair and replacement of water supply pipelines, installation of an emergency backup water supply system, repair of damaged concrete in fish rearing units, installation of predator exclusion structures, replacement of on-station residences,
FISHERIESFisheries Spending. $38,833,119 • 168.1Full-Time Equivalents
modernization of septic systems, and replacement of an emergency backup generator
• In 2017, the Eagle Fish Health Laboratory developed the expertise needed to conduct comprehensive water quality analysis in-house. Virtually every aspect of fish health is influenced by the environmental conditions they experience. Assessing water quality in real time has greatly expanded the Department’s ability to anticipate and address challenges that could impair fish health during hatchery rearing and after release.
• As a result of resumed trout stocking in the South Fork Payette River, anglers can expect better trout fishing and more harvest
opportunity in the future. Hatchery trout stocking was discontinued in the South Fork in 2000 when the
management emphasis was shifted to wild trout. In recent years, local constituents have expressed concern over the decline in the fishery since stocking was discontinued, and the lack of stream fishing opportunity. Fishery surveys of the river have confirmed wild trout populations are not providing a quality fishery despite fairly restrictive harvest rules. This is likely due to the extremely low productivity in this system. In response, the
Department reinstituted hatchery trout stocking in 2017, focusing on heavily used campgrounds and
other access areas. In the coming years regional staff will monitor the fishery and adjust stocking as needed to
improve angler satisfaction.
• The above average snowpack and high spring runoff in 2017 created excellent reservoir conditions not seen in several years across southern Idaho. Fishery managers took advantage by increasing trout stocking in some waters and by rebuilding warmwater fisheries in others. In the Southwest Region fisheries staff transplanted bass, bluegill, and crappie into Paddock, Indian Creek, and Blacks Creek reservoirs. All of these waters have historically
Capital outlay
13%
Operating40%
Personnel47%
Director’s Report to the Commission 2017 9Fisheries
been excellent bass and panfish fisheries, but were dry or nearly dry in recent years. Where high spring flows precluded early season stream stocking, fish were redirected to ponds and reservoirs. In the Magic Valley Region extra hatchery trout were stocked in Little Camas, Mormon, and Thorn Creek reservoirs, also locations that had been mostly drained in recent years. Full reservoirs also lead to a boost in productivity and better overall water quality for trout and other species. All regions expect 2017 water conditions will benefit anglers well into 2018.
• In 2017, Chinook Salmon anglers expended approximately 53,600 hours fishing and harvest 1,383 jacks and 2,566 adult salmon.
• In the fall of 2016 and spring of 2017, Steelhead anglers fished 147,177 angler days to harvest 29,196 summer steelhead from the Clearwater, Snake and Salmon rivers.
• In 2016, the Bureaus of Fisheries and Communications launched a major update to the State Record Fish Program to include a new “catch-and-release” category for all the same species covered in the traditional program. The new program also separated records for four subspecies of cutthroat trout found in Idaho as well as separated spearfish/archery and rod/reel records for applicable nongame species. Since initiation of the modified program, Fisheries Bureau staff have awarded certified records for 31 different game fish species and another five non-game species.
• Access program staff maintained over 340 fishing and boating access sites throughout the state. New sites were added in the Southwest Region (Redtop Pond) and the Upper Snake Region (Antelope Creek). In addition to maintaining existing sites, staff completed needed improvements at Pringle Park in the Panhandle Region (new parking area pavement), Mormon Reservoir in the Magic Valley Region (new restroom, ADA parking pads, improved road access and new docks and gangways, and Wilson Springs Ponds in the Southwest Region (dredging completed to deepen ponds).
• The Fisheries Habitat program (working in conjunction with federal, state, non-governmental, industry and tribal partners) completed both large and small fish habitat improvement projects throughout Idaho. Most work was paid for with money secured by the Idaho Office of Species Conservation, and provided by Bonneville Power Administration and National Marine Fisheries Service. Work
completed in 2017 focused on improving salmon and steelhead spawning and rearing habitat in reaches of the Lemhi, North Fork Salmon, Potlatch, and Pahsimeroi rivers. Staff are also evaluating five years of information collected in the Potlatch and Lemhi drainages to identify (quantitatively) how habitat actions implemented to improve spawning and rearing habitat has actually benefited populations of salmon and steelhead.
• Department staff maintained over 270 fish screens and fishways in the upper Salmon River drainage that serve the purpose of keeping juvenile salmon and steelhead out of irrigation diversion ditches as they migrate from natal habitat to the ocean.
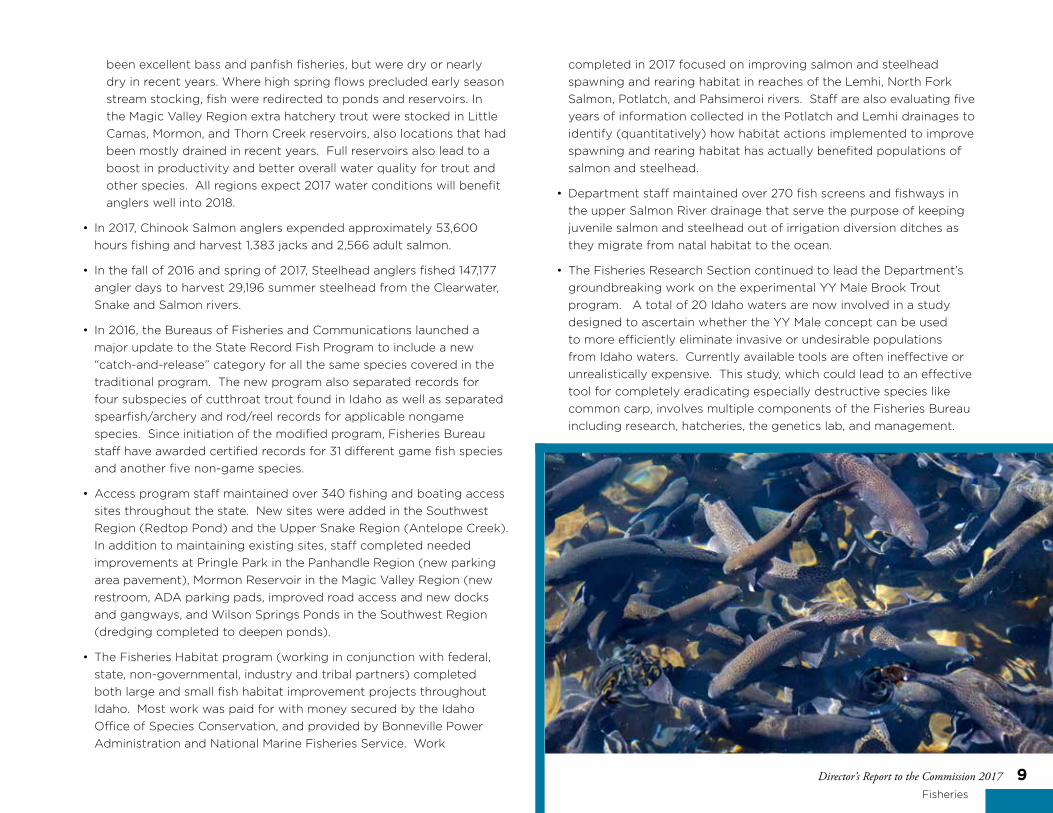
• The Fisheries Research Section continued to lead the Department’s groundbreaking work on the experimental YY Male Brook Trout program. A total of 20 Idaho waters are now involved in a study designed to ascertain whether the YY Male concept can be used to more efficiently eliminate invasive or undesirable populations from Idaho waters. Currently available tools are often ineffective or unrealistically expensive. This study, which could lead to an effective tool for completely eradicating especially destructive species like common carp, involves multiple components of the Fisheries Bureau including research, hatcheries, the genetics lab, and management.

10 Director’s Report to the Commission 2017Fisheries
Activities by Major Program
Fishing and Boating Access5.7 full-time equivalents
• Manage more than 350 fishing and boating access sites statewide owned or managed by Fish and Game.
• Our recently completed Idaho Fishing and Boating Access Guide lists all locations and amenities including ramps, toilets, ADA accessibility and campsite availability.
Anadromous Fish Hatcheries33.8 full-time equivalents
• Fish and Game manages 10 salmon and steelhead hatcheries built as mitigation for losses from hydropower projects in the Snake River drainage.
• These hatcheries produce about 10 million Chinook salmon, 5 million steelhead and one million sockeye salmon for release annually.
Fish Habitat Management5.2 full-time equivalents
• Assess, catalogue and prioritize opportunities to improve fish habitat for resident and anadromous species.
• Design, contract and implement fish habitat improvements, such as stream bank stabilization, riparian plantings and tributary reconnects.
Fish Health Management7.2 full-time equivalents
• This program diagnoses and prescribes treatments to control or elimi-nate diseases in hatchery fish, investigates fish kills and transportation of fish by outside entities.
Fish Marking 0.1 full equivalent and contracted services.
• Fish marking staff handles 15 million salmon and steelhead annually.
• Marking allows anglers to harvest hatchery raised salmon and
steelhead without jeopardizing wild stocks, and it allows both upstream and downstream migration and survival monitoring and timing.
Fish Population Management41.5 full-time equivalents
• Collect and maintain information for fishery management decisions on mountain lakes, lowland lakes and reservoirs, and rivers and streams.
• Manage populations of native and introduced fish to maintain diverse sport fishing opportunities.
Fish Screens and Diversions11.4 full-time equivalents
• Operate and maintain 230 fish screens, 307 pump intake screens, three formal fishways and numerous rock step pool fishways to perpetuate anadromous fish in the Salmon and Clearwater basins.
• Screening to protect resident fish populations and to provide technical assistance to landowners and local agencies.
Monitoring, Evaluation and Special Projects23.5 full-time equivalents
• Develop tools to improve the management of native fish populations and sport fisheries.
• Current work focuses on improving return of stocked trout to the creel; developing new genetic tools to improve the identification and man-agement of native fish populations and hatchery-supported fisheries; investigating methods to improve the abundance of ESA-listed and other fish species, and managing avian predation impacts on fish populations.
Regional Support and Coordination14.5 full-time equivalents
• Support for anadromous and resident fish management, program research, monitoring and evaluation, fish hatcheries and fish health.
Resident Fish Hatcheries25.2 full-time equivalents
• Operate 10 hatcheries that produce resident fish for stocking in more than 500 lakes, reservoirs and streams.
Director’s Report to the Commission 2017 11Fisheries
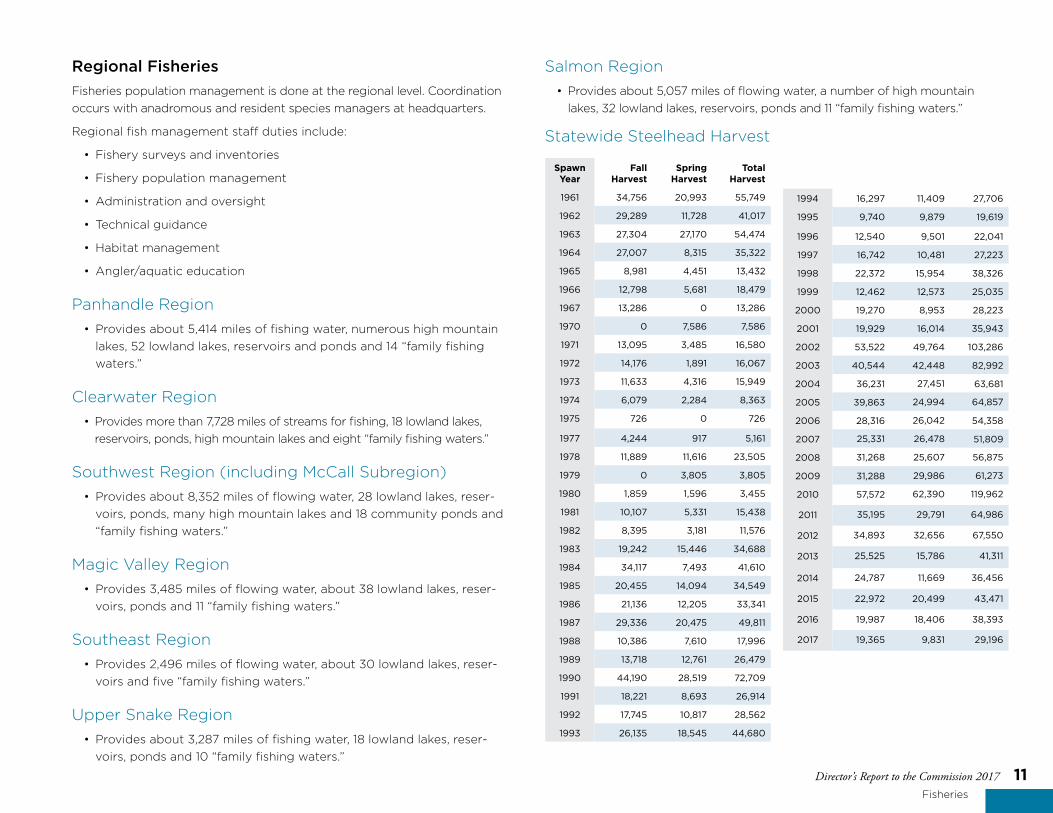
Spawn Year
Fall Harvest
Spring Harvest
Total Harvest
1961 34,756 20,993 55,749
1962 29,289 11,728 41,017
1963 27,304 27,170 54,474
1964 27,007 8,315 35,322
1965 8,981 4,451 13,432
1966 12,798 5,681 18,479
1967 13,286 0 13,286
1970 0 7,586 7,586
1971 13,095 3,485 16,580
1972 14,176 1,891 16,067
1973 11,633 4,316 15,949
1974 6,079 2,284 8,363
1975 726 0 726
1977 4,244 917 5,161
1978 11,889 11,616 23,505
1979 0 3,805 3,805
1980 1,859 1,596 3,455
1981 10,107 5,331 15,438
1982 8,395 3,181 11,576
1983 19,242 15,446 34,688
1984 34,117 7,493 41,610
1985 20,455 14,094 34,549
1986 21,136 12,205 33,341
1987 29,336 20,475 49,811
1988 10,386 7,610 17,996
1989 13,718 12,761 26,479
1990 44,190 28,519 72,709
1991 18,221 8,693 26,914
1992 17,745 10,817 28,562
1993 26,135 18,545 44,680
1994 16,297 11,409 27,706
1995 9,740 9,879 19,619
1996 12,540 9,501 22,041
1997 16,742 10,481 27,223
1998 22,372 15,954 38,326
1999 12,462 12,573 25,035
2000 19,270 8,953 28,223
2001 19,929 16,014 35,943
2002 53,522 49,764 103,286
2003 40,544 42,448 82,992
2004 36,231 27,451 63,681
2005 39,863 24,994 64,857
2006 28,316 26,042 54,358
2007 25,331 26,478 51,809
2008 31,268 25,607 56,875
2009 31,288 29,986 61,273
2010 57,572 62,390 119,962
2011 35,195 29,791 64,986
2012 34,893 32,656 67,550
2013 25,525 15,786 41,311
2014 24,787 11,669 36,456
2015 22,972 20,499 43,471
2016 19,987 18,406 38,393
2017 19,365 9,831 29,196
Regional FisheriesFisheries population management is done at the regional level. Coordination occurs with anadromous and resident species managers at headquarters.
Regional fish management staff duties include:
• Fishery surveys and inventories
• Fishery population management
• Administration and oversight
• Technical guidance
• Habitat management
• Angler/aquatic education
Panhandle Region • Provides about 5,414 miles of fishing water, numerous high mountain
lakes, 52 lowland lakes, reservoirs and ponds and 14 “family fishing waters.”
Clearwater Region• Provides more than 7,728 miles of streams for fishing, 18 lowland lakes,
reservoirs, ponds, high mountain lakes and eight “family fishing waters.”
Southwest Region (including McCall Subregion)• Provides about 8,352 miles of flowing water, 28 lowland lakes, reser-
voirs, ponds, many high mountain lakes and 18 community ponds and “family fishing waters.”
Magic Valley Region• Provides 3,485 miles of flowing water, about 38 lowland lakes, reser-
voirs, ponds and 11 “family fishing waters.”
Southeast Region• Provides 2,496 miles of flowing water, about 30 lowland lakes, reser-
voirs and five “family fishing waters.”
Upper Snake Region• Provides about 3,287 miles of fishing water, 18 lowland lakes, reser-
voirs, ponds and 10 “family fishing waters.”
Salmon Region• Provides about 5,057 miles of flowing water, a number of high mountain
lakes, 32 lowland lakes, reservoirs, ponds and 11 “family fishing waters.”
Statewide Steelhead Harvest

12 Director’s Report to the Commission 2017Wildlife
The Bureau of Wildlife inventories, monitors and manages Idaho’s wildlife resources, including more than 70 hunted species and more than 500 unhunted species. It manages about 370,000 acres of habitat on 32 wildlife management areas, provides technical assistance to private landowners and public land managers on 83,000 square miles and resolves nuisance and depredating wildlife complaints. The bureau also provides technical expertise for species listed under the Endangered Species Act. The bureau has seven primary functions, including habitat management, game management, wildlife diversity, wildlife research, wildlife health, winter feeding and depredation control, and administration.
Highlights• For the third year in a row following record-setting over-winter
survival rates, deer and elk hunters experienced excellent hunting conditions. Deer hunters harvested over 39,000 mule deer, the highest mule deer harvest in the state since 1991. Mule deer harvest has only been higher five seasons since 1975. White-tailed deer harvest was slightly lower than in 2014 and 2015, but the 27,900 whitetails harvested in 2016 was the fifth highest recorded since 1975. More than 22,500 elk were harvested in 2016, lower than 2015, but still the seventh highest elk harvest in Department history.
• Completed third year of enhanced mule deer and elk monitoring. Wildlife staff captured 354 mule deer and 349 elk. Including previous year’s captures, staff is monitoring 733 mule deer and 937 elk scattered
WILDLIFEWildlife Spending. $28,578,857 • 128 Full-Time Equivalents
across Idaho. This enhanced effort is designed to improve detection of population changes, improve information for season-setting purposes, improve information on movements and cause-specific mortality, and reduce flight risks to survey personnel. Overwinter mule deer fawn survival was the second lowest recorded since we began intensive mule deer survival monitoring during winter 1998-1999. This work provided critical information that allowed the Department to proactively respond
with significant harvest season adjustments in anticipation of population declines ahead of the 2017 hunting season.
• Idaho experienced one of the most severe winters in memory, particularly in southern Idaho where snow
depths exceeded levels recorded during the previ-ous 30 years. Conducted emergency winter feeding operations at 156 sites and provided supplemental feed to over 13,100 mule deer, nearly 12,360 elk, and over 215 pronghorn. The Department conducted its largest winter feeding operation in history on the Tex
Creek WMA where supplemental feed was provided to approximately 4,500 elk where natural winter range
habitat was severely impacted by the Henry Creek fire in September 2016.
• Responded to 1,399 complaints of wildlife depredation and paid a record-setting 79 claims and continued use agreements
for compensation for wildlife damage to growing crops, stored hay, and private rangeland. Over the last two years, the Department has spent over $1 million dollars building approximately 250 stack yards statewide to protect stored forage; and has hired seven new Sr. Wildlife Technicians to assist in responsiveness to landowner concerns and depredation prevention.
• Completed fourth year of a 10-year cooperative research project evaluating the effects of spring grazing on sage-grouse nest and brood success, vegetation structure, and insect diversity and abundance. Co-directed with the University of Idaho, we are working in concert with private landowners and BLM to manipulate grazing intensity on five study areas across southern Idaho.
Operating 41%
Capital outlay 13%
Other2%
Personnel 44%

Director’s Report to the Commission 2017 13Wildlife
• Produced mule deer and elk seasonal use models for summer, winter, and transition ranges using location from all of the radio collared animals in the state. These models are available to biologist to assist with project planning and evaluating impacts of land use.
• Developed a new technique to estimate population size and recruitment of big game animals with camera traps in cooperation with the University of Montana. These new methods will allow us to estimate population sizes of elk and white-tailed deer in forested habitat like the Panhandle and reduce helicopter time in diverse habitats from open sage to boreal forest.
• Completed the second year of a three-year project to estimate state and regional level wolf population trend. This project will develop techniques to estimate wolf population trend using data from camera stations, rendezvous site surveys, and hunter surveys. Harvest data will be used to further corroborate population estimates derived from standardized surveys. Additionally, in focal study areas, we will test the ability of varying camera densities to estimate wolf density.
• After several years of effort working with key stakeholders to develop and implement a trapper education course requirement, the rule requiring all individuals who purchased their first trapping license after 2011 to attend a trapper education course went into effect on July 1. The program is intended to provide new, less-experienced trappers with a good understanding of laws, ethics, and responsibility; and hopefully, result in a reduction in non-target captures.
• Captured, radio-collared, and health tested bighorn sheep in the East Fork of the Salmon River, the Owyhee River, and the Lost River Range Population Management Units. The Owyhee River and East Fork Salmon River populations are a part of a new graduate student research project looking at limiting factors affecting populations of bighorn sheep.
• Analyzing bighorn sheep DNA samples, respiratory pathogens, and habitat to determine connectivity between bighorn sheep populations. Ultimately, this information will be used to develop a predictive model of connectivity between populations to assist management.
• Continued with the third year of collecting health samples from harvested bighorn sheep and mountain goats. We are looking for respiratory pathogens that could be impacting populations.
• Concluded a five-year collaborative effort to reestablish a viable population of Columbian sharp-tailed grouse (CSTG) in northeastern Nevada, where populations were extirpated. From 2013-2017, 215 grouse from lek sites in
14 Director’s Report to the Commission 2017Wildlife
southeastern Idaho were translocated to Elko County, Nevada. A lek consisting of 18 males has been established in northeastern Nevada as a result of these translocation efforts.
• Lead an effort to produce the WAFWA Chukar and Gray Partridge Management Guidelines. The development of the Guidelines was part of a continuing effort to establish species-specific conservation strate-gies to guide resource planning and on-the-ground habitat manage-ment initiatives.
• Led the statewide, multi-partner effort to strategically monitor 1,288 sage-grouse leks and evaluated population trends relative to adaptive management triggers identified in the 2012 Governor’s Plan and BLM’s 2015 Land Use Plan Amendments. Forty percent of the leks monitored were on standardized lek routes while 60 percent were randomly selected to assure an adequate sample of leks among Priority and Important habitats within four Conservation Areas.
• Assisted the Governor’s Office of Species Conservation, federal agency partners, and stakeholders to develop a sage-steppe mitigation strategy to offset impacts resulting from large-scale infrastructure development on sage-grouse and other sagebrush obligate species. An operational Habitat Quantification Tool (HQT) was developed, which will help quantify habitat function and direct projects to the most beneficial locations for sage-grouse.
• Implemented several projects with the help of the Bureau of Reclamation, Rocky Mountain Elk Foundation, BLM and Mule Deer Foundation to restore wildlife habitat on Tex Creek WMA after the Henry’s Creek Fire. Projects included applying a naturally-occurring soil bacterium to combat cheatgrass across 6,800 acres and late-winter aerial seeding on 3,300 acres. Personnel will plant approximately 200,000 sagebrush seedlings in fall 2017.
• Worked with landowners and our partners in USDA to develop habitat for wildlife on private property. In FY 17, Idaho had over 150,000 private acres of habitat enrolled in the State Acres For wildlife Enhancement (SAFE). These acres provide critical habitat for sharp-tailed grouse, mule deer and upland game birds as well as improve water quality that impacts our rivers and streams.
• Developed an agreement with The Nature Conservancy and Wood River Land Trust to restore wildlife habitat on the 10,000 acre Rock Creek Ranch. In exchange the ranch is open to public access.
• Collaborated with the Fisheries Bureau and U.S. Fish and Wildlife Service to implement the Commissioned-approved Management Plan for the Conservation of American White Pelicans in Idaho. Recent efforts have successfully reduced the nesting population on Blackfoot Reservoir, which is expected to reduce impacts on Yellowstone cutthroat trout in the Blackfoot River.
• Joined with three other western states (MT, WY, and WA) to complete the first ever comprehensive survey of wolverine distribution in the lower 48. Placed 188 baited cameras/hair-snag stations across Idaho, Washington, Montana, and Wyoming. Results will be used to generate a snapshot-in-time of wolverine occupancy across all four states, and hair-snag samples will give a new look at the genetic characteristics and connectivity of the entire metapopulation. This project is contributing important information to the wolverine status assessment and listing decision due from the U.S. Fish and Wildlife Service.
• Continued Idaho’s white-nose syndrome (WNS) response and surveillance effort. Submitted 84 bat swab and 79 environmental swab samples from 15 locations to the USGS National Wildlife Health Center for WNS diagnostics (all swabs tested negative for the causative agent of WNS), and coordinated with Bat Conservation International’s Subterranean Program to complete hibernacula counts at two abandoned mine lands prioritized for surveillance.
Wildlife Programs
Habitat Management 53.5 full-time equivalents
• Responsible for 32 wildlife management areas, totaling more than 314,000 acres, for use by hunters, anglers and the public, and with an estimated 700,000 visitor-days.
• Provide technical assistance to private and public land managers.
• Develop and oversee private land habitat programs and landscape-scale habitat initiatives.
• The habitat program pays an annual fire protection assessment to the Idaho Department of Lands.
• Program pays $203,000 in payments in lieu of taxes to counties.

Director’s Report to the Commission 2017 15Wildlife
Game Management 34.4 full-time equivalents
• Biologists collect data, analyze and report on the population status of 12 big game, 11 upland game, 9 furbearer, 19 migratory bird, and other harvested species.
• Recommend harvest opportunities, solicit public involvement in wildlife management and coordinate development of species management plans.
• Coordinate development of rules brochures, including 325,000 big game, 1,500 Landowner Appreciation Program, 125,000 waterfowl brochures annually, and 250,000 moose, bighorn sheep and mountain goat, and 440,000 upland game brochures biennially.
• Headquarters staff administer and coordinate harvest estimates from about 225,000 big game tag purchasers, 45,000 upland game bird hunters and 22,500 waterfowl hunters.
Wildlife Diversity 18 full-time equivalents
• Collect, analyze and report data on at-risk wildlife species, with an emphasis on those not harvested.
• Provide technical assistance on appropriate management actions to ensure conservation and retention of state-management authority for over 200 “Species of Greatest Conservation Need”.
• Implement elements of Fish and Game’s Strategic Plan (collaborate with interested and affected parties to recover threatened and endangered species).
• Monitor and provide technical assistance on four federally listed threatened plant species and three candidate plant species.
• Funded with federal grants, the nongame trust account composed of wildlife license plate and Idaho income check-off revenues, and private and local sources. No license dollars are directed to Wildlife Diversity.
Wildlife Research6.8 full-time equivalents
• Develop reliable knowledge and tools to help wildlife managers meet population objectives.
• Focus on complex management issues, requiring in-depth analysis beyond the capability of routine management activities.
• Capture and monitor more than 1,000 individual animals annually.
Wildlife Health 2.6 full-time equivalents
• Monitor and develop responses to wildlife diseases, perform and coordinate animal health diagnostics.
• Provide training in animal immobilization and restraint, conduct necropsies and provide veterinary support for regional animal handling projects.
• Work with the Idaho State Department of Agriculture on management responses to diseases potentially affecting wildlife and domestic livestock.
Winter Feeding and Depredation Control6.8 full-time equivalents
• Provide technical assistance and materials to reduce or prevent depredation losses and improve relationships between sportsmen and private landowners.
• Respond to 500 to 1,500 nuisance or depredation complaints annually.
• Process about 30 depredation claims, resulting in payment of $100,000 to $300,000 to private landowners for damage caused by wildlife.
• Implement the commission’s Emergency Winter Feeding policy. Depending on winter conditions, the Department will routinely feed from 500 to 2,000 deer, elk, and pronghorn antelope in varying locations.
Administration5.9 full-time equivalents
• Supervise all wildlife bureau programs, administer the wildlife bureau budget, coordinate federal aid, and provide administrative support.
• Provide policy support for the Fish and Game director and the Idaho Fish and Game Commission.
16 Director’s Report to the Commission 2017Enforcement
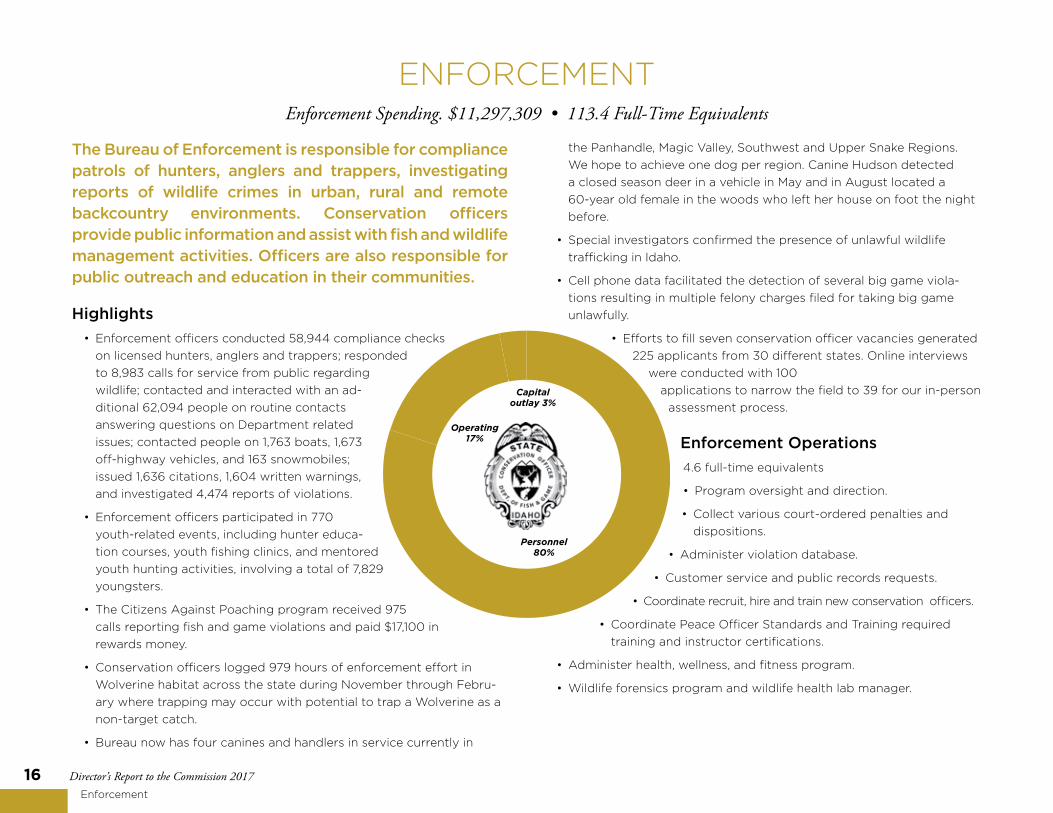
The Bureau of Enforcement is responsible for compliance patrols of hunters, anglers and trappers, investigating reports of wildlife crimes in urban, rural and remote backcountry environments. Conservation officers provide public information and assist with fish and wildlife management activities. Officers are also responsible for public outreach and education in their communities.
Highlights• Enforcement officers conducted 58,944 compliance checks
on licensed hunters, anglers and trappers; responded to 8,983 calls for service from public regarding wildlife; contacted and interacted with an ad-ditional 62,094 people on routine contacts answering questions on Department related issues; contacted people on 1,763 boats, 1,673 off-highway vehicles, and 163 snowmobiles; issued 1,636 citations, 1,604 written warnings, and investigated 4,474 reports of violations.
• Enforcement officers participated in 770 youth-related events, including hunter educa-tion courses, youth fishing clinics, and mentored youth hunting activities, involving a total of 7,829 youngsters.
• The Citizens Against Poaching program received 975 calls reporting fish and game violations and paid $17,100 in rewards money.
• Conservation officers logged 979 hours of enforcement effort in Wolverine habitat across the state during November through Febru-ary where trapping may occur with potential to trap a Wolverine as a non-target catch.
• Bureau now has four canines and handlers in service currently in
ENFORCEMENTEnforcement Spending. $11,297,309 • 113.4 Full-Time Equivalents
the Panhandle, Magic Valley, Southwest and Upper Snake Regions. We hope to achieve one dog per region. Canine Hudson detected a closed season deer in a vehicle in May and in August located a 60-year old female in the woods who left her house on foot the night before.
• Special investigators confirmed the presence of unlawful wildlife trafficking in Idaho.
• Cell phone data facilitated the detection of several big game viola-tions resulting in multiple felony charges filed for taking big game unlawfully.
• Efforts to fill seven conservation officer vacancies generated 225 applicants from 30 different states. Online interviews
were conducted with 100 applications to narrow the field to 39 for our in-person
assessment process.
Enforcement Operations4.6 full-time equivalents
• Program oversight and direction.
• Collect various court-ordered penalties and dispositions.
• Administer violation database.
• Customer service and public records requests.
• Coordinate recruit, hire and train new conservation officers.
• Coordinate Peace Officer Standards and Training required training and instructor certifications.
• Administer health, wellness, and fitness program.
• Wildlife forensics program and wildlife health lab manager.
Personnel 80%
Operating 17%
Capital outlay 3%
Director’s Report to the Commission 2017 17Enforcement
Special Investigations4 full-time equivalents
• Coordinate and supervise special investiga-tion unit detecting and prosecuting habitual wildlife criminals and illegal commercial wildlife violations.
• Coordinate Citizens Against Poaching (CAP) program.
Regional Enforcement Each region has a regional conservation officer – the program manager, a regional investigator and two to three district conservation officers, who are first line supervisors. Each supervisor is assigned four to seven senior conservation officers or conservation officers. The average conservation officer patrol area exceeds 1,000 square miles.
Panhandle Region: 15.8 officers
• Two region officers are specially funded; one through Avista for bull trout enforce-ment and education; and one through private, federal, state grants for grizzly bear enforcement and education.
Clearwater Region: 15 officers
Southwest Region: 22 officers
Magic Valley Region: 15 officers
Southeast Region: 13 officers
Upper Snake: 15 officers
Salmon Region: 9 officers
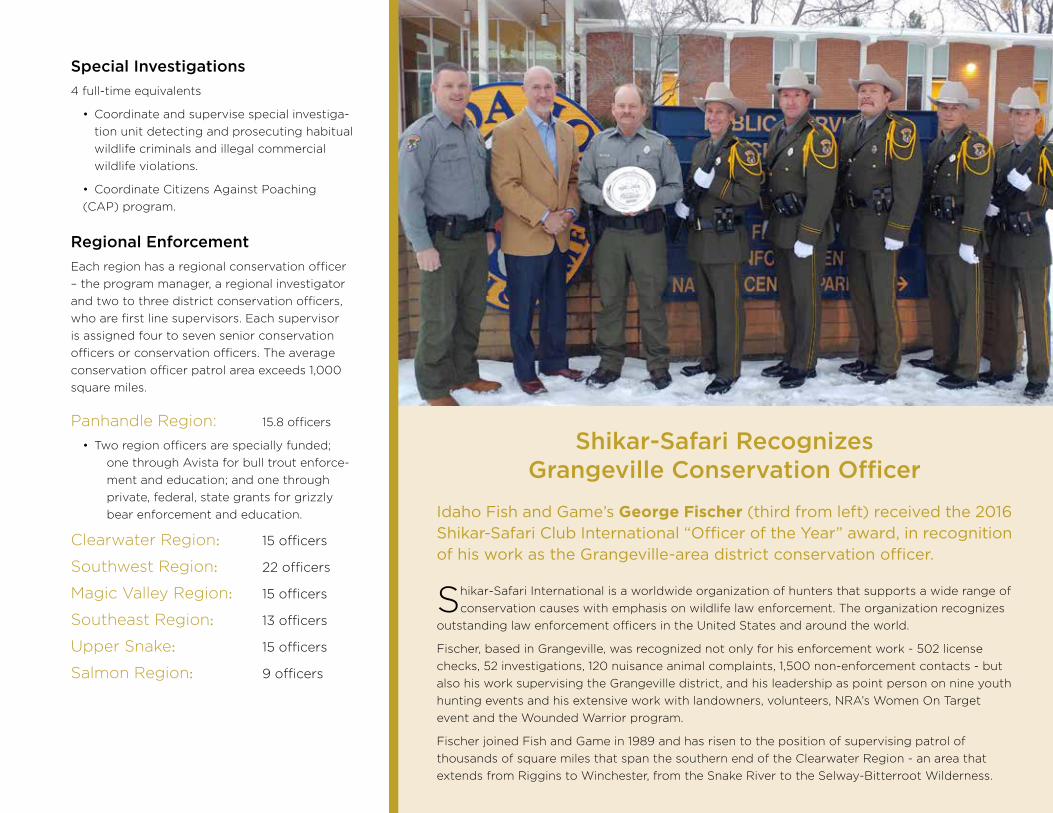
Shikar-Safari Recognizes Grangeville Conservation Officer
Idaho Fish and Game’s George Fischer (third from left) received the 2016 Shikar-Safari Club International “Officer of the Year” award, in recognition of his work as the Grangeville-area district conservation officer.
Shikar-Safari International is a worldwide organization of hunters that supports a wide range of conservation causes with emphasis on wildlife law enforcement. The organization recognizes
outstanding law enforcement officers in the United States and around the world.
Fischer, based in Grangeville, was recognized not only for his enforcement work - 502 license checks, 52 investigations, 120 nuisance animal complaints, 1,500 non-enforcement contacts - but also his work supervising the Grangeville district, and his leadership as point person on nine youth hunting events and his extensive work with landowners, volunteers, NRA’s Women On Target event and the Wounded Warrior program.
Fischer joined Fish and Game in 1989 and has risen to the position of supervising patrol of thousands of square miles that span the southern end of the Clearwater Region - an area that extends from Riggins to Winchester, from the Snake River to the Selway-Bitterroot Wilderness.

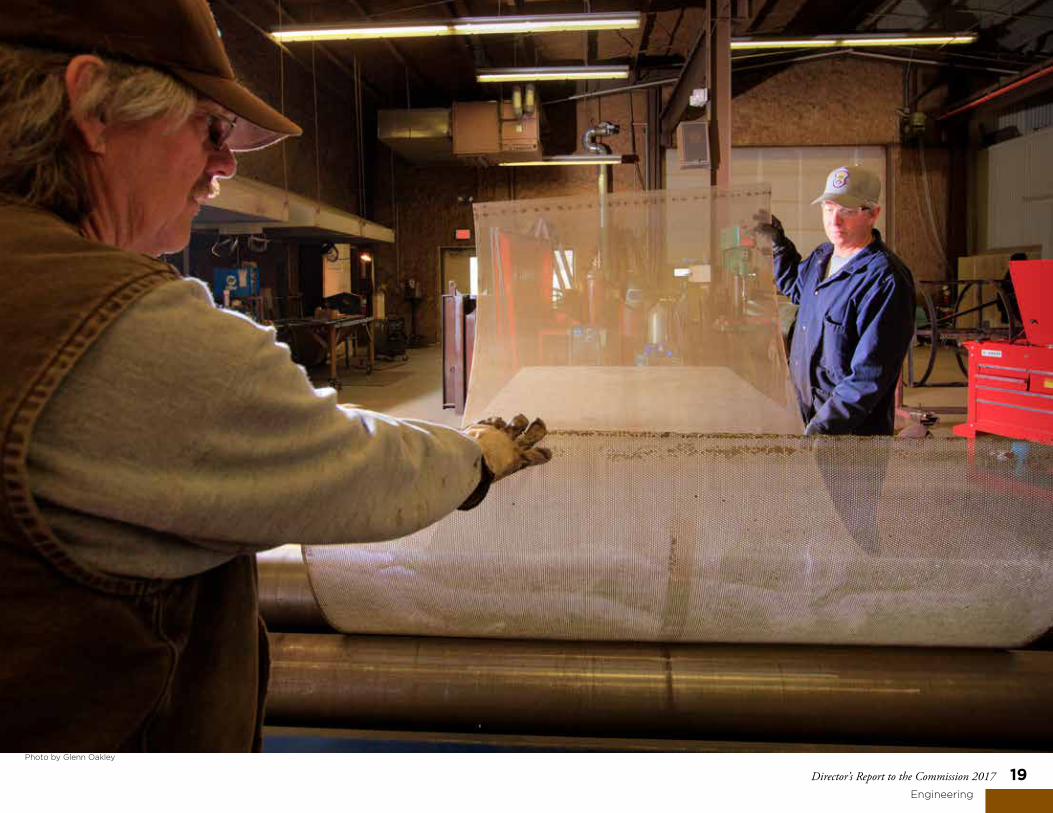
18 Director’s Report to the Commission 2017Engineering
Boise Warehouse 1 full-time equivalent
• Procure and store supplies and issues them to Fish and Game em-ployees statewide.
• Process and maintain inventory records, provide critical support for the fleet program and assist the Boise construction crew.
Construction/Support 9.5 full-time equivalents
• Construction professionals based in Boise travel the state providing construction services to Fish and Game facilities including in-stream projects.
• The one-third full-time position consists of four fisheries employees who work on regional projects for one-month each and are based in Salmon.
• One mechanic, located in Garden City, maintain Fish and Game vehicles and heavy equipment.
Engineering Management 4 full-time equivalents
• Licensed professional engineers and an office administrator provide professional engineering services to Fish and Game, including design, permitting, contracts and project construction management.
• Projects include administrative buildings, hatcheries, wildlife manage-ment areas, residences, fishing and boating access, dams, roads and bridges, habitat work, fish passage and various others.
• The team prepares projects to be built by the Boise construction crew.
• Most construction projects are bid through the public works bidding process.
The Engineering Bureau constructs and maintains facilities in a cost-effective, efficient, and safe manner. It has six areas of responsibility: engineering management, warehouse operation, Boise mechanical shop, Boise construction, Salmon construction and Salmon mechanical shop. Budget is comprised primarily of personnel and related operating. Capital projects are paid for by the benefitting bureau.
Highlights• Provided engineering services for the State-
wide Fishing and Boating Access program consisting of design and/or construction on approximately 15 site improvements.
• Provided engineering services for Family Fishing Water projects throughout the state consisting of the design and/or construction of 9 site improvements.
• Provided engineering services for the State Fish Hatch-ery program consisting of the design and/or construction of 28 different hatchery improvements.
• Provided engineering services for IDFG Administrative Sites consist-ing of the design and/or construction of 11 site improvements.
• Provided engineering services for Wildlife Management Area projects consisting of the design and/or construction of approximately18 improvements.
• Provided engineering services for a variety of miscellaneous projects throughout the state including habitat restoration, anadromous fish screening, shooting ranges, IDFG dams, sockeye fish trap, outside project consultation, and a variety of others.
ENGINEERINGEngineering Spending. $922,273 • 14.5 Full-Time Equivalents
Personnel 91%
Operating9%
Director’s Report to the Commission 2017 19Engineering
Photo by Glenn Oakley

20 Director’s Report to the Commission 2017
Communications
annual license. Resident license sales in July and August indicate the campaign may be having a positive effect.
• Over 230 new hunters were certified in classes now being taught at the MK Nature Center in Boise. The facility hosted 13 field days and one instructor-led class. The Nature Center offers a nice classroom and
natural area to simulate hunting scenarios.
• The Project WILD program took steps to make registration easier for teachers adding online registration and credit
card capabilities. Class numbers during the past year were up 22 percent from 171 in FY16 to 219 for FY17. FY18 has started out strong with 214 for first three months.
• Direct e-mailing to license buyers continued through FY17. Analytics show consistently high unique open rates (25.46% to 61.56%) and unique click-through rates (1.38% to 9.90%) and low unsubscribe rates
(0.04% to 0.69%). Although conversion rates were unavailable, the last two e-mails of FY17 brought about
200 individuals to the purchase site. In general, e-mails about hunting result in more engagement than do e-mails
about fishing. This is likely because hunting is more driven by key dates and deadlines than is fishing.
• Several Communications Bureau staff members had leading roles in planning and staging Fish and Game’s 28th In-Service Training School held in spring 2017. The theme was Communicating and Connecting; Sharing what we do and why it matters. A post-ISTS survey showed that 88% of attendees rated ISTS as either good or very good.
• BOC assumed out-of-state sports show coordination from the Bureau of Wildlife in FY17. Fish and Game staffed multi-day sports shows in CA, OR, WA, NV, UT and AZ. Several seminars on DIY hunting in Idaho were given at OR and WA shows and generated a great deal of interest. About 925 names, address and e-mails were collected and rules books were e-mailed or mailed to those who requested them. Contacts will be checked against the license database at the end of the year. For the first time, staff was able to sell licenses and Super
The Bureau of Communications informs, educates, and involves people in the management of Idaho’s fish and wildlife. The bureau produces a variety of printed, video and education materials; organizes volunteers, stages various habitat improvement and outdoor educational activities and events; manages the Idaho’s hunter/bowhunter and aquatic education programs; and provides customer service at the Fish and Game headquarters in Boise.
Highlights • Fish and Game staff throughout Southern Idaho
worked last winter to address serious depredation and winter feeding challenges brought on by high snow depths and cold temperatures. The Communications Bureau regional and headquarters staff also worked to inform the public about those efforts by creating near real-time information updates on the Fish and Game website and by organizing and staging a press conference attending by most of Idaho’s major news outlets. BOC staff also developed a time-lapse video of the Tex Creek operations, which generated considerable interest and positive news coverage. As a result of these proactive outreach efforts, the general public was generally aware of Fish and Game’s efforts and complaints and concern was fairly minimal.
• BOC’s Price Lock outreach strategy had to be nimble throughout the legislative session. The original Price Lock proposal changed significantly when it morphed into House Bill 230. Working with the Director’s Office, staff members created and distributed outreach materials that assisted in the passage of HB 230. After the Bill became law, BOC staff created a multi-pronged marketing campaign designed to encourage Idaho citizens to “Lock-in” at 2017 rates by purchasing an
Personnel 69%
Operating29%
Capital Outlay 2%
COMMUNICATIONSCommunication Spending. $4,177,168 • 33.3 Full-Time Equivalents

Director’s Report to the Commission 2017 21Communications
Hunt entries (at three shows only), and sold a total of approximately $7,600 worth of items. On individual purchased 515 Super Hunt entries. About $28,000 in personnel and $15,000 in operating were spent.
• Information and application packets were mailed to almost 48,000 nonresidents. For the first time, a follow-up postcard was sent (five months after the original mailing). By November, 20,340 individuals (43%) had purchased at least one item. We cannot determine cause-and-effect of the mailer and purchasing, although over 1,400 individuals who completed the paper application and returned the form to HQ Licensing received benefit from the packet (worth $218,000 in revenue).
Communications Functions and Programs
Customer Service3 full-time equivalents
Located at Fish and Game headquarters in Boise.
• Answer customer calls and requests for information from throughout the state, nation and world.
• Sell licenses, tags and maps.
Graphic Design1 full-time equivalent
• Design, produces and coordinates printing projects.
Internet Services2.8 full-time equivalents
• Design and maintain the Fish and Game website.
Information6.2 full-time equivalents
• Produce and distribute hunting and fishing rule books, news releases, other publications, online content and informational videos and social media.
• Respond to customer e-mail inquiries.
• Integrate social sciences with biological sciences into Fish and Game decision making.
Conservation Education11.4 full-time equivalents
• Coordinate the efforts of over 1,000 volunteer hunter and bowhunter education instructors.
• Manage conservation education programs like Project WILD and Project Nose-to-Nose; produced Wildlife Express, a wildlife newspaper delivered to elementary classrooms across the state.
• Operate the MK Nature Center in Boise, providing educational programs and opportunities to tens of thousands of students and visitors annually.
Regional Programs8.9 full-time equivalents
• Regional conservation educators manage information and education and supervise volunteer services coordinators, wildlife educators and hunter education volunteer instructors.
• Together these people annually recruit over 4,000 volunteers who contribute over $1 million in-kind match for federal grants. “Take Me Fishing” clinics around the state draw over 6,000 participants. Vol-unteer hunter education instructors certify over 11,000 new hunters, bowhunters and trappers.

22 Director’s Report to the Commission 2017
Administration
The Administration Bureau provides accounting services, financial reporting, establishes and monitors internal controls, administrative policy and direction. The bureau also manages Fish and Games’s licensing operations and is responsible for managing the department’s fleet of motorized equipment.
Highlights• Awarded the contract for a new licensing system to JMT in April.
This new system is anticipated to be operation in the spring of 2018, and includes the provision for a Controlled Hunt Draw system to be part of the contract, operated by the vendor.
• Modified the current licensing system to implement the new Access/Depredation fee on time on May 1st, which was approved by the Legislature as part of the Department’s fee increase and “price lock” program.
• Coordinated with all bureaus for the second straight year for targeted spending on one-time, shovel ready projects to address department priorities including radio collars for big game wildlife research, stackyards to continue addressing landowner depredation, and other depredation prevention activities after the significant winter weather event of 2017.
• Completed the RFP for a new Region 3 regional office land and building in Nampa near the freeway. This location will be easily visible and accessible to the public, and current plans are to finish construction by spring of 2019.
Administration Functions
Financial Management & Reporting15 full-time equivalents
• Fiscal management includes accounting and budgeting, management and billing of federal and private grants, cash management and accounts payable.
• The budget includes maintenance costs for the mailroom, facilities and landscaping at headquarters.
• Reporting includes financial statements submitted to the State Controller’s Office, which are included with the
statewide Consolidated Annual Financial Report (CAFR).
Purchasing5 full-time equivalents.
• Oversee purchasing contracts.
• Operate mailroom and brochure shipping.
• Building and grounds maintenance.
• Conduct auctions for used equipment.
License Operations5 full-time equivalents
• Licensing system is provided by a contractor for about $2 million annually, which includes all hardware, software and supplies provided to vendors.
• License staff is available 10 hours a day on regular business days and half a day on Saturday to support the more than 380 statewide vendors who sell licenses to and answers questions from the general public.
ADMINISTRATIONAdministration Spending. $10,731,023 • 53.2 Full-Time Equivalents
Personnel 36%
Operating 25%
Capital Outlay 39%

Director’s Report to the Commission 2017 23Administration
Fleet Management1 full-time equivalent
• Charges internal rent to every user of motorized equipment.
• Minimizes the life-cycle cost of vehicles by ensuring they are well maintained and replaced regularly to maximize proceeds from the sale of used vehicles.
• History and cost is available in a separate report.
Regional Operations27.2 full-time equivalents
• Regional supervisors and front desk staff at each regional office are included in the administrative cost of regional operations.
• Largest expenditure is the rent and utility costs of facilities around the state.
• (Regional biologists are funded under the separate wildlife and fisheries bureaus.)
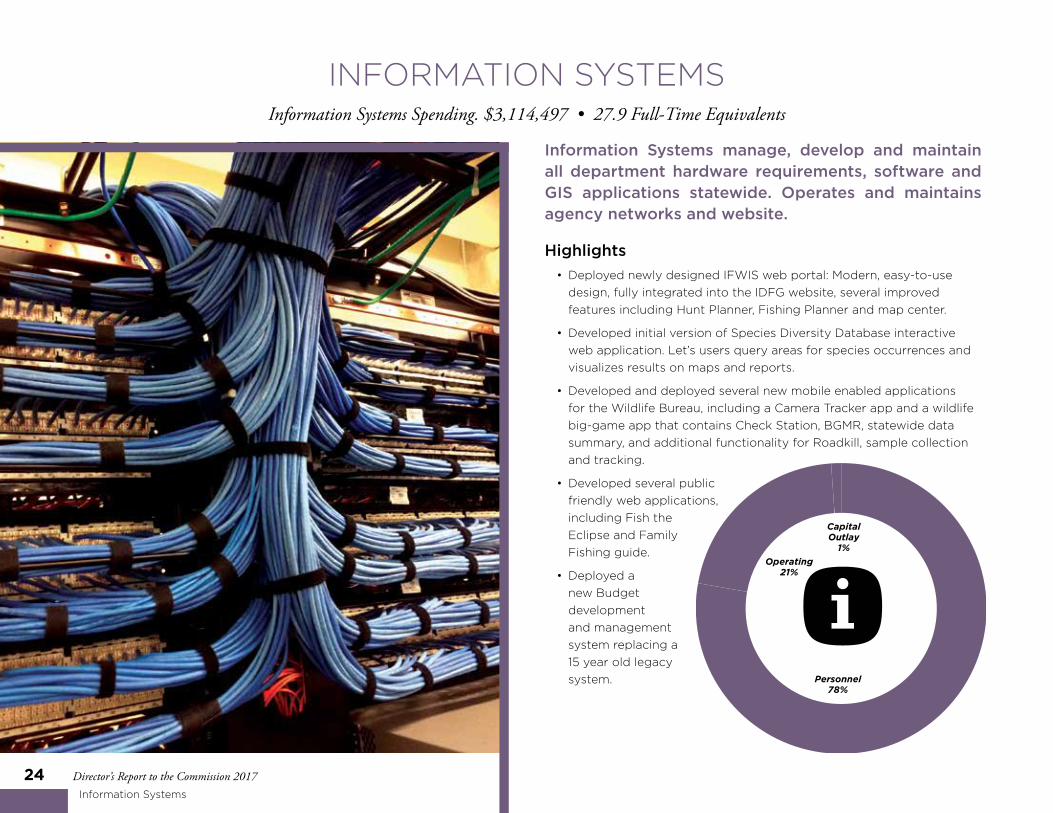
24 Director’s Report to the Commission 2017Information Systems
INFORMATION SYSTEMSInformation Systems Spending. $3,114,497 • 27.9 Full-Time Equivalents
Information Systems manage, develop and maintain all department hardware requirements, software and GIS applications statewide. Operates and maintains agency networks and website.
Highlights• Deployed newly designed IFWIS web portal: Modern, easy-to-use
design, fully integrated into the IDFG website, several improved features including Hunt Planner, Fishing Planner and map center.
• Developed initial version of Species Diversity Database interactive web application. Let’s users query areas for species occurrences and visualizes results on maps and reports.
• Developed and deployed several new mobile enabled applications for the Wildlife Bureau, including a Camera Tracker app and a wildlife big-game app that contains Check Station, BGMR, statewide data summary, and additional functionality for Roadkill, sample collection and tracking.
• Developed several public friendly web applications, including Fish the Eclipse and Family Fishing guide.
• Deployed a new Budget development and management system replacing a 15 year old legacy system.
Capital Outlay
1%
Personnel 78%
Operating 21%
Director’s Report to the Commission 2017 25
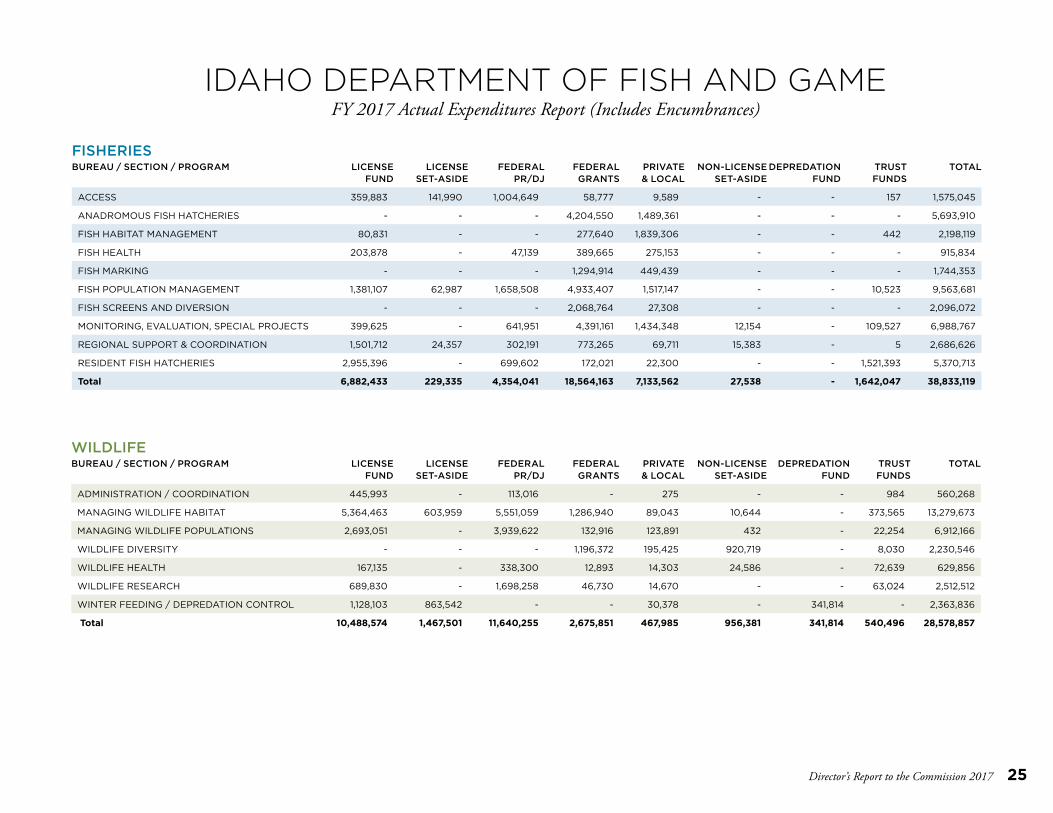
IDAHO DEPARTMENT OF FISH AND GAMEFY 2017 Actual Expenditures Report (Includes Encumbrances)
WILDLIFEBUREAU / SECTION / PROGRAM LICENSE
FUND LICENSE
SET-ASIDE FEDERAL
PR/DJ FEDERAL GRANTS
PRIVATE & LOCAL
NON-LICENSE SET-ASIDE
DEPREDATION FUND
TRUST FUNDS
TOTAL
ADMINISTRATION / COORDINATION 445,993 - 113,016 - 275 - - 984 560,268
MANAGING WILDLIFE HABITAT 5,364,463 603,959 5,551,059 1,286,940 89,043 10,644 - 373,565 13,279,673
MANAGING WILDLIFE POPULATIONS 2,693,051 - 3,939,622 132,916 123,891 432 - 22,254 6,912,166
WILDLIFE DIVERSITY - - - 1,196,372 195,425 920,719 - 8,030 2,230,546
WILDLIFE HEALTH 167,135 - 338,300 12,893 14,303 24,586 - 72,639 629,856
WILDLIFE RESEARCH 689,830 - 1,698,258 46,730 14,670 - - 63,024 2,512,512
WINTER FEEDING / DEPREDATION CONTROL 1,128,103 863,542 - - 30,378 - 341,814 - 2,363,836
Total 10,488,574 1,467,501 11,640,255 2,675,851 467,985 956,381 341,814 540,496 28,578,857
FISHERIESBUREAU / SECTION / PROGRAM LICENSE
FUND LICENSE
SET-ASIDE FEDERAL
PR/DJ FEDERAL GRANTS
PRIVATE & LOCAL
NON-LICENSE SET-ASIDE
DEPREDATION FUND
TRUST FUNDS
TOTAL
ACCESS 359,883 141,990 1,004,649 58,777 9,589 - - 157 1,575,045
ANADROMOUS FISH HATCHERIES - - - 4,204,550 1,489,361 - - - 5,693,910
FISH HABITAT MANAGEMENT 80,831 - - 277,640 1,839,306 - - 442 2,198,119
FISH HEALTH 203,878 - 47,139 389,665 275,153 - - - 915,834
FISH MARKING - - - 1,294,914 449,439 - - - 1,744,353
FISH POPULATION MANAGEMENT 1,381,107 62,987 1,658,508 4,933,407 1,517,147 - - 10,523 9,563,681
FISH SCREENS AND DIVERSION - - - 2,068,764 27,308 - - - 2,096,072
MONITORING, EVALUATION, SPECIAL PROJECTS 399,625 - 641,951 4,391,161 1,434,348 12,154 - 109,527 6,988,767
REGIONAL SUPPORT & COORDINATION 1,501,712 24,357 302,191 773,265 69,711 15,383 - 5 2,686,626
RESIDENT FISH HATCHERIES 2,955,396 - 699,602 172,021 22,300 - - 1,521,393 5,370,713
Total 6,882,433 229,335 4,354,041 18,564,163 7,133,562 27,538 - 1,642,047 38,833,119
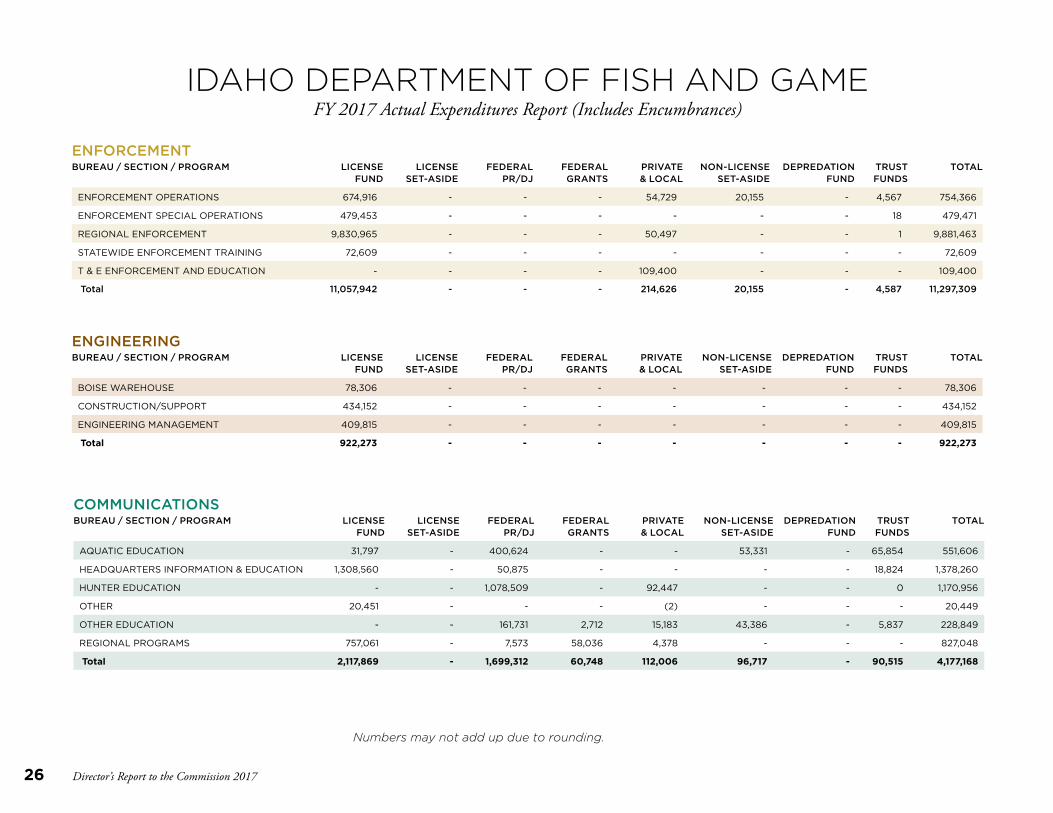
26 Director’s Report to the Commission 2017
Numbers may not add up due to rounding.
ENGINEERINGBUREAU / SECTION / PROGRAM LICENSE
FUND LICENSE
SET-ASIDE FEDERAL
PR/DJ FEDERAL GRANTS
PRIVATE & LOCAL
NON-LICENSE SET-ASIDE
DEPREDATION FUND
TRUST FUNDS
TOTAL
BOISE WAREHOUSE 78,306 - - - - - - - 78,306
CONSTRUCTION/SUPPORT 434,152 - - - - - - - 434,152
ENGINEERING MANAGEMENT 409,815 - - - - - - - 409,815
Total 922,273 - - - - - - - 922,273
ENFORCEMENTBUREAU / SECTION / PROGRAM LICENSE
FUND LICENSE
SET-ASIDE FEDERAL
PR/DJ FEDERAL GRANTS
PRIVATE & LOCAL
NON-LICENSE SET-ASIDE
DEPREDATION FUND
TRUST FUNDS
TOTAL
ENFORCEMENT OPERATIONS 674,916 - - - 54,729 20,155 - 4,567 754,366
ENFORCEMENT SPECIAL OPERATIONS 479,453 - - - - - - 18 479,471
REGIONAL ENFORCEMENT 9,830,965 - - - 50,497 - - 1 9,881,463
STATEWIDE ENFORCEMENT TRAINING 72,609 - - - - - - - 72,609
T & E ENFORCEMENT AND EDUCATION - - - - 109,400 - - - 109,400
Total 11,057,942 - - - 214,626 20,155 - 4,587 11,297,309
COMMUNICATIONSBUREAU / SECTION / PROGRAM LICENSE
FUND LICENSE
SET-ASIDE FEDERAL
PR/DJ FEDERAL GRANTS
PRIVATE & LOCAL
NON-LICENSE SET-ASIDE
DEPREDATION FUND
TRUST FUNDS
TOTAL
AQUATIC EDUCATION 31,797 - 400,624 - - 53,331 - 65,854 551,606
HEADQUARTERS INFORMATION & EDUCATION 1,308,560 - 50,875 - - - - 18,824 1,378,260
HUNTER EDUCATION - - 1,078,509 - 92,447 - - 0 1,170,956
OTHER 20,451 - - - (2) - - - 20,449
OTHER EDUCATION - - 161,731 2,712 15,183 43,386 - 5,837 228,849
REGIONAL PROGRAMS 757,061 - 7,573 58,036 4,378 - - - 827,048
Total 2,117,869 - 1,699,312 60,748 112,006 96,717 - 90,515 4,177,168
IDAHO DEPARTMENT OF FISH AND GAMEFY 2017 Actual Expenditures Report (Includes Encumbrances)
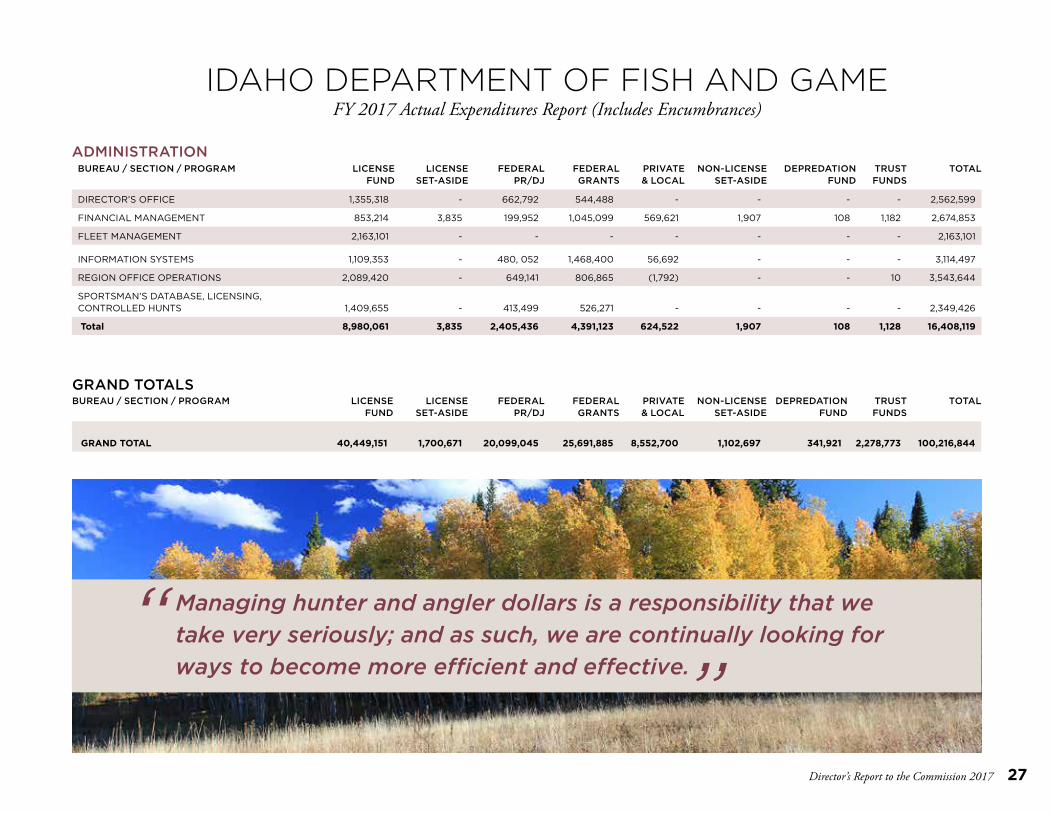
Director’s Report to the Commission 2017 27
GRAND TOTALSBUREAU / SECTION / PROGRAM LICENSE
FUND LICENSE
SET-ASIDE FEDERAL
PR/DJ FEDERAL GRANTS
PRIVATE & LOCAL
NON-LICENSE SET-ASIDE
DEPREDATION FUND
TRUST FUNDS
TOTAL
GRAND TOTAL 40,449,151 1,700,671 20,099,045 25,691,885 8,552,700 1,102,697 341,921 2,278,773 100,216,844
ADMINISTRATIONBUREAU / SECTION / PROGRAM LICENSE
FUND LICENSE
SET-ASIDE FEDERAL
PR/DJ FEDERAL GRANTS
PRIVATE & LOCAL
NON-LICENSE SET-ASIDE
DEPREDATION FUND
TRUST FUNDS
TOTAL
DIRECTOR’S OFFICE 1,355,318 - 662,792 544,488 - - - - 2,562,599
FINANCIAL MANAGEMENT 853,214 3,835 199,952 1,045,099 569,621 1,907 108 1,182 2,674,853
FLEET MANAGEMENT 2,163,101 - - - - - - - 2,163,101
INFORMATION SYSTEMS 1,109,353 - 480, 052 1,468,400 56,692 - - - 3,114,497
REGION OFFICE OPERATIONS 2,089,420 - 649,141 806,865 (1,792) - - 10 3,543,644
SPORTSMAN’S DATABASE, LICENSING, CONTROLLED HUNTS 1,409,655 - 413,499 526,271 - - - - 2,349,426
Total 8,980,061 3,835 2,405,436 4,391,123 624,522 1,907 108 1,128 16,408,119
IDAHO DEPARTMENT OF FISH AND GAMEFY 2017 Actual Expenditures Report (Includes Encumbrances)
Managing hunter and angler dollars is a responsibility that we take very seriously; and as such, we are continually looking for ways to become more efficient and effective.
“”
28 Director’s Report to the Commission 2017
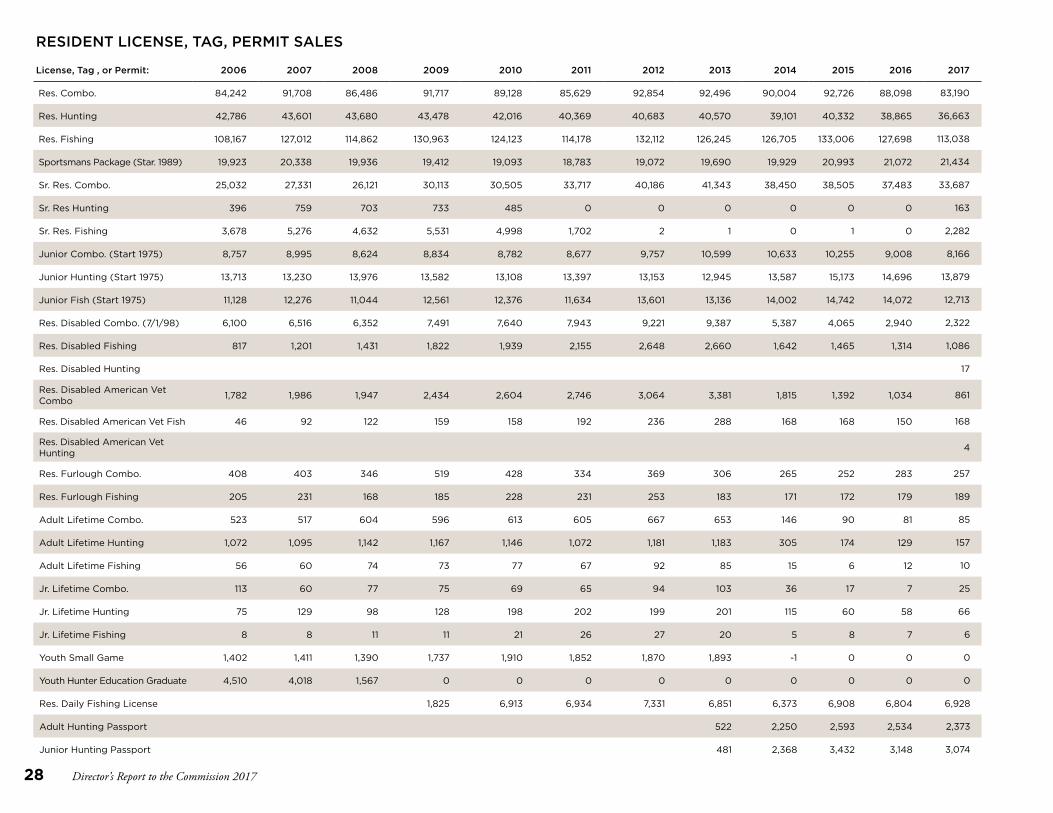
License, Tag , or Permit: 2006 2007 2008 2009 2010 2011 2012 2013 2014 2015 2016 2017
Res. Combo. 84,242 91,708 86,486 91,717 89,128 85,629 92,854 92,496 90,004 92,726 88,098 83,190
Res. Hunting 42,786 43,601 43,680 43,478 42,016 40,369 40,683 40,570 39,101 40,332 38,865 36,663
Res. Fishing 108,167 127,012 114,862 130,963 124,123 114,178 132,112 126,245 126,705 133,006 127,698 113,038
Sportsmans Package (Star. 1989) 19,923 20,338 19,936 19,412 19,093 18,783 19,072 19,690 19,929 20,993 21,072 21,434
Sr. Res. Combo. 25,032 27,331 26,121 30,113 30,505 33,717 40,186 41,343 38,450 38,505 37,483 33,687
Sr. Res Hunting 396 759 703 733 485 0 0 0 0 0 0 163
Sr. Res. Fishing 3,678 5,276 4,632 5,531 4,998 1,702 2 1 0 1 0 2,282
Junior Combo. (Start 1975) 8,757 8,995 8,624 8,834 8,782 8,677 9,757 10,599 10,633 10,255 9,008 8,166
Junior Hunting (Start 1975) 13,713 13,230 13,976 13,582 13,108 13,397 13,153 12,945 13,587 15,173 14,696 13,879
Junior Fish (Start 1975) 11,128 12,276 11,044 12,561 12,376 11,634 13,601 13,136 14,002 14,742 14,072 12,713
Res. Disabled Combo. (7/1/98) 6,100 6,516 6,352 7,491 7,640 7,943 9,221 9,387 5,387 4,065 2,940 2,322
Res. Disabled Fishing 817 1,201 1,431 1,822 1,939 2,155 2,648 2,660 1,642 1,465 1,314 1,086
Res. Disabled Hunting 17
Res. Disabled American Vet Combo 1,782 1,986 1,947 2,434 2,604 2,746 3,064 3,381 1,815 1,392 1,034 861
Res. Disabled American Vet Fish 46 92 122 159 158 192 236 288 168 168 150 168
Res. Disabled American Vet Hunting 4
Res. Furlough Combo. 408 403 346 519 428 334 369 306 265 252 283 257
Res. Furlough Fishing 205 231 168 185 228 231 253 183 171 172 179 189
Adult Lifetime Combo. 523 517 604 596 613 605 667 653 146 90 81 85
Adult Lifetime Hunting 1,072 1,095 1,142 1,167 1,146 1,072 1,181 1,183 305 174 129 157
Adult Lifetime Fishing 56 60 74 73 77 67 92 85 15 6 12 10
Jr. Lifetime Combo. 113 60 77 75 69 65 94 103 36 17 7 25
Jr. Lifetime Hunting 75 129 98 128 198 202 199 201 115 60 58 66
Jr. Lifetime Fishing 8 8 11 11 21 26 27 20 5 8 7 6
Youth Small Game 1,402 1,411 1,390 1,737 1,910 1,852 1,870 1,893 -1 0 0 0
Youth Hunter Education Graduate 4,510 4,018 1,567 0 0 0 0 0 0 0 0 0
Res. Daily Fishing License 1,825 6,913 6,934 7,331 6,851 6,373 6,908 6,804 6,928
Adult Hunting Passport 522 2,250 2,593 2,534 2,373
Junior Hunting Passport 481 2,368 3,432 3,148 3,074
RESIDENT LICENSE, TAG, PERMIT SALES

Director’s Report to the Commission 2017 29
RESIDENT LICENSE, TAG, PERMIT SALES
License, Tag , or Permit: 2006 2007 2008 2009 2010 2011 2012 2013 2014 2015 2016 2017
Combo.-3 Year 2,752 1,940 1,847 3,456
Hunting-3 Year 853 802 816 1,110
Fishing-3 Year 1,256 1,125 1,250 1,864
Senior Combo.-3 Year 3,897 3,065 3,598 6,406
Senior Hunting.-3 Year
Senior Fishing.-3 Year 195
Junior Combo.-3 Year 532 646 847 1,178
Junior Hunting-3 Year 911 1,229 1,355 1,685
Junior Fishing-3 Year 293 377 525 539
Disabled Combo. Class D-3 Year 3,309 2,351 1,687 2841
Disabled Fishing Class D-3 Year 697 660 511 570
Disabled Hunting-3 Year 16
Disabled Combo. Class V-3 Year 1,624 1,189 901 1,767
Disabled Fishing Class V-3 Year 140 73 99 125
Disabled Hunting Class V-3 Year 4
Adult Lifetime Combo.-3 Year 534 131 87 516
Adult Lifetime Hunting-3 Year 905 306 134 782
Adult Lifetime Fishing-3 Year 68 20 12 62
Junior Lifetime Combo.-3 Year 62 32 16 51
Junior Lifetime Hunting-3 Year 163 95 62 86
Junior Lifetime Fishing-3 Year 8 6 5 2
TOTAL RESIDENT LICENSES 334,939 368,253 345,393 375,146 368,558 352,510 388,672 385,222 391,475 400,582 383,424 366,098
Salmon Permit 5,150 4,442 8,041 9,635 14,627 8,998 13,382 6,745 12,492 16,236 10,693 5,909
Salmon Sportsman Package 19,923 20,338 19,936 19,412 19,093 18,783 19,072 19,690 19,929 20,993 21,072 21,434
Total Salmon Permits 25,073 24,780 27,977 29,047 33,720 27,781 32,454 26,435 32,421 37,229 31,765 27,343
Steelhead Permit 30,797 31,759 32,727 35,021 37,046 28,803 29,060 23,677 22,144 28,130 24,475 19,964
Second Steelhead Permit 333 155 67 85 0 0 0 0
Steelhead Sportsman Package 19,923 20,338 19,936 19,412 19,093 18,783 19,072 19,690 19,929 20,993 21,072 21,434
Total Steelhead Permits 50,720 52,097 52,663 54,433 56,472 47,741 48,199 43,452 42,073 49,123 45,547 41,398
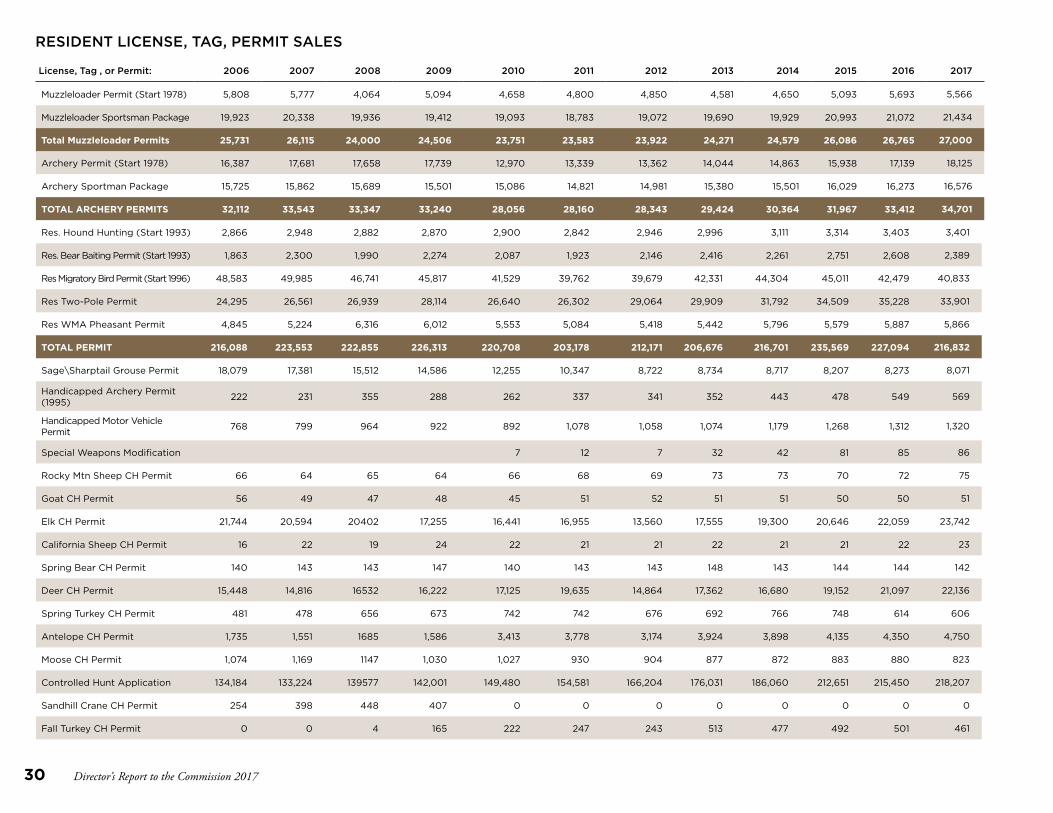
30 Director’s Report to the Commission 2017
Res. Hound Hunting (Start 1993) 2,866 2,948 2,882 2,870 2,900 2,842 2,946 2,996 3,111 3,314 3,403 3,401
Res. Bear Baiting Permit (Start 1993) 1,863 2,300 1,990 2,274 2,087 1,923 2,146 2,416 2,261 2,751 2,608 2,389
Res Migratory Bird Permit (Start 1996) 48,583 49,985 46,741 45,817 41,529 39,762 39,679 42,331 44,304 45,011 42,479 40,833
Res Two-Pole Permit 24,295 26,561 26,939 28,114 26,640 26,302 29,064 29,909 31,792 34,509 35,228 33,901
Res WMA Pheasant Permit 4,845 5,224 6,316 6,012 5,553 5,084 5,418 5,442 5,796 5,579 5,887 5,866
TOTAL PERMIT 216,088 223,553 222,855 226,313 220,708 203,178 212,171 206,676 216,701 235,569 227,094 216,832
Sage\Sharptail Grouse Permit 18,079 17,381 15,512 14,586 12,255 10,347 8,722 8,734 8,717 8,207 8,273 8,071
Handicapped Archery Permit (1995) 222 231 355 288 262 337 341 352 443 478 549 569
Handicapped Motor Vehicle Permit 768 799 964 922 892 1,078 1,058 1,074 1,179 1,268 1,312 1,320
Special Weapons Modification 7 12 7 32 42 81 85 86
Rocky Mtn Sheep CH Permit 66 64 65 64 66 68 69 73 73 70 72 75
Goat CH Permit 56 49 47 48 45 51 52 51 51 50 50 51
Elk CH Permit 21,744 20,594 20402 17,255 16,441 16,955 13,560 17,555 19,300 20,646 22,059 23,742
California Sheep CH Permit 16 22 19 24 22 21 21 22 21 21 22 23
Spring Bear CH Permit 140 143 143 147 140 143 143 148 143 144 144 142
Deer CH Permit 15,448 14,816 16532 16,222 17,125 19,635 14,864 17,362 16,680 19,152 21,097 22,136
Spring Turkey CH Permit 481 478 656 673 742 742 676 692 766 748 614 606
Antelope CH Permit 1,735 1,551 1685 1,586 3,413 3,778 3,174 3,924 3,898 4,135 4,350 4,750
Moose CH Permit 1,074 1,169 1147 1,030 1,027 930 904 877 872 883 880 823
Controlled Hunt Application 134,184 133,224 139577 142,001 149,480 154,581 166,204 176,031 186,060 212,651 215,450 218,207
Sandhill Crane CH Permit 254 398 448 407 0 0 0 0 0 0 0 0
Fall Turkey CH Permit 0 0 4 165 222 247 243 513 477 492 501 461
RESIDENT LICENSE, TAG, PERMIT SALES
License, Tag , or Permit: 2006 2007 2008 2009 2010 2011 2012 2013 2014 2015 2016 2017
Muzzleloader Permit (Start 1978) 5,808 5,777 4,064 5,094 4,658 4,800 4,850 4,581 4,650 5,093 5,693 5,566
Muzzleloader Sportsman Package 19,923 20,338 19,936 19,412 19,093 18,783 19,072 19,690 19,929 20,993 21,072 21,434
Total Muzzleloader Permits 25,731 26,115 24,000 24,506 23,751 23,583 23,922 24,271 24,579 26,086 26,765 27,000
Archery Permit (Start 1978) 16,387 17,681 17,658 17,739 12,970 13,339 13,362 14,044 14,863 15,938 17,139 18,125
Archery Sportman Package 15,725 15,862 15,689 15,501 15,086 14,821 14,981 15,380 15,501 16,029 16,273 16,576
TOTAL ARCHERY PERMITS 32,112 33,543 33,347 33,240 28,056 28,160 28,343 29,424 30,364 31,967 33,412 34,701

Director’s Report to the Commission 2017 31
Fall Bear CH Permit 179 147 176 155 174 199 175 246 210 255 257 244
Super Hunt Application 1 Chance 848 878 1359 10,569 0 0 0 0 0 0 0 639
Super Hunt Application 6 Chances 1,444 1,293 1732 7,901 0 0 0 0 0 0 0 0
Super Hunt Application 13 Chances 930 1,426 2009 2,616 0 0 0 0 0 0 0 0
Super Hunt Combo App 1 Chance 715 685 842 4,731 0 0 0 0 0 0 0 0
Super Hunt Combo App 6 Chances 132 121 181 1,648 0 0 0 0 0 0 0 0
Super Hunt Combo App 13 Chances 98 83 107 31 0 0 0 0 0 0 0 0
Super Hunt Deer Applications 16,043 19,567 18,092 21,046 14,468 20,687 21,235 25,891
Super Hunt Elk Applications 12,342 14,676 14,738 16,440 16,471 17,252 20,037 27,778
Super Hunt Pronghorn Applications 2,813 4,037 3,048 4,233 3,034 4,269 4,757 5,944
Super Hunt Moose Applications 6,734 6,574 6,277 8,179 8,405 8,863 10,246 12,999
Super Hunt Combo. Applications 2,483 3,310 2,667 3,195 3,145 3,513 6,594 6,942
TOTAL MISC. PERMIT AND APPS 198,613 195,552 203,962 223,069 242,728 257,288 255,035 280,779 284,455 323,865 338,584 361,499
Deer (Regular) 65,834 67,885 70,218 70,091 66,433 63,725 62,552 63,551 67,753 70,156 72,910 71,634
Clearwater Deer (Start 1998) 0 0 0 0 0 0 0 0 0 0 0 0
White-tailed Deer (start 2005) 18044 17,992 18,804 18,940 18,992 18,334 18,607 19,913 20,290 20,930 20,130 19,811
Jr.\Sr.\DAV Regular Deer 18,289 18,210 18,261 18,033 18,037 17,987 18,402 19,308 21,059 25,900 26,843 27,167
Jr.\Sr.\DAV Clearwater Deer (1998) 0 0 0 0 0 0 0 0 0 0 0 0
Jr.\Sr.\DAV White-tailed Deer (2005) 4438 4,539 4,706 4,718 4,813 4,833 5,030 5,465 5,936 6,906 6,785 7,052
Jr.\Sr.\DAV Controlled Hunt Deer 2983 2,766 3,184 3,280 3,360 3,799 2,955 3,716 3,842 4,684 5,229 5,344
Depredation Deer 92 83 151 100 87 59 32 52 84 99 269 394
Jr.\Sr.\DAV Depredation Deer 15 22 45 22 18 13 12 25 23 40 90 146
Controlled Hunt Deer 11,198 10,650 11,880 11,512 12,224 14,228 10,541 12,101 11,333 12,763 13,637 14,178
Super Deer 8 2 12 6 12 7 8 5 10 3 9 4
TOTAL DEER 122,907 122,149 127,261 126,702 123,976 122,985 118,139 124,136 130,330 141,481 145,902 145,730
Resident Turkey 25,540 26,031 25,219 24,517 24,069 23,433 23,537 24,366 24,679 25,943 26,410 26,669
Jr.\Sr.\DAV Turkey 3,832 3,854 3,726 3,566 3,831 3,743 3,757 3,933 3,999 4,096 4,375 4,379
Resident Controlled Hunt Turkey 0 0 0 0 0 0 0 0 0 0 0 0
RESIDENT LICENSE, TAG, PERMIT SALES
License, Tag , or Permit: 2006 2007 2008 2009 2010 2011 2012 2013 2014 2015 2016 2017
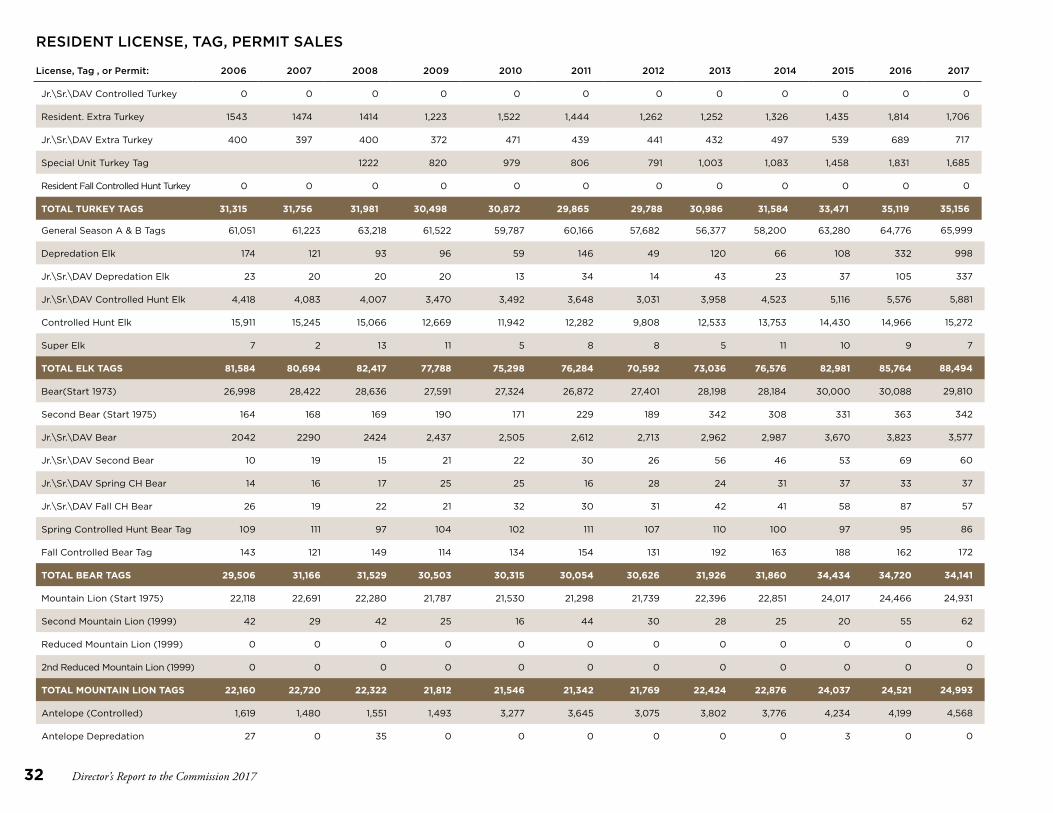
32 Director’s Report to the Commission 2017
General Season A & B Tags 61,051 61,223 63,218 61,522 59,787 60,166 57,682 56,377 58,200 63,280 64,776 65,999
Depredation Elk 174 121 93 96 59 146 49 120 66 108 332 998
Jr.\Sr.\DAV Depredation Elk 23 20 20 20 13 34 14 43 23 37 105 337
Jr.\Sr.\DAV Controlled Hunt Elk 4,418 4,083 4,007 3,470 3,492 3,648 3,031 3,958 4,523 5,116 5,576 5,881
Controlled Hunt Elk 15,911 15,245 15,066 12,669 11,942 12,282 9,808 12,533 13,753 14,430 14,966 15,272
Super Elk 7 2 13 11 5 8 8 5 11 10 9 7
TOTAL ELK TAGS 81,584 80,694 82,417 77,788 75,298 76,284 70,592 73,036 76,576 82,981 85,764 88,494
Bear(Start 1973) 26,998 28,422 28,636 27,591 27,324 26,872 27,401 28,198 28,184 30,000 30,088 29,810
Second Bear (Start 1975) 164 168 169 190 171 229 189 342 308 331 363 342
Jr.\Sr.\DAV Bear 2042 2290 2424 2,437 2,505 2,612 2,713 2,962 2,987 3,670 3,823 3,577
Jr.\Sr.\DAV Second Bear 10 19 15 21 22 30 26 56 46 53 69 60
Jr.\Sr.\DAV Spring CH Bear 14 16 17 25 25 16 28 24 31 37 33 37
Jr.\Sr.\DAV Fall CH Bear 26 19 22 21 32 30 31 42 41 58 87 57
Spring Controlled Hunt Bear Tag 109 111 97 104 102 111 107 110 100 97 95 86
Fall Controlled Bear Tag 143 121 149 114 134 154 131 192 163 188 162 172
TOTAL BEAR TAGS 29,506 31,166 31,529 30,503 30,315 30,054 30,626 31,926 31,860 34,434 34,720 34,141
Mountain Lion (Start 1975) 22,118 22,691 22,280 21,787 21,530 21,298 21,739 22,396 22,851 24,017 24,466 24,931
Second Mountain Lion (1999) 42 29 42 25 16 44 30 28 25 20 55 62
Reduced Mountain Lion (1999) 0 0 0 0 0 0 0 0 0 0 0 0
2nd Reduced Mountain Lion (1999) 0 0 0 0 0 0 0 0 0 0 0 0
TOTAL MOUNTAIN LION TAGS 22,160 22,720 22,322 21,812 21,546 21,342 21,769 22,424 22,876 24,037 24,521 24,993
Antelope (Controlled) 1,619 1,480 1,551 1,493 3,277 3,645 3,075 3,802 3,776 4,234 4,199 4,568
Antelope Depredation 27 0 35 0 0 0 0 0 0 3 0 0
RESIDENT LICENSE, TAG, PERMIT SALES
Jr.\Sr.\DAV Controlled Turkey 0 0 0 0 0 0 0 0 0 0 0 0
Resident. Extra Turkey 1543 1474 1414 1,223 1,522 1,444 1,262 1,252 1,326 1,435 1,814 1,706
Jr.\Sr.\DAV Extra Turkey 400 397 400 372 471 439 441 432 497 539 689 717
Special Unit Turkey Tag 1222 820 979 806 791 1,003 1,083 1,458 1,831 1,685
Resident Fall Controlled Hunt Turkey 0 0 0 0 0 0 0 0 0 0 0 0
TOTAL TURKEY TAGS 31,315 31,756 31,981 30,498 30,872 29,865 29,788 30,986 31,584 33,471 35,119 35,156
License, Tag , or Permit: 2006 2007 2008 2009 2010 2011 2012 2013 2014 2015 2016 2017
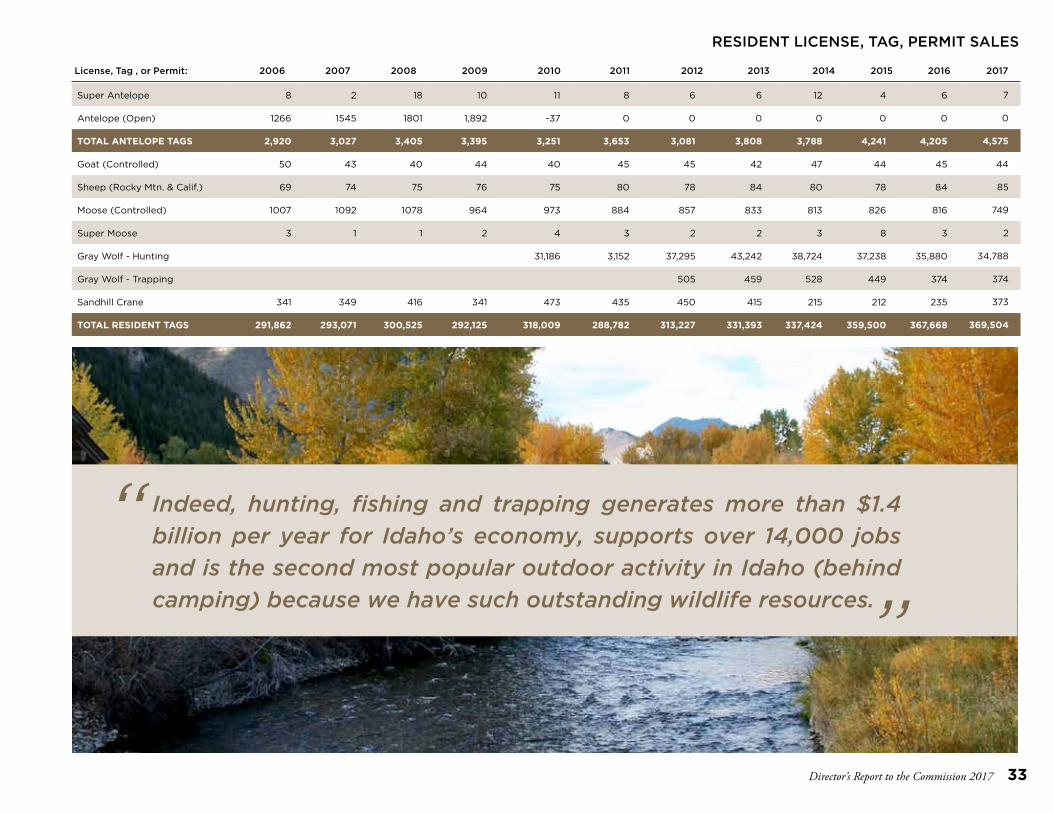
Director’s Report to the Commission 2017 33
RESIDENT LICENSE, TAG, PERMIT SALES
“”
Indeed, hunting, fishing and trapping generates more than $1.4 billion per year for Idaho’s economy, supports over 14,000 jobs and is the second most popular outdoor activity in Idaho (behind camping) because we have such outstanding wildlife resources.
Super Antelope 8 2 18 10 11 8 6 6 12 4 6 7
Antelope (Open) 1266 1545 1801 1,892 -37 0 0 0 0 0 0 0
TOTAL ANTELOPE TAGS 2,920 3,027 3,405 3,395 3,251 3,653 3,081 3,808 3,788 4,241 4,205 4,575
Goat (Controlled) 50 43 40 44 40 45 45 42 47 44 45 44
Sheep (Rocky Mtn. & Calif.) 69 74 75 76 75 80 78 84 80 78 84 85
Moose (Controlled) 1007 1092 1078 964 973 884 857 833 813 826 816 749
Super Moose 3 1 1 2 4 3 2 2 3 8 3 2
Gray Wolf - Hunting 31,186 3,152 37,295 43,242 38,724 37,238 35,880 34,788
Gray Wolf - Trapping 505 459 528 449 374 374
Sandhill Crane 341 349 416 341 473 435 450 415 215 212 235 373
TOTAL RESIDENT TAGS 291,862 293,071 300,525 292,125 318,009 288,782 313,227 331,393 337,424 359,500 367,668 369,504
License, Tag , or Permit: 2006 2007 2008 2009 2010 2011 2012 2013 2014 2015 2016 2017

34 Director’s Report to the Commission 2017
License, Tag , or Permit: 2006 2007 2008 2009 2010 2011 2012 2013 2014 2015 2016 2017
NR Combo. (2000) 2124 2434 2,440 2,203 1,456 1,308 1,345 1,577 1,680 1,787 1,734 1,748
NR Hunting (Start 1975) 27,236 27,243 27,005 24,048 20,429 19,145 20,046 19,929 21,465 24,808 27,176 29,693
NR Season Fishing 17,081 18,778 17,537 18,734 17,052 15,566 18,374 18,491 18,552 20,699 20,310 19,375
NR Jr.. Season Fishing 4,595 5,160 4,708 4,484 3,601 3,575 3,683 3,744 3,957 4,223 4,386 4,225
One Day/Daily Fishing (Revised 1996) 117,457 131,391 118,696 126,133 115,567 110,777 119,094 117,677 117,258 124,632 124,694 124,745
3-Day Salmon/Steelhead (1988) 8,204 8,682 9,382 10,017 12,244 10,441 11,070 8,278 8,650 11,020 9,853 8,171
NR Nongame 676 798 725 748 685 586 561 586 636 750 862 770
NR Small Game Hunting (Start 1986) 4767 5,180 4,812 4,082 4,091 2,402 2,135 2,161 2,217 2,033 1,951 1,797
NR 3-Day Small Game Hunting 2,611 3,598 3,760 4,056 4,171 4,247 4,508
NR Lifetime Adult Combo. 345 374 428 422 465 454 527 537 98 60 43 49
NR Lifetime Adult Hunting 1311 1,365 1,521 1,566 1,649 1,418 1,789 1,683 312 154 107 158
NR Lifetime Adult Fishing 37 38 57 60 67 68 67 74 9 12 6 10
NR Lifetime Jr.. Combo. 4 5 5 6 3 2 3 5 0 0 2 0
NR Lifetime Jr.. Hunting 19 23 14 7 21 24 34 16 7 0 2 3
NR Lifetime Jr.. Fishing 2 1 1 0 2 6 2 5 1 3 0 1
NR Jr. Mentored Hunting 2528 2,730 2,649 2,561 2,108 1,838 1,990 2,012 2,212 2,559 2,751 2,904
NR Youth Small Game 105 111 119 107 91 93 89 106 14 0 0 0
NR Youth Hunter Ed. Grad 59 51 18 0 0 0 0 0 0 0 0
NR Disabled Hunting Class DAV 45 49 102 834 1,349 1,630
Adult Hunting Passport 56 291 362 416 437
Junior Hunting Passport 39 295 479 516 552
Shooting Preserve License (1978) 1254 1384 1171 855 860 874 590 453 586 395 433 488
NR Combo.-3 YEAR 24 34 26 38
NR Hunting/3 Day Fishing-3 Year 23 29 31 49
NR Fishing-3 Year 49 78 75 112
NR Junior Fishing-3 Year 42 72 101 131
NR Adult Lifetime Combo.-3 Year 457 91 50 420
NR Adult Lifetime Hunting-3 Year 1,463 357 188 1,213
NR Adult Lifetime Fishing-3 Year 73 11 6 68
NR Junior Lifetime Combo.-3 Year 2 1 2 3
NON-RESIDENT (NR) LICENSE, TAG, PERMIT SALES

Director’s Report to the Commission 2017 35
License, Tag , or Permit: 2006 2007 2008 2009 2010 2011 2012 2013 2014 2015 2016 2017
NR Junior Lifetime Hunting-3 Year 24 6 0 10
NR Junior Lifetime Fishing-3 Year 1 2 1
NR Junior Mentored Hunting-3 Year 33 85 128 156
TOTAL NR LICENSES 186,550 204,364 190,117 195,178 180,391 171,188 185,042 181,238 184,588 199,746 201,447 203,465
NR Hound Hunter (Start 1993) 136 119 121 113 97 96 100 103 96 98 113 112
NR Bear Baiting Permit 142 342 280 321 355 337 367 403 432
NR Migratory Bird Permit 84 3,344 3,250 3,465 3,507 4,161 4,305 4,262 4,328
NR Two-Pole Permit 836 2,734 2,428 2,760 2,634 2,766 3,136 3,150 2,858
NR WMA pheasant permit 7 298 269 282 253 341 360 374 450
NR Archery Permit 741 3,845 3,460 3,531 3,454 3,807 4,773 5,316 5,936
NR Muzzleloader Permit 36 351 357 367 328 351 418 507 539
NR Salmon Permit 734 1,970 1,470 2,095 1,021 1,939 2,374 1,855 1,043
NR Steelhead Permit 242 5,335 4,696 4,637 3,745 3,529 4,627 4,285 3,442
NR Second Steelhead Permit 12 7 6 7 0 0 0 0
TOTAL PERMITS 2,935 18,328 16,313 17,564 15,407 17,327 20,458 20,265 19,140
Deer (Regular) (Start 1975) 7,366 8,132 9,290 7,898 5,968 5,397 5,171 5,101 5,444 7,269 8,565 9,719
Clearwater Deer (Start 1998) -28 0 0 0 0 0 0 0 0 0 0 0
White-tailed Deer (2005) 2,152 2,437 2,837 3,312 2,036 1,958 1,986 2,077 2,302 2,757 3,233 3,282
SE Idaho Deer 1,077 994 417 0 0 0 0 0 0 0 0 0
Regular Outfitted Deer 695 828 725 522 316 211 214 133 214 218 186 355
Clearwater Outfitted Deer (1998) 0 0 0 0 0 0 0 0 0 0 0 0
White-tailed Outfitted deer (2005) 16 13 12 33 7 5 7 1 1 4 7 3
SE Outfitted Idaho Deer 51 21 0 0 0 0 0 0 0 0 0 0
Controlled Hunt Deer 1,056 1,186 1,111 1,123 1,264 1,357 1,153 1,311 1,221 1,534 1,606 1,783
Res-NR Regular Deer 1,865 1,977 988 1,039 1,015 937 816 883 1,208 1,998 2,302 1,813
Res-NR Clearwater Deer 0 0 0 0 0 0 0 0 0 0 0 0
Res-NR White-tailed deer 888 599 653 1,333 776 631 647 803 806 1,388 1,450 1,072
Res-NR SE Deer 0 16 24 0 0 0 0 0 0 0 0 0
NR Jr. Mentored Reg. Deer 978 1,072 1,167 1,099 800 646 708 701 799 1,535 2,063 2,414
NON-RESIDENT (NR) LICENSE, TAG, PERMIT SALES

36 Director’s Report to the Commission 2017
License, Tag , or Permit: 2006 2007 2008 2009 2010 2011 2012 2013 2014 2015 2016 2017
NR Jr. Mentored Clearwater -5 0 0 0 0 0 0 0 0 0 0 0
NR Jr. Mentored White-tailed 359 388 413 503 393 339 346 372 426 667 864 893
NR Jr. Mentored SE 138 155 77 0 0 0 0 0 0 0 0 0
NR Jr. Mentored OF Reg 11 18 17 6 6 6 4 4 2 0 4 5
NR Jr. Mentored OF Clearwater 0 0 0 0 0 0 0 0 0 0 0 0
NR Jr. Mentored OF White-tailed 0 0 0 2 0 0 0 0 0 0 0 2
NR Jr. Mentored OF SE 0 1 0 0 0 0 0 0 0 0 0 0
Super Deer 4 1 9 6 1 5 4 6 3 9 4 8
NR Jr. Controlled Hunt 71 74 96 110 139 140 141 130 144 210 238 260
TOTAL N. DEER TAGS 16,694 17,912 17,836 16,986 12,721 11,632 11,197 11,522 12,570 17,589 20,522 21,609
Turkey (Start 1975) 982 1,007 934 741 572 482 469 555 540 640 682 740
Extra Turkey 95 121 94 88 86 69 77 78 74 110 130 142
Fall Turkey 0 0 0 0 0 0 0 0 0 0 0 0
Spring Controlled Hunt Turkey 0 0 0 0 0 0 0 0 0 0 0 0
Fall Controlled Turkey 0 0 0 0 0 0 0 0 0 0 0 0
NR Jr. Mentored Turkey 200 205 240 197 118 130 109 101 149 190 217 266
NR Jr. Mentored Extra Turkey 40 36 39 33 27 23 17 20 24 28 52 50
NR Special Unit Turkey 36 42 39 83 115 197
Noners Jr. Mentored Spring CH 0 0 0 0 0 0 0 0 0 0 0 0
TOTAL N. TURKEY TAGS 1,317 1,369 1,307 1,059 803 704 708 796 826 1,051 1,196 1,395
General Season A & B Elk Tags 13,393 14,011 13,603 12,008 9,467 8,326 7,982 8,053 8,517 11,102 11,982 14,202
Controlled Hunt Elk 1,087 1,024 1,066 894 857 772 592 821 816 995 930 1,067
Super Elk 6 1 7 4 7 3 4 5 4 2 3 5
NR Jr. Mentored CH 95 85 113 74 54 57 45 63 94 92 125 164
TOTAL N. ELK TAGS 14,581 15,121 14,789 12,980 10,385 9,158 8,623 8,942 9,431 12,191 13,040 15,438
Bear (Start 1975) 1,177 1,315 1,395 1,238 1,043 975 1,116 1,220 1,179 1,257 1,344 1,408
Reduced Price Bear (Start 1999) 1,950 2,091 1,901 1,586 1,225 1,195 1,212 1,142 1,199 1,658 1,874 1,967
Spring Controlled Hunt Bear 13 13 18 14 12 13 6 10 12 9 12 16
Fall Controlled Hunt Bear 4 3 2 10 5 13 10 8 6 7 6 12
Second Reduced Bear (Start 1999) 528 416 441 364 369 386 453 464 453 102 0 0
NON-RESIDENT (NR) LICENSE, TAG, PERMIT SALES
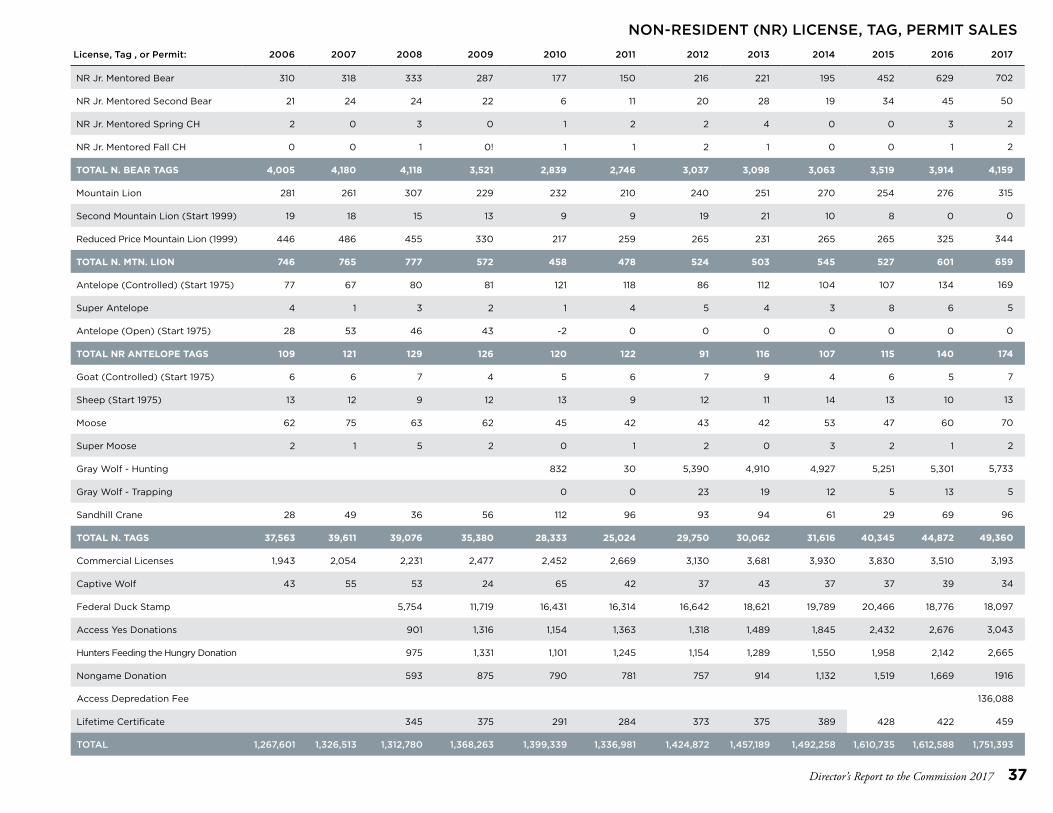
Director’s Report to the Commission 2017 37
License, Tag , or Permit: 2006 2007 2008 2009 2010 2011 2012 2013 2014 2015 2016 2017
NR Jr. Mentored Bear 310 318 333 287 177 150 216 221 195 452 629 702
NR Jr. Mentored Second Bear 21 24 24 22 6 11 20 28 19 34 45 50
NR Jr. Mentored Spring CH 2 0 3 0 1 2 2 4 0 0 3 2
NR Jr. Mentored Fall CH 0 0 1 0! 1 1 2 1 0 0 1 2
TOTAL N. BEAR TAGS 4,005 4,180 4,118 3,521 2,839 2,746 3,037 3,098 3,063 3,519 3,914 4,159
Mountain Lion 281 261 307 229 232 210 240 251 270 254 276 315
Second Mountain Lion (Start 1999) 19 18 15 13 9 9 19 21 10 8 0 0
Reduced Price Mountain Lion (1999) 446 486 455 330 217 259 265 231 265 265 325 344
TOTAL N. MTN. LION 746 765 777 572 458 478 524 503 545 527 601 659
Antelope (Controlled) (Start 1975) 77 67 80 81 121 118 86 112 104 107 134 169
Super Antelope 4 1 3 2 1 4 5 4 3 8 6 5
Antelope (Open) (Start 1975) 28 53 46 43 -2 0 0 0 0 0 0 0
TOTAL NR ANTELOPE TAGS 109 121 129 126 120 122 91 116 107 115 140 174
Goat (Controlled) (Start 1975) 6 6 7 4 5 6 7 9 4 6 5 7
Sheep (Start 1975) 13 12 9 12 13 9 12 11 14 13 10 13
Moose 62 75 63 62 45 42 43 42 53 47 60 70
Super Moose 2 1 5 2 0 1 2 0 3 2 1 2
Gray Wolf - Hunting 832 30 5,390 4,910 4,927 5,251 5,301 5,733
Gray Wolf - Trapping 0 0 23 19 12 5 13 5
Sandhill Crane 28 49 36 56 112 96 93 94 61 29 69 96
TOTAL N. TAGS 37,563 39,611 39,076 35,380 28,333 25,024 29,750 30,062 31,616 40,345 44,872 49,360
Commercial Licenses 1,943 2,054 2,231 2,477 2,452 2,669 3,130 3,681 3,930 3,830 3,510 3,193
Captive Wolf 43 55 53 24 65 42 37 43 37 37 39 34
Federal Duck Stamp 5,754 11,719 16,431 16,314 16,642 18,621 19,789 20,466 18,776 18,097
Access Yes Donations 901 1,316 1,154 1,363 1,318 1,489 1,845 2,432 2,676 3,043
Hunters Feeding the Hungry Donation 975 1,331 1,101 1,245 1,154 1,289 1,550 1,958 2,142 2,665
Nongame Donation 593 875 790 781 757 914 1,132 1,519 1,669 1916
Access Depredation Fee 136,088
Lifetime Certificate 345 375 291 284 373 375 389 428 422 459
TOTAL 1,267,601 1,326,513 1,312,780 1,368,263 1,399,339 1,336,981 1,424,872 1,457,189 1,492,258 1,610,735 1,612,588 1,751,393
NON-RESIDENT (NR) LICENSE, TAG, PERMIT SALES

38 Director’s Report to the Commission 2017
IDAHO FISH AND GAME LICENSE AND TAG SALES NUMBER SOLDDescription FY 2012 FY 2013 FY2014 FY2015 FY 2016 FY 2017 Change
16 to 17PercentChange
Resident Combination 156,212 158,268 159,446 156,656 147,917 144,808 (3,109) -2.1%
Resident Sportsman Package 19,072 19,690 19,929 20,993 21,072 21,434 362 1.7%
Resident Season Fishing 148971 142,618 145,170 151,829 145,834 132,849 (12,985) -8.9%
Resident Short Term Fishing 7,331 6,851 6,373 6,908 6,804 6,928 124 -1.8%
Resident Hunting 57,086 57,795 60,557 64,196 61,797 60,079 (1,718) -2.8%
Total Resident Licenses 388,672 385,222 391,475 400,582 383,424 366,098 (17,326) -4.5%
Non-resident Combination 1,875 2,119 2,261 1,973 1,857 2,258 401 -21.6%
Non-resident Season Fishing 22,126 22,314 22,683 25,099 24,886 23,923 (963) -3.9%
Non-resident Short Term Fishing 130,164 125,955 125,908 135,652 134,547 132,916 (1,631) -1.2%
Non-resident Hunting * 30,877 30,850 33,736 37,022 40,157 44,368 4,211 10.5%
Total Nonresident Licenses 185,042 181,238 184,588 199,746 201,447 203,465 2,018 1.0%
Resident Tags 223,412 218,043 222,637 239,086 246,042 247,675 1,633 0.7%
Resident Tags in Sportman Pack** 90,142 113,350 114,787 120,414 121,626 121,829 203 0.2%
Non-Resident Tags 29,750 30,062 31,616 40,345 44,872 49,360 4,488 10.0%
Miscellaneous Permits 179,507 176,020 178,748 199,894 207,847 214,482 6,635 3.2%
Misc. Permits in Sportsman Pack** 72,125 74,368 75,288 79,013 79,399 80,754 1,355 1.7%
Miscellaneous Permit issued at $0 74,165 84,234 87,270 92,194 93,698 113,435 19,737 21.1%
Access Depredation Fee *Eff 5/1/17 136,088
Controlled Hunt Applications 166,204 176,031 186,060 212,651 215,450 218,207 2,757 1.3%
Total Tags, Permits, and Misc. 835,305 872,108 896,406 983,597 1,008,934 1,181,830 172,896 17.1%
Total Licenses, Tags, & Permits 1,409,019 1,438,568 1,472,469 1,583,925 1,593,805 1,751,393 157,588 9.9%
* Includes all hunting licenses (Big Game, Small Game, Nongame, and Shooting Preserve)
** Fees were collected in the sale of the sportsman package license sale.
FISH AND GAME RECEIPTS ($ IN MILLIONS)Description
FY 2015Actual
FY 2016Actual
FY 2017Actual
Change16 to 17
PercentChange
Fish and Game Fund
Licenses & Permits $36.132 $38.730 $41.090 $2.598 6.1%
Federal Reimburs. 43.857 44.029 44.868 $.171 1.9%
Priv. & Loc. Reimburs. 6.292 8.162 7.745 $1.870 (5.1%)
Priv. & Loc. Trusts 1.443 .781 2.185 ($.662) 179.9%
Big Game Depred. .057 .056 .074 ($.001) 33.8%
Miscellaneous Income 1.580 1.288 1.406 ($.292) 9.2%
Total Fish & Game: $89.361 $93.045 $97.368 $3.685 4.6%
Description
FY 2015Actual
FY 2016Actual
FY 2017Actual
Change16 to 17
PercentChange
Set-Aside Funds:
Habitat Acq. and Devel. .498 .460 (.005) ($.038) (1.0%)
Salmon & Steelhead Tag .342 .298 (.049) ($.044) (16.4%)
Winter Feed/Hab. Impr. .369 .391 .045 $.022 11.5%
Non-game Programs .022 .022 (.005) ($.000) (20.9)%
Meat Proc. Charges .014 .015 .006 $.001 42.6%
License Endorsement Fee .393 $.001 0.0%
Adjustments (.010) .009 (.000) $.019 (103.3%)
Total Set-Aside: $1.235 $1.196 $.376 ($.039) -31.4%
Grand Total $90.596 $94.241 $4,699 $3.645 5.0%

Director’s Report to the Commission 2017 39Source. Idaho Department of Fish and Game Survey
2017 RESIDENT COST TO HUNT(Includes licenses, tags and vendor fees)
Rank Deer Elk Sheep Pronghorn
1 $34.00 MT $38.00 MT $134.50 WY $37.00 MT
2 $37.50 ID $48.50 ID $153.00 MT $41.00 CO
3 $41.00 CO $50.40 WA $166.00 NV $50.50 WY
4 $44.90 WA $56.00 CO $172.50 OR $55.25 ID
5 $45.50 ID $57.50 ID $179.00 NM $63.50 ID
6 $55.50 WY $69.50 WY $190.75 ID $79.00 NM
7 $58.50 OR $78.00 OR $235.50 ID $88.00 OR
8 $60.00 NM $84.00 UT $264.00 CO $99.00 UT
9 $74.00 UT $109.00 NM $332.00 WA $106.00 NV
10 $76.00 NV $171.00 NV $350.00 AZ $140.00 AZ
11 $78.07 CA $185.00 AZ $463.64 CA $205.00 CA
12 $95.00 AZ $501.54 CA $557.00 UT NA WA
Average $58.33 $120.70 $266.49 $87.66
Highlighted costs are “Price Locked”; unhighlighted Idaho costs are 2018 prices
2017 NON-RESIDENT COST TO HUNT(Includes licenses, tags and vendor fees)
Rank Deer Elk Sheep Pronghorn
1 $333.00 UT $458.00 UT $1,325.00 MT $235.00 MT
2 $338.50 WY $497.00 WA $1,355.00 NV $298.50 WY
3 $352.00 NM $581.50 ID $1,581.50 OR $352.00 NM
4 $386.00 CO $603.50 WY $1,593.00 UT $368.00 UT
5 $395.00 NV $617.00 NM $1,652.00 WA $386.00 CO
6 $434.30 WA $651.00 CO $1,684.04 CA $455.00 NV
7 $441.01 CA $709.50 OR $1,975.00 AZ $491.25 ID
8 $466.50 ID $825.00 AZ $2,094.00 CO $537.50 OR
9 $475.00 AZ $867.00 MT $2,278.50 WY $630.28 CA
10 $574.50 OR $1,360.00 NV $2,281.25 ID $725.00 AZ
11 $607.00 MT $1,537.19 CA $3,242.00 NM N/A WA
Average $437.53 $791.52 $1,920.57 $448.53
2017 RESIDENT COST TO FISHRank State License 1 Day 2 Day 3 Day
1 Montana $29.00 $13.00
2 New Mexico $29.00 $16.00
3 Washington $29.50 $11.35 $15.75 $19.05
4 Idaho $30.75 $11.50 $16.50 $21.50
5 Utah $34.00 $16.00
6 Idaho $35.50 $13.50 $19.50 $25.50
7 Colorado $36.00 $9.00 $14.00 $19.00
8 Wyoming $36.50 $6.00 $12.00 $18.00
9 Arizona $37.00 $15.00 $30.00
10 Oregon $38.00 $19.00 $34.50 $50.50
11 Nevada $39.00 $9.00 $12.00 $15.00
12 California $47.01 $15.12 $23.50
Average $35.11 $12.55 $19.08 $23.07
Highlighted costs are “Price Locked”; unhighlighted Idaho costs are 2018 prices
2017 NON-RESIDENT COST TO FISHRank State License 1 Day 2 Day 3 Day
1 Arizona $55.00 $20.00 $40.00
2 New Mexico $60.00 $16.00
3 Colorado $66.00 $9.00 $14.00 $19.00
4 Utah $75.00 $24.00
5 Nevada $79.00 $18.00 $25.00 $32.00
6 Washington $84.50 $20.15 $28.95 $35.55
7 Montana $96.00 $35.00
8 Oregon $97.50 $19.00 $34.50 $50.50
9 Wyoming $104.50 $14.00 $28.00 $42.00
10 Idaho $108.25 $12.75 $18.75 $24.75
11 California $126.62 $15.12 $23.50
Average $86.08 $16.00 $27.52 $32.54
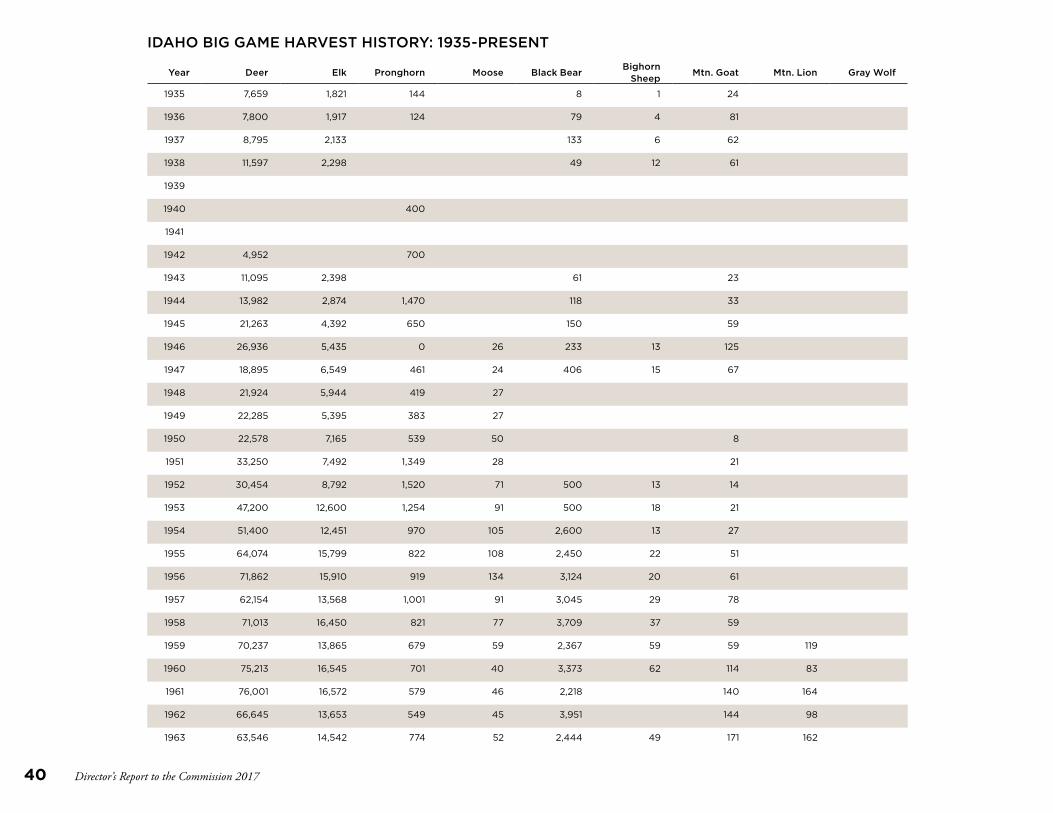
40 Director’s Report to the Commission 2017
IDAHO BIG GAME HARVEST HISTORY: 1935-PRESENT
Year Deer Elk Pronghorn Moose Black BearBighorn
SheepMtn. Goat Mtn. Lion Gray Wolf
1935 7,659 1,821 144 8 1 24
1936 7,800 1,917 124 79 4 81
1937 8,795 2,133 133 6 62
1938 11,597 2,298 49 12 61
1939
1940 400
1941
1942 4,952 700
1943 11,095 2,398 61 23
1944 13,982 2,874 1,470 118 33
1945 21,263 4,392 650 150 59
1946 26,936 5,435 0 26 233 13 125
1947 18,895 6,549 461 24 406 15 67
1948 21,924 5,944 419 27
1949 22,285 5,395 383 27
1950 22,578 7,165 539 50 8
1951 33,250 7,492 1,349 28 21
1952 30,454 8,792 1,520 71 500 13 14
1953 47,200 12,600 1,254 91 500 18 21
1954 51,400 12,451 970 105 2,600 13 27
1955 64,074 15,799 822 108 2,450 22 51
1956 71,862 15,910 919 134 3,124 20 61
1957 62,154 13,568 1,001 91 3,045 29 78
1958 71,013 16,450 821 77 3,709 37 59
1959 70,237 13,865 679 59 2,367 59 59 119
1960 75,213 16,545 701 40 3,373 62 114 83
1961 76,001 16,572 579 46 2,218 140 164
1962 66,645 13,653 549 45 3,951 144 98
1963 63,546 14,542 774 52 2,444 49 171 162

Director’s Report to the Commission 2017 41
IDAHO BIG GAME HARVEST HISTORY: 1935-PRESENT
Year Deer Elk Pronghorn Moose Black BearBighorn
SheepMtn. Goat Mtn. Lion Gray Wolf
1964 67,379 13,835 839 59 3,419 35 161 127
1965 56,438 14,064 977 51 2,861 53 214 108
1966 64,629 14,631 1,219 55 3,386 14 161 156
1967 66,350 13,397 1,286 50 2,700 32 127 109
1968 78,441 17,064 1,294 53 2,597 47 161 164
1969 67,176 12,415 1,472 74 3,085 46 168 143
1970 77,087 14,146 1,551 81 3,404 64 151 114
1971 54,927 11,009 1,465 86 3,786 13 137 303
1972 47,599 9,324 1,486 88 3,783 21 152 70
1973 54,014 12,374 1,237 96 1,430 15 128 87
1974 42,026 8,712 1,301 112 1,747 16 121 112
1975 40,102 8,981 1,314 93 2,285 32 102 142
1976 25,427 4,135 1,380 94 2,516 38 103 123
1977 39,834 6,353 1,250 95 2,173 27 117 160
1978 39,879 7,662 1,345 99 2,300 38 106 167
1979 42,549 6,344 1,430 104 1,718 42 79 31
1980 45,988 8,303 1,498 118 1,619 32 47 97
1981 50,580 9,903 1,837 114 1,918 46 65 198
1982 48,670 12,485 2,112 147 1,584 64 32 189
1983 50,600 12,700 2,400 229 2,100 60 41 167
1984 42,600 15,600 2,070 268 2,100 70 52 400
1985 48,950 15,550 2,190 297 1,700 79 38 170
1986 59,800 15,500 2,540 355 2,150 79 56 250
1987 66,400 16,100 2,600 363 1,950 77 70 300
1988 82,200 20,400 2,800 399 1,900 76 62 550
1989 95,200 22,600 3,500 400 2,100 98 79 340
1990 72,100 21,500 3,180 422 2,300 92 76 350
1991 69,100 24,100 2,950 428 2,100 97 85 171
1992 61,200 26,600 3,150 420 2,800 106 67 330
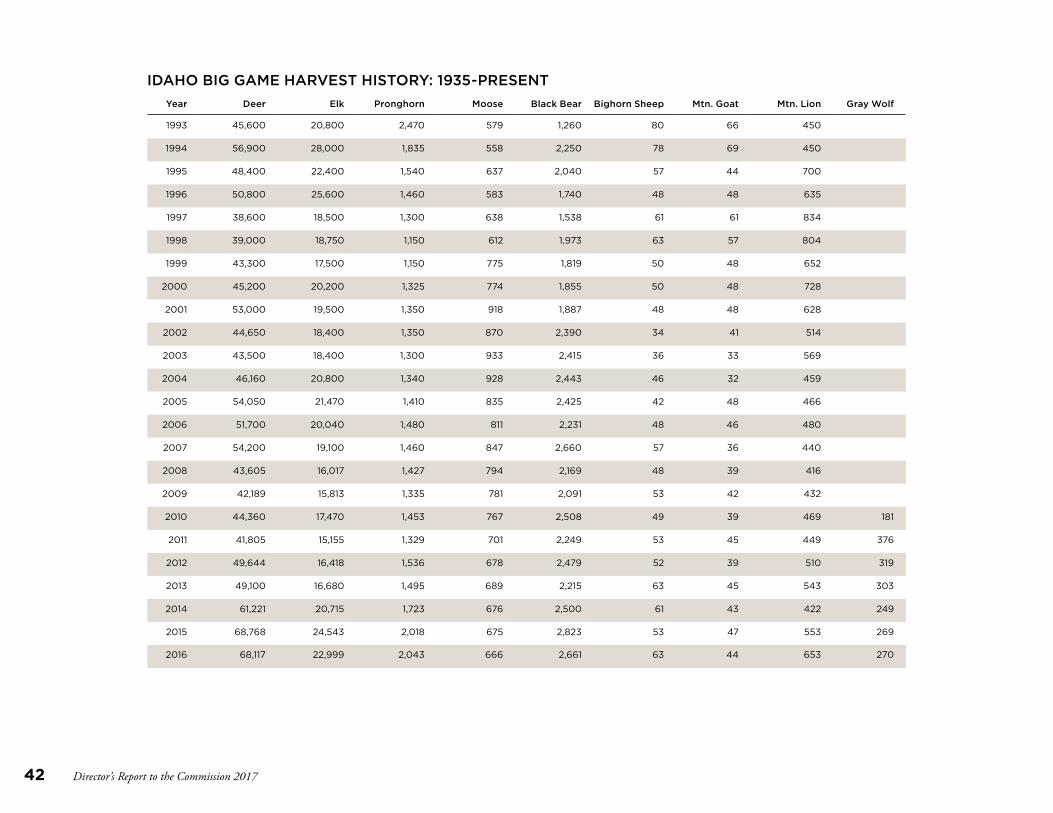
42 Director’s Report to the Commission 2017
IDAHO BIG GAME HARVEST HISTORY: 1935-PRESENTYear Deer Elk Pronghorn Moose Black Bear Bighorn Sheep Mtn. Goat Mtn. Lion Gray Wolf
1993 45,600 20,800 2,470 579 1,260 80 66 450
1994 56,900 28,000 1,835 558 2,250 78 69 450
1995 48,400 22,400 1,540 637 2,040 57 44 700
1996 50,800 25,600 1,460 583 1,740 48 48 635
1997 38,600 18,500 1,300 638 1,538 61 61 834
1998 39,000 18,750 1,150 612 1,973 63 57 804
1999 43,300 17,500 1,150 775 1,819 50 48 652
2000 45,200 20,200 1,325 774 1,855 50 48 728
2001 53,000 19,500 1,350 918 1,887 48 48 628
2002 44,650 18,400 1,350 870 2,390 34 41 514
2003 43,500 18,400 1,300 933 2,415 36 33 569
2004 46,160 20,800 1,340 928 2,443 46 32 459
2005 54,050 21,470 1,410 835 2,425 42 48 466
2006 51,700 20,040 1,480 811 2,231 48 46 480
2007 54,200 19,100 1,460 847 2,660 57 36 440
2008 43,605 16,017 1,427 794 2,169 48 39 416
2009 42,189 15,813 1,335 781 2,091 53 42 432
2010 44,360 17,470 1,453 767 2,508 49 39 469 181
2011 41,805 15,155 1,329 701 2,249 53 45 449 376
2012 49,644 16,418 1,536 678 2,479 52 39 510 319
2013 49,100 16,680 1,495 689 2,215 63 45 543 303
2014 61,221 20,715 1,723 676 2,500 61 43 422 249
2015 68,768 24,543 2,018 675 2,823 53 47 553 269
2016 68,117 22,999 2,043 666 2,661 63 44 653 270
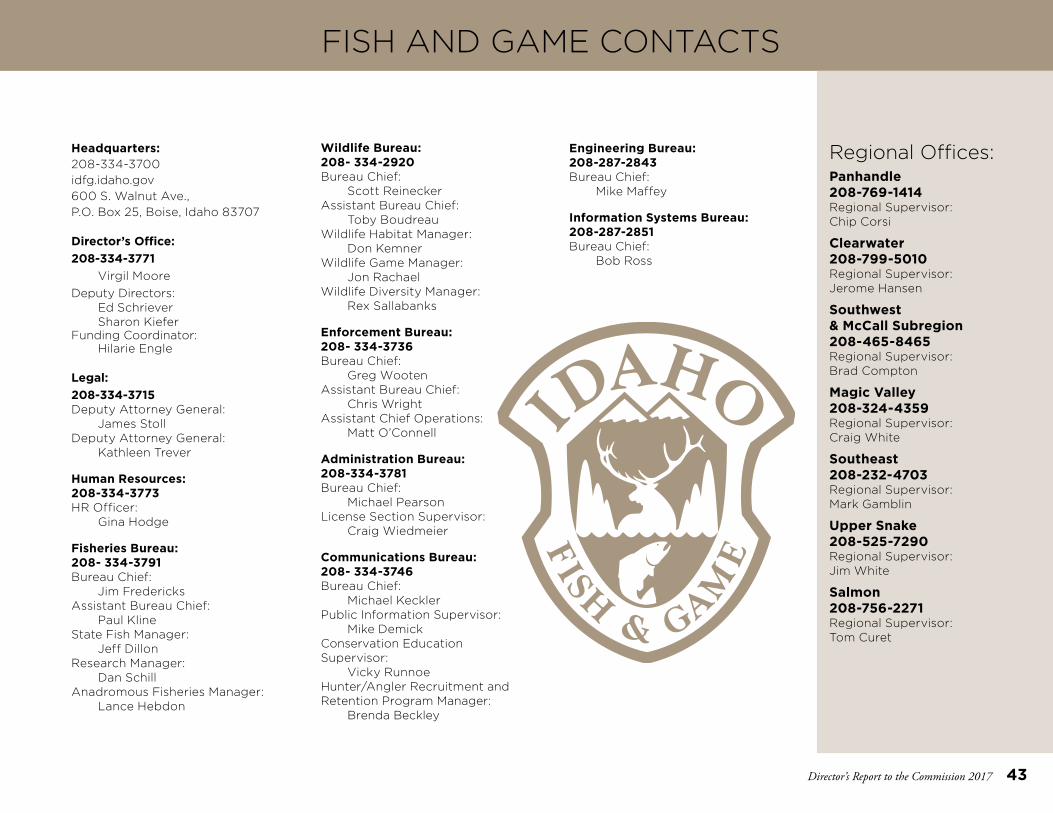
Director’s Report to the Commission 2017 43
Headquarters: 208-334-3700idfg.idaho.gov600 S. Walnut Ave., P.O. Box 25, Boise, Idaho 83707
Director’s Office: 208-334-3771 Virgil MooreDeputy Directors: Ed Schriever Sharon KieferFunding Coordinator: Hilarie Engle
Legal: 208-334-3715 Deputy Attorney General: James StollDeputy Attorney General: Kathleen Trever
Human Resources: 208-334-3773 HR Officer: Gina Hodge
Fisheries Bureau: 208- 334-3791 Bureau Chief: Jim FredericksAssistant Bureau Chief: Paul KlineState Fish Manager: Jeff DillonResearch Manager: Dan SchillAnadromous Fisheries Manager: Lance Hebdon
FISH AND GAME CONTACTS
Wildlife Bureau: 208- 334-2920 Bureau Chief: Scott ReineckerAssistant Bureau Chief: Toby BoudreauWildlife Habitat Manager: Don KemnerWildlife Game Manager: Jon RachaelWildlife Diversity Manager: Rex Sallabanks
Enforcement Bureau: 208- 334-3736 Bureau Chief: Greg WootenAssistant Bureau Chief: Chris WrightAssistant Chief Operations: Matt O’Connell
Administration Bureau: 208-334-3781 Bureau Chief: Michael PearsonLicense Section Supervisor: Craig Wiedmeier
Communications Bureau: 208- 334-3746 Bureau Chief: Michael KecklerPublic Information Supervisor: Mike Demick Conservation Education Supervisor: Vicky RunnoeHunter/Angler Recruitment and Retention Program Manager: Brenda Beckley
Engineering Bureau: 208-287-2843 Bureau Chief: Mike Maffey
Information Systems Bureau: 208-287-2851 Bureau Chief: Bob Ross
Regional Offices:Panhandle 208-769-1414Regional Supervisor: Chip Corsi
Clearwater 208-799-5010 Regional Supervisor: Jerome Hansen
Southwest & McCall Subregion 208-465-8465Regional Supervisor: Brad Compton
Magic Valley 208-324-4359Regional Supervisor: Craig White
Southeast 208-232-4703Regional Supervisor: Mark Gamblin
Upper Snake 208-525-7290Regional Supervisor: Jim White
Salmon 208-756-2271 Regional Supervisor: Tom Curet
Idaho Fish and Game adheres to all applicable state and federal laws and regulations related to discrimination on the basis of race, color, national origin, age, gender, disability or veteran’s status. If you feel you have been discriminated against in any program, activity, or facility of Idaho Fish and Game, or if you desire further information, please write to:
Idaho Department of Fish and Game P.O. Box 25 Boise, ID 83707 or
U.S. Fish and Wildlife ServiceDivision of Federal Assistance Mailstop: MBSP-4020 4401 N. Fairfax Drive Arlington, VA 22203 Telephone: (703) 358-2156
This publication will be made available in alternative formats upon request. Please contact the Department of Fish and Game for assistance. All photos are ©IDFG unless otherwise credited Costs associated with this publication are available from IDFG in accordance with Section 60-202, Idaho Code.
2017 Directors Report to the Commission BOC pca 51907 1-2018/150AC/GG