idaho department of fish and game · idaho department of fish and game steve huffaker, director ......
TRANSCRIPT

IDAHO DEPARTMENT OF FISH AND GAME
Steve Huffaker, Director
FEDERAL AID IN FISH RESTORATION 2002 Job Performance Report
Project F-71-R-27
REGIONAL FISHERIES MANAGEMENT INVESTIGATIONS SOUTHEAST REGION
Largemouth Bass Fisheries Fish Predation by Cormorants and Pelicans in Blackfoot Reservoir Snake River Creel and Sturgeon Survey Yellowstone Cutthroat Trout Monitoring in Blackfoot River Bonneville Cutthroat Trout Monitoring in the Thomas Fork Tributaries
Prepared by:
David Teuscher, Regional Fishery Biologist Richard Scully, Regional Fishery Manager
IDFG 03-06
August 2006
i
TABLE OF CONTENTS
Page Executive Summary .......................................................................................................... 1 LARGEMOUTH BASS FISHERIES INTRODUCTION ................................................................................................................ 3 STUDY WATERS ............................................................................................................... 3 METHODS……................................................................................................................... 3 Relative Abundance……............................................................................................ 4 Age Analysis……….................................................................................................... 4 Diet Analysis……….................................................................................................... 6 RESULTS…… .................................................................................................................... 8 Relative Abundance……............................................................................................ 8 Age Analysis……….................................................................................................... 8 Diet Analysis……….................................................................................................... 11 DISCUSSION...................................................................................................................... 12 Condie Reservoir .................................................................................................... 12 Lamont Reservoir .................................................................................................... 13 Johnson Reservoir .................................................................................................. 13 Glendale Reservoir ................................................................................................. 13 Twin Lakes Reservoir.............................................................................................. 14 St. Johns Reservoir................................................................................................. 14 Deep Creek ............................................................................................................. 14 Weston Reservoir.................................................................................................... 16 General Conclusions............................................................................................... 16 FISH PREDATION BY CORMORANTS AND PELICANS IN BLACKFOOT RESERVOIR INTRODUCTION ................................................................................................................ 17 STUDY AREA…….............................................................................................................. 17 METHODS……….. ............................................................................................................. 18 RESULTS…… .................................................................................................................... 18 DISCUSSION...................................................................................................................... 20 Recommendation .................................................................................................... 21 SNAKE RIVER CREEL AND WHITE STURGEON SURVEY INTRODUCTION ................................................................................................................ 22

ii
TABLE OF CONTENTS (Continued)
Page METHODS……................................................................................................................... 22 Creel Survey……….................................................................................................... 22 White Sturgeon Sampling…....................................................................................... 23 RESULTS…… .................................................................................................................... 23 Creel Survey……….................................................................................................... 23 Sturgeon Sampling…................................................................................................. 26 DISCUSSION...................................................................................................................... 26 Recommendation .................................................................................................... 27 YELLOWSTONE CUTTHROAT TROUT MONITORING AND RAINBOW TROUT REMOVAL IN THE BLACKFOOT RIVER INTRODUCTION AND METHODS..................................................................................... 29 RESULTS AND DISCUSSION…........................................................................................ 31 Recommendation .................................................................................................... 31 BONNEVILLE CUTTHROAT TROUT MONITORING IN THE THOMAS FORK TRIBUTARIES INTRODUCTION AND METHODS..................................................................................... 32 RESULTS AND DISCUSSION…........................................................................................ 32 Recommendation .................................................................................................... 32 ACKNOWLEDGMENTS ..................................................................................................... 36 LITERATURE CITED…….. ................................................................................................ 37
LIST OF TABLES
Table 1. Reservoirs included in the 2002 largemouth bass investigation. In
addition to the listed species, all of the reservoirs are stocked with catchable size (>244 mm) hatchery rainbow trout....................................... 4
Table 2. Total catch of largemouth bass and other fish species sampled with
shoreline boat electrofishing equipment. CPUE is the number of fish caught per hour of electrofishing. Rainbow trout were not included in this analysis. CPUE data is missing from St. Johns Reservoir because sampling was completed as a salvage operation and effort (time) was not recorded. ..................................................................................................... 8
iii
TABLE OF CONTENTS (Continued)
Page Table 3. Mean length at age data for largemouth bass sampled in eight reservoirs
in southeast Idaho. Sample sizes are shown in parentheses. The total number of fish aged from each reservoir are listed in the bottom row. Growth equations for each reservoir and the estimated age-at-stock (200 mm) and age-at-quality (300 mm) size are also shown. The growth equation is a power function where x = age and y = total length................. 11
Table 4. Diet results from largemouth bass in eight reservoirs in southeast Idaho.
The values represent aggregate percent by weight. ................................... 12 Table 5. Bird population parameters, prey selection, and consumption estimates
for DCC and AWP in Blackfoot Reservoir ................................................... 20 Table 6. Catch statistics by month for the Dam-Neely reach of the Snake River
below American Falls Dam. Results do not include opening day creel. ..... 24 Table 7. Catch statistics by month for the Massacre Rocks reach of the Snake
River. Results do not include opening day creel. ....................................... 24 Table 8. Statistics of white sturgeon fish caught below American Falls Dam in
2002. Old PIT denotes those fish that possessed a PIT Tag that was inserted prior to release in the river. New PIT denotes those fish that did not possess a PIT tag when captured but were fitted with one in 2002. The scute column refers to a mark that was made prior to release in the hatchery….. ................................................................................................. 26
Table 9. Catch results from the adult migration trap on the Blackfoot River. A
rating of 1 was for rainbow trout and a rating of 5 for Yellowstone cutthroat trout. Fish with a rating of 4 were classified as cutthroat trout, but separated from a rating of 5 because they possessed spots on their head. .......................................................................................................... 31
Table 10. Bonneville cutthroat trout densities (numbers/100 m2) in Preuss, Giraffe,
and Dry creeks from 1981 through 2002. Only fish greater than 75 mm are shown.................................................................................................... 34
LIST OF FIGURES Figure 1. Relative expenditures (% of budget) for southeast Idaho fisheries
program. Data from July 2002 through January 2003. Personnel, operating, and capital outlay expenses were pooled................................... 2
Figure 2. Figure showing methods used to section largemouth bass otoliths. ........... 5

iv
TABLE OF CONTENTS (Continued)
Page Figure 3. A view of a sectioned otolith from an age 9 largemouth bass. The picture
was taken using a dissecting microscope fitted with a digital video camera 7 Figure 4. Length frequencies, PSD, and relative weight values for largemouth bass
in eight southeast Idaho reservoirs. The frequency data includes only fish sampled while all fish were being netted. Larger bass were collected in some of the waters while attempting to catch large fish for age analysis. Bass collected during the selective netting runs were not included in these graphs or in the PSD estimates. The vertical bars indicate minimum length restrictions for harvest. Double vertical lines represent waters with a 12”-16” slot limit regulation .................................................... 9
Figure 5. Echograms of fish marked with hydroacoustics on four reservoirs in
southeast Idaho. The size of each circle is a relative scale for fish size. The solid lines represent the bottom of the reservoirs................................. 10
Figure 6. Length at age function for southeast Idaho largemouth bass...................... 15 Figure 7. Aerial view of Gull Island. Total surface area is 2.1 ha............................... 19 Figure 8. Diet proportions from regurgitation samples from DCC and AWP collected
in 2002 and relative species composition from net samples collected from Blackfoot Reservoir in 2001 ........................................................................ 21
Figure 9. Trends in relative weight of rainbow trout caught on opening day below
American Falls Dam in the Snake River. The error bars on the top figure are two standard errors. The lower figure plots the percent of fish measured that were below standard weight. About 79% of the trout weighed in 2002 were below standard weight............................................. 25
Figure 10. Length-weight plot for white sturgeon sampled below Shoshone Falls in
the Snake River (x symbols) and above Shoshone Falls near American Falls Dam (large filled circles). .................................................................... 28
Figure 11. Upper Blackfoot River drainage showing the adult migration trap, the
Wildlife Management Area, and the diversion dam on the Blackfoot River. 30 Figure 12. Map of the Thomas Fork Tributaries ........................................................... 33 Figure 13. Correlation between catch on the first electrofishing pass and the density
estimate from a three pass depletion estimate for tributaries stream of the Thomas Fork ............................................................................................... 35

1
EXECUTIVE SUMMARY
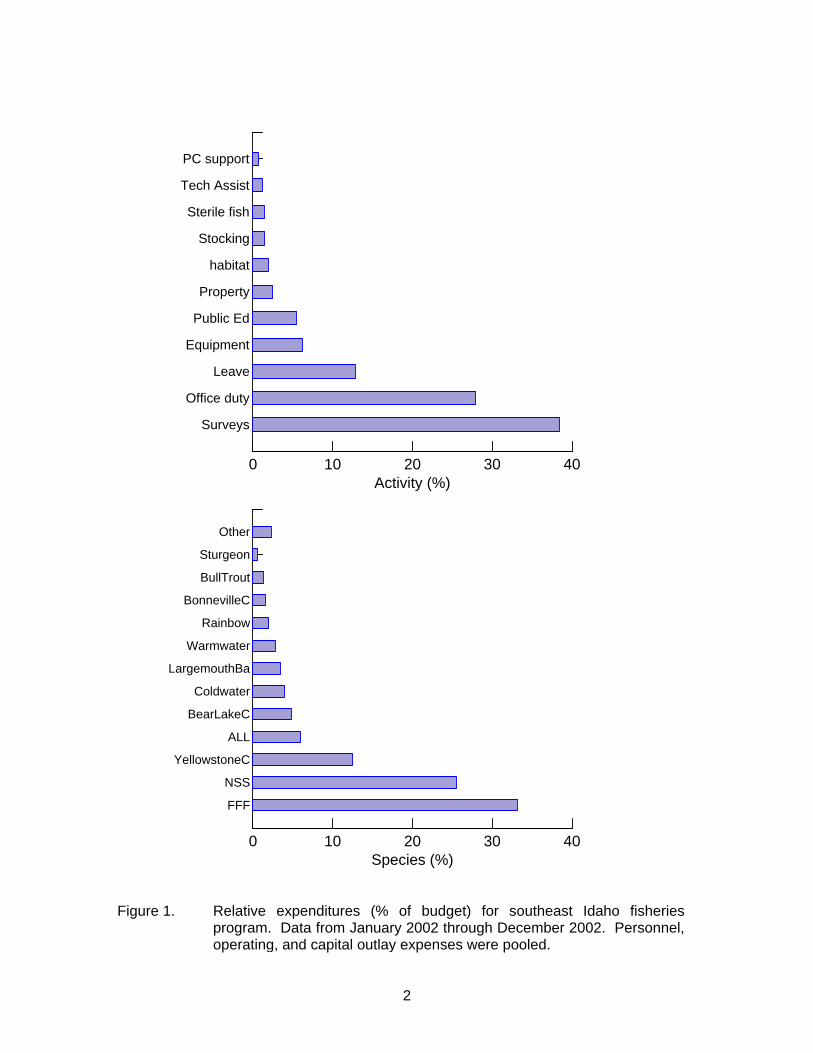
In 2002, the southeast Idaho fisheries program continued long-term monitoring surveys for Yellowstone and Bonneville cutthroat trout, completed a largemouth bass survey in eight reservoirs, began a pilot study to estimate bird predation on trout populations in Blackfoot Reservoir, completed a season-long creel survey on the Snake River below American Falls Dam, and initiated a preliminary study of white sturgeon in the Snake River. Relative expenditures (%) by activity and species are shown in Figure 1.
The number of Yellowstone cutthroat trout spawning in the upper Blackfoot River declined from 4,747 in 2001 to 902 in 2002. A total of 9 rainbow trout and 10 hybrids were also caught in the trap. A rating system was used to classify adult rainbow, hybrids, and cutthroat trout. Genetic samples and photographs were taken from a random sample of fish in each rating category. The combination of genetic samples, photographs and the rating system will be used to develop a sorting template for adult trout collected at the trap.
The densities of Bonneville cutthroat trout declined in all three major tributary streams of the Thomas Fork of the Bear River. Densities were 3, 2, and 1 fish per 100 m2 in Preuss, Giraffe, and Dry creeks, respectively. Densities were 8, 17, and 25 fish per 100 m2 in the same creeks in 2000. This monitoring program has been in place since 1981. The long-term dataset shows extremely variable densities that appear to fluctuate in concert with draught conditions.
Catch rates and condition of rainbow trout caught in the Snake River below American Falls Dam declined markedly from creel data collected in 1997 and 1998. Total catch of rainbow trout was 18,064 in 1997, 26,102 in 1998, and 9,477 in 2002. Angling effort was 42,791 hours in 1997, 63,555 in 1998, and 39,612 in 2002. The decline in the trout fishery was partially offset by an increase in the popularity of the catch-and-release white sturgeon fishery. Total catch of sturgeon in 2002 exceeded 400 fish. Anglers are catching sturgeon up to 183 cm (6 feet) in length and 45 kg (100 lbs).
The largemouth bass surveys showed extreme variation in densities, growth, and foraging habits. The oldest largemouth bass were 15 years. Length at age results indicated that over-recruitment of small fish resulted in stunted bass populations in Twin Lakes and Johnson Reservoir. The average length at age-6 largemouth bass in Twin Lakes was only 174 mm. In contrast, age-6 largemouth bass in Glendale Reservoir averaged 321 mm. Largemouth bass recruitment in Condie Reservoir has failed the last six years. Waters with quality bass regulations (305 – 406 mm slot limit) supported the best PSD ratios for largemouth bass and bluegill.
Double crested cormorants and American white pelicans consumed about 160 metric tons of fish during the 2002 nesting season. Preliminary diet analysis indicated that most fish eaten by both species were Utah chub (>90% by occurrence). Yellowstone cutthroat trout made up 2.3% of the diet of American white pelicans. Additional diet work is needed to estimate the potential impact of avian predation on cutthroat trout and hatchery rainbow trout.
2
Figure 1. Relative expenditures (% of budget) for southeast Idaho fisheries program. Data from January 2002 through December 2002. Personnel, operating, and capital outlay expenses were pooled.
Surveys
Office duty
Leave
Equipment
Public Ed
Property
habitat
Stocking
Sterile fish
Tech Assist
PC support
0 10 20 30 40Activity (%)
FFF
NSS
YellowstoneC
ALL
BearLakeC
Coldwater
LargemouthBa
Warmwater
Rainbow
BonnevilleC
BullTrout
Sturgeon
Other
0 10 20 30 40Species (%)

3
LARGEMOUTH BASS FISHERIES
INTRODUCTION
In the early 1990s a comprehensive research study was initiated to better understand the biology of largemouth bass Micropterus salmoides in Idaho (Dillon 1991). Conclusion of that work indicated that water temperature was a key factor controlling largemouth bass productivity. Several other studies have described largemouth bass growth potential as a function of temperature and latitude (McCauley and Kilgour 1990; Beamesderfer and North 1995). Those studied coupled with Dillon (1991) identify the maximum growth potential for largemouth bass in the predominately cold water lakes and reservoirs in Idaho. However, many other factors can contribute to the population structure and success of a largemouth bass fishery. Most importantly are harvest, lake productivity, and interaction among fish species (i.e., competition and predation). Continued monitoring of those variables is necessary to maintain or improve largemouth bass fisheries in southeast Idaho.
Since 1990, several changes have been implemented in southeast Idaho’s largemouth bass fisheries. Some of those changes include: 1) restricting harvest, 2) introducing tiger muskellunge Esox lucius x E. masquinongy, yellow perch Perca flavescens, and crappie sp. Pomoxis sp., and 3) increases in the number of competitive angling tournaments. The objectives of this investigation were to begin an evaluation of the impact of those changes and to evaluate the effectiveness of current largemouth bass regulation. Have largemouth bass populations responded to reductions in harvest? What impact did the introduction of tiger muskellunge have on the largemouth bass fisheries? Lastly, are catch rate goals being met in quality and trophy largemouth bass fisheries?
STUDY WATERS
Fisheries data were collected from 9 reservoirs located in southeast Idaho. All of the reservoirs are small (< 200 ha), shallow, and productive. Table 1 shows reservoir name, elevation, surface area, species composition, and current largemouth bass harvest regulations.
METHODS
In late June and July 2002, largemouth bass and potential prey species abundance was evaluated by electrofishing the shorelines in a boat and completing hydroacoustic surveys. Target species for electrofishing included largemouth bass, bluegill, crappie sp., and yellow perch. Sampling goals were to collect enough largemouth bass to complete length-at-age analysis, estimate proportional stock densities (PSD), complete diet summaries, and estimate the relative abundance of potential prey. Specific methods for completing those goals are listed below:

4
Table 1. Reservoirs included in the 2002 largemouth bass investigation. In addition to the listed species, all of the reservoirs are stocked with catchable size (>244 mm) hatchery rainbow trout.
Water Elevation
(m) Surface
Area (ha) Species
Composition Harvest Regulations for
largemouth bass Regulation
Date Johnson 1,485 20 LMB,BG,YP,TM 6 none under 305 mm Pre 1990 Lamont 1,485 37 LMB,BG,YP,TM 6 none under 305 mm Pre 1990 Glendale 1,509 93 LMB,BG,CR,YP 2 none under 406 mm 1992 Twin Lakes 1,452 180 LMB,BG,YP 6 any size 2002 Weston 1,682 45 LMB,YP 2 none 305 mm-406 mm 1998 Condie 1,500 47 LMB,BG,YP,TM 2 none under 508 mm 1990 Deep 1,571 74 LMB 6 any size 1998 Winder 1,492 38 LMB,BG,YP 6 none under 305 mm Pre 1990 St. Johns 1,443 19 LMB,BG,YP,CR 2 none 305 mm-406 mm 1992 largemouth bass= LMB, bluegill = BG, tiger muskellunge = TM, yellow perch = YP, crappie sp .= CR. Relative Abundance
Catch per unit effort (CPUE) was used to compare the relative abundance of largemouth bass and their potential prey fish among the nine reservoirs. The CPUE data were collected using boat-mounted electrofishing equipment. All electrofishing effort was completed at night between 2100 and 0400 hours. Netting effort varied depending on catch rates. The first priority was to obtain a random sample of all species. A second goal was to obtain a sample of 10 largemouth bass from all distinguishable cohorts. In some waters, bluegill or yellow perch densities were too high to continually net those species and achieve the sample goal for largemouth bass. In such cases, selective netting for largemouth bass was implemented. Size selective netting periods for largemouth bass were not included in CPUE or PSD analysis. Fish were weighed to the nearest 0.01 kg and measured for total length (mm).
In addition to the electrofishing data, hydroacoustic surveys were completed on four waters. Detailed methods for completing a pelagic fish survey using hydroacoustics are described in Teuscher (2001). The acoustic data were used to help determine if high densities of pelagic fish were positively (abundant prey) or negatively (interspecific competition) correlated with largemouth bass growth, PSD, or relative weight. These surveys were the first efforts that the Idaho Department of Fish and Game (Department) has made to assess the relative abundance of pelagic fish in warmwater fisheries. Day and night surveys were completed on Twin Lakes and Condie reservoirs to assess diel variations in pelagic fish abundance. Age Analysis
Otoliths were removed from the largemouth bass and placed in scale envelopes. Age analysis was completed using sectioned otoliths. Otolith sections were prepared and cut using the following steps:
1. Cut a drinking straw horizontally in half 2. Seal the ends of the straw by taping them to an 203 mm X 279 mm sheet of white paper 3. Fill the straw with ACE extra strength slow drying epoxy 4. Label the straw and paper for otolith identification

5
5. Place the otolith in the epoxy in a horizontal aspect (Figure 2) 6. Allow the otoliths to set in epoxy for 24 hours. Mark the nucleus of the otolith by holding
the epoxy and otoliths up to a bright light so that the center of the otolith can be marked with a Sharpie
Figure 2. Figure showing methods used to section largemouth bass otoliths.
Pore epoxy in straw and place otolith horizontally in epoxy. The otoliths settled to the bottom of the straw. For proper cutting, otoliths must be covered in epoxy
Mark nucleus of otolith with sharpie and cut out section with dremel tool. Leave 2 mm thick section.
otolith straw
epoxy

6
7. Cut on both sides of the Sharpie line leaving the center of the otolith embedded in a thin
section of the epoxy. A standard Dremel tool with a 0.5 mm cutting blade is a sufficient cutting devise.
8. Store otolith sections in original scale envelopes
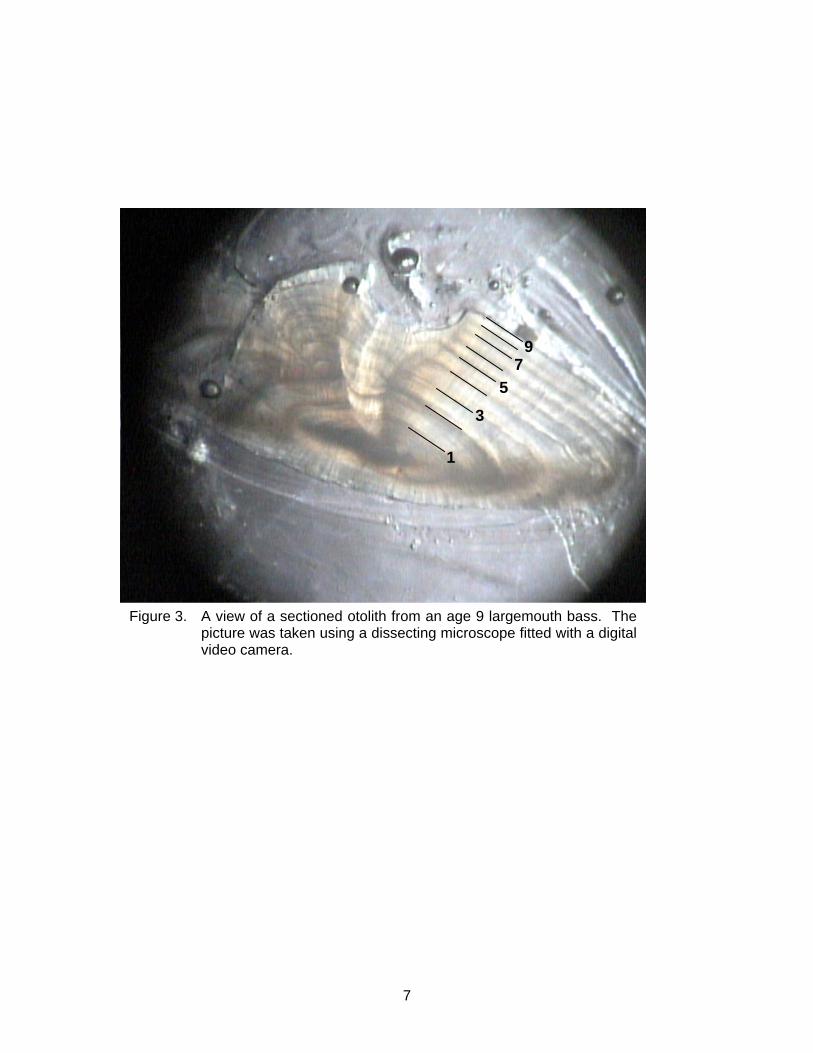
Sectioned otoliths were read using a dissecting microscope. To finish the otoliths for reading, the sections were lightly sanded with 400 and 600 wet-dry sandpaper. The otolith sections were placed in glycerin and read with translucent light at 20 to 35 X magnification. Annuli were identified as the dark regions of the otolith (Figure 3). Diet Analysis
Diet analysis was completed on all largemouth bass that were sacrificed for ageing work. Prey were removed from the largemouth bass and pooled by major diet categories (e.g., fish, insects, crustaceans, and mollusks). Prey items were weighed to nearest 0.01 g. Diet results were compared using aggregate percent by weight.
7
1
3
5 7
9
Figure 3. A view of a sectioned otolith from an age 9 largemouth bass. The picture was taken using a dissecting microscope fitted with a digital video camera.

8
RESULTS Relative Abundance
Relative abundance of largemouth bass was greatest in Deep Creek Reservoir (CPUE = 432 largemouth bass / hour). CPUE was lowest in Winder Reservoir at six largemouth bass / hour. Table 2 shows CPUE for largemouth bass and other fish sampled during the electrofishing surveys. Length frequency distributions, relative weights, and PSD for largemouth bass are shown in Figure 4. Table 2. Total catch of largemouth bass and other fish species sampled with shoreline boat
electrofishing equipment. CPUE is the number of fish caught per hour of electrofishing. Rainbow trout were not included in this analysis. CPUE data is missing from St. Johns Reservoir because sampling was completed as a salvage operation and effort (time) was not recorded.
CPUE PSD (%) Water LMB BG YP LMB BG YP Deep Creek 432 0 0 4 NA NA Twin Lakes 120 76 3 0 2 50 Glendale 114 8 5 58 20 100 Weston 66 0 2 0 NA 100 Johnson 54 305 0 7 24 NA Lamont 54 71 4 8 89 100 Condie 48 11 0 97 100 Na Winder 6 7 12 0 67 0 St Johns 27 100 NA largemouth bass= LM. bluegill = BG, tiger muskellunge = TM, yellow perch = YP, crappie sp. = CR.
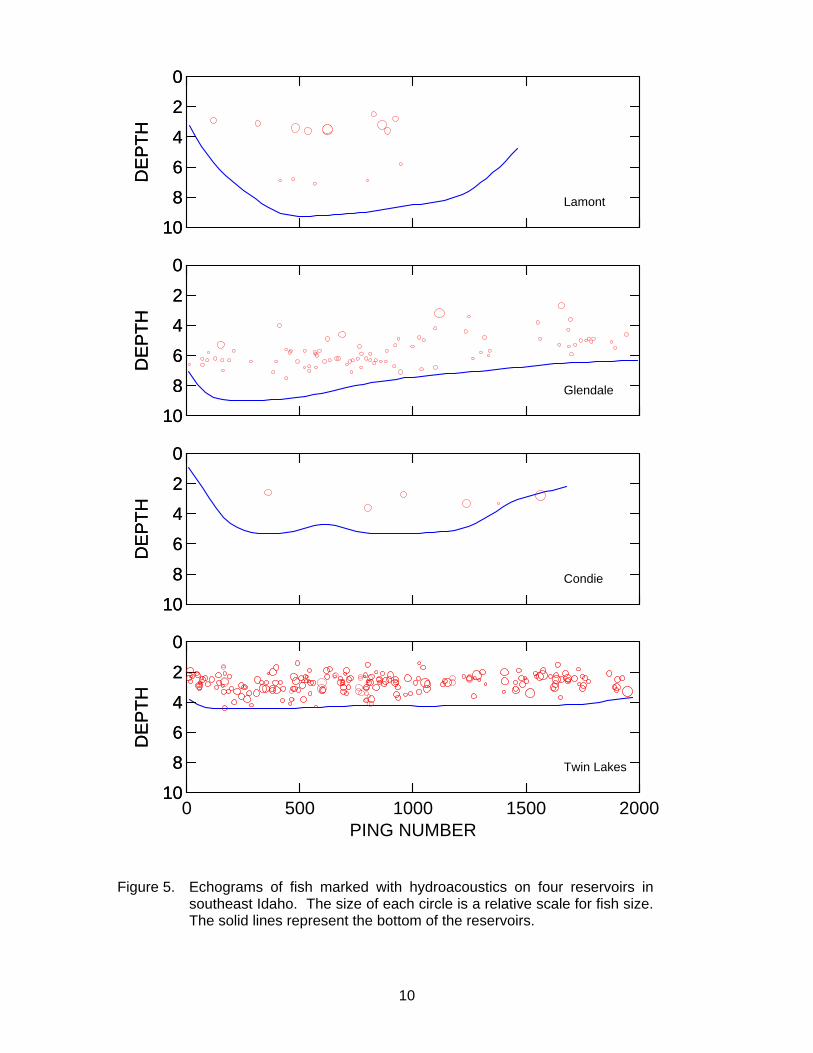
Hydroacoustic estimates of pelagic fish densities varied markedly among waters. The CPUE (number of fish marked by sonar per hour) was greatest during the night survey in Twin Lakes (3,030), followed by Glendale (1,289), Lamont (114), and Condie (64). The rank order is the same observed for shoreline electrofishing CPUE (see Table 2). The night-time survey estimates were significantly higher than surveys completed during the day. In Twin Lakes, pelagic sonar CPUE was 11 times greater at night compared to the day-time estimates. Pelagic fish densities in the four reservoirs are shown in Figure 5. Age Analysis
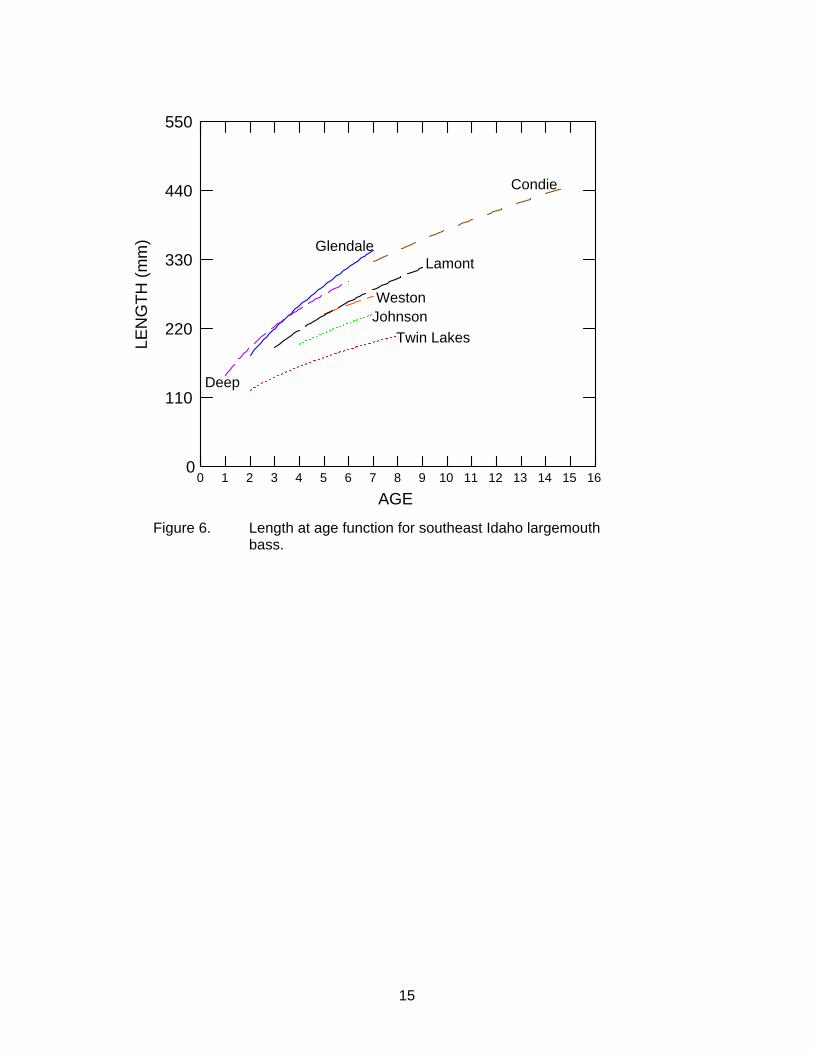
Length at age analysis results varied among waters. The fastest growth occurred in Glendale and Deep Creek reservoirs with age 5 lengths averaging 280 and 296 mm, respectively. Table 3 shows mean length at age data for all the reservoirs. The oldest largemouth bass sampled were age 15 and were collected from Condie Reservoir. Growth equations for each reservoir are shown in Table 3. Those equations were used to estimate the length of time (fish age) necessary for a largemouth bass population to reach stock size (200 mm) and quality size (300 mm). Age at stock size was lowest for Condie Reservoir (2.1 years) and highest in Twin Lakes (7.1 years). Largemouth bass growth rates in Twin Lakes were so poor that the average fish would not obtain quality size prior to reaching the maximum age of 15.

9
Cou
nt
Figure 4. Length frequencies, PSD, and relative weight values for largemouth bass in eight southeast Idaho reservoirs. The frequency data includes only fish sampled while all fish were being netted. Larger bass were collected in some of the waters while attempting to catch large fish for age analysis. Bass collected during the selective netting runs were not included in these graphs or in the PSD estimates. The vertical bars indicate minimum length restrictions for harvest. Double vertical lines represent waters with a 12”-16” slot limit regulation.
0 110 220 330 440 550Total Length (mm)
0
10
20
30
TwinPSD = 0Wr = 86
0
10
20
30
40
50
DEEPPSD = 4Wr =111
0
10
20
30
LamontPSD = 8Wr = 90
0
10
20
30
GlendalePSD = 58Wr = 95
0 110 220 330 440 550Total Length (mm)
0
10
20
30
CondiePSD = 97Wr = 89
0
10
20
30
St JohnsPSD = 27Wr = 95
0
10
20
300
10
20
30
0
10
20
30
WestonPSD = 0Wr = 100
0
10
20
30
JohnsonPSD = 7Wr = 86
10
0 500 1000 1500 2000PING NUMBER
0
2
4
6
8
10
DE
PTH
Twin Lakes
0
2
4
6
8
10
DE
PTH
0
2
4
6
8
10
DE
PTH
Condie
0
2
4
6
8
10
DE
PTH
0
2
4
6
8
10
DE
PTH
Glendale
0
2
4
6
8
10
DE
PTH
0
2
4
6
8
10
DE
PTH
Lamont
0
2
4
6
8
10
DE
PTH
Figure 5. Echograms of fish marked with hydroacoustics on four reservoirs in southeast Idaho. The size of each circle is a relative scale for fish size. The solid lines represent the bottom of the reservoirs.

11
Table 3. Mean length at age data for largemouth bass sampled in eight reservoirs in southeast
Idaho. Sample sizes are shown in parenthesis. The total number of fish aged from each reservoir are listed in the bottom row. Growth equations for each reservoir and the estimated age-at-stock (200 mm) and age-at-quality (300 mm) size are also shown. The growth equation is a power function where x = age and y = total length.
Reservoir
Age Condie Deep Glendale Johnson Lamont Twin Weston1 156(1) 2 165(5) 167(3) 117(3) 3 222(4) 205(4) 4 267(4) 289(8) 187(4) 212(1) 180(3) 5 280(7) 296(4) 233(4) 169(1) 245(9)6 294(4) 321(1) 224(1) 256(5) 174(6) 255(11)7 339(1) 315(1) 239(3) 255(5) 228(13) 274(1)8 342(6) 253(2) 189(3) 9 354(3) 411(1)
10 361(6) 11 411(1) 12 417(2) 13 403(4) 14 421(3) 15 475(2)
n 28 21 21 12 18 29 21
Equations 146(x0.4125) 145(x0.3979) 123(x0.5307) 114(x0.3923) 115(x0.4634) 94(x0.384) 143(x0.3319)Age-at-stock 2.1 2.2 2.5 4.2 3.3 7.1 2.8
Age-at-quality 5.7 6.2 5.4 11.9 8.0 >15 9.4 Diet Analysis
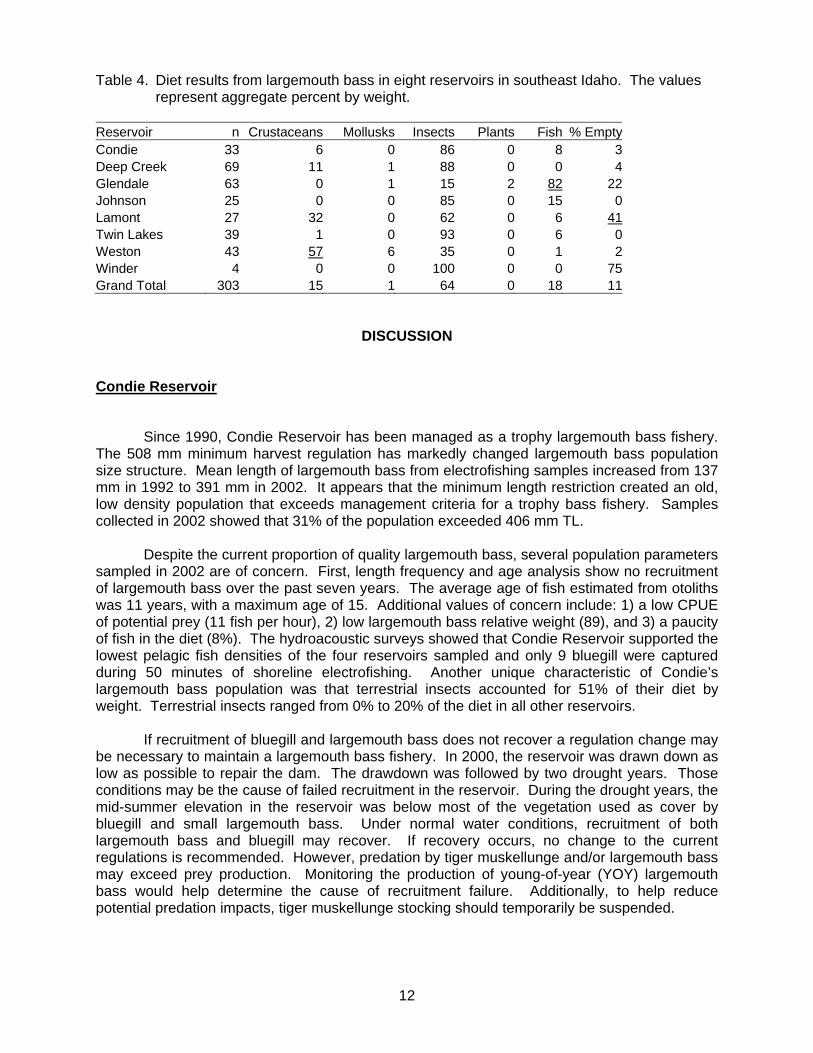
Diet of largemouth bass varied markedly among the eight waters sampled (Table 4). Aquatic and terrestrial insects dominated largemouth bass prey. Insect prey accounted for 93%, 88%, and 86% of diet for Twin Lakes, Condie, and Deep Creek reservoirs. Fish made up 82% of the prey by weight in Glendale Reservoir. Fish accounted for 15% of the diet of largemouth bass in Lamont Reservoir. Consumption of fish was less than 10% in all other reservoirs (Table 4).
12
Table 4. Diet results from largemouth bass in eight reservoirs in southeast Idaho. The values represent aggregate percent by weight.
Reservoir n Crustaceans Mollusks Insects Plants Fish % EmptyCondie 33 6 0 86 0 8 3Deep Creek 69 11 1 88 0 0 4Glendale 63 0 1 15 2 82 22Johnson 25 0 0 85 0 15 0Lamont 27 32 0 62 0 6 41Twin Lakes 39 1 0 93 0 6 0Weston 43 57 6 35 0 1 2Winder 4 0 0 100 0 0 75Grand Total 303 15 1 64 0 18 11
DISCUSSION Condie Reservoir
Since 1990, Condie Reservoir has been managed as a trophy largemouth bass fishery. The 508 mm minimum harvest regulation has markedly changed largemouth bass population size structure. Mean length of largemouth bass from electrofishing samples increased from 137 mm in 1992 to 391 mm in 2002. It appears that the minimum length restriction created an old, low density population that exceeds management criteria for a trophy bass fishery. Samples collected in 2002 showed that 31% of the population exceeded 406 mm TL.
Despite the current proportion of quality largemouth bass, several population parameters sampled in 2002 are of concern. First, length frequency and age analysis show no recruitment of largemouth bass over the past seven years. The average age of fish estimated from otoliths was 11 years, with a maximum age of 15. Additional values of concern include: 1) a low CPUE of potential prey (11 fish per hour), 2) low largemouth bass relative weight (89), and 3) a paucity of fish in the diet (8%). The hydroacoustic surveys showed that Condie Reservoir supported the lowest pelagic fish densities of the four reservoirs sampled and only 9 bluegill were captured during 50 minutes of shoreline electrofishing. Another unique characteristic of Condie’s largemouth bass population was that terrestrial insects accounted for 51% of their diet by weight. Terrestrial insects ranged from 0% to 20% of the diet in all other reservoirs.
If recruitment of bluegill and largemouth bass does not recover a regulation change may be necessary to maintain a largemouth bass fishery. In 2000, the reservoir was drawn down as low as possible to repair the dam. The drawdown was followed by two drought years. Those conditions may be the cause of failed recruitment in the reservoir. During the drought years, the mid-summer elevation in the reservoir was below most of the vegetation used as cover by bluegill and small largemouth bass. Under normal water conditions, recruitment of both largemouth bass and bluegill may recover. If recovery occurs, no change to the current regulations is recommended. However, predation by tiger muskellunge and/or largemouth bass may exceed prey production. Monitoring the production of young-of-year (YOY) largemouth bass would help determine the cause of recruitment failure. Additionally, to help reduce potential predation impacts, tiger muskellunge stocking should temporarily be suspended.

13
Lamont Reservoir
Lamont Reservoir is a general regulation water. The population structure in the reservoir appears to be stable. Largemouth bass ages 3 through 9 were collected. PSD was low (8%) but the reservoir supports a quality bluegill population, with a high PSD (89%). Yellow perch and tiger muskellunge contribute to the angling diversity. Two tiger muskellunge were caught during 60 minutes of electrofishing. Total lengths of those fish were 720 and 943 mm, respectively. Tiger muskellunge were introduced five years ago in 1997. It follows, that the largest tiger muskellunge sampled averaged six inches of growth per year. Several other tiger muskellunge escaped capture by the netting crew. The general regulation management of Lamont Reservoir appears to be providing a diverse angling opportunity for largemouth bass, rainbow trout, bluegill, yellow perch and trophy tiger muskellunge. Information on angling effort would help managers assess the popularity of general regulation fisheries compared to quality and trophy management waters. Johnson Reservoir
Johnson Reservoir is a general regulation water. Catch, PSD, and growth rates for largemouth bass were relatively low. Johnson Reservoir’s largemouth bass population closely resembles Twin Lakes. In both waters relative weights for largemouth bass are 86%. There is an abundant bluegill population in the reservoir that may compete with juvenile largemouth bass for forage. CPUE of bluegill was over 4 times higher than any other water sampled. The PSD for bluegill in Johnson Reservoir (27%) is markedly lower than Lamont’s bluegill PSD of 89%. Relative weights for bluegill in Johnson Reservoir (98) are also lower than at Lamont Reservoir (106). Currently, the fish community in the reservoir appears to be suffering from over-recruitment of young bluegill. The result is intense competition for food that results in stunted populations of both bluegill and largemouth bass. Tiger muskellunge were introduce in Johnson Reservoir in 1997. No tiger muskellunge were collected during the electrofishing survey. Information on angling effort is lacking. Glendale Reservoir
Glendale Reservoir is managed as a quality largemouth bass fishery (406 mm size). The PSD of 58% is in the range recommended for a healthy largemouth bass and bluegill fishery. Largemouth bass growth and forage fish abundance are above average compared to the other waters sampled in 2002. Forage fish dominated the diet of largemouth bass in the reservoir. This fishery is likely exceeding catch goals for a quality largemouth bass fishery. About 57% of the largemouth bass sampled in 2002 were larger than 305 mm. Interpretation of the Glendale Reservoir dataset may be biased due to an introduction of largemouth bass from St. Johns Reservoir. Prior to completing the survey, 171 largemouth bass from St. Johns Reservoir were released in Glendale. The reservoir capacity is 93 ha which equates to a stocking density of 1.8 largemouth bass / ha. About 15% (26 total) of those fish exceeded 380 mm. No change is recommended for Glendale Reservoir.

14
Twin Lakes Reservoir
Twin Lakes is managed as a family fishing water. Prior to the family fishing water designation in 2002, Twin Lakes was managed under general regulations. Currently, CPUE of largemouth bass and bluegill are well above that of the average water sampled. Growth rates for largemouth bass are the lowest in the region. Relative weights of bluegill are 96 with a PSD of 2%. Current length at age data indicates that it takes about 7 years for largemouth bass to reach 200 mm. Similar to Johnson Reservoir, competition for food caused by an over-abundant population of small bluegill and largemouth bass may negatively impact the fishery. However, anecdotal reports from summer 2002 indicated that catch rates for bluegill and largemouth bass were considered good. Quantitative estimates of angling effort are lacking. Continued population monitoring coupled with a creel survey will help determine the success of family fishing waters that contain dense populations of small bluegill and largemouth bass. St. Johns Reservoir
The dam of St. Johns Reservoir failed in 2002 and the reservoir was completely drained. The reservoir may not be refilled. Prior to dam failure, the community structure in St. Johns appeared to be very healthy. The largemouth bass PSD was 27%. The largest largemouth bass sampled during the 2002 field season came from St. Johns Reservoir (560 mm, 2.9 kg). St Johns Reservoir was managed as a quality largemouth bass fishery. Deep Creek
The largemouth bass population in Deep Creek was illegally introduced in the 1980s and may impact native cutthroat trout Oncorhynchus clarki utah. Largemouth bass of any size can be harvested. Despite the liberal harvest regulations, CPUE for largemouth bass was extremely high (432 largemouth bass / hour). The next highest CPUE was observed in Twin lakes at 120 largemouth bass / hour. Surprisingly, growth rates for largemouth bass were relatively high (Figure 5) but the oldest fish was only six years. No fish were observed in the diet of largemouth bass. The “any size” regulation is not working to limit the bass population.
15
0 1 2 3 4 5 6 7 8 9 10 11 12 13 14 15 16
AGE
0
110
220
330
440
550LE
NG
TH ( m
m)
Twin Lakes
Lamont
Weston
Condie
Johnson
Glendale
Deep
Figure 6. Length at age function for southeast Idaho largemouth bass.

16
Weston Reservoir
In 1998, management was changed from general to quality largemouth bass regulations. Currently the community structure is dominated by three age classes (age 5 – 7). The CPUE and growth rates were average. No bluegill and only two yellow perch were sampled during the electrofishing effort. The mean size of largemouth bass sampled in 2002 was 253 mm. At current growth rates, the average size of the three cohorts sampled should increase to about 300 mm in 2005. No change is recommended for Weston Reservoir. General Conclusions
Several trends were apparent from the preliminary investigation completed in 2002. First, the slow growth observed in these fisheries does not preclude trophy bass management. Largemouth bass populations in special regulation waters responded to reductions in harvest. Secondly, growth in several waters appeared to be negatively correlated to abundance (i.e., Twin Lakes and Johnson reservoirs). Lastly, creel data is needed to evaluate angler use with fish densities and PSD values for prey and largemouth bass.
This work should be interpreted as preliminary. Some of the sample sizes used to estimate PSD for largemouth bass and bluegill were relatively low. Also, additional age analysis would strengthen the length-at-age relationships. Monitoring recruitment of young-of-year would help assess limiting factors in waters with failed year classes. Drought conditions do not explain all failed year classes. Condie, Deep, Twin Lakes, and Lamont reservoirs all have missing year classes. Possible explanations include: starvation, predation, and recruitment failure from reservoir drawdown. Lastly, vegetation cover is another variable that needs to be included in future warmwater fishery evaluations.

17
FISH PREDATION BY CORMORANTS AND PELICANS ON BLACKFOOT RESERVOIR
INTRODUCTION
During the last two decades, double-crested cormorants Phalacrocorax auritus (DCC) have enjoyed widespread expansion in the United States and Canada. Mean annual population growth in North America is about 6% and in some regions is as high as 29% (Wires et al. 2001). The expansion has increased concerns over impacts to recreational fisheries. Derby and Lovvorn (1997) showed that DCC consumed 80% of rainbow trout Oncorhynchus mykiss stocked in the North Platte River, Wyoming. In a similar study, Modde et al. (1996) reported that 31% of rainbow trout stocked in Minersville Reservoir, Utah were consumed by DCC. In Lake Ontario, DCC consumed up to 18% of lake trout Salvelinus namaycush plants, with less mortality occurring for fish stocked offshore (Elrod 1997). In Lake Ontario, DCC predation from a single colony of birds nesting on Little Galloo Island consumed an estimated 9.4 million panfish and 900,000 smallmouth bass (Schiavone 2001). Conclusions from that work suggested that the predation by DCC was negatively impacting the recreational fishery for smallmouth bass (Johnson et al. 2001; Schiavone 2001; Ross and Johnson 1999; Lantry et al. 1999).
DCC and American white pelicans Pelecanus erythrorhynchos (AWP) have established breeding colonies on Gull Island in Blackfoot Reservoir, Idaho. The large concentration of piscivorous birds may impact the sport fishery and recovery efforts of Yellowstone cutthroat trout Oncorhynchus clarkii bouvieri (YCT). Annually, about 1 million hatchery rainbow trout are stocked in Blackfoot Reservoir. Return-to-creel and cost per rainbow trout caught in the reservoir suggest that survival of hatchery rainbow trout in the reservoir is very poor (Teuscher 2002). Additionally, YCT are the native trout species in the Blackfoot River system and are classified by the Idaho Department of Fish and Game as a species of special concern. The YCT population trends show that abundance is substantially below levels reported in the 1970s.
This pilot study is part of an effort to better understand factors controlling survival of the trout species in Blackfoot Reservoir. The specific questions addressed in this study include: 1) how many birds are nesting on Gull Island, 2) are trout part of the diet of DCC and AWP nesting on that Island, and 3) what is the total consumption of fish by those birds.
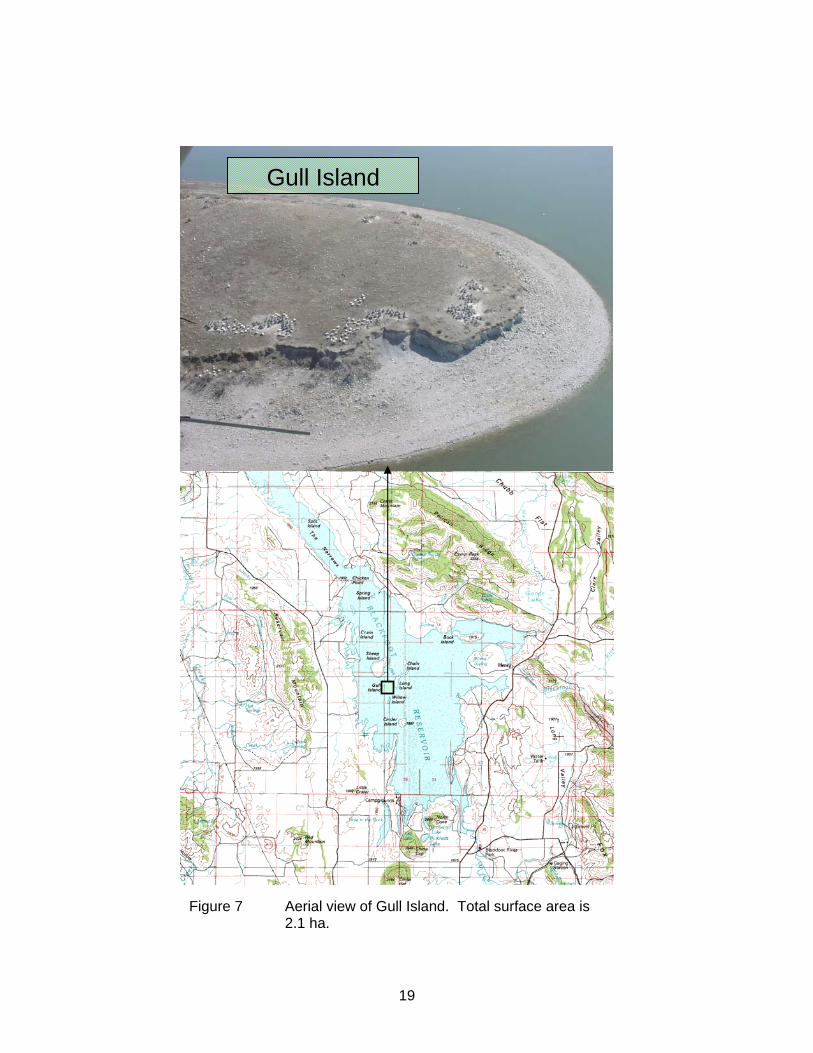
STUDY AREA
Gull Island is 2.5 ha located near the west shore of Blackfoot Reservoir (Figure 7). The island is surrounded by six other islands but is unique in that it is largely denuded of vegetation. Gull Island is about 110 miles (177 km) north of the Great Salt Lake which supports one of the largest nesting colonies of AWP in the United States (UDNR, http://www.utahcdc.usu.edu/rsgis2/Search/Display.asp?FlNm=peleeryt).

18
METHODS
Piscivorous bird consumption was estimated using methods described in VanDeValk et al. (2002). Predator abundance and prey selection were two key variables needed to estimate total fish consumption. Predator abundance was estimated using active nest counts. An active nest is defined as one that contains eggs or chicks. The adult bird population is estimated by doubling the active nest estimate (VanDeValk et al. 2002). The counts were completed by two or three observers walking parallel transects along the edge of the Island’s plateau (Figure 7). The counting method was developed after a preliminary survey was completed to determine manpower and time requirements needed to canvas the entire Island. Nest counting was facilitated by the lack of vegetation and concentration of nests along the rim of the island’s plateau. DCC and AWP did not nest in the interior of the Island. Nest surveys were completed on May 20, May 30, and June 5. Chicks began leaving their nests by June 12, which prohibited further counts.
Daily consumption, time, and predator abundance were used to estimate total bird consumption of fish from Blackfoot Reservoir. Consumption requirements for DCC and AWP were taken from the literature. Daily consumption was 0.45 kg per day for DCC (VanDeValk et al. 2002) and 1.10 kg per day for AWP (Shmueli et al. 2000). Because this was a preliminary study, we did not monitor bird abundance through fall migration. Therefore, we used the nesting period as a surrogate for bird feeding days. Nesting for AWP and DCC lasts about 90 days (May-July). Bird feeding days and daily consumption estimates were total consumption of fish by the adult bird population was estimated using the following formula:
Total Consumption = Daily consumption (kg) X 90 feeding days X Adult bird abundance
Diet analysis was completed by examining regurgitations made by adult and juvenile birds. During the first few weeks post-hatch, adult bird regurgitations were prevalent in and around nests. As chicks developed, regurgitations were sampled directly from the chicks. Chicks would frequently regurgitate if approached by an observer that was counting active nests. The regurgitated fish were generally very easy to identify to species. Total lengths were measured from a sample of regurgitated fish.
RESULTS
Mean active nest counts were 410 for DCC and 648 for AWP. The associated adult bird population estimates were 829 for DCC and 1,296 for AWP. Using the daily consumption requirements and a 90 day nesting period, we estimated that total fish consumption was about 34 metric tons for DCC and 128 metric tons for AWP.
Utah chub dominated (>90%) the diet of AMP and DCC. A total of 77 bird regurgitations were analyzed. Diet proportions and total fish consumption are shown in Table 5. On June 5 we measure lengths of fish from the regurgitated fish. Mean lengths of prey items were 234 mm (n=58) for Utah chub and 58 mm (n=13) for Utah sucker Catostomus ardens. Only one Yellowstone cutthroat trout (494 mm) and one carp (490 mm) were measured.
19
Gull Island
Figure 7 Aerial view of Gull Island. Total surface area is 2.1 ha.

20
Table 5. Bird population parameters, prey selection, and consumption estimates for DCC and
AWP in Blackfoot Reservoir.
Category Double Crested Cormorants American White Pelicans Mean active nests 410 648 Adult abundance 820 1,296 Nesting days 90 90 Bird feeding days 73,800 116,640 Daily consumption (kg) 0.456 1.100 Prey by occurrence (%)
Utah Chub 91.2 90.7 Utah sucker 5.9 2.3 Common carp 0.0 4.7 Sculpin 2.9 0.0 Cutthroat trout 0.0 2.3
Prey Consumption (kg) Utah Chub 30,683 116,369 Utah sucker 1,980 2,984 Common carp 0 5,968 Sculpin 990 0 Cutthroat trout 0 2,984
Total 33,653 128,304
DISCUSSION
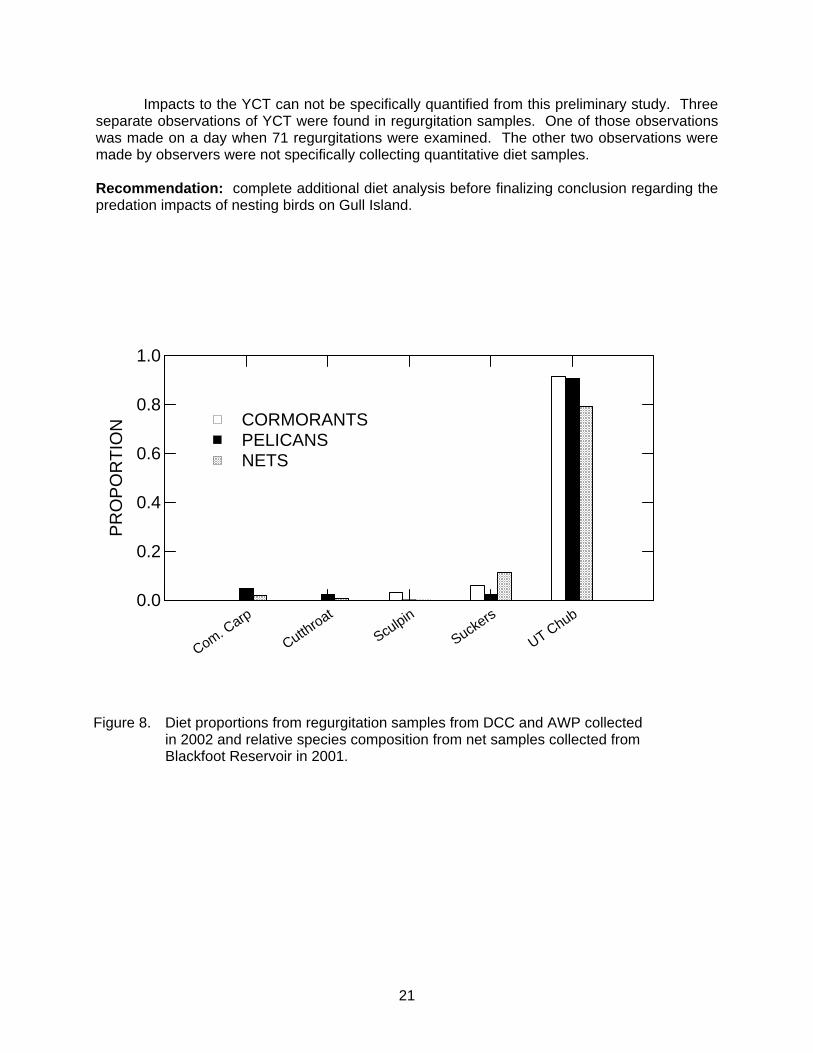
The goal of this pilot study was to determine if bird predation is a significant source of mortality for hatchery rainbow trout and naturally produced YCT. The diet analysis indicated that both species of nesting birds preferred Utah chub. Utah chub are one of the most abundant fish species in the reservoir. Recent relative species composition analysis showed that Utah chubs made up 79% of the relative species composition from gillnet samples. The comparison of relative species composition and bird diet is shown in Figure 8. The similarity between relative fish abundance and bird diet analysis indicate nonselective foraging behavior by birds during the nesting cycle in 2002.
Reduced rainbow trout stocking in 2002 may have underestimated the usual impact of bird predation on fingerling survival. No fingerling rainbow trout were stocked in the reservoir in 2002. In a normal year, 500,000 or more spring released fingerling rainbow trout are stocked in the reservoir. Those fish are very susceptible to avian predation. In the past, volunteers have been used to harass birds feeding on recently stocked fingerling rainbow trout. In 2003, monitoring diet just prior to and after fingerling released will help quantify the immediate predation loss of fingerlings. Unlike fingerling releases, a total of 18,000 catchable rainbow trout were stocked during the nesting period. No catchable rainbow trout were observed in the diet.
21
Impacts to the YCT can not be specifically quantified from this preliminary study. Three separate observations of YCT were found in regurgitation samples. One of those observations was made on a day when 71 regurgitations were examined. The other two observations were made by observers were not specifically collecting quantitative diet samples.
Recommendation: complete additional diet analysis before finalizing conclusion regarding the predation impacts of nesting birds on Gull Island.
Figure 8. Diet proportions from regurgitation samples from DCC and AWP collected in 2002 and relative species composition from net samples collected from Blackfoot Reservoir in 2001.
Com. Carp
Cutthroat
Sculpin
Suckers
UT Chub0.0
0.2
0.4
0.6
0.8
1.0
PR
OP
OR
TIO
N
NETSPELICANSCORMORANTS

22
SNAKE RIVER CREEL AND WHITE STURGEON SUREY
INTRODUCTION
In 2002, several fisheries investigations were completed on the Snake River below American Falls Dam. The work included a season-long creel survey and preliminary efforts to sample white sturgeon Acipenser transmontanus. The creel survey was completed to evaluate angling effort on smallmouth bass, trout, and white sturgeon. The white sturgeon sampling was an effort to monitor the hatchery stocking program that began in 1988.
The Snake River between American Falls Dam and Eagle Rock is a very popular angler destination. It receives a relatively large amount of fishing pressure from boat anglers spread out along its length and intense pressure from bank anglers in selected spots. Traditionally, fishing pressure has been greatest on the opening weekend and for the first two weeks of the season. Fishing pressure declined dramatically after that. The decline in pressure resulted in a perceived drop in catch rates of “big” (>406 mm) fish by anglers. At the request of many anglers in the region, more restrictive regulations were imposed on this stretch of the Snake River. Regulations changed from the general regulation limit of six trout to a six trout with a maximum of two trout greater than 406 mm. Catch and release sturgeon fishing appears be increasing in popularity.
METHODS Creel Survey
We conducted a creel survey in the Snake River, approximately 28 km, from American Falls Dam downriver, approximately 28 km, to the confluence of Lanes Creek and the Snake River. A three-kilometer section of the reach was not accessible due to non-navigable rapids. The survey began Memorial Day weekend and continued through October 2002, which is the entire fishing season for most of this river reach.
We completed an intense creel survey on opening day. Since 1997, opening day creel surveys have been completed at the two major boat launches (Dam and Neely). Anglers were asked where they were from, how many hours they had fished, how many fish were released, and method of fishing. All harvested fish were measured for length and weight. We attempted to determine if any change had occurred in the harvest of trout during the opening weekend since 1997, which could be attributable to the creel limit change.
The season-long creel survey was conducted from May 27 through October31, 2002. A jet boat was used to survey major access points that include the boat launch areas near the American Falls Dam, Neely, and Massacre Rocks. The confluence of Lanes Creek with the Snake River is the furthest point downriver of Massacre Rocks that was included in the survey. In late summer, boat transportation was limited by dense algal mats and restricted the amount of river accessible to anglers or creel clerks.

23
Angler counts and interviews were completed on one weekday and one weekend day per week. Sample days and times were randomly selected. We counted bank and boat anglers at least once each survey day. The counts were conducted either in the morning (AM) or afternoon (PM). Anglers were asked the number of hours they had fished, number of fish caught, and method of fishing. All fish harvested were measured to the nearest millimeter. Analysis of creel survey data was done using C-SAP (Creel Survey Analysis Program) developed by the Colorado Division of Wildlife-Aquatic Research. Since our opening day sampling effort was different from the standard survey day (we contacted every angler throughout the entire day) we did not enter it into the program. The statistics from the opening day were later added to the numbers generated for the entire season White Sturgeon Sampling
White sturgeon were introduced in the Snake River below American Falls Dam in 1988. The stocking program was initiated to diversify angling opportunity in the tailwater fishery. Since the initial release, white sturgeon have been stocked on several other occasions. The first effort to assess the success of the stocking program was initiated in 2002. Sampling and data collection methods were similar to monitoring programs downstream of Shoshone Falls. Set lines were fished for approximately 30 minute periods. The set lines were baited with trout mortalities from the Grace Fish Hatchery. Set lines were about 10 meters long with six bait hooks evenly distributed along the line. Both ends of the set lines were anchored with chains. Float lines were attached to both ends of the set line. Sets were checked at 30 min intervals. Most of the set lines were fished within 500 m of the dam. Lines were set on March 17, 19 and 22, 2002. The last sampling day, four set lines were placed near the Neely boat launch. White sturgeon caught were measured for total length, fork length, and girth, and weighed. Fish were scanned for PIT tags. Fish without PIT tags were tagged on the right side of the dorsal fin. Except for the weight estimate, measurements were taken while the fish were submerged under water but restrained using a gurney.
RESULTS Creel Survey
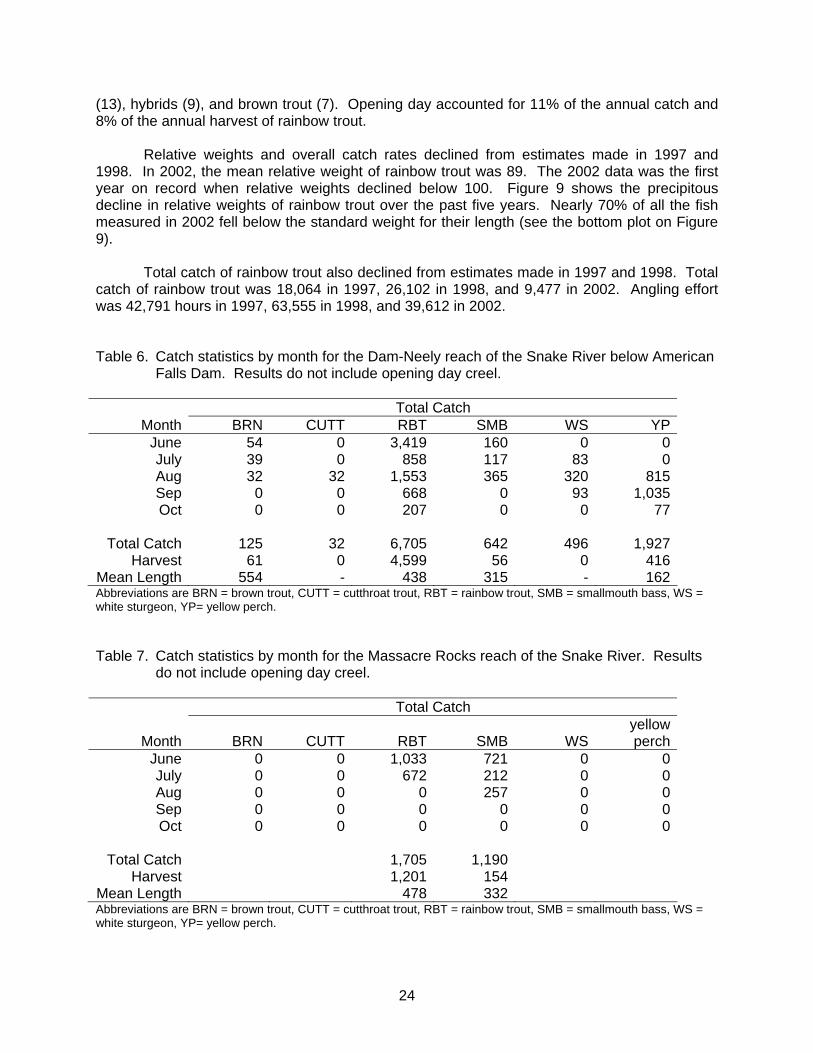
For the Dam-Neely reach, a total of 7,949 anglers fished an estimated 32,570 hours. Catch of all species combined was 9,946. Anglers harvested about 52% of their catch. Catch rate was 0.31 fish per angler hour. Table 6 shows catch results partitioned by species.
In the Massacre Rocks reach, a total of 2,721 anglers fished an estimated 5,195 hours. Catch of all species combined was 2,895 fish. Anglers harvested about 47% of their catch. Catch rate was 0.56 fish per angler hour. Table 7 shows catch results partitioned by species for the Massacre Rocks reach.
Catch on opening day at the Dam and Neely boat launches was a combined 1,111 fish. Rainbow trout dominated (96%) the catch. On opening day, anglers harvest about 50% of what they caught. Other fish recorded in the creel included smallmouth bass (16), cutthroat trout
24
(13), hybrids (9), and brown trout (7). Opening day accounted for 11% of the annual catch and 8% of the annual harvest of rainbow trout.
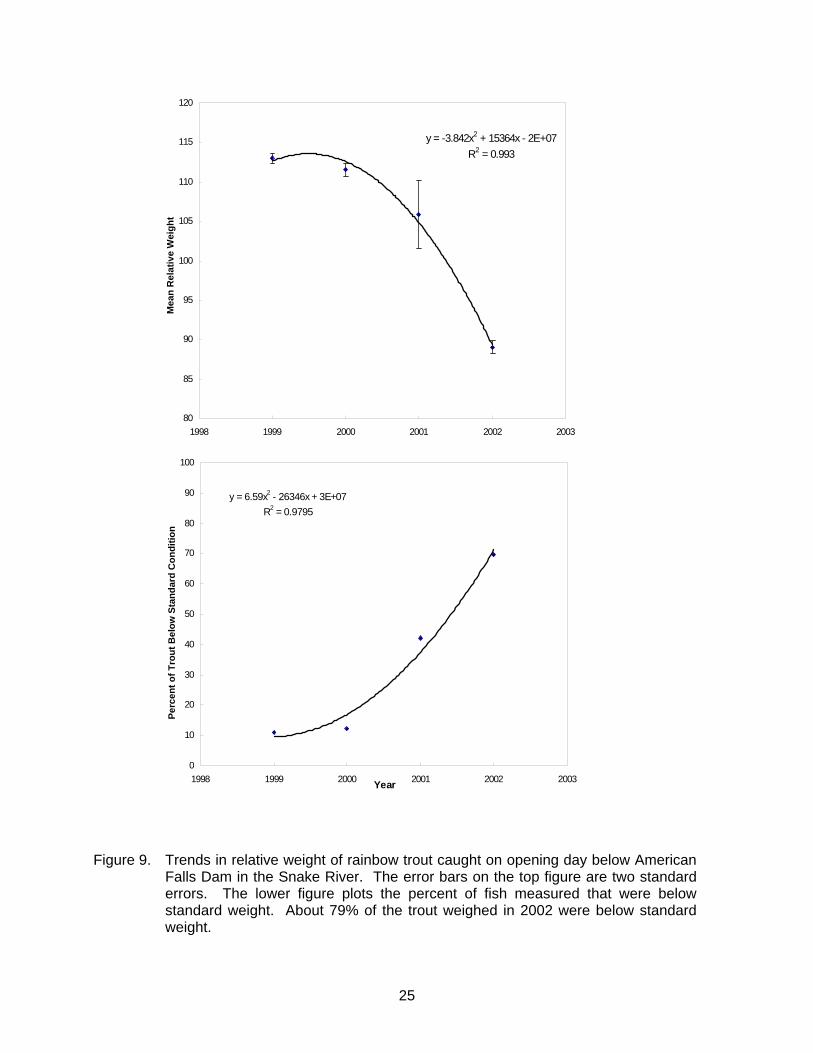
Relative weights and overall catch rates declined from estimates made in 1997 and 1998. In 2002, the mean relative weight of rainbow trout was 89. The 2002 data was the first year on record when relative weights declined below 100. Figure 9 shows the precipitous decline in relative weights of rainbow trout over the past five years. Nearly 70% of all the fish measured in 2002 fell below the standard weight for their length (see the bottom plot on Figure 9).
Total catch of rainbow trout also declined from estimates made in 1997 and 1998. Total catch of rainbow trout was 18,064 in 1997, 26,102 in 1998, and 9,477 in 2002. Angling effort was 42,791 hours in 1997, 63,555 in 1998, and 39,612 in 2002. Table 6. Catch statistics by month for the Dam-Neely reach of the Snake River below American
Falls Dam. Results do not include opening day creel.
Total Catch Month BRN CUTT RBT SMB WS YP
June 54 0 3,419 160 0 0July 39 0 858 117 83 0Aug 32 32 1,553 365 320 815Sep 0 0 668 0 93 1,035Oct 0 0 207 0 0 77
Total Catch 125 32 6,705 642 496 1,927
Harvest 61 0 4,599 56 0 416Mean Length 554 - 438 315 - 162Abbreviations are BRN = brown trout, CUTT = cutthroat trout, RBT = rainbow trout, SMB = smallmouth bass, WS = white sturgeon, YP= yellow perch. Table 7. Catch statistics by month for the Massacre Rocks reach of the Snake River. Results
do not include opening day creel.
Total Catch
Month BRN CUTT RBT SMB WS yellow perch
June 0 0 1,033 721 0 0July 0 0 672 212 0 0Aug 0 0 0 257 0 0Sep 0 0 0 0 0 0Oct 0 0 0 0 0 0
Total Catch 1,705 1,190
Harvest 1,201 154 Mean Length 478 332 Abbreviations are BRN = brown trout, CUTT = cutthroat trout, RBT = rainbow trout, SMB = smallmouth bass, WS = white sturgeon, YP= yellow perch.
25
y = -3.842x2 + 15364x - 2E+07R2 = 0.993
80
85
90
95
100
105
110
115
120
1998 1999 2000 2001 2002 2003
Mea
n R
elat
ive
Wei
ght
y = 6.59x2 - 26346x + 3E+07R2 = 0.9795
0
10
20
30
40
50
60
70
80
90
100
1998 1999 2000 2001 2002 2003Year
Perc
ent o
f Tro
ut B
elow
Sta
ndar
d C
ondi
tion
Figure 9. Trends in relative weight of rainbow trout caught on opening day below American Falls Dam in the Snake River. The error bars on the top figure are two standard errors. The lower figure plots the percent of fish measured that were below standard weight. About 79% of the trout weighed in 2002 were below standard weight.
26
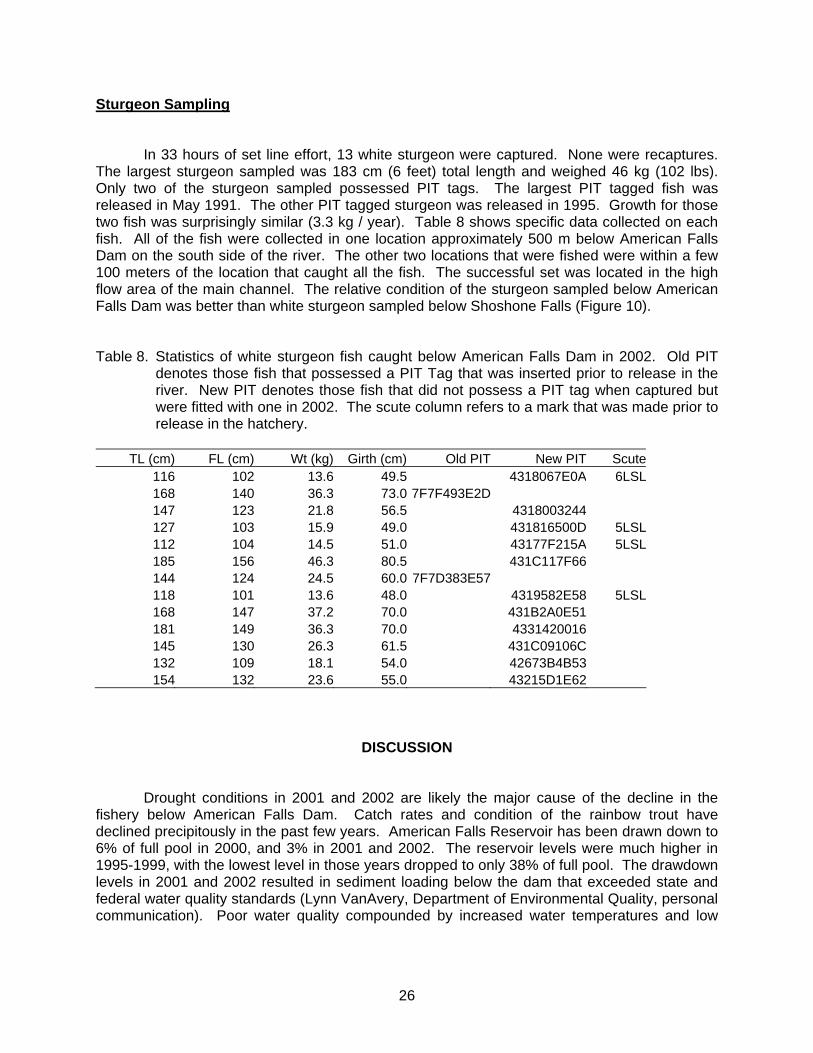
Sturgeon Sampling
In 33 hours of set line effort, 13 white sturgeon were captured. None were recaptures. The largest sturgeon sampled was 183 cm (6 feet) total length and weighed 46 kg (102 lbs). Only two of the sturgeon sampled possessed PIT tags. The largest PIT tagged fish was released in May 1991. The other PIT tagged sturgeon was released in 1995. Growth for those two fish was surprisingly similar (3.3 kg / year). Table 8 shows specific data collected on each fish. All of the fish were collected in one location approximately 500 m below American Falls Dam on the south side of the river. The other two locations that were fished were within a few 100 meters of the location that caught all the fish. The successful set was located in the high flow area of the main channel. The relative condition of the sturgeon sampled below American Falls Dam was better than white sturgeon sampled below Shoshone Falls (Figure 10). Table 8. Statistics of white sturgeon fish caught below American Falls Dam in 2002. Old PIT
denotes those fish that possessed a PIT Tag that was inserted prior to release in the river. New PIT denotes those fish that did not possess a PIT tag when captured but were fitted with one in 2002. The scute column refers to a mark that was made prior to release in the hatchery.
TL (cm) FL (cm) Wt (kg) Girth (cm) Old PIT New PIT Scute
116 102 13.6 49.5 4318067E0A 6LSL168 140 36.3 73.0 7F7F493E2D147 123 21.8 56.5 4318003244127 103 15.9 49.0 431816500D 5LSL112 104 14.5 51.0 43177F215A 5LSL185 156 46.3 80.5 431C117F66144 124 24.5 60.0 7F7D383E57118 101 13.6 48.0 4319582E58 5LSL168 147 37.2 70.0 431B2A0E51181 149 36.3 70.0 4331420016145 130 26.3 61.5 431C09106C132 109 18.1 54.0 42673B4B53154 132 23.6 55.0 43215D1E62
DISCUSSION
Drought conditions in 2001 and 2002 are likely the major cause of the decline in the fishery below American Falls Dam. Catch rates and condition of the rainbow trout have declined precipitously in the past few years. American Falls Reservoir has been drawn down to 6% of full pool in 2000, and 3% in 2001 and 2002. The reservoir levels were much higher in 1995-1999, with the lowest level in those years dropped to only 38% of full pool. The drawdown levels in 2001 and 2002 resulted in sediment loading below the dam that exceeded state and federal water quality standards (Lynn VanAvery, Department of Environmental Quality, personal communication). Poor water quality compounded by increased water temperatures and low

27
dissolved oxygen concentrations may have all contributed to the sharp decline in angling success below American Falls Dam.
Since 1990, 403 white sturgeon have been released in the Snake River below American Falls Dam. Stocking events were 100 in 1990, 103 in 1991, and 100 in 1997 and 1998. In 2002, the estimated catch of white sturgeon below American Falls Dam was 496 (SE = 176). It follows that many of the sturgeon are being caught several times during a fishing season and the very low stocking densities can support angling effort at its current levels. Most of the catch occurred in August when experienced anglers were landing several fish a day. If the popularity of this fishery continues to grow, a limiting factor will likely be space. Most of the fishing occurs in a short section of the river just below the dam. The concentration of angling occurs in the same location where all the set line sturgeon were sampled. The stocking program created a popular and unique angling experience in southeast Idaho.
Recommendation: Continue monitoring the abundance of sturgeon below American Falls Dam. The monitoring will be used to determine an appropriate stocking strategy.

28
0 100 200 300Total Length (mm)
0
100
200
300W
eigh
t (l b
s)
Figure 10. Length-weight plot for white sturgeon sampled below Shoshone Falls in the Snake River (x symbols) and above Shoshone Falls near American Falls Dam (large filled circles).

29
YELLOWSTONE CUTTHROAT TROUT MONITORING AND RAINBOW TROUT REMOVAL IN THE BLACKFOOT RIVER
INTRODUCTION AND METHODS
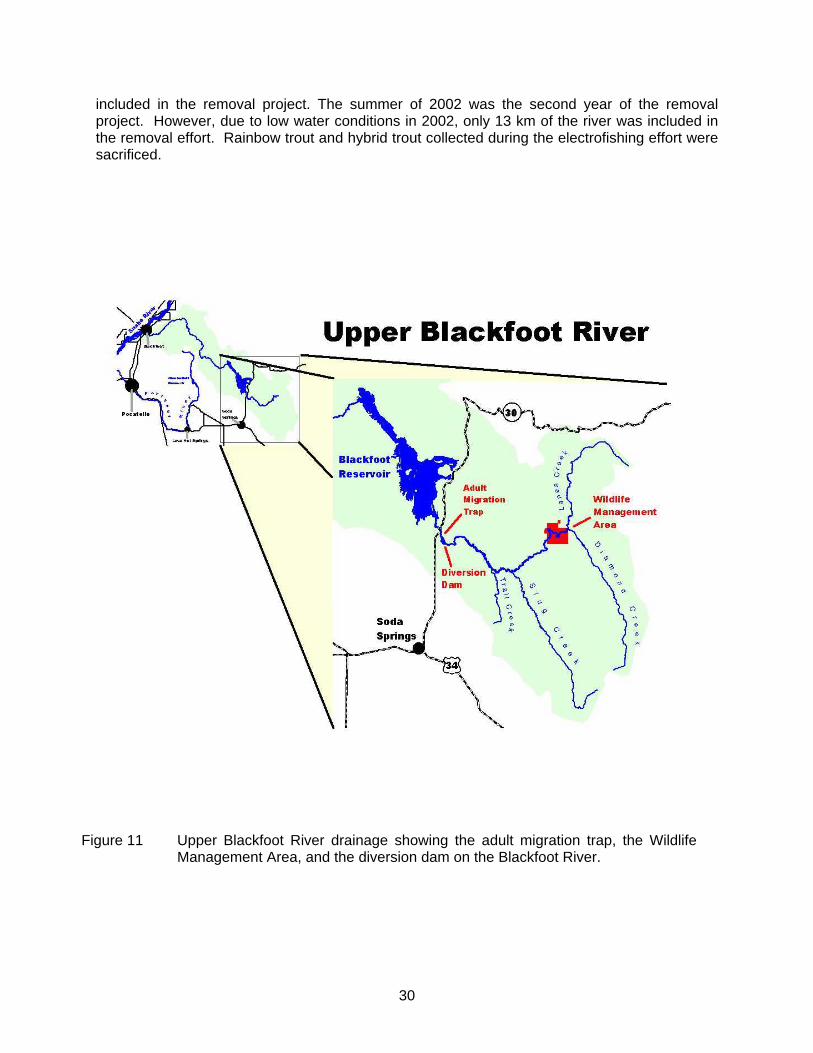
The Blackfoot River drainage is located in central Caribou County, Idaho (Figure 11). The upper Blackfoot River begins at the confluence of Lanes and Diamond creeks approximately 60 km above Blackfoot Reservoir. Primary tributaries to the Blackfoot River include Lanes, Diamond, Sheep, Angus, Timothy, Spring, Slug and Trail creeks. Blackfoot Reservoir was constructed in 1909. The construction completely blocked migration of Yellowstone cutthroat trout. The upriver population, however, quickly adjusted to the reservoir conditions by developing a successful adfluvial life strategy (Schill and LaBolle 1990). The Blackfoot River and its tributaries provide spawning and juvenile rearing habitat. At age-1, most of the cutthroat trout migrate downstream to the reservoir where they spend two to three years before returning to the river to spawn (Thurow 1981). Typical spawning size of the adfluvial form ranges between 400 and 600 mm total length.
In 2002, we operated the adult migration trap from April through June. The location of the trap is shown in Figure 11. The purpose for operating the adult migration trap is twofold: 1) enumerate the adult spawning population, and 2) remove rainbow trout from the migrant population to reduce the potential threat of hybridization. We identified adult migrants as cutthroat, rainbow, or rainbow X cutthroat trout hybrids. A rating system was used to partition fish by species. The rating system was: 1 = rainbow trout 2 = more rainbow trout looking but has cutthroat slash markings 3 = many characteristics of both rainbow and cutthroat 4 = more cutthroat trout looking but may have head spots 5 = cutthroat trout with no head spots
This classification was used to help develop a rating system for trap operators. A subsample of the migrating fish had fin clips removed for genetic analysis. On the day that genetic samples were collected, fish were randomly pulled from the trap, given a rating from 1-5, and fin-clipped for genetics work. If the rating criteria and the genetics samples demonstrate good agreement, then the rating criteria will be employed for sorting fish at the trap. The genetic samples were not completed in time for inclusion in this report. During the 2002 trapping season, all fish with rating of 3 or less were removed from the river.
In 2001, a rainbow trout removal project was initiated on the upper Blackfoot River. The objective of the program was to minimize genetic introgression between Yellowstone cutthroat trout and hatchery rainbow trout stocked in the reservoir. There were two methods used to minimize introgression. First, hatchery stocking in the reservoir was converted to sterile fish in 1999. Secondly, in 2001, we began a rainbow and hybrid trout removal project by collecting fish with boat electrofishing from the Blackfoot River. We sampled most of the upper Blackfoot River (about 60 km) between the confluence of Diamond and Lanes creeks downstream to the adult migration trap (Figure 11). A 6 km section of river within the Hunsaker property was not
30
included in the removal project. The summer of 2002 was the second year of the removal project. However, due to low water conditions in 2002, only 13 km of the river was included in the removal effort. Rainbow trout and hybrid trout collected during the electrofishing effort were sacrificed.
Figure 11 Upper Blackfoot River drainage showing the adult migration trap, the Wildlife Management Area, and the diversion dam on the Blackfoot River.
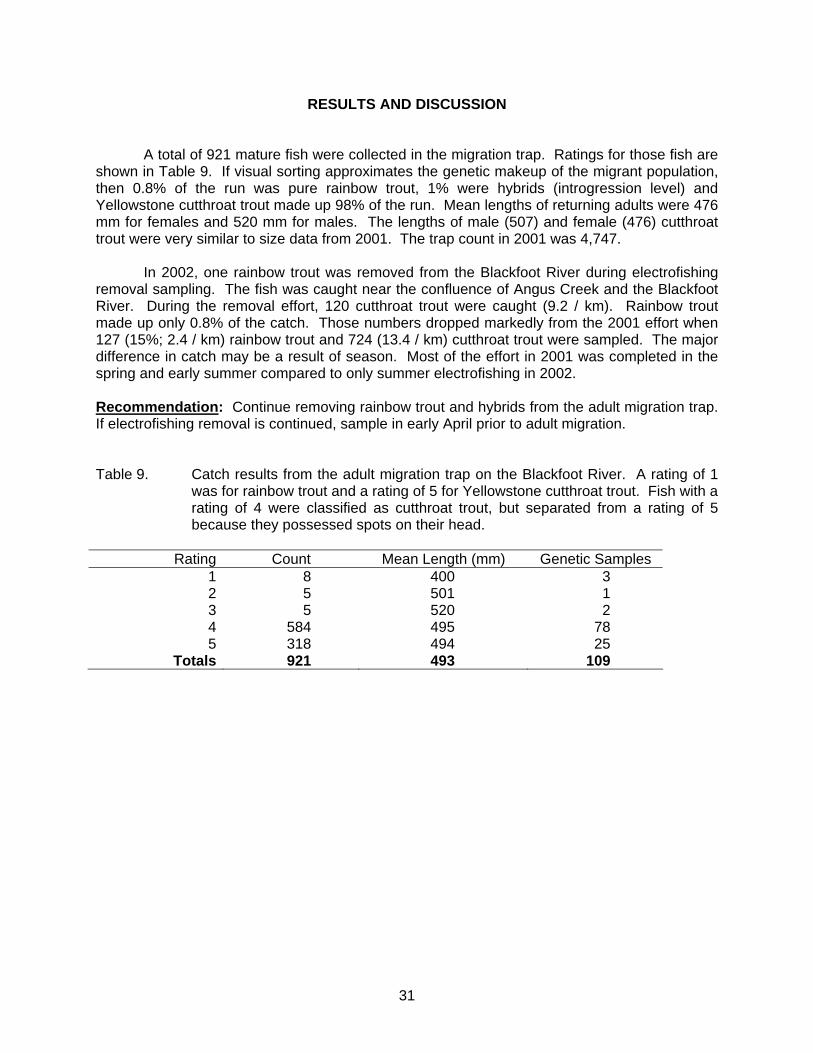
31
RESULTS AND DISCUSSION
A total of 921 mature fish were collected in the migration trap. Ratings for those fish are shown in Table 9. If visual sorting approximates the genetic makeup of the migrant population, then 0.8% of the run was pure rainbow trout, 1% were hybrids (introgression level) and Yellowstone cutthroat trout made up 98% of the run. Mean lengths of returning adults were 476 mm for females and 520 mm for males. The lengths of male (507) and female (476) cutthroat trout were very similar to size data from 2001. The trap count in 2001 was 4,747.
In 2002, one rainbow trout was removed from the Blackfoot River during electrofishing removal sampling. The fish was caught near the confluence of Angus Creek and the Blackfoot River. During the removal effort, 120 cutthroat trout were caught (9.2 / km). Rainbow trout made up only 0.8% of the catch. Those numbers dropped markedly from the 2001 effort when 127 (15%; 2.4 / km) rainbow trout and 724 (13.4 / km) cutthroat trout were sampled. The major difference in catch may be a result of season. Most of the effort in 2001 was completed in the spring and early summer compared to only summer electrofishing in 2002.
Recommendation: Continue removing rainbow trout and hybrids from the adult migration trap. If electrofishing removal is continued, sample in early April prior to adult migration. Table 9. Catch results from the adult migration trap on the Blackfoot River. A rating of 1
was for rainbow trout and a rating of 5 for Yellowstone cutthroat trout. Fish with a rating of 4 were classified as cutthroat trout, but separated from a rating of 5 because they possessed spots on their head.
Rating Count Mean Length (mm) Genetic Samples
1 8 400 3 2 5 501 1 3 5 520 2 4 584 495 78 5 318 494 25
Totals 921 493 109

32
BONNEVILLE CUTTHROAT TROUT MONITORING IN THE THOMAS FORK TRIBUTARIES
INTRODUCTION AND METHODS
Wallace (1978) and Behnke (1979) determined that essentially pure Bonneville cutthroat trout Oncorhynchus clarkii utah populations inhabited the Thomas Fork of the Bear River and its tributaries (Preuss, Dry, and Giraffe creeks). In 1994, due to increased concern over the status of this sensitive species, a Conservation Agreement for the protection and enhancement of the Bonneville cutthroat trout was developed for the Thomas Fork tributaries on Forest Service land. In addition, cattle exclosures were constructed on selected reaches of each stream.
Department personnel have monitored fry (< 75 mm) and parr (> 75 mm) densities of
cutthroat trout in the Thomas Fork tributaries since 1979. In recent years, sampling has been done in alternate years using backpack-shocking units. Sampling was done in measured stream sections using either the Seber two-pass removal technique or the Peterson mark and recapture technique (Everhart et al 1975). Each site was randomly chosen with different strata on each creek, and each site was approximately 100 meters long. Measurements of length, width, depth, habitat, and riparian condition were made for each site.
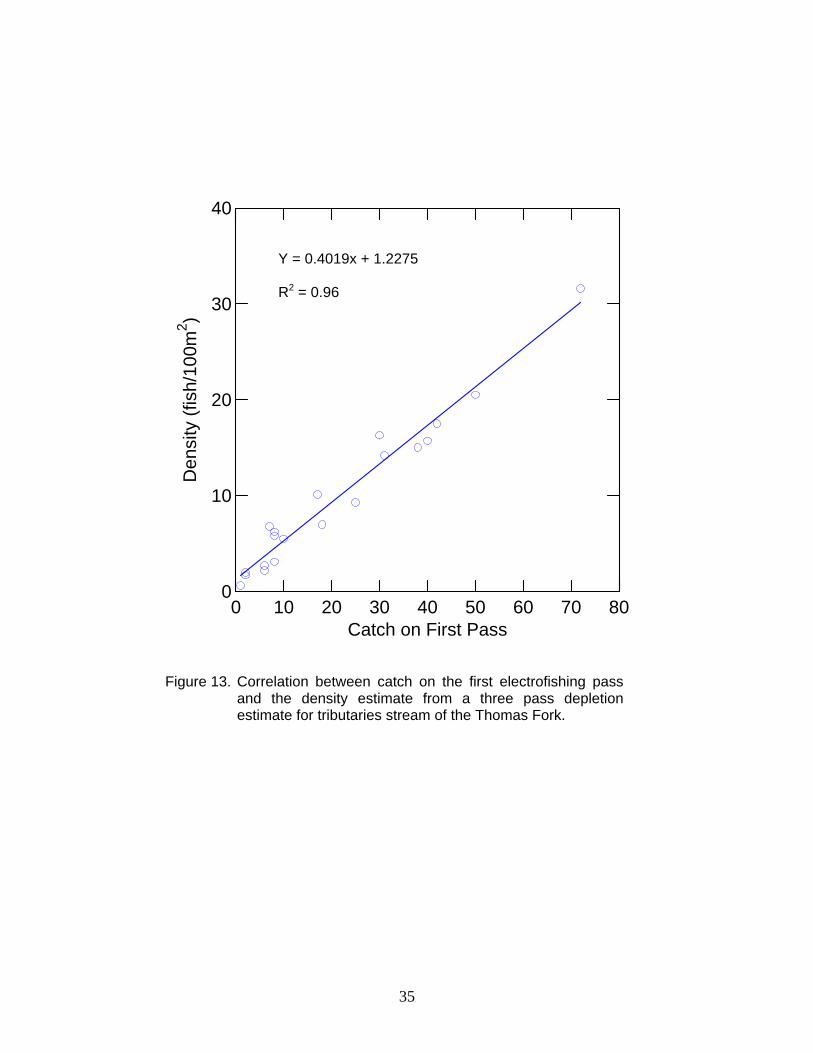
In 2002 we monitored Bonneville cutthroat trout in the Thomas Fork drainage as required by the 1994 Conservation Agreement. We sampled six sites on Preuss Creek, four sites on Giraffe Creek, and four sites on Dry Creek (Figure 12). In addition to estimating cutthroat trout densities, past data were pooled to correlate density estimate with first pass catch data. The regression analyses were completed to determine if single pass effort could be used to monitor population trends. Converting to single pass effort would reduce the time and costs associated with sampling and reduce injuries to sampled fish.
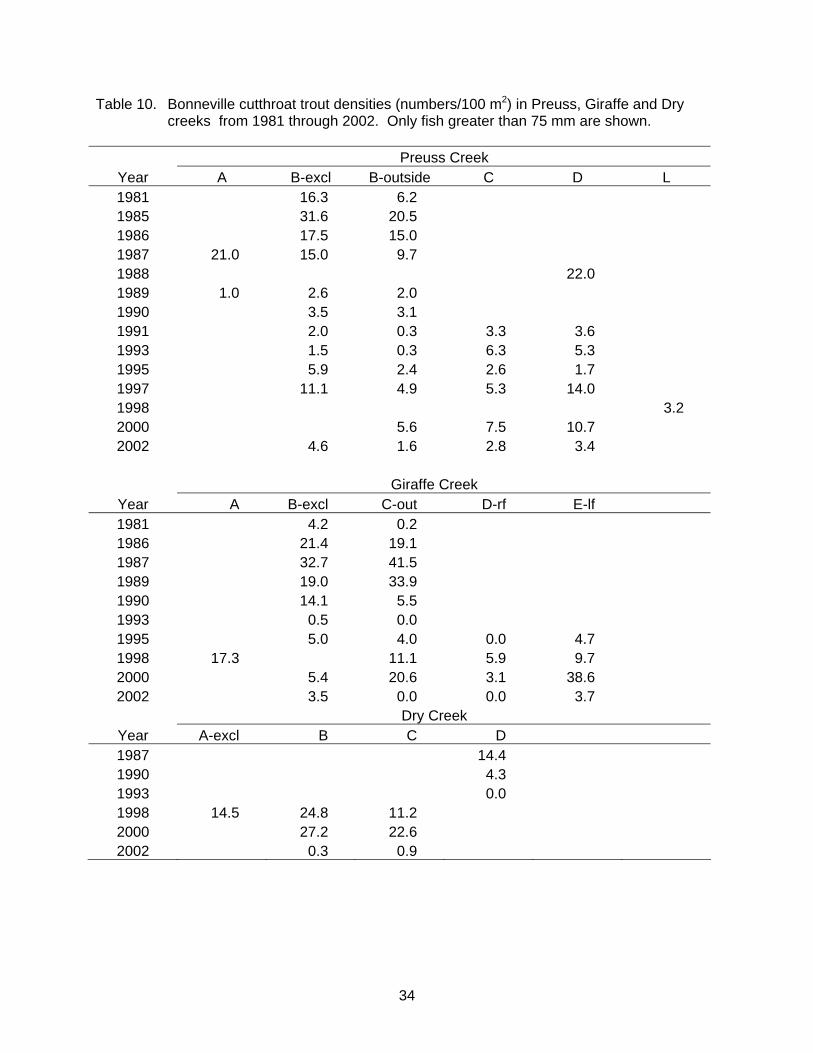
RESULTS AND DISCUSSION
Bonneville cutthroat trout densities declined in all three creeks surveyed. The decline was greatest in Dry Creek. The mean densities dropped from 25 to 0.6 fish / 100m2 in Dry Creek. The relative decline was similar in Giraffe Creek. During the same two-year period cutthroat trout densities declined from a mean of 17 to 2 fish / 100m2. The trend was not as great in Preuss Creek where mean densities dropped from 8 to 3 fish / 100m2 (Table 10). The relationship between first pass catch and fish / 100m2 was significant (Figure 13).
Recommendation: Continue monitoring cutthroat trout densities in accordance with the conservation agreement. Use a single pass technique to monitor trends in all three tributaries.

33
Figure 12. Map of the Thomas Fork Tributaries.
34
Table 10. Bonneville cutthroat trout densities (numbers/100 m2) in Preuss, Giraffe and Dry creeks from 1981 through 2002. Only fish greater than 75 mm are shown.
Preuss Creek
Year A B-excl B-outside C D L 1981 16.3 6.2 1985 31.6 20.5 1986 17.5 15.0 1987 21.0 15.0 9.7 1988 22.0 1989 1.0 2.6 2.0 1990 3.5 3.1 1991 2.0 0.3 3.3 3.6 1993 1.5 0.3 6.3 5.3 1995 5.9 2.4 2.6 1.7 1997 11.1 4.9 5.3 14.0 1998 3.2 2000 5.6 7.5 10.7 2002 4.6 1.6 2.8 3.4
Giraffe Creek
Year A B-excl C-out D-rf E-lf 1981 4.2 0.2 1986 21.4 19.1 1987 32.7 41.5 1989 19.0 33.9 1990 14.1 5.5 1993 0.5 0.0 1995 5.0 4.0 0.0 4.7 1998 17.3 11.1 5.9 9.7 2000 5.4 20.6 3.1 38.6 2002 3.5 0.0 0.0 3.7
Dry Creek Year A-excl B C D 1987 14.4 1990 4.3 1993 0.0 1998 14.5 24.8 11.2 2000 27.2 22.6 2002 0.3 0.9
35
0 10 20 30 40 50 60 70 80Catch on First Pass
0
10
20
30
40D
ensi
ty ( f
ish/
1 00m
2 )
Y = 0.4019x + 1.2275 R2 = 0.96
Figure 13. Correlation between catch on the first electrofishing pass and the density estimate from a three pass depletion estimate for tributaries stream of the Thomas Fork.

36
ACKNOWLEDGMENTS
Brian O’Hearn, Kevin Yelton, and Chad Rawlins were instrumental in the data collection for all of the projects completed in 2002. Eric Crawford and Paul Alexander helped collect largemouth bass samples from St. Johns Reservoir.
37
LITURATURE CITED Beamesderfer, R. C. P. and J. A. North. 1995. Growth, natural mortality, and predicted
response to fishing for largemouth bass and smallmouth bass populations in North America. North American Journal of Fisheries Management 15:688-704.
Behnke, R. J. 1979. Native cutthroat trout of Wyoming Part IV evaluation of 1978 collections. Colorado State University, Department of Fisheries and Wildlife. Fort Collins.
Derby, C.R. and J.R. Lavvorn. 1997. Comparison of pellets versus collected birds for sampling
diets of Double-crested cormorants. The Condor 99:549-553. Elrod, H. J. 1997. Survival of Hatchery-reared lake trout stocked near and off shore in Lake
Ontario. North American Journal of Fisheries Management 17:779-783. Everhart, W. A., A. W. Eipper and W. D. Young. 1975. Principles of Fishery Science. Cornell
University Press. Ithaca, New York. Johnson, J.H., R.M. Ross, and J. Farquhar. 2001. The effects of egg oiling on fish
consumption by double-crested cormorants on Little Galloo Island, Lake Ontario in 2000. NYSDEC special report.
Lantry, B.F., T.H. Eckert, and C.O. Schneider. 1999. The relationship between the abundance
of smallmouth bass and double-crested cormorants in the eastern basin of Lake Ontario in New York State Department of Environmental Conservation Special Report. Albany, NY.
McCauley, R. W. and D. M. Kilgour. 1990. Effect of air temperature on growth of largemouth
bass in North America. Transactions of the American Fisheries Society 119:276-281. Modde T. and A. F. Wasawicz, and D.K. Hepworth. 1996. Cormorant and grebe predation on
rainbow trout stocked in a southern Utah Reservoir. North American Journal of Fisheries Management 16:388-394.
Ross, R. M. and J. H. Johnson 1999. Fish losses to double-crested cormorant predation in
eastern Lake Ontario, 1992-97. Pg.61-72 in (M. E. Tobin, Tech. Coord.) Symposium on double-crested cormorants: Population status and management issues in the Midwest. 9 December 1997., Milwaukee, WI. Tech. Bull. 1879. Washington, D.C.: U.S. Department of Agriculture, Animal and Plant Health Inspection Service.
Schill, D. J. and L. D. LaBolle. 1990. Regional fisheries management investigations. Idaho
Department of Fish and Game, 1988 Job Performance Report, Project F-71-R-13, Boise. Schiavone, A. 2001. Double-crested cormorant predation on smallmouth bass and other fishes
of the Eastern Basin of Lake Ontario. NYSDEC special report. Shmueli, M., I. Izhaki, A. Arieli, and Z. Arad. 2000. Energy requirements of migrating Great
White Pelicans Pelecanus onocrotalus. Ibis 142:208-216.

38
Teuscher, D. 2001. Lake and reservoir research. Idaho Department of Fish and Game, 2001 Job Performance Report, Project F-73-R-23, Boise.
Teuscher, D. 2002. Regional Fishery Management Investigations. Idaho Department of Fish
and Game, 2001 Job Performance Report, Project F-71-R-26, Boise. Thurow, R. 1981. Blackfoot River and fisheries investigations. Idaho Department of Fish and
Game, Job Completion Report. F-73-R-3, Boise, ID. VanDeValk J. A., C.M. Adams, L. G. Rudstam, J.L. Forney, T.E. Brooking, M.A. Greken, B.P.
Young, and J.T. Hooper. 2002. Comparison of angler and cormorant harvest of walleye and yellow perch in Oneida Lake, New York. Transaction of the American Fisheries 131:27-39.
Wallace, R.L. 1978. Report on purity of Bonneville cutthroat trout, Salmo clarki utah, from
upper Giraffe Creek, Bear River drainage, Idaho. Project completion report to Caribou National Forest. 5pp.
Wires, L. R., F.J. Cuthbert, D.R. Trexel and A. R. Joshi. 2001. Status of the double-crested
cormorant Phalacrocorax auritus in North America. Final Report to USFWS.

39
Submitted by: Approved by: David Teuscher Regional Fishery Biologist ___________________________________ Steve Yundt State Fisheries Manager Richard Scully Regional Fishery Manager