ictsi sec form q2 2020 - singapore exchange
TRANSCRIPT

ICTSI Form 17-Q Q2 2020
1 4 7 2 1 2
SEC Registration Number
I N T E R N A T I O N A L C O N T A I N E R T E R M I N A L
S E R V I C E S , I N C . A N D S U B S I D I A R I E S
(Company’s Full Name)
I C T S I A D M I N I S T R A T I O N B U I L D I N G , M A
N I L A I N T E R N A T I O N A L C O N T A I N E R T E R M
I I N A L S O U T H A C C E S S R O A D , M A N I L A
A
(Business Address: No. Street City/Town/Province)
Jose Joel M. Sebastian 8245-4101 (Contact Person) (Company Telephone Number)
1 2 3 1 S E C 17 Q 0 4 Every 3rd Thursday
Month Day (Form Type) Month Day (Fiscal Year) (Annual Meeting)
N/A
(Secondary License Type, If Applicable)
N/A
Dept. Requiring this Doc. Amended Articles Number/Section
Total Amount of Borrowings
1,363
as at June 30, 2020
US$323.3M
US$1,446.1M
Total No. of Stockholders Domestic Foreign
To be accomplished by SEC Personnel concerned
File Number LCU
Document ID Cashier
S T A M P S
Remarks: Please use BLACK ink for scanning purposes.
COVER SHEET

ICTSI Form 17-Q Q2 2020
SECURITIES AND EXCHANGE COMMISSION
SEC FORM 17-Q
QUARTERLY REPORT PURSUANT TO SECTION 17 OF THE
SECURITIES REGULATION CODE AND SRC RULE 17(2)(b) THEREUNDER
1. For the quarterly period ended June 30, 2020
2. Commission identification number: 147212
3. BIR Tax Identification No. 000-323-228
1. Exact name of issuer as specified in its charter:
INTERNATIONAL CONTAINER TERMINAL SERVICES, INC.
5. Province, Country or other jurisdiction of incorporation or organization: Philippines
6. Industry Classification Code: ___________________ (SEC Use Only)
7. Address of issuer’s principal office: ICTSI Administration Building, Manila International
Container Terminal, South Access Road, Manila Postal Code: 1012 8. Registrant's telephone number, including area code: (632) 8245-4101
9. Former name, former address, and former fiscal year: Not applicable
10. Securities registered pursuant to Sections 8 and 12 of the Code, or Sections 4 and 8 of the RSA.
Title of Each Class Number of shares outstanding
as at June 30, 2020
Common
2,002,391,699 Shares
11. Are any or all of the Securities listed on a Stock Exchange?
Yes [x] No [ ]
If yes, state the name of such Stock Exchange and the class/es of securities listed therein:
Philippine Stock Exchange Common shares
12. Indicate by check mark whether the issuer:
a) has filed all reports required to be filed by Section 17 of the Code and SRC Rule 17 thereunder or
Sections 11 of the RSA and RSA Rule 11(a)-1 thereunder, and Sections 26 and 141 of The Corporation
Code of the Philippines during the preceding 12 months (or for such shorter period that the registrant
was required to file such reports).
Yes [x] No [ ]
(b) has been subject to such filing for the past 90 days. Yes [x] No [ ]
ICTSI Form 17-Q Q2 2020
TABLE OF CONTENTS
PART 1 – FINANCIAL INFORMATION ........................................................................................ 1
Item 1. Financial Statements ............................................................................................... 1
Audited Consolidated Balance Sheet as at December 31, 2019, and
Unaudited Interim Consolidated Balance Sheet as at June 30, 2020 ....................... 3
Unaudited Interim Consolidated Statements of Income for the
Three and Six Months Ended June 30, 2019 and 2020 ........................................... 4
Unaudited Interim Consolidated Statements of Comprehensive Income for the
Three and Six Months Ended June 30, 2019 and 2020 ........................................... 5
Unaudited Interim Consolidated Statements of Changes in Equity for the
Six Months Ended June 30, 2019 and 2020 ............................................................ 6
Unaudited Interim Consolidated Statements of Cash Flows for the
Six Months Ended June 30, 2019 and 2020 ............................................................ 8
Notes to Unaudited Interim Condensed Consolidated Financial Statements ....................... 9
Item 2. Management’s Discussion and Analysis or Plan of Operations ............................ 40
PART II – OTHER INFORMATION ............................................................................................. 68
ANNEX 1 – Schedule of Aging of Receivables .............................................................................. 69
ANNEX 2 – Financial Soundness Indicators ................................................................................. 70
ANNEX 3 – Map of Subsidiaries ................................................................................................... 71
SIGNATURES ................................................................................................................................ 72

ICTSI Form 17-Q Q2 2020 1
PART 1 – FINANCIAL INFORMATION
Item 1. Financial Statements
The audited consolidated balance sheet as at December 31, 2019, and the unaudited interim
condensed consolidated financial statements as at June 30, 2020 and for the three and six months
ended June 30, 2019 and 2020 and the related notes to unaudited interim condensed consolidated
financial statements of International Container Terminal Services, Inc. and Subsidiaries (collectively
referred to as “the Group”) are filed as part of this Form 17-Q on pages 2 to 39.
Operating segments are also reported in the notes to unaudited interim condensed consolidated
financial statements.
There are no other material events subsequent to the end of this interim period that have not been
reflected in the unaudited interim condensed consolidated financial statements filed as part of this
report.

ICTSI Form 17-Q Q2 2020 2
International Container Terminal Services, Inc.
and Subsidiaries
Unaudited Interim Condensed Consolidated Financial Statements As at June 30, 2020
(with Comparative Figures as at December 31, 2019)
and for the Three and Six Months Ended June 30, 2019 and 2020

ICTSI Form 17-Q Q2 2020 3
INTERNATIONAL CONTAINER TERMINAL SERVICES, INC.
AND SUBSIDIARIES
UNAUDITED INTERIM CONDENSED CONSOLIDATED BALANCE SHEETS As at June 30, 2020
(With Comparative Figures as at December 31, 2019) (In Thousands)
December 31, 2019
(Audited)
June 30, 2020
(Unaudited)
ASSETS
Noncurrent Assets
Intangibles (Note 5) US$2,170,511 US$2,090,439
Property and equipment (Note 6) 1,419,359 1,312,978
Right-of-use assets (Note 7) 575,598 544,353
Investment properties 7,165 7,040
Investments in and advances to joint ventures and an associate
(Notes 9 and 17) 443,218 440,521
Deferred tax assets 321,375 296,967
Other noncurrent assets (Notes 8 and 20) 345,257 365,651
Total Noncurrent Assets 5,282,483 5,057,949
Current Assets
Cash and cash equivalents (Note 10) 234,834 296,770
Receivables (Note 11) 124,400 117,250
Spare parts and supplies 37,065 37,677
Prepaid expenses and other current assets (Note 12) 72,074 69,164
Derivative assets (Note 20) 21 249
Total Current Assets 468,394 521,110
US$5,750,877 US$5,579,059
EQUITY AND LIABILITIES
Equity Attributable to Equity Holders of the Parent
Capital stock:
Preferred stock US$236 US$236
Common stock 67,330 67,330
Additional paid-in capital (Note 16) 549,380 547,988
Cost of common shares held by subsidiaries (Note 16) (74,262) (79,845)
Treasury shares (Note 16) (83,013) (79,632)
Excess of consideration over the carrying value of non-controlling interests
acquired or disposed (146,648) (147,925)
Retained earnings (Note 16) 300,952 256,117
Perpetual capital securities (Note 16) 1,018,514 1,018,514
Other comprehensive loss - net (Notes 16 and 20) (162,581) (265,665)
Total equity attributable to equity holders of the parent 1,469,908 1,317,118
Equity Attributable to Non-controlling Interests (Notes 1 and 16) 164,618 167,228
Total Equity 1,634,526 1,484,346
Noncurrent Liabilities
Long-term debt - net of current portion (Notes 13 and 20) 1,427,513 1,721,772
Concession rights payable - net of current portion (Notes 5 and 20) 651,657 622,551
Lease liabilities - net of current portion (Notes 7 and 20) 1,169,717 1,088,490
Deferred tax liabilities 164,250 148,492
Other noncurrent liabilities (Note 14) 48,126 64,736
Total Noncurrent Liabilities 3,461,263 3,646,041
Current Liabilities
Accounts payable and other current liabilities (Notes 15 and 17) 347,600 320,188
Current portion of long-term debt (Notes 13 and 20) 235,116 47,577
Current portion of concession rights payable (Notes 5 and 20) 9,084 9,979
Current portion of lease liabilities (Notes 7 and 20) 19,458 19,649
Income tax payable 39,292 42,392
Derivative liabilities (Note 20) 4,538 8,887
Total Current Liabilities 655,088 448,672
Total Liabilities 4,116,351 4,094,713
US$5,750,877 US$5,579,059
See accompanying Notes to Unaudited Interim Condensed Consolidated Financial Statements.

ICTSI Form 17-Q Q2 2020 4
INTERNATIONAL CONTAINER TERMINAL SERVICES, INC.
AND SUBSIDIARIES
UNAUDITED INTERIM CONDENSED CONSOLIDATED STATEMENTS OF
INCOME (In Thousands, Except Per Share Data)
For the Three Months Ended June 30 For the Six Months Ended June 30
2019 2020 2019 2020
INCOME
Gross revenues from port operations US$368,001 US$348,485 US$751,785 US$724,261
Foreign exchange gain (Note 3) 1,319 307 2,881 2,459
Interest income (Notes 10 and 17) 6,999 4,710 13,101 9,447
Other income (Note 14) 4,712 3,105 7,195 6,226
381,031 356,607 774,962 742,393
EXPENSES
Port authorities’ share in gross revenues
(Notes 5, 7 and 17) 46,130 40,474 95,343 85,057
Manpower costs (Notes 16 and 17) 59,519 57,747 116,831 119,215
Equipment and facilities-related expenses
(Note 17) 27,934 21,684 54,891 49,769
Depreciation and amortization (Note 7) 57,833 55,280 115,225 111,010
Administrative and other operating expenses
(Note 17) 32,562 24,362 60,321 53,850
Interest expense and financing charges on
borrowings (Notes 5, 6 and 13) 27,976 25,460 53,739 51,971
Interest expense on concession rights payable
(Note 5) 9,986 12,844 19,995 25,927
Interest expense on lease liabilities (Note 7) 25,859 22,510 51,786 47,181
Equity in net loss of joint ventures and an
associate (Note 9) 6,266 4,165 12,398 9,680
Foreign exchange loss (Note 3) 516 1,476 2,081 6,909
Other expenses 3,325 9,036 5,884 15,706
297,906 275,038 588,494 576,275
CONSTRUCTION REVENUE
(EXPENSE)
Construction revenue 41,039 9,781 79,487 46,039
Construction expense (41,039) (9,781) (79,487) (46,039)
– – – –
INCOME BEFORE INCOME TAX 83,125 81,569 186,468 166,118
PROVISION FOR (BENEFIT FROM)
INCOME TAX
Current 20,786 17,578 44,634 31,766
Deferred (2,226) 1,519 (4,236) 3,042
18,560 19,097 40,398 34,808
NET INCOME US$64,565 US$62,472 US$146,070 US$131,310
Attributable To
Equity holders of the parent US$56,067 US$53,782 US$128,470 US$113,379
Non-controlling interests 8,498 8,690 17,600 17,931
US$64,565 US$62,472 US$146,070 US$131,310
Earnings Per Share (Note 18)
Basic US$0.020 US$0.020 US$0.048 US$0.043
Diluted 0.020 0.020 0.048 0.043
See accompanying Notes to Unaudited Interim Condensed Consolidated Financial Statements.

ICTSI Form 17-Q Q2 2020 5
INTERNATIONAL CONTAINER TERMINAL SERVICES, INC.
AND SUBSIDIARIES
UNAUDITED INTERIM CONDENSED CONSOLIDATED STATEMENTS OF
COMPREHENSIVE INCOME (In Thousands)
For the Three Months Ended June 30 For the Six Months Ended June 30
2019 2020 2019 2020
NET INCOME FOR THE PERIOD US$64,565 US$62,472 US$146,070 US$131,310
OTHER COMPREHENSIVE INCOME (LOSS)
Items to be reclassified to profit or loss in
subsequent periods
Exchange differences on translation of foreign
operations’ financial
statements (Notes 3 and 16) (309) 8,156 5,647 (80,320)
Net change in unrealized mark-to-market values of
derivatives (Notes 16 and 20) (14,968) (3,821) (19,409) (25,004)
Net unrealized mark-to-market gain on financial
assets at FVOCI (Note 16) (5,928) – (66) –
Share in other comprehensive gain of joint
ventures (Note 16) 2,773 2,331 2,713 2,093
Income tax relating to components of other
comprehensive income
(Notes 16 and 20) 4,460 (7,211) 5,363 (2,290)
(13,972) (545) (5,752) (105,521)
Items not to be reclassified to profit or loss in
subsequent periods
Share in other comprehensive loss of joint ventures
(Note 16) – (350) – (350)
Actuarial losses on defined benefit plans - net of
tax (Note 16) – (26) (113) (358)
(13,972) (921) (5,865) (106,229)
TOTAL COMPREHENSIVE INCOME FOR
THE PERIOD US$50,593 US$61,551 US$140,205 US$25,081
Attributable To
Equity holders of the parent US$45,853 US$51,991 US$124,083 US$10,295
Non-controlling interests 4,740 9,560 16,122 14,786
US$50,593 US$61,551 US$140,205 US$25,081
See accompanying Notes to Unaudited Interim Condensed Consolidated Financial Statements.

SEC Form 17-Q Q2 2020 6 6 6 6
INTERNATIONAL CONTAINER TERMINAL SERVICES, INC.
AND SUBSIDIARIES
UNAUDITED INTERIM CONDENSED CONSOLIDATED STATEMENTS OF CHANGES IN EQUITY FOR THE SIX MONTHS ENDED JUNE 30, 2019 and 2020
(In Thousands)
Attributable to Equity Holders of the Parent
Preferred
Stock Common
Stock
Additional
Paid-in
Capital (Note 16)
Preferred
Shares Held
by a
Subsidiary (Note 16)
Common
Shares Held
by a
Subsidiary (Note 16)
Treasury
Shares (Note 16)
Excess of
Consideration over
the Carrying
Value
of Non-
controlling
Interests
acquired or
disposed (Note 16)
Retained
Earnings (Note 16)
Perpetual
Capital
Securities (Note 16)
Other
Compre-
hensive
Loss - net
(Notes 16 and 20) Total
Non-controlling
Interests
(Notes 1 and 16)
Total Equity
Balance at December 31, 2018 US$236 US$67,330 US$549,382 (US$72,492) (US$1,769) (US$58,112) (US$142,555) US$400,099 US$1,153,615 (US$155,505) US$1,740,229 US$165,504 US$1,905,733
Total comprehensive income for the
period – – – – – – – 128,470 – (4,387) 124,083 16,122 140,205
Share-based payments (Note 16) – – 3,299 – – – – – – – 3,299 – 3,299
Issuance of treasury shares – – (4,366) – – 4,366 – – – – – – –
Cash dividends (Note 16) – – – – – – – (194,228) – – (194,228) (15,073) (209,301)
Acquisition of non-controlling
interests (Note 16) – – – – – – (471) – – – (471) (7,529) (8,000) Redemption of perpetual capital
securities (Note 16) – – – – – – – (4,584) (135,102) – (139,686) – (139,686)
Distributions on perpetual capital
securities (Note 16) – – – – – – – (32,539) – – (32,539) – (32,539)
Balance at June 30, 2019 US$236 US$67,330 US$548,315 (US$72,492) (US$1,769) (US$53,746) (US$143,026) US$297,218 US$1,018,513 (US$159,892) US$1,500,687 US$159,024 US$1,659,711

SEC Form 17-Q Q2 2020 7 7 7 7
Attributable to Equity Holders of the Parent
Preferred
Stock
Common
Stock
Additional
Paid-in
Capital
(Note 16)
Preferred
Shares Held
by a
Subsidiary
(Note 16)
Common
Shares Held
by a
Subsidiary
(Note 16)
Treasury
Shares
(Note 16)
Excess of
Consideration
over
the Carrying
Value
of Non-
controlling
Interests
acquired or
disposed
(Note 16)
Retained
Earnings
(Note 16)
Perpetual
Capital
Securities
(Note 16)
Other
Compre-
hensive
Loss - net
(Notes 16 and
20) Total
Non-
controlling
Interests
(Notes 1 and
16)
Total
Equity
Balance at December 31, 2019 US$236 US$67,330 US$549,380 (US$72,493) (US$1,769) (US$83,013) (US$146,648) US$300,952 US$1,018,514 (US$162,581) US$1,469,908 US$164,618 US$1,634,526
Total comprehensive income for the
period – – – – – – – 113,379 – (103,084) 10,295 14,786 25,081
Share-based payments (Note 16) – – 1,989 – – – – – – – 1,989 – 1,989
Issuance of treasury shares – – (3,381) – – 3,381 – – – – – – –
Cash dividends (Note 16) – – – – – – – (130,040) – – (130,040) (19,717) (149,757)
Transfer of shares to NCI in SPICTL (Note 16) – – – – – – (1,277) – – – (1,277) 7,541 6,264
Acquisition of ICTSI shares by a
subsidiary (Note 16) – – – – (5,583) – – – – – (5,583) – (5,583)
Distributions on perpetual capital
securities (Note 16) – – – – – – – (28,174) – – (28,174) – (28,174)
Balance at June 30, 2020 US$236 US$67,330 US$547,988 (US$72,493) (US$7,352) (US$79,632) (US$147,925) US$256,117 US$1,018,514 (US$265,665) US$1,317,118 US$167,228 US$1,484,346
See accompanying Notes to Unaudited Interim Condensed Consolidated Financial Statements.
ICTSI Form 17-Q Q2 2020 8
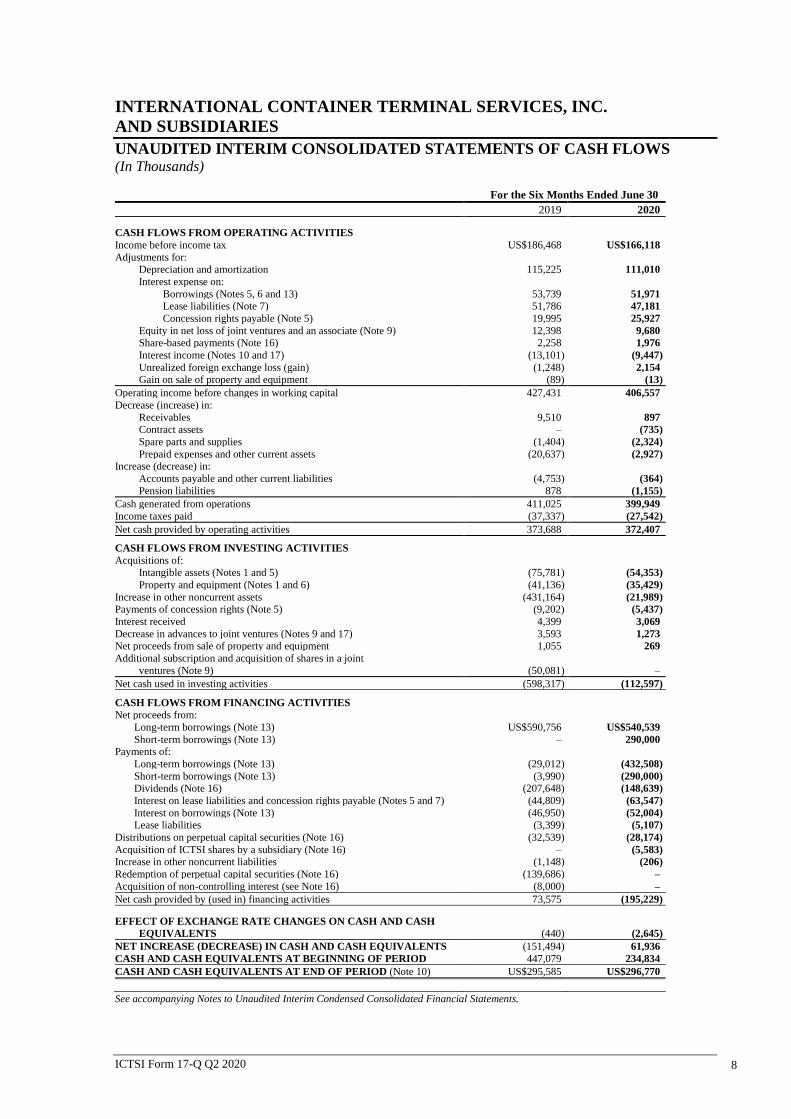
INTERNATIONAL CONTAINER TERMINAL SERVICES, INC.
AND SUBSIDIARIES
UNAUDITED INTERIM CONSOLIDATED STATEMENTS OF CASH FLOWS (In Thousands)
For the Six Months Ended June 30
2019 2020
CASH FLOWS FROM OPERATING ACTIVITIES
Income before income tax US$186,468 US$166,118
Adjustments for:
Depreciation and amortization 115,225 111,010
Interest expense on:
Borrowings (Notes 5, 6 and 13) 53,739 51,971
Lease liabilities (Note 7) 51,786 47,181
Concession rights payable (Note 5) 19,995 25,927
Equity in net loss of joint ventures and an associate (Note 9) 12,398 9,680
Share-based payments (Note 16) 2,258 1,976
Interest income (Notes 10 and 17) (13,101) (9,447)
Unrealized foreign exchange loss (gain) (1,248) 2,154
Gain on sale of property and equipment (89) (13)
Operating income before changes in working capital 427,431 406,557
Decrease (increase) in:
Receivables 9,510 897
Contract assets – (735)
Spare parts and supplies (1,404) (2,324)
Prepaid expenses and other current assets (20,637) (2,927)
Increase (decrease) in:
Accounts payable and other current liabilities (4,753) (364)
Pension liabilities 878 (1,155)
Cash generated from operations 411,025 399,949
Income taxes paid (37,337) (27,542)
Net cash provided by operating activities 373,688 372,407
CASH FLOWS FROM INVESTING ACTIVITIES
Acquisitions of:
Intangible assets (Notes 1 and 5) (75,781) (54,353)
Property and equipment (Notes 1 and 6) (41,136) (35,429)
Increase in other noncurrent assets (431,164) (21,989)
Payments of concession rights (Note 5) (9,202) (5,437)
Interest received 4,399 3,069
Decrease in advances to joint ventures (Notes 9 and 17) 3,593 1,273
Net proceeds from sale of property and equipment 1,055 269
Additional subscription and acquisition of shares in a joint
ventures (Note 9) (50,081) –
Net cash used in investing activities (598,317) (112,597)
CASH FLOWS FROM FINANCING ACTIVITIES
Net proceeds from:
Long-term borrowings (Note 13) US$590,756 US$540,539
Short-term borrowings (Note 13) – 290,000
Payments of:
Long-term borrowings (Note 13) (29,012) (432,508)
Short-term borrowings (Note 13) (3,990) (290,000)
Dividends (Note 16) (207,648) (148,639)
Interest on lease liabilities and concession rights payable (Notes 5 and 7) (44,809) (63,547)
Interest on borrowings (Note 13) (46,950) (52,004)
Lease liabilities (3,399) (5,107)
Distributions on perpetual capital securities (Note 16) (32,539) (28,174)
Acquisition of ICTSI shares by a subsidiary (Note 16) – (5,583)
Increase in other noncurrent liabilities (1,148) (206)
Redemption of perpetual capital securities (Note 16) (139,686) –
Acquisition of non-controlling interest (see Note 16) (8,000) –
Net cash provided by (used in) financing activities 73,575 (195,229)
EFFECT OF EXCHANGE RATE CHANGES ON CASH AND CASH
EQUIVALENTS (440) (2,645)
NET INCREASE (DECREASE) IN CASH AND CASH EQUIVALENTS (151,494) 61,936
CASH AND CASH EQUIVALENTS AT BEGINNING OF PERIOD 447,079 234,834
CASH AND CASH EQUIVALENTS AT END OF PERIOD (Note 10) US$295,585 US$296,770
See accompanying Notes to Unaudited Interim Condensed Consolidated Financial Statements.

SEC Form 17-Q Q2 2020 9
INTERNATIONAL CONTAINER TERMINAL SERVICES, INC.
AND SUBSIDIARIES
NOTES TO UNAUDITED INTERIM CONDENSED CONSOLIDATED FINANCIAL
STATEMENTS
1. Corporate Information
1.1 General
International Container Terminal Services, Inc. (ICTSI or the Parent Company) was
incorporated in the Philippines and registered with the Philippine Securities and Exchange
Commission (SEC) on December 24, 1987. The registered office address of the Company is
ICTSI Administration Building, MICT South Access Road, Manila. ICTSI’s common shares
were listed with the Philippine Stock Exchange (PSE) on March 23, 1992 at an offer price of
P=6.70. ICTSI has 2,002,391,699 common shares outstanding held by 1,363 shareholders on
record as at June 30, 2020.
1.2 Port Operations
ICTSI and subsidiaries (collectively referred to as “the Group”) entered into various concessions
of port operations which include development, management, and operation of container
terminals and related facilities around the world. As at August 4, 2020, the Group is involved in
32 terminal concessions and port development projects in 19 countries worldwide. There are ten
terminal operations, including an inland container terminal, a barge terminal, and combined
terminal operations in Subic in the Philippines, two each in Indonesia, Papua New Guinea
(PNG) and Brazil, one each in China, Ecuador, Poland, Georgia, Madagascar, Croatia, Pakistan,
Mexico, Honduras, Iraq, Argentina, Colombia, Democratic Republic (DR) of Congo, and
Australia; an existing concession to construct, develop and operate a port in Tuxpan, Mexico,
and a recently signed concession to develop, operate and maintain the multipurpose terminal in
Kribi, Cameroon.
Concessions for port operations entered into, acquired and terminated by ICTSI and subsidiaries
for the last two years are summarized below:
Umm Qasr, Iraq. ICTSI, through its wholly-owned subsidiary, ICTSI (M.E.) DMCC [formerly
ICTSI (M.E.) JLT] (ICTSI Dubai), and General Company for Ports of Iraq (GCPI) signed on
April 10, 2014 the Contract for the Construction and Operation of Three New Quays and
Management and Operation of Quay No. 20 (“Contract”) in the Port of Umm Qasr (“Port”) in
Iraq. The Contract grants ICTSI the rights to: (a) manage and operate the existing container
facility at Berth 20 of the Port for 10 years, (b) build in three phases, under a build-operate-
transfer (BOT) scheme, a new container and general cargo terminal in the Port for a concession
period of 26 years, and (c) provide container and general cargo terminal services in both
components. On March 1, 2016, an addendum to the Contract (“First Addendum”) was signed
by the parties granting ICTSI, through ICTSI Dubai, the right to manage and operate an
additional existing Quay No. 19 for a total of 13 years, with the first three years for the
completion of rehabilitation works. Also, the First Addendum extended the original term for the
management and operation of Quay No. 20 from 10 to 13 years. On March 26, 2017, a second
addendum to the Contract (“Second Addendum”) was signed by the parties granting ICTSI,
through ICTSI Dubai, the right to manage and operate Quay No. 21 co-terminus with the
Contract and the First Addendum. The Second Addendum extended the term for the
management and operation of Quay No. 19 and 20 from 13 to 21 years.

SEC Form 17-Q Q2 2020 10
ICTSI commenced trial operations at Berth 20 in September 2014 and full-fledged commercial
operations in November 2014. ICTSI commenced commercial operations of Berth 19 in
June 2016. Berth 21 started operations in the third quarter of 2018 while the rehabilitation
works are expected to be completed in the first quarter of 2021.
Phase 1 of the expansion project (Berth 27) under the BOT scheme has 250 meters of berth with
an estimated capacity of 300,000 TEUs. The facility will have 600 meters of quay with an
estimated capacity of 900,000 TEUs. Berth 27 was completed and fully operational in the first
quarter of 2017.
On October 22, 2017, ICTSI signed an agreement with GCPI for the Phase 2 of the expansion
development of the Port. The Phase 2 expansion project was substantially completed and fully
operational in the fourth quarter of 2019 and involved the development of two new berths,
Berths 25 and 26, including a 10.2-hectare yard area and installation of three new quay cranes.
An additional yard area of 0.9 hectares was further completed in January 2020. This expansion
increased the Port’s container handling capacity to 1,200,000 TEUs or by an additional 600,000
TEUs, and its capability to handle large container vessels of up to 10,000 TEUs.
Tuxpan, Mexico. On May 27, 2015, ICTSI, through its subsidiary, ICTSI Tuxpan B.V., acquired
from Grupo TMM S.A.B and Immobiliaria TMM S.A. de C.V 100% of the capital stock of
Terminal Maritima de Tuxpan, S.A de C.V (TMT) for US$54.5 million. TMT is a company
duly incorporated in accordance with the laws of Mexico with a concession to construct and
operate a maritime container terminal in the Port of Tuxpan, Mexico, and is the owner of the real
estate where the maritime container terminal will be constructed. The concession agreement is
valid until May 25, 2021, subject to extension for another 20 years. The concession covers an
area of 29,109.68 square meters, which is adjacent to the 43 hectares of land owned by TMT.
As of August 4, 2020, management is currently working on a development plan on TMT.
Davao, Philippines. On April 21, 2006, the Philippine Ports Authority (PPA) granted Davao
Integrated Port and Stevedoring Services Corporation (DIPSSCOR) a ten-year contract for cargo
handling services at Sasa Wharf, Port of Davao in the Philippines that expired on April 20, 2016.
Thereafter, the PPA granted DIPSSCOR a series of hold-over authority (HOA) on a temporary
basis over the cargo handling services at Sasa Wharf, Port of Davao. On May 8, 2019, the PPA
granted to DIPSSCOR the HOA to operate arrastre, stevedoring, and related cargo handling
services which was valid from February 27, 2019 until December 31, 2019. Pursuant to the PPA
Memorandum Circular No. 15-2020 dated April 7, 2020, “Guidelines in the Processing of PPA
Permits During the Enhanced Community Quarantine (ECQ) Due to COVID-19 Pandemic”, all
HOAs to operate cargo handling services that expired/are expiring during the ECQ period are
deemed extended until June 30, 2020, unless extended by the PPA. On June 30, 2020, the PPA
issued Memorandum Circular No. 23-2020, “Extension of Validity of PPA Approvals/Permits
During the Enhanced Community Quarantine (ECQ), Modified ECQ (MECQ), and General CQ
(GCQ) Due to COVID-19 Pandemic ”, in view of the extension of the community quarantine
with an intention to extend all HOAs to operate cargo handling services that expired/are expiring
during the ECQ/MECQ/GCQ periods until July 31, 2020.
South Cotabato, Philippines. On February 20, 2006, the PPA granted South Cotabato Integrated
Port Services, Inc. (SCIPSI) a ten-year contract for the exclusive management and operation of
arrastre, stevedoring, and other cargo handling services, except porterage, at Makar Wharf, Port
of General Santos, General Santos City in the Philippines that expired on February 19, 2016.
Thereafter, the PPA granted SCIPSI a series of HOA on a temporary basis over the cargo
handling services at Makar Wharf, Port of General Santos. On December 3, 2019, the PPA
granted to SCIPSI the HOA to operate arrastre, stevedoring, and related cargo handling services
which was valid from February 25, 2019 until December 31, 2019. Pursuant to the PPA
Memorandum Circular No. 15-2020 dated April 7, 2020, “Guidelines in the Processing of PPA
Permits During the Enhanced Community Quarantine (ECQ) Due to COVID-19 Pandemic”, all
HOAs to operate cargo handling services that expired/are expiring during the ECQ period are

SEC Form 17-Q Q2 2020 11
deemed extended until June 30, 2020, unless extended by the PPA. On June 30, 2020, the PPA
issued Memorandum Circular No. 23-2020, “Extension of Validity of PPA Approvals/Permits
During the Enhanced Community Quarantine (ECQ), Modified ECQ (MECQ), and General CQ
(GCQ) Due to COVID-19 Pandemic ”, in view of the extension of the community quarantine
with an intention to extend all HOAs to operate cargo handling services that expired/are expiring
during the ECQ/MECQ/GCQ periods until July 31, 2020.
Cavite Gateway Terminal, Philippines. On April 21, 2017, ICTSI, through its wholly-owned
subsidiary, Cavite Gateway Terminal (CGT), in partnership with the Philippine Department of
Transportation, project launched the country’s first container roll-on roll-off barge terminal in
Tanza, Cavite. CGT will facilitate off-the-roads seaborne transport of containers between Port
of Manila and Cavite and service industrial locators in the Cavite area. CGT’s barge terminal
will have an annual capacity of 115,000 TEUs, which is equivalent to 140,000 fewer truck trips
on city roads each year. CGT formally commenced commercial operations in November 2018.
Motukea and Lae, Papua New Guinea. In September 2017, ICTSI received a notification from
PNG Ports Corporation Limited (PNGPCL), a PNG state-owned enterprise, of the confirmation
by the Independent Consumer and Competition Commission in PNG with respect to the two 25-
year agreements signed by ICTSI’s PNG subsidiaries, Motukea International Terminal Limited
(MITL), and South Pacific International Container Terminal Limited (SPICTL), with PNGPCL
for the operation, management and development of the two international ports in Motukea and
Lae in PNG. SPICTL and MITL were allowed by PNGPCL to take over the port facilities and
begin operations at the Port of Lae in February 2018 and at the Port of Motukea in May 2018,
respectively. The terminal operating agreements and other related contracts took effect on
June 1, 2018 after all the parties have complied with the agreed conditions precedent.
ICTSI, through its subsidiaries, ISPL, MITL and SPICTL entered into Subscription and
Shareholders Agreements (SSA) with the impacted communities (IC) for the management and
governance of and the further transfers and/or issues of shares of MITL and SPICTL. The SSAs
became effective upon the effectivity of the TOAs.
On August 8, 2019, ISPL entered into agreements with the local Tatana and Baruni
communities, represented by Noho-Mage Holdings Limited (Noho-Mage), for the latter to
acquire a 30% stake in MITL. In accordance with the agreements, the shares, representing a 30%
stake in MITL, together with all the benefits and rights attached to those shares, will be
transferred to Noho-Mage, following the entry of its name in the share register of MITL. On
December 20, 2019, 30% of the shares held by ISPL were transferred to Noho-Mage after these
shares were entered in MITL’s share register under the name of Noho-Mage. The share transfer
increased non-controlling interests by US$3.8 million (PGK12.8 million). After the transfer of
shares, ISPL retained 70% ownership stake in MITL.
On February 15, 2020, ISPL entered into share acquisition agreements with the local
communities, Ahi Terminal Services Limited (Ahi) and Labu Investment Limited (Labu), for the
transfer of SPICTL shares from ISPL to Ahi and Labu with each local community acquiring a
15% stake in SPICTL. The transfer of 30% of SPICTL shares from ISPL to the local
communities became effective upon the signing of the said agreements. The share transfer
increased non-controlling interests by US$7.5 million (PGK25.6 million). After the transfer of
shares, ISPL retained 70% ownership stake in SPICTL.
Manila North Harbor, Philippines. On September 21, 2017, the Board of ICTSI granted the
authority to acquire shares in MNHPI. On the same date, ICTSI signed a Share Purchase
Agreement (SPA) with Petron Corporation for the acquisition of 10,449,000 MNHPI shares,
representing 34.83% of the total issued and outstanding shares of MNHPI for a consideration of
Php1.75 billion (US$33.8 million). The completion of the SPA was subject to several
conditions, one of which was the approval of the acquisition by the Philippine Ports Authority
(PPA) which was obtained on October 20, 2017. The SPA was completed on October 30, 2017.

SEC Form 17-Q Q2 2020 12
An additional investment cost of Php2.45 billion (US$47.3 million) was incurred in relation to
this acquisition.
On September 5, 2018, ICTSI has signed an SPA with Harbour Centre Port Terminal, Inc.
(HCPTI) for the acquisition of 4,550,000 shares in MNHPI from HCPTI. The subject shares
represent 15.17% of the total issued and outstanding shares of MNHPI. The consideration is
Php910.0 million (US$17.3 million). The Philippine Competition Commission and the PPA
approved the acquisition of shares on March 15, 2019 and April 26, 2019, respectively. With the
approval of the PPA, ICTSI's shareholdings in MNHPI increased from 34.83% to 50% effective
on April 26, 2019. An additional investment cost of Php2.7 billion (US$50.3 million) was
incurred in relation to this acquisition. As a result, MNHPI became a joint venture of ICTSI.
Port of Port Sudan, Sudan. On January 3, 2019, ICTSI, through its wholly-owned subsidiary
ICTSI Middle East DMCC, signed a Concession Agreement (‘the Agreement’) with Sea Ports
Corporation (SPC) of Sudan to operate, manage, and develop the South Port Container Terminal
(SPCT) at the Port of Sudan, Republic of the Sudan for 20 years. The Port of Sudan is the only
major modern port in the Republic of the Sudan and serves as the international gateway for more
than 95% of the country’s cargo flows.
Pursuant to the Agreement, ICTSI is required to pay: (a) an upfront fee of EUR530.0 million in
installments of EUR410.0 million (US$467.2 million) and five other installments each in the
amount of EUR24.0 (US$27.3 million) from the third to the seventh operation year; (b) fixed
monthly fee; and (c) royalty fee during the concession period. The Agreement is secured by a
sovereign guarantee by the Republic of the Sudan. On January 13, 2019, ICTSI paid the initial
installment of an upfront fee of EUR410.0 million (US$470.2 million) and included as part of
“Other noncurrent assets”. In February 2019, ICTSI established Africa Gateway Terminal
(AGT), a Sudanese entity, to operate the container terminal.
On January 8, 2019, the Ministry of Finance and Economic Planning (the “Ministry”) issued a
bond (the “Refund Bond”), which was subsequently amended, wherein it agreed to refund the
Upfront Fee in case ICTSI is unable to take over operations by April 7, 2019.
On August 7, 2019, due to the ongoing political instability in the Republic of the Sudan and the
failure of the Sudanese government to turn over SPCT on or before April 7, 2019, the Sudanese
Ministry sent ICTSI a letter confirming: (1) the remittance of EUR195.2 million
(US$219.1 million) as partial repayment of the Upfront Fee under the terms of the Refund Bond
and (2) that the balance will be repaid as soon as possible. On December 13, 2019, ICTSI,
through ICTSI Middle East DMCC, received from the Sudanese Government a second partial
repayment of the Upfront Fee in the amount of AED110.2 million (US$29.8 million). ICTSI
continues productive discussions with the Ministry of Finance and Economic Planning of the
Republic of the Sudan for the refund of the remaining balance of the Upfront Fee under the
terms of the Refund Bond and the status of the Concession Agreement following a letter from
SPC regarding its cancellation which ICTSI disputes. ICTSI reserves and continues to reserve its
rights under the Concession Agreement. ICTSI has an excellent track record of managing and
making significant investments in its container terminal infrastructure and is committed to
making the Port of Sudan a leading port and strategic gateway to Africa, benefitting all of its
stakeholders.
Port of Rio de Janeiro City, Federative Republic of Brazil. On July 19, 2019, ICTSI, through its
wholly-owned subsidiary ICTSI Americas B.V, signed a Share Purchase Agreement with Boreal
Empreendimentos e Participações S.A. (Boreal) to acquire 100% of the shares of Libra Terminal
Rio S.A. (now ICTSI Rio Brasil Terminal 1 S.A.), which holds the concession rights to operate,
manage and develop the container terminal Terminal de Contêineres 1 (T1Rio) in the port of Rio
de Janeiro City, Federative Republic of Brazil. The concession of T1Rio commenced in 1998
and was extended in 2011 until 2048. On December 12, 2019, the Share Purchase Agreement
was completed after all conditions precedent and required regulatory approvals were obtained,
and at the same time, the facilities were turned over to ICTSI.
SEC Form 17-Q Q2 2020 13
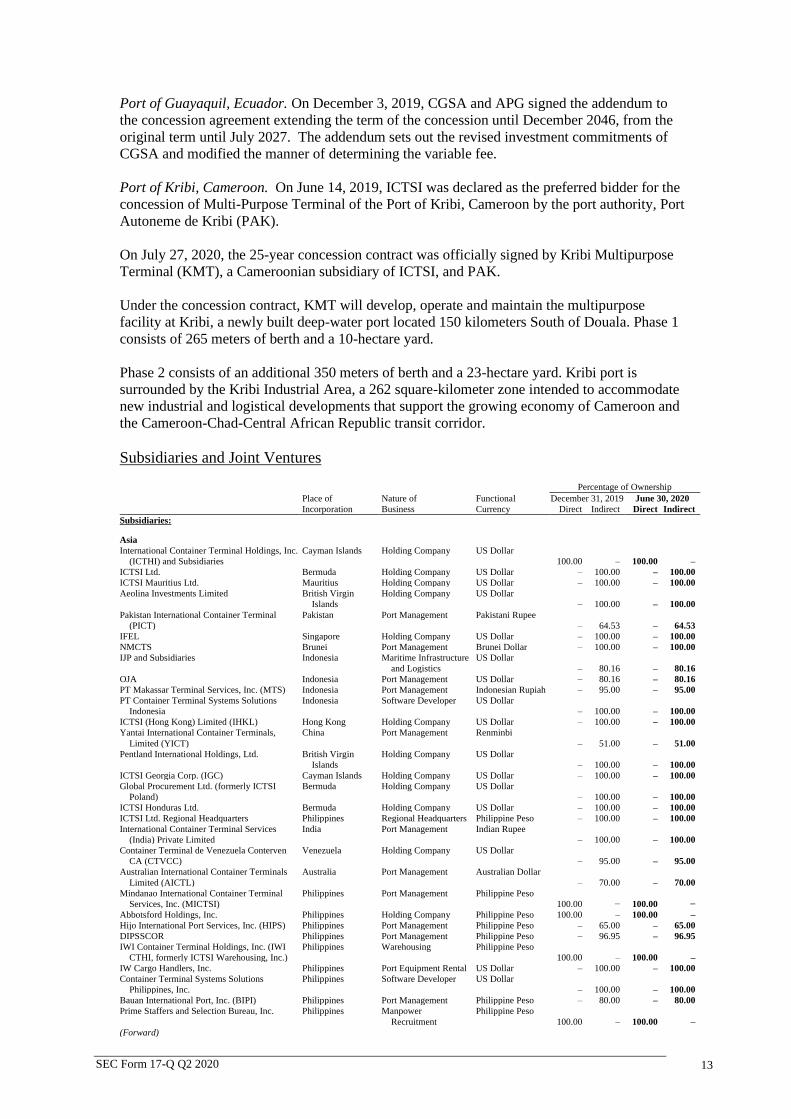
Port of Guayaquil, Ecuador. On December 3, 2019, CGSA and APG signed the addendum to
the concession agreement extending the term of the concession until December 2046, from the
original term until July 2027. The addendum sets out the revised investment commitments of
CGSA and modified the manner of determining the variable fee.
Port of Kribi, Cameroon. On June 14, 2019, ICTSI was declared as the preferred bidder for the
concession of Multi-Purpose Terminal of the Port of Kribi, Cameroon by the port authority, Port
Autoneme de Kribi (PAK).
On July 27, 2020, the 25-year concession contract was officially signed by Kribi Multipurpose
Terminal (KMT), a Cameroonian subsidiary of ICTSI, and PAK.
Under the concession contract, KMT will develop, operate and maintain the multipurpose
facility at Kribi, a newly built deep-water port located 150 kilometers South of Douala. Phase 1
consists of 265 meters of berth and a 10-hectare yard.
Phase 2 consists of an additional 350 meters of berth and a 23-hectare yard. Kribi port is
surrounded by the Kribi Industrial Area, a 262 square-kilometer zone intended to accommodate
new industrial and logistical developments that support the growing economy of Cameroon and
the Cameroon-Chad-Central African Republic transit corridor.
Subsidiaries and Joint Ventures
Percentage of Ownership
Place of Nature of Functional December 31, 2019 June 30, 2020
Incorporation Business Currency Direct Indirect Direct Indirect
Subsidiaries:
Asia
International Container Terminal Holdings, Inc.
(ICTHI) and Subsidiaries
Cayman Islands Holding Company US Dollar
100.00 – 100.00 –
ICTSI Ltd. Bermuda Holding Company US Dollar – 100.00 – 100.00
ICTSI Mauritius Ltd. Mauritius Holding Company US Dollar – 100.00 – 100.00
Aeolina Investments Limited British Virgin
Islands
Holding Company US Dollar
– 100.00 – 100.00
Pakistan International Container Terminal
(PICT)
Pakistan Port Management Pakistani Rupee
– 64.53 – 64.53
IFEL Singapore Holding Company US Dollar – 100.00 – 100.00
NMCTS Brunei Port Management Brunei Dollar – 100.00 – 100.00
IJP and Subsidiaries Indonesia Maritime Infrastructure
and Logistics
US Dollar
– 80.16 – 80.16
OJA Indonesia Port Management US Dollar – 80.16 – 80.16
PT Makassar Terminal Services, Inc. (MTS) Indonesia Port Management Indonesian Rupiah – 95.00 – 95.00
PT Container Terminal Systems Solutions
Indonesia
Indonesia Software Developer US Dollar
– 100.00 – 100.00
ICTSI (Hong Kong) Limited (IHKL) Hong Kong Holding Company US Dollar – 100.00 – 100.00
Yantai International Container Terminals,
Limited (YICT)
China Port Management Renminbi
– 51.00 – 51.00
Pentland International Holdings, Ltd. British Virgin
Islands
Holding Company US Dollar
– 100.00 – 100.00
ICTSI Georgia Corp. (IGC) Cayman Islands Holding Company US Dollar – 100.00 – 100.00
Global Procurement Ltd. (formerly ICTSI
Poland)
Bermuda Holding Company US Dollar
– 100.00 – 100.00
ICTSI Honduras Ltd. Bermuda Holding Company US Dollar – 100.00 – 100.00
ICTSI Ltd. Regional Headquarters Philippines Regional Headquarters Philippine Peso – 100.00 – 100.00
International Container Terminal Services
(India) Private Limited
India Port Management Indian Rupee
– 100.00 – 100.00
Container Terminal de Venezuela Conterven
CA (CTVCC)
Venezuela Holding Company US Dollar
– 95.00 – 95.00
Australian International Container Terminals
Limited (AICTL)
Australia Port Management Australian Dollar
– 70.00 – 70.00
Mindanao International Container Terminal
Services, Inc. (MICTSI)
Philippines Port Management Philippine Peso
100.00 − 100.00 −
Abbotsford Holdings, Inc. Philippines Holding Company Philippine Peso 100.00 – 100.00 –
Hijo International Port Services, Inc. (HIPS) Philippines Port Management Philippine Peso – 65.00 – 65.00
DIPSSCOR Philippines Port Management Philippine Peso – 96.95 – 96.95
IWI Container Terminal Holdings, Inc. (IWI
CTHI, formerly ICTSI Warehousing, Inc.)
Philippines Warehousing Philippine Peso
100.00 – 100.00 –
IW Cargo Handlers, Inc. Philippines Port Equipment Rental US Dollar – 100.00 – 100.00
Container Terminal Systems Solutions
Philippines, Inc.
Philippines Software Developer US Dollar
– 100.00 – 100.00
Bauan International Port, Inc. (BIPI) Philippines Port Management Philippine Peso – 80.00 – 80.00
Prime Staffers and Selection Bureau, Inc. Philippines Manpower
Recruitment
Philippine Peso
100.00 – 100.00 –
(Forward)

SEC Form 17-Q Q2 2020 14
Percentage of Ownership
Place of Nature of Functional December 31, 2019 June 30, 2020
Incorporation Business Currency Direct Indirect Direct Indirect
ICTSI Subic, Inc. (ICTSI Subic) Philippines Port Management US Dollar – 90.50 – 90.50
Subic Bay International Terminal Holdings,
Inc. (SBITHI)
Philippines Holding Company US Dollar
90.50 – 90.50 –
Subic Bay International Terminal Corporation
(SBITC)
Philippines Port Management US Dollar
– 90.50 – 90.50
Cordilla Properties Holdings, Inc. Philippines Holding Company Philippine Peso 100.00 − 100.00 −
SCIPSI Philippines Port Management Philippine Peso 35.82 14.41 35.82 14.41
ICTSI Dubai United Arab
Emirates
BDO US Dollar
100.00 − 100.00 −
ICTSI Capital B.V. (ICBV) The Netherlands Holding Company US Dollar – 100.00 – 100.00
Icon Logistiek B.V. The Netherlands Holding Company US Dollar – 100.00 – 100.00
Royal Capital B.V. (RCBV) The Netherlands Holding Company US Dollar – 75.00 – 75.00
ICTSI Cooperatief The Netherlands Holding Company US Dollar 1.00 99.00 1.00 99.00
Global Container Capital, B.V. The Netherlands Holding Company US Dollar – 100.00 – 100.00
ICTSI Treasury B.V. (ITBV) The Netherlands Holding Company US Dollar – 75.00 – 75.00
ICTSI Americas B.V. The Netherlands Holding Company US Dollar – 100.00 – 100.00
ICTSI Africa B.V. The Netherlands Holding Company US Dollar – 100.00 – 100.00
ICTSI Sudan B.V. (formerly ICTSI Cameroon
B.V.)
The Netherlands Holding Company US Dollar
– 100.00 – 100.00
CMSA B.V. The Netherlands Holding Company US Dollar – 100.00 – 100.00
Tecplata B.V. The Netherlands Holding Company US Dollar – 100.00 – 100.00
SPIA Colombia B.V. The Netherlands Holding Company US Dollar – 100.00 – 100.00
TSSA B.V. The Netherlands Holding Company US Dollar – 100.00 – 100.00
CGSA B.V. The Netherlands Holding Company US Dollar – 100.00 – 100.00
SPIA Spain S.L. Spain Holding Company US Dollar – 100.00 – 100.00
CGSA Transportadora S.L. Spain Holding Company US Dollar – 100.00 – 100.00
Crixus Limited British Virgin
Islands
Holding Company US Dollar
– 100.00 – 100.00
VICT Australia Port Management Australian Dollar – 100.00 – 100.00
ICTSI Global Finance B.V. (IGFBV) The Netherlands Holding Company US Dollar – 75.00 – 75.00
IOBV The Netherlands Holding Company US Dollar – 100.00 – 100.00
ICTSI Tuxpan B.V. The Netherlands Holding Company US Dollar – 100.00 – 100.00
ICTSI Asia Pacific Business Services, Inc.
(APBS)
Philippines Business Process
Outsourcing
US Dollar
– 100.00 – 100.00
ICTSI Ltd. Regional Operating Headquarters
(ROHQ)
Philippines Regional Operating
Headquarters
US Dollar
– 100.00 – 100.00
ICTSI Project Delivery Services Co. Pte. Ltd. Singapore Port Equipment Sale
and Rental
US Dollar
– 100.00 – 100.00
ICTSI QFC LLC Qatar Holding Company US Dollar – 100.00 – 100.00
ICTSI South Asia Pte. Ltd. Singapore Holding Company US Dollar – 100.00 – 100.00
LGICT Philippines Port Management Philippine Peso – 60.00 – 60.00
ICTSI Middle East DMCC United Arab
Emirates
Holding Company US Dollar
– 100.00 – 100.00
ICTSI Global Cooperatief U.A. The Netherlands Holding Company US Dollar 99.00 1.00 99.00 1.00
Consultports S.A. de C.V. Mexico BDO Mexican Peso – 100.00 – 100.00
Asiastar Consultants Limited Hong Kong Management Services US Dollar – 100.00 – 100.00
CGT Philippines Port Management Philippine Peso – 100.00 – 100.00
Intermodal Terminal Holdings, Inc. Philippines Holding Company Philippine Peso 100.00 – 100.00 –
ICTSI Americas B.V. (Multinational
Headquarters)
Panama BDO US Dollar
– 100.00 – 100.00
ICTSI South Pacific Limited (ISPL) Papua New Guinea Holding Company Papua New
Guinean Kina – 100.00 – 100.00
MITL Papua New Guinea Port Management Papua New
Guinean Kina – 70.00 – 70.00
SPICTL Papua New Guinea Port Management Papua New
Guinean Kina – 100.00 – 70.00
Tungsten RE Ltd. Bermuda Insurance Company US Dollar – 100.00 – 100.00
Europe, Middle East and Africa (EMEA)
Tartous International Container Terminal, Inc.
(TICT)
Syria Port Management US Dollar
100.00 – 100.00 –
Madagascar International Container Terminal
Services, Ltd. (MICTSL)
Madagascar Port Management Euro
– 100.00 – 100.00
Baltic Container Terminal Ltd. (BCT) Poland Port Management US Dollar – 100.00 – 100.00
Adriatic Gate Container Terminal (AGCT) Croatia Port Management Euro – 51.00 – 51.00
Batumi International Container Terminal LLC
(BICTL)
Georgia Port Management US Dollar
– 100.00 – 100.00
LICTSLE Nigeria Port Management US Dollar – 100.00 – 100.00
IDRC DR Congo Port Management US Dollar – 52.00 – 52.00
ICTSI (M.E.) DMCC Iraq Branch (ICTSI Iraq) Iraq Port Management US Dollar – 100.00 – 100.00
Africa Gateway Terminal (AGT) (d) Sudan Port Management Euro – 100.00 – 100.00
Americas
Contecon Guayaquil, S.A. (CGSA) Ecuador Port Management US Dollar 51.00 49.00 51.00 49.00
Contecon Manzanillo S.A. (CMSA) (c) Mexico Port Management Mexican Peso 1.00 99.00 1.00 99.00
Tecon Suape, S.A. (TSSA) Brazil Port Management Brazilian Real – 100.00 – 100.00
ICTSI Oregon U.S.A. Port Management US Dollar − 100.00 − 100.00
C. Ultramar, S.A. Panama Holding Company US Dollar – 100.00 – 100.00
Future Water, S.A. Panama Holding Company US Dollar – 100.00 – 100.00
Kinston Enterprise, Inc. Panama Holding Company US Dollar – 100.00 – 100.00
International Ports of South America and
Logistics SA
Uruguay Holding Company US Dollar
− 100.00 − 100.00
Tecplata S.A. (Tecplata) Argentina Port Management US Dollar − 100.00 − 100.00
Nuevos Puertos S. A. (NPSA) Argentina Holding Company US Dollar 4.00 96.00 4.00 96.00
(Forward)

SEC Form 17-Q Q2 2020 15
Percentage of Ownership
Place of Nature of Functional December 31, 2019 June 30, 2020
Incorporation Business Currency Direct Indirect Direct Indirect
Operadora Portuaria Centroamericana,
S.A. (OPC)
Honduras Port Management US Dollar
30.00 70.00 30.00 70.00
TMT Mexico Port Management Mexican Peso – 100.00 – 100.00
CMSA Servicios Portuarios
SA De CV
Mexico Manpower Services Mexican Peso
– 100.00 – 100.00
CMSA Servicios Profesionales Y De
Especialistas SA De CV
Mexico Manpower Services Mexican Peso
– 100.00 – 100.00
Logipuerto S.A. (b) Ecuador Logistics Solutions
Provider
US Dollar
– 100.00 – 100.00
ICTSI Rio Brasil Terminal 1 S.A. (or ICTSI
Rio, formerly Libra Terminal Rio S.A. )
Brazil Port Management Brazilian Real
– 100.00 – 100.00
Joint Ventures:
Sociedad Puerto Industrial Aguadulce SA
(SPIA)
Colombia Port Management US Dollar
– 49.79 – 49.79
Falconer Aircraft Management, Inc. (FAMI) (b) Philippines Aircraft Management Philippine Peso – 49.00 – 49.00
MNHPI (a) Philippines Port Management Philippine Peso 50.00 – 50.00 –
Associate:
Asiaview Realty and Development Corporation
(ARDC)
Philippines Realty Philippine Peso
– 49.00 – 49.00
(a) Acquired 34.83% stake as an associate on October 30, 2017 and an additional 15.17% stake as a joint venture on April 26, 2019 (b) Established in 2018 (c) Changed its functional currency from US Dollar to Mexican Peso on August 31, 2019 (d) Established in February 2019 and has not yet started commercial operations as of August 4, 2020
2. Basis of Preparation and Statement of Compliance
2.1 Basis of Preparation
The audited consolidated balance sheet as at December 31, 2019 and the unaudited interim
condensed consolidated financial statements as at June 30, 2020 and for the three and six months
ended June 30, 2019 and 2020 have been prepared on a historical cost basis, except for financial
assets at fair value through other comprehensive income (FVOCI) and derivative financial
instruments which have been measured at fair value. The unaudited interim condensed
consolidated financial statements are presented in United States dollar (US dollar, USD or US$),
the Parent Company’s functional and presentation currency. All values are rounded to the
nearest thousand US dollar unit, except when otherwise indicated. Any discrepancies in the
tables between the listed amounts and the totals thereof are due to rounding. Accordingly,
figures shown as totals may not be an arithmetic aggregation of the figures that precede them.
2.2 Statement of Compliance
The unaudited interim condensed consolidated financial statements for the six months ended
June 30, 2020 have been prepared in accordance with Philippine Accounting Standard (PAS) 34,
Interim Financial Reporting. Accordingly, the interim condensed consolidated financial
statements do not include all the information and disclosures required in the annual audited
consolidated financial statements, and should be read in conjunction with the Group’s audited
annual consolidated financial statements as at and for the year ended December 31, 2019.
3. Summary of Significant Accounting Policies
3.1 Basis of Consolidation
The unaudited interim condensed consolidated financial statements of the Group include the
accounts of ICTSI and its subsidiaries where the Parent Company has control. Control is
achieved when the Group is exposed, or has rights, to variable returns from its involvement with
the investee and has the ability to affect those returns through its power over the investee.
SEC Form 17-Q Q2 2020 16
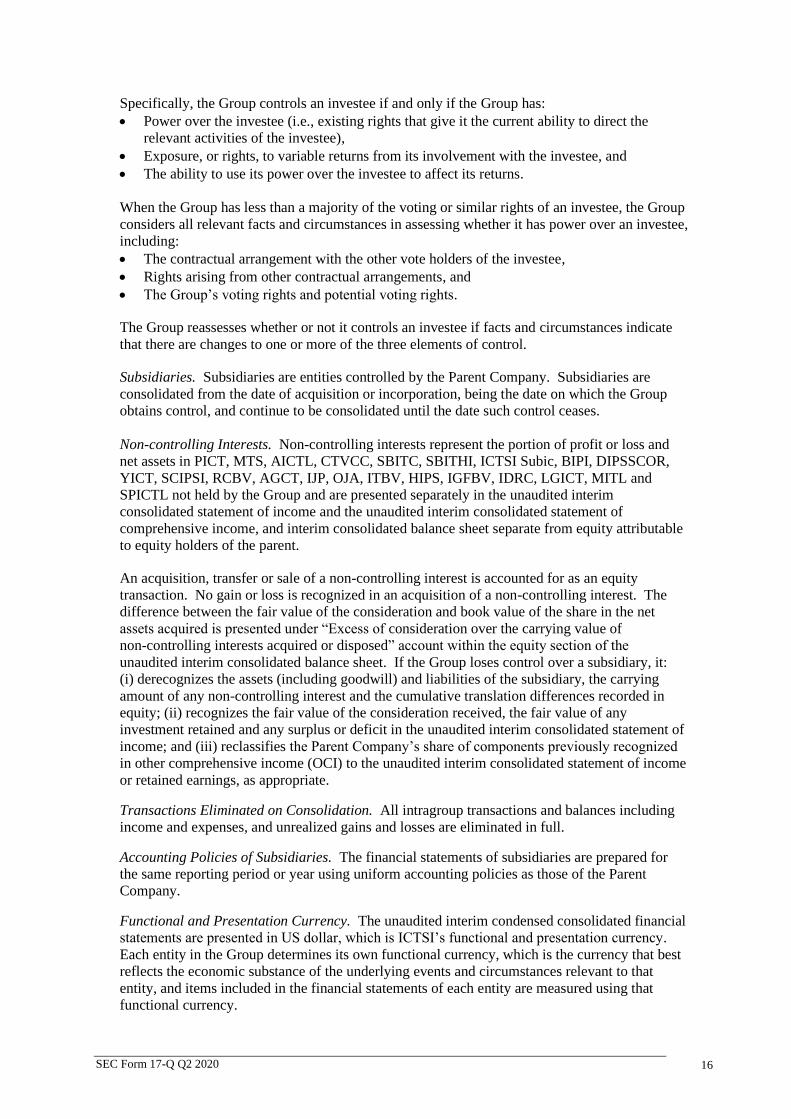
Specifically, the Group controls an investee if and only if the Group has:
• Power over the investee (i.e., existing rights that give it the current ability to direct the
relevant activities of the investee),
• Exposure, or rights, to variable returns from its involvement with the investee, and
• The ability to use its power over the investee to affect its returns.
When the Group has less than a majority of the voting or similar rights of an investee, the Group
considers all relevant facts and circumstances in assessing whether it has power over an investee,
including:
• The contractual arrangement with the other vote holders of the investee,
• Rights arising from other contractual arrangements, and
• The Group’s voting rights and potential voting rights.
The Group reassesses whether or not it controls an investee if facts and circumstances indicate
that there are changes to one or more of the three elements of control.
Subsidiaries. Subsidiaries are entities controlled by the Parent Company. Subsidiaries are
consolidated from the date of acquisition or incorporation, being the date on which the Group
obtains control, and continue to be consolidated until the date such control ceases.
Non-controlling Interests. Non-controlling interests represent the portion of profit or loss and
net assets in PICT, MTS, AICTL, CTVCC, SBITC, SBITHI, ICTSI Subic, BIPI, DIPSSCOR,
YICT, SCIPSI, RCBV, AGCT, IJP, OJA, ITBV, HIPS, IGFBV, IDRC, LGICT, MITL and
SPICTL not held by the Group and are presented separately in the unaudited interim
consolidated statement of income and the unaudited interim consolidated statement of
comprehensive income, and interim consolidated balance sheet separate from equity attributable
to equity holders of the parent.
An acquisition, transfer or sale of a non-controlling interest is accounted for as an equity
transaction. No gain or loss is recognized in an acquisition of a non-controlling interest. The
difference between the fair value of the consideration and book value of the share in the net
assets acquired is presented under “Excess of consideration over the carrying value of
non-controlling interests acquired or disposed” account within the equity section of the
unaudited interim consolidated balance sheet. If the Group loses control over a subsidiary, it:
(i) derecognizes the assets (including goodwill) and liabilities of the subsidiary, the carrying
amount of any non-controlling interest and the cumulative translation differences recorded in
equity; (ii) recognizes the fair value of the consideration received, the fair value of any
investment retained and any surplus or deficit in the unaudited interim consolidated statement of
income; and (iii) reclassifies the Parent Company’s share of components previously recognized
in other comprehensive income (OCI) to the unaudited interim consolidated statement of income
or retained earnings, as appropriate.
Transactions Eliminated on Consolidation. All intragroup transactions and balances including
income and expenses, and unrealized gains and losses are eliminated in full.
Accounting Policies of Subsidiaries. The financial statements of subsidiaries are prepared for
the same reporting period or year using uniform accounting policies as those of the Parent
Company.
Functional and Presentation Currency. The unaudited interim condensed consolidated financial
statements are presented in US dollar, which is ICTSI’s functional and presentation currency.
Each entity in the Group determines its own functional currency, which is the currency that best
reflects the economic substance of the underlying events and circumstances relevant to that
entity, and items included in the financial statements of each entity are measured using that
functional currency.

SEC Form 17-Q Q2 2020 17
At the reporting date, the assets and liabilities of subsidiaries (see Note 1.3) whose functional
currency is not US dollar are translated into the presentation currency of ICTSI using the
Bloomberg closing rate at balance sheet date and, their unaudited interim statements of income
are translated at the Bloomberg weighted average daily exchange rates for the period. The
exchange differences arising from the translation are taken directly to the unaudited interim
consolidated statement of comprehensive income. Upon disposal of the foreign entity, the
deferred cumulative translation amount recognized in the unaudited interim consolidated
statement of comprehensive income relating to that particular foreign operation is recognized in
the unaudited interim consolidated statement of income.
The following rates of exchange have been adopted by the Group in translating foreign currency
income statement and balance sheet items as at and for the six months ended June 30: 2019 2020
Closing Average Closing Average
Foreign currency to 1 unit of US dollar:
Argentine peso (AR$) 42.48 41.46 70.46 64.59
Australian dollar (AUD) 1.42 1.42 1.45 1.52
Brazilian real (BRL or R$) 3.85 3.84 5.47 4.93
Chinese renminbi (RMB) 6.87 6.79 7.07 7.04
Colombian peso (COP) 3,211.36 3,188.99 3,758.06 3,697.33
Croatian kuna (HRK) 6.51 6.57 6.74 6.84
Euro (EUR or €) 0.88 0.89 0.89 0.91
Georgian lari (GEL) 2.85 2.70 3.06 3.04
Honduran lempira (HNL) 24.59 24.48 24.75 24.75
Hong Kong dollar (HKD) 7.81 7.84 7.75 7.76
Indian rupee (INR) 69.03 70.03 75.51 74.12
Indonesian rupiah (IDR or Rp) 14,126.00 14,194.00 14,265.00 14,548.00
Iraqi dinar (IQD) 1,182.28 1,190.32 1,182.87 1,182.87
Malagasy ariary (MGA) 3,651.00 3,609.19 3,840.09 3,742.26
Mexican peso (MXN) 19.22 19.15 22.99 21.66
Pakistani rupee (PKR or Rs) 159.52 143.43 167.89 159.78
Papua New Guinean kina (PGK) 3.39 3.37 3.45 3.42
Philippine peso (P=) 51.24 52.22 49.83 50.64
Polish zloty (PLN) 3.73 3.80 3.96 4.01
Singaporean dollar (SGD) 1.35 1.36 1.39 1.40
Below is the impact on equity of the exchange loss differences arising from the translation of
assets and liabilities (excluding the impact from eliminated intra-group balances) of entities
whose functional currency is other than and which depreciated significantly against the US
dollar, mainly, CMSA, ICTSI Rio, TSSA, and VICT for the six months ended June 30, 2020:
Assets
Intangibles (US$84,255)
Property and equipment (90,150)
Right-of-use assets (51,916)
Investment properties 66
Investments in and advances to joint ventures and associate 2,147
Deferred tax assets (26,875)
Other noncurrent assets (4,294)
Cash and cash equivalents (7,494)
Receivables (5,997)
Spare parts and supplies (1,982)
Prepaid expenses and other current assets (9,027)
(279,777)
SEC Form 17-Q Q2 2020 18
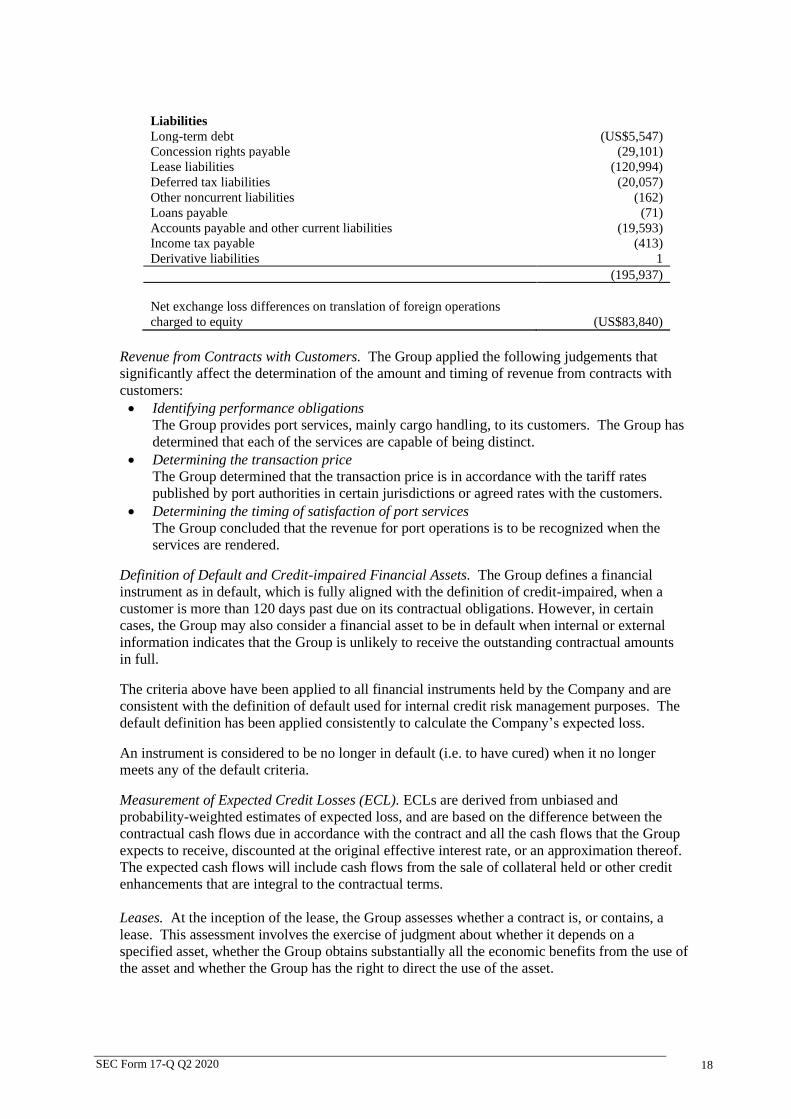
Liabilities
Long-term debt (US$5,547)
Concession rights payable (29,101)
Lease liabilities (120,994)
Deferred tax liabilities (20,057)
Other noncurrent liabilities (162)
Loans payable (71)
Accounts payable and other current liabilities (19,593)
Income tax payable (413)
Derivative liabilities 1
(195,937)
Net exchange loss differences on translation of foreign operations
charged to equity (US$83,840)
Revenue from Contracts with Customers. The Group applied the following judgements that
significantly affect the determination of the amount and timing of revenue from contracts with
customers:
• Identifying performance obligations
The Group provides port services, mainly cargo handling, to its customers. The Group has
determined that each of the services are capable of being distinct.
• Determining the transaction price
The Group determined that the transaction price is in accordance with the tariff rates
published by port authorities in certain jurisdictions or agreed rates with the customers.
• Determining the timing of satisfaction of port services
The Group concluded that the revenue for port operations is to be recognized when the
services are rendered.
Definition of Default and Credit-impaired Financial Assets. The Group defines a financial
instrument as in default, which is fully aligned with the definition of credit-impaired, when a
customer is more than 120 days past due on its contractual obligations. However, in certain
cases, the Group may also consider a financial asset to be in default when internal or external
information indicates that the Group is unlikely to receive the outstanding contractual amounts
in full.
The criteria above have been applied to all financial instruments held by the Company and are
consistent with the definition of default used for internal credit risk management purposes. The
default definition has been applied consistently to calculate the Company’s expected loss.
An instrument is considered to be no longer in default (i.e. to have cured) when it no longer
meets any of the default criteria.
Measurement of Expected Credit Losses (ECL). ECLs are derived from unbiased and
probability-weighted estimates of expected loss, and are based on the difference between the
contractual cash flows due in accordance with the contract and all the cash flows that the Group
expects to receive, discounted at the original effective interest rate, or an approximation thereof.
The expected cash flows will include cash flows from the sale of collateral held or other credit
enhancements that are integral to the contractual terms.
Leases. At the inception of the lease, the Group assesses whether a contract is, or contains, a
lease. This assessment involves the exercise of judgment about whether it depends on a
specified asset, whether the Group obtains substantially all the economic benefits from the use of
the asset and whether the Group has the right to direct the use of the asset.

SEC Form 17-Q Q2 2020 19
Right-of-use assets. The Group recognizes right-of-use assets at the commencement date of the
lease (i.e., the date the underlying asset is available for use). Right-of-use assets are measured at
cost, less any accumulated depreciation and impairment losses, and adjusted for any
remeasurement of lease liabilities. The cost of right-of-use assets includes the amount of lease
liabilities recognized, initial direct costs incurred, and lease payments made at or before the
commencement date less any lease incentives received and estimate of costs to be incurred by
the lessee in dismantling and removing the underlying asset, restoring the site on which it is
located or restoring the underlying asset to the condition required by the terms and conditions of
the lease, unless those costs are incurred to produce inventories. Unless the Group is reasonably
certain to obtain ownership of the leased asset at the end of the lease term, the recognized right-
of-use assets are depreciated on a straight-line basis over the lease term. Right-of-use assets are
subject to impairment.
Lease liabilities. At the commencement date of the lease, the Group recognizes lease liabilities
measured at the present value of lease payments to be made over the lease term. The lease
payments include fixed payments (including in substance fixed payments) less any lease
incentives receivable, variable lease payments that depend on an index or a rate, and amounts
expected to be paid under residual value guarantees. The lease payments also include the
exercise price of a purchase option reasonably certain to be exercised by the Group and
payments of penalties for terminating a lease, if the lease term reflects the Group exercising the
option to terminate. The variable lease payments that do not depend on an index or a rate are
recognized as an expense in the period on which the event or condition that triggers the payment
occurs.
In calculating the present value of lease payments, the Group uses the incremental borrowing
rate at the lease commencement date if the interest rate implicit in the lease is not readily
determinable. After the commencement date, the amount of lease liabilities is increased to reflect
the accretion of interest and reduced for the lease payments made. In addition, the carrying
amount of lease liabilities is remeasured if there is a modification, a change in the lease term, a
change in the in-substance fixed lease payments, or a change in the assessment to purchase the
underlying asset.
Lease liabilities that are expected to be settled for no more than 12 months after the reporting
period are classified as current liabilities presented as Current portion of lease liabilities.
Otherwise, these are classified as noncurrent liabilities.
Short-term leases and leases of low-value assets
The Group applies the short-term lease recognition exemption to its short-term leases of
machinery and equipment (i.e., those leases that have a lease term of 12 months or less from the
commencement date and do not contain a purchase option). It also applies the leases of low-
value assets recognition exemption to leases of office equipment that are considered of low
value. Lease payments on short-term leases and leases of low-value assets are recognized as
expense on a straight-line basis over the lease term.
Group as lessor. Leases where the Group does not transfer substantially all the risks and benefits
of ownership of the asset are classified as operating leases. Initial direct costs incurred in
negotiating an operating lease are added to the carrying amount of the leased asset and
recognized over the lease term on the same bases as rental income. Contingent rents are
recognized as revenue in the period in which they are earned.

SEC Form 17-Q Q2 2020 20
3.2 Changes in Accounting Policies
3.2.1 New standards, interpretations, and amendments adopted by the Group
The accounting policies adopted in the preparation of the unaudited interim condensed
consolidated financial statements are consistent with those followed in the preparation of the
Group’s annual consolidated financial statements as at and for the year ended
December 31, 2019, except for the adoption of new standards effective as at January 1, 2020.
The Group has not early adopted any standard, interpretation or amendment that has been issued
but is not yet effective.
Several amendments and interpretations apply for the first time in 2020, but do not have an
impact on the unaudited interim consolidated financial statements of the Group.
• Amendments to PFRS 3: Definition of a Business
The amendment to PFRS 3 clarifies that to be considered a business, an integrated set of
activities and assets must include, at a minimum, an input and a substantive process that
together significantly contribute to the ability to create output. Furthermore, it clarified that
a business can exist without including all of the inputs and processes needed to create
outputs. These amendments had no impact on the unaudited interim consolidated financial
statements of the Group, but may impact future periods should the Group enter into any
business combinations.
• Amendments to PFRS 7, PFRS 9, and PAS 39: Interest Rate Benchmark Reform
The amendments to PFRS 9 and PAS 39, Financial Instruments: Recognition and
Measurement provide a number of reliefs, which apply to all hedging relationships that are
directly affected by interest rate benchmark reform. A hedging relationship is affected if the
reform gives rise to uncertainties about the timing and or amount of benchmark-based cash
flows of the hedged item or the hedging instrument. The amendments apply to the Group's
interest rate swaps designated as cash flow hedges relating to the Group’s variable rate loans
as at June 30, 2020 (see Note 20.3). Applying the amendments, the Group assumed that the
interest rate benchmark on which the hedged cash flows and the interest rate benchmark on
which the cash flows of the hedging instruments are based, is not altered as a result of the
interest rate benchmark reform.
• Amendments to PAS 1 and PAS 8: Definition of Material
The amendments provide a new definition of material that states “information is material if
omitting, misstating, or obscuring it could reasonably be expected to influence decisions that
the primary users of general purpose financial statements make on the basis of those
financial statements, which provide financial information about a specific reporting entity.”
The amendments clarify that materiality will depend on the nature or magnitude of
information, either individually or in combination with other information, in the context of
the financial statements. A misstatement of information is material if it could reasonably be
expected to influence decisions made by the primary users. These amendments had no
significant impact on the Group.

SEC Form 17-Q Q2 2020 21
4. Segment Information
A segment is a distinguishable component of the Group that is engaged either in providing types
of services (business segment) or in providing the services within a particular economic
environment (geographic segment).
The Group operates principally in one industry segment, which is cargo handling and related
services. ICTSI has organized its business into three geographical segments:
▪ Asia - includes Manila International Container Terminal (MICT), BIPI, DIPSSCOR,
SCIPSI, SBITC, ICTSI Subic, HIPS, MICTSI, LGICT, CGT and MNHPI in the Philippines;
YICT in China; OJA, IJP, and MTS in Indonesia; VICT in Australia; NMCTS in Brunei;
PICT in Pakistan; MITL and SPICTL in PNG; and AICTL, ICTHI, ICTSI Ltd. and other
holding companies and those companies incorporated in The Netherlands for the purpose of
supporting the funding requirements of the Group;
▪ EMEA - includes BCT in Poland, BICTL in Georgia, AGCT in Croatia, MICTSL in
Madagascar, LICTSLE in Nigeria, IDRC in DR Congo, ICTSI Iraq in Iraq and AGT in
Sudan; and
▪ Americas - includes TSSA and ICTSI Rio in Brazil, CGSA in Ecuador, SPIA in Colombia,
Tecplata in Argentina, CMSA, and TMT in Mexico, OPC in Honduras and ICTSI Oregon in
Oregon, U.S.A.
Management monitors the operating results of its operating unit separately for making decisions
about resource allocation and performance assessment. The Group evaluates segment
performance based on contributions to gross revenues, which is measured consistently with
gross revenues from port operations in the interim condensed consolidated statements of income.
Financing is managed on a group basis and centralized at the Parent Company level or at the
entities created solely for the purpose of obtaining funds for the Group. Funding requirements
that are secured through debt are recognized as liabilities of the Parent Company or of the entity
issuing the debt instrument, classified under the geographical region of Asia, and are not
allocated to other geographical segments where funds are eventually transferred and used.
The table below presents financial information on geographical segments as of
December 31, 2019 (audited) and as of June 30, 2020 (unaudited) and for the three and six
months ended June 30, 2019 (unaudited) and 2020 (unaudited):
2019
As at and for the Three Months Ended June 30 As at and for the Six Months Ended June 30
Asia EMEA Americas Consolidated Asia EMEA Americas Consolidated
Volume (a) 1,354,478 456,377 752,389 2,563,244 2,653,248 890,664 1,498,004 5,041,916
Gross revenues US$182,711 US$78,753 US$106,537 US$368,001 US$378,959 US$154,274 US$218,552 US$751,785
Capital expenditures (b) 33,211 12,257 22,080 67,548 55,215 33,916 32,662 121,793
Other information:
Segment assets (c) 2,981,506 747,594 1,700,402 5,429,502 2,981,506 747,594 1,700,402 5,429,502
Segment liabilities (d) 2,917,829 127,315 867,665 3,912,809 2,917,829 127,315 867,665 3,912,809
2020
As at and for the Three Months Ended June 30 As at and for the Six Months Ended June 30
Asia EMEA Americas Consolidated Asia EMEA Americas Consolidated
Volume (a) 1,152,022 427,155 711,602 2,290,779 2,416,663 883,553 1,499,549 4,799,765
Gross revenues US$173,971 US$73,424 US$101,090 US$348,485 US$354,381 US$148,344 US$221,536 US$724,261
Capital expenditures (b) 17,178 5,492 8,870 31,540 54,844 18,979 17,416 91,239
Other information:
Segment assets (c) 3,007,066 749,346 1,525,680 5,282,092 3,007,066 749,346 1,525,680 5,282,092
Segment liabilities (d) 3,026,824 120,560 756,445 3,903,829 3,026,824 120,560 756,445 3,903,829

SEC Form 17-Q Q2 2020 22
(a) Measured in TEUs.
(b) Capital expenditures include amount disbursed for the acquisition of port facilities and equipment classified as intangibles under IFRIC 12 and
property and equipment as shown in the unaudited interim consolidated statement of cash flows.
(c) Segment assets do not include deferred tax assets amounting to US$321.4 million and US$297.0 million as at December 31, 2019 and June 30, 2020
(unaudited), respectively.
(d) Segment liabilities do not include income tax payable amounting to US$39.3 million and US$42.4 million and deferred tax liabilities amounting to
US$164.3 million and US$148.5 million as at December 31, 2019 and June 30, 2020 (unaudited), respectively.
Moreover, management monitors the Group’s earnings before interest, taxes, depreciation,
and amortization (EBITDA) on a consolidated basis for decision-making purposes. The
following table shows the computation of EBITDA as derived from the unaudited interim
consolidated net income attributable to equity holders of the parent for the three and six
months ended June 30:
For the Three Months Ended June 30 For the Six Months Ended June 30
2019 2020 2019 2020
Net income attributable to equity
holders of the parent US$56,067 US$53,782 US$128,470 US$113,379
Non-controlling interests 8,498 8,690 17,600 17,931
Provision for income tax 18,560 19,097 40,398 34,808
Income before income tax 83,125 81,569 186,468 166,118
Add (deduct):
Depreciation and amortization 57,833 55,280 115,225 111,010
Interest and other expenses (a) 73,928 75,491 145,883 157,374
Interest and other income (b) (13,030) (8,122) (23,177) (18,132)
EBITDA (c) US$201,856 US$204,218 US$424,399 US$416,370
(a) Interest and other expenses include the following as shown in the unaudited interim consolidated statements
of income: foreign exchange loss; interest expense on concession rights payable; interest expense and
financing charges on borrowings; interest expense on lease liabilities; equity in net loss of joint ventures and
an associate; and other expenses. (b) Interest and other income include the following as shown in the unaudited interim consolidated statements of
income: foreign exchange gain; interest income; and other income. (c) EBITDA is not a uniform or legally defined financial measure. EBITDA is presented because the Group
believes it is an important measure of its performance and liquidity. EBITDA is also frequently used by
securities analysts, investors, and other interested parties in the evaluation of companies in the industry.
The Group EBITDA figures are not; however, readily comparable with other companies’ EBITDA figures as
these may be calculated differently thus, must be read in conjunction with related additional explanations.
EBITDA has limitations as an analytical tool and should not be considered in isolation or as a substitute for
analysis of the Group’s results as reported under PFRS. Some of the limitations concerning EBITDA are:
▪ EBITDA does not reflect cash expenditures or future requirements for capital expenditures or contractual
commitments;
▪ EBITDA does not reflect changes in, or cash requirements for working capital needs;
▪ EBITDA does not reflect fixed (and in-substance fixed) port fees and lease payments that are capitalized as
concession assets under IFRIC 12 and right-of-use assets under PFRS 16;
▪ EBITDA does not reflect the interest expense, or cash requirements necessary to service interest or
principal debt payments;
▪ Although depreciation and amortization are non-cash charges, the assets being depreciated or amortized
will often have to be replaced in the future, and EBITDA does not reflect any cash requirements for such
replacements; and
▪ Other companies in the industry may calculate EBITDA differently, which may limit its usefulness as a
comparative measure.
Because of these limitations, EBITDA should not be considered as a measure of discretionary cash available
to the Group to invest in the growth of the business. The Group compensates for these limitations by relying
primarily on PFRS results and uses EBITDA only as supplementary information.
All segment revenues are from external customers. Gross revenues from port operations of
ICTSI and other Philippine-based subsidiaries comprised 36.0% and 32.9% of the unaudited
consolidated gross revenues from port operations for the three months ended June 30, 2019 and
2020, respectively, and 37.2% and 32.9% of the unaudited consolidated gross revenues from
port operations for the six months ended June 30, 2019 and 2020, respectively. Gross revenues
from port operations outside the Republic of the Philippines comprised 64.0% and 67.1% of the
unaudited consolidated gross revenues from port operations for the three months ended
June 30, 2019 and 2020, respectively, and 62.8% and 67.1% of the unaudited consolidated gross
revenues from port operations for the six months ended June 30, 2019 and 2020, respectively.

SEC Form 17-Q Q2 2020 23
5. Concession Rights and Concession Rights Payable
5.1 Concession Rights
Concession rights are presented as part of intangibles in the interim consolidated balance sheet.
Concession rights include upfront fee payments recognized on the concession contracts, cost of
port infrastructure constructed and port equipment purchased, and present value of future fixed
fee considerations in exchange for the license or right to operate ports. Concession rights are
amortized over the term of the concession agreements.
Additions to concession rights under port infrastructure mainly pertain to construction of various
civil works and acquisitions of port facilities and equipment in ICTSI, ICTSI Iraq, and CGSA
for the six months ended June 30, 2020.
Borrowing costs capitalized amounted to US$1.3 million, with capitalization rate of 7.0 percent,
for the six months ended June 30, 2019, and nil for the six months ended June 30, 2020
(see Note 13.5).
5.2 Concession Rights Payable
Upon recognition of the fair value of fixed fee on concession contracts, the Group also
recognized the corresponding concession rights payable.
The maturities of the carrying amount of concession rights payable as at June 30, 2020 arising
from the capitalization of fixed fees are as follows (amount in thousands):
Amount
2020 (1) US$3,403
2021 15,465
2022 16,609
2023 17,209
2024 onwards 579,844
Total US$632,530 (1) July 1, 2020 through December 31, 2020.
Total fixed portion of port fees paid by the Group for the three and six months ended
June 30, 2019 and 2020 amounted to US$14.6 million and US$16.3 million and
US$29.1 million and US$32.8 million, respectively. These port fees are allocated to payments
of interest and reduction to or payments of concession rights payable.
Interest expense on concession rights payable amounted to US$10.0 million and
US$12.8 million and US$20.0 million and US$25.9 million for the three and six months ended
June 30, 2019 and 2020, respectively. The annualized weighted average interest rate was 7.51%
and 8.20% as at June 30, 2019 and 2020, respectively.
Reduction to concession rights payable, shown as payments to concession rights in the unaudited
interim consolidated statement of cash flows for the six months ended June 30, 2019 and 2020
amounted to US$9.2 million and US$5.4 million, respectively.
Concession fees that were not included in the measurement of concession rights payable were
charged to profit or loss under Port Authorities’ share in gross revenues amounting to
US$41.2 million and US$36.3 million and US$85.9 million and US$76.8 million for the three
and six months ended June 30, 2019 and 2020, respectively.

SEC Form 17-Q Q2 2020 24
6. Property and Equipment
Additions to property and equipment pertained to the construction of various civil works and
acquisitions of terminal equipment in various ports, mainly in CMSA, IDRC, VICT and ICTSI
Iraq as at June 30, 2020. There were no major disposals or write-downs of property and
equipment for the six months ended June 30, 2019 and 2020.
7. Right-of-use Assets and Lease Liabilities
The concession agreements of CMSA, TSSA, VICT, BCT, BICTL, MICTSI, TMT and Tecplata
were accounted for by the Group in accordance with PFRS 16, Leases. The Group recognized
lease liabilities for its obligations to pay lease fees and right-of-use assets representing the right to
use the underlying assets. Right-of-use assets are amortized over the term of the concession
agreements.
7.1 Right-of-use Assets
For the six months ended June 30, 2020, additions to right-of-use assets of was mainly due to the
delivery by the port authority on June 30, 2020 of the remaining concession area of the third
phase to CMSA amounting to US$31.1 million.
7.2 Lease Liabilities
Upon recognition of the present value of fixed (including in-substance fixed) fee on concession
contracts accounted for in accordance with PFRS 16, the Group also recognized the
corresponding lease liabilities. The minimum lease payments pertaining to lease liabilities as at
June 30, 2020 are as follows (amount in thousands):
Amount
2020 (i) US$45,759
2021 105,707
2022 110,087
2023 110,921
2024 onwards 2,108,453
Total US$2,480,927 (i) July 1, 2020 through December 31, 2020.
Total fixed fees paid by the Group for the three months ended June 30, 2019 and 2020 amounted
to US$14.6 million and US$20.3 million, respectively, and US$29.1 million and
US$42.7 million, respectively, for the six months ended June 30, 2019 and 2020. These fees are
allocated to payments of interest and reduction to or payments of lease liabilities in the
unaudited interim consolidated statements of cash flows.
Summarized below are the amounts recognized in profit or loss (amounts in thousands):
For the three months
ended June 30
For the six months ended
June 30
2019 2020 2019 2020
Depreciation of right-of-use assets US$6,903 US$7,090 US$13,646 US$14,526
Interest expense on lease liabilities 25,859 22,510 51,786 47,181
Lease expense not included in the
measurement of lease liabilities
(under Port Authorities’ share in
gross revenues)
3,594 3,639 6,944 6,905
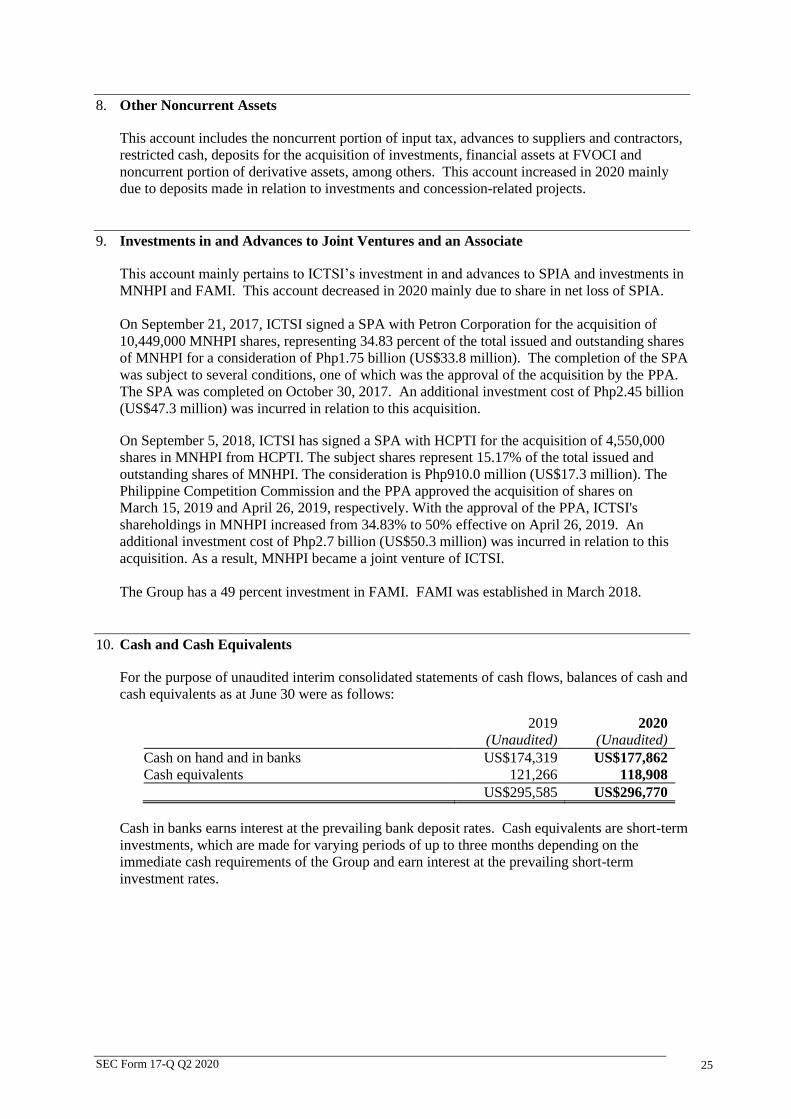
SEC Form 17-Q Q2 2020 25
8. Other Noncurrent Assets
This account includes the noncurrent portion of input tax, advances to suppliers and contractors,
restricted cash, deposits for the acquisition of investments, financial assets at FVOCI and
noncurrent portion of derivative assets, among others. This account increased in 2020 mainly
due to deposits made in relation to investments and concession-related projects.
9. Investments in and Advances to Joint Ventures and an Associate
This account mainly pertains to ICTSI’s investment in and advances to SPIA and investments in
MNHPI and FAMI. This account decreased in 2020 mainly due to share in net loss of SPIA.
On September 21, 2017, ICTSI signed a SPA with Petron Corporation for the acquisition of
10,449,000 MNHPI shares, representing 34.83 percent of the total issued and outstanding shares
of MNHPI for a consideration of Php1.75 billion (US$33.8 million). The completion of the SPA
was subject to several conditions, one of which was the approval of the acquisition by the PPA.
The SPA was completed on October 30, 2017. An additional investment cost of Php2.45 billion
(US$47.3 million) was incurred in relation to this acquisition.
On September 5, 2018, ICTSI has signed a SPA with HCPTI for the acquisition of 4,550,000
shares in MNHPI from HCPTI. The subject shares represent 15.17% of the total issued and
outstanding shares of MNHPI. The consideration is Php910.0 million (US$17.3 million). The
Philippine Competition Commission and the PPA approved the acquisition of shares on
March 15, 2019 and April 26, 2019, respectively. With the approval of the PPA, ICTSI's
shareholdings in MNHPI increased from 34.83% to 50% effective on April 26, 2019. An
additional investment cost of Php2.7 billion (US$50.3 million) was incurred in relation to this
acquisition. As a result, MNHPI became a joint venture of ICTSI.
The Group has a 49 percent investment in FAMI. FAMI was established in March 2018.
10. Cash and Cash Equivalents
For the purpose of unaudited interim consolidated statements of cash flows, balances of cash and
cash equivalents as at June 30 were as follows:
2019
(Unaudited)
2020
(Unaudited)
Cash on hand and in banks US$174,319 US$177,862
Cash equivalents 121,266 118,908
US$295,585 US$296,770
Cash in banks earns interest at the prevailing bank deposit rates. Cash equivalents are short-term
investments, which are made for varying periods of up to three months depending on the
immediate cash requirements of the Group and earn interest at the prevailing short-term
investment rates.

SEC Form 17-Q Q2 2020 26
11. Receivables
This account consists of:
December 31,
2019
June 30, 2020
(Unaudited)
Trade US$107,202 US$98,234
Advances and nontrade 26,256 27,981
133,458 126,215
Less allowance for doubtful accounts 9,058 8,965
US$124,400 US$117,250
Trade receivables are noninterest-bearing and are generally on 30-60 days’ credit terms.
Advances and nontrade receivables mainly include noninterest-bearing advances to suppliers
and vendors that may be applied against payable or collectible within 12 months.
12. Prepaid Expenses and Other Current Assets
This account includes input tax, tax credits, creditable withholding taxes, receivable from port
authorities, and prepaid port fees, insurance, bonds, and other expenses.
13. Long-term Debt and Loans Payable
13.1 Maturities of Long-term Debt
Maturities of long-term debt, net of unamortized debt issuance costs, premium and discount of
US$47.0 million, as at June 30, 2020 are as follows (amount in thousands):
Amount
2020 (1) US$17,691
2021 66,926
2022 71,165
2023 480,829
2024 and onwards 1,132,738
Total US$1,769,349 (1) July 1, 2020 through December 31, 2020.
13.2 US Dollar-denominated Loans
On March 10, 2010, ICTSI signed a Subscription Agreement with The Hong Kong and Shanghai
Banking Corporation Ltd. (HSBC) and JP Morgan Securities, Ltd. for the issuance of ten-year
senior notes (the “Original Notes”). The Original Notes were issued on March 17, 2010 with an
aggregate principal amount of US$250.0 million, maturing on March 17, 2020. The Original
Notes bear interest at a fixed rate of 7.375 percent, net of applicable taxes, payable semi-
annually in arrears.
On April 29, 2010, ICTSI tapped a further US$200.0 million (the “Further Notes”) of the
Original Notes discussed in the preceding paragraph, increasing the size to US$450.0 million.
The Further Notes were issued on May 6, 2010. The Original and Further Notes are collectively
referred to as the “Notes”. The Further Notes bear interest at the fixed rate of 7.375 percent, net
of applicable taxes, and was set at a price of 102.627 for an effective yield of 7.0 percent.

SEC Form 17-Q Q2 2020 27
The net proceeds of the Notes amounting to US$448.1 million were used to fund investments in
existing and new terminal construction activities, refinance some of its existing debt and for
other general corporate purposes.
The Notes were not registered with the Philippine SEC. The Notes were offered in offshore
transactions outside the United States in reliance on Regulation S under the Securities Act of
1933, as amended, and, subject to certain exceptions, may not be offered or sold within the
United States. The Notes were traded and listed in the Singapore Stock Exchange.
On September 17, 2013, ITBV exchanged newly issued US$207.5 million 5.875 percent Notes
due 2025 for ICTSI’s US$178.9 million 7.375 percent Notes due 2020. The Notes due 2020
were then reduced from US$450.0 million to US$271.1 million. The Notes due 2025 were
issued by ITBV under its US$1.0 billion Medium Term Note Programme (the “MTN
Programme”) and are unconditionally and irrevocably guaranteed by ICTSI.
On January 29, 2015, a total of US$117.5 million 5.875 percent Notes due 2025 from the MTN
Programme were issued at a price of 102.625 and US$102.6 million of which was used to
exchange with holders of US$91.8 million 7.375 percent Notes due 2020. The cash proceeds
received by ITBV amounted to US$11.6 million, net of debt issuance cost. These new Notes
were consolidated and formed a single series with the US$282.5 million 5.875 percent
guaranteed Notes due 2025 issued on September 17, 2013 and April 30, 2014. ICTSI fully
redeemed the outstanding balance of Notes amounting to US$179.3 million on March 17, 2020.
On June 10, 2020, ICTSI signed a Subscription Agreement with Citigroup Global Markets
Limited, Credit Suisse (Hong Kong) Limited and J.P. Morgan Securities Plc for the issuance of
ten-year senior notes (the “Senior Notes”). The Senior Notes were issued on June 17, 2020 with
an aggregate principal amount of US$400.0 million, maturing on June 17, 2030, at a fixed
interest rate of 4.75 percent per annum, payable semi-annually in arrears and at a price of
99.607.
The proceeds of the Senior Notes amounting to US$391.9 million, net of debt issuance costs of
$8.1 million, were used to refinance and extend the maturity of the Group’s liabilities and for
general corporate purposes.
The Senior Notes were not registered with the Philippine SEC. The Senior Notes were offered
in offshore transactions outside the United States in reliance on Regulation S under the
Securities Act and, subject to certain exceptions, may not be offered or sold within the United
States. The Senior Notes are traded and listed in the Singapore Stock Exchange.
On March 29, 2016, CGSA (as “Borrower”), Metropolitan Bank and Trust Company (as
“Lender” or “MBTC”) and ICTSI (as “Surety”) signed a loan agreement which consists of two
tranches of US$32.5 million (Tranche I) and US$7.5 million (Tranche II) with interest based on
three-month London Inter-bank Offered Rate (LIBOR) plus an agreed margin. Tranche I has a
final maturity in March 2021 and Tranche II in May 2017. In 2016, CGSA availed of loans with
a total amount of US$40.0 million. A portion of the proceeds of these loans was used to
refinance the unsecured term loans of CGSA amounting to US$9.2 million in April 2016. In
2017, CGSA fully paid the loan under Tranche II. In 2020, CGSA has paid a total amount of
US$3.8 million of the loan under Tranche I. As at June 30, 2020, the outstanding balance of the
loan with MBTC amounted to US$5.7 million.
On October 9, 2018, IDRC availed of a four-year term loan with Rawbank DRC amounting to
US$25.0 million at a fixed interest rate. In 2020, IDRC has paid US$3.1 million of the loan. As
at June 30, 2020, the outstanding balance of the loan amounted to US$14.6 million.

SEC Form 17-Q Q2 2020 28
On May 6, 2019, IDRC availed of another four-year term loan with Rawbank DRC amounting to
US$3.0 million at a fixed interest rate. In 2020, IDRC has paid US$0.3 million of the loan. As
at June 30, 2020, the outstanding balance of the loan amounted to US$2.2 million.
On March 21, 2019, IGFBV, as borrower, MBTC, as lender, and ICTSI, as surety, signed a term
loan facility amounting to US$300.0 million with interest based on three-month LIBOR plus an
agreed margin and a tenor of 7 years. On April 29, 2019, IGFBV has fully availed of the term
loan facility. As at June 30, 2020, the outstanding balance of the term loan facility amounted to
US$287.6 million, net of debt issuance costs.
On November 26, 2019, December 5, 2019 and January 6, 2020, IGFBV availed of an 18-month
loan from MUFG Bank Ltd. (MUFG) with interest based on three-month LIBOR plus an agreed
margin, amounting to US$45.0 million, US$45.0 million and US$20.0 million, respectively.
IGFBV fully paid the loans on June 18, 2020.
On March 13, 2020, ICTSI availed of short-term loans from Citibank N.A., Philippine National
Bank (PNB), and Standard Chartered Bank (SCB) totaling to US$200.0 million at prevailing
market rates with maturity dates of June 11, 2020 and September 9, 2020. ICTSI fully paid the
loans with Citibank, PNB, and SCB on June 11, 2020, June 15, 2020 and June 18, 2020,
respectively.
On March 20, 2020, ICTSI availed of additional short-term loans from MUFG and HSBC
totaling to US$90.0 million at prevailing market rates with maturity dates of September 18, 2020
and March 22, 2021. ICTSI fully prepaid the loans on June 18, 2020.
On March 24, 2020, ICTSI availed of an 18-month loan from MBTC amounting to
US$100.0 million with interest based on prevailing market rate. ICTSI fully prepaid the loan on
June 18, 2020.
13.3 Foreign Currency-denominated Loans
On July 15, 2016, VICT signed the syndicated project finance facilities with various
international and regional banks for a principal amount of US$300.0 million
(AUD398.0 million), comprising of term facilities totaling US$284.9 million
(AUD378.0 million) with interest rates based on Australian Bank Bill Swap Reference Rate
(bid) (BBSY) plus an average margin of 3.1 percent per annum and maturities until 2023, 2026
and 2031 and working capital facility of US$15.1 million (AUD20.0 million). In 2020, VICT
paid US$25.4 million (AUD38.5 million) of the loan from the term facilities. As at
June 30, 2020, the outstanding balance of the loans amounted to US$200.9 million
(AUD291.1 million), net of debt issuance costs.
On April 26, 2017, YICT obtained a US$21.8 million (RMB150.0 million) loan from
Agricultural Bank of China (ABC) payable in installments with a final maturity on
November 21, 2023. The loan was used to refinance YICT’s maturing loan with Yantai Port
Holdings. Interest is based on the interest rate published by People's Bank of China minus an
agreed margin. The rate is subject to adjustment every twelve months. In 2020, YICT paid
US$2.9 million (RMB20.0 million) of the loan. The outstanding balance of the loan from ABC
amounted to US$1.4 million (RMB10.0 million) as at June 30, 2020.
On November 27, 2019, SPICTL and MITL, as borrowers, and Australia and New Zealand
(ANZ) Banking Group (PNG) Limited, as lender, signed a loan agreement which consists of a
PGK five-year term loan facility of US$31.6 million (PGK106.9 million) and a PGK revolving
loan facility of US$5.9 million (PGK20.0 million), with interest based on ANZ’s published
Indicator Lending Rate minus an agreed margin. In 2019, SPICTL and MITL has availed of
US$17.8 million (PGK60.2 million) and US$13.8 million (PGK46.7 million), respectively, from
the term loan facility. The outstanding balance of the term loans of SPICTL and MITL

SEC Form 17-Q Q2 2020 29
amounted to US$15.5 million (PGK53.3 million) and US$12.0 million (PGK41.3 million),
respectively.
On April 14, 2020, ICTSI availed of 18-month loans from MBTC totaling to Php1.5 billion
(US$29.6 million) with interest based on the prevailing market rate. The loans will mature on
October 14, 2021.
13.4 Loan Facility Programme
On January 9, 2019, ICTSI Middle East DMCC, as the borrower, and ICTSI, as guarantor,
signed a term loan facility agreement with Citigroup Global Markets Asia Limited and Standard
Chartered Bank, the originally mandated lead arrangers and bookrunners, for the principal
amount of EUR260.0 million (US$297.6 million) with interest rate based on Euro Interbank
Offer Rate (EURIBOR) plus an agreed margin and maturity on December 20, 2022. The term
facility agreement was entered into pursuant to the Loan Facility Programme Agreement dated
July 24, 2014 between IGFBV as the borrower, ICTSI as the guarantor, and The Bank of New
York Mellon, Singapore Branch as the trustee (“Loan Programme”). ICTSI Middle East DMCC
acceded to the Loan Programme as an additional borrower and an additional obligor thereunder.
On January 10, 2019, ICTSI Middle East DMCC has fully availed of US$297.6 million
(EUR260.0 million) from the facility.
On June 12, 2019, ICTSI Middle East DMCC, as borrower, and ICTSI, as guarantor, signed an
amendment and syndication agreement with various international and local banks for the term
loan facility.
On July 15, 2019 and December 17, 2019, ICTSI Middle East DMCC prepaid US$219.1 million
(EUR195.0 million) and US$30.0 million (EUR26.8 million) of the loan.
As at June 30, 2020, the outstanding balance of the loans amounted to US$42.6 million
(EUR37.9 million), net of debt issuance costs.
13.5 Loan Covenants and Capitalized Borrowing Costs
The loans from local and foreign banks impose certain restrictions with respect to corporate
reorganization, disposition of all or a substantial portion of ICTSI’s and subsidiaries’ assets,
acquisitions of futures or stocks, and extending loans to others, except in the ordinary course of
business. ICTSI is also required to comply with a specified financial ratio relating to its debt to
EBITDA up to 4 times when incurring additional debt.
There was no material change in the covenants related to the Group’s long-term debt. As at
June 30, 2020, ICTSI and subsidiaries were in compliance with their loan covenants except for
VICT whose Debt Service Coverage Ratio requirement was not met but having been irrevocably
waived by the creditors on December 20, 2019, no event of default has occurred.
Interest expense on borrowings, net of any amount capitalized as intangible assets and property
and equipment, amounted to US$28.0 million and US$25.5 million, and US$53.7 million and
US$52.0 million for the three and six months ended June 30, 2019 and 2020, respectively
(see Notes 5 and 6). Interest expense includes amortization of debt issuance costs amounting to
US$2.2 million and US$2.0 million, and US$4.0 million and US$3.8 million for the three and
six months ended June 30, 2019 and 2020, respectively.
There were no other significant transactions pertaining to the Group’s long-term debt as at
June 30, 2020, except as discussed above.

SEC Form 17-Q Q2 2020 30
14. Other Noncurrent Liabilities
This account consists of:
December 31,
2019
June 30,
2020
Derivative liabilities (see Note 20) US$16,975 US$37,856
Pension liabilities 12,306 10,091
Government grant 8,353 7,122
Accrued taxes and others 6,595 6,977
Others 3,897 2,690
US$48,126 US$64,736
Government Grant
On March 29, 2012, BCT and Centrum Unijnych Projektow Transportowych (CUPT), a Polish
grant authority, signed a grant agreement (the “EU Grant”) whereby CUPT would grant BCT a
subsidy amounting to US$17.3 million (PLN53.9 million) and on October 21, 2013, BCT and
CUPT signed a second EU Grant whereby CUPT would grant BCT a subsidy amounting to
US$4.8 million (PLN14.6 million). The confirmation of the availability of the EU Grant is a
condition precedent to any borrowing under the facility agreement of BCT.
As at June 30, 2020, BCT has availed a total of US$19.6 million of the EU Grant. The EU
Grant is treated as deferred income and is amortized over the duration of the existing concession
agreement ending on May 31, 2023. The unamortized deferred income from government grant
amounted to US$8.4 million and US$7.1 million as at December 31, 2019 and June 30, 2020,
respectively. Amortization of deferred income included under “Other income” account of the
unaudited interim consolidated statements of income amounted to US$1.2 million both for the
six months ended June 30, 2019 and 2020.
15. Accounts Payable and Other Current Liabilities
This account includes trade payables, output and other taxes payables, accruals for interest,
salaries and benefits and other expenses, customers’ deposits, provisions for claims and losses
and other current liabilities.
16. Equity
16.1 Stock Incentive Plan (SIP)
Certain officers and employees of the Group receive remuneration through share-based payment
transactions, whereby officers and employees are given awards, in the form of ICTSI common
shares, in lieu of cash incentives and bonuses under the SIP (“equity-settled transactions”). The
SIP was approved by the stockholders of ICTSI on March 7, 2007, effective for a period of
ten years unless extended by the Board. On March 7, 2016, the Board approved for the
extension of the SIP for a further 10 years until March 2027 and the amendment of the vesting
period of the SIP. The vesting period of the SIP was amended from two years where 50% is to
vest on the first anniversary date of the award and the other 50% to vest on the second
anniversary date of the award, to three years where 25% is to vest on the first anniversary date of
the award, 25% to vest on the second anniversary date of the award, and 50% to vest on the third
anniversary date of the award. Unless the Stock Incentive Committee determines otherwise,
when dividends are declared by the Company, the number of shares subject to an award shall be
increased by the number equal in value to the dividends the awardee would have received in

SEC Form 17-Q Q2 2020 31
respect of an award had the shares awarded to the awardee vested at the time of the dividend
declaration. This is designated as the Dividend Re-investment Plan (DRIP).
The shares covered by the SIP are held under the treasury until they are awarded and issued to
the officers and employees as determined by the Stock Incentive Committee.
Stock awards, including DRIP shares, granted by the Stock Incentive Committee to officers and
employees of ICTSI and ICTSI Ltd. for the six months ended June 30, 2020 are shown below:
Grant Date
Number of Shares
Granted
Fair Value per Share
at Grant Date
March 10, 2020 2,122,621 US$1.82 (P=92.00)
April 16, 2020 182,483 US$1.48 (P=75.20)
Fair value per share was determined based on the quoted market price of stock at the date of
grant.
As at June 30, 2020, there were 47,506,569 ICTSI common shares granted in aggregate under
the SIP since it became effective in 2007. Also, as at June 30, 2020, 42,785,972 ICTSI common
shares were held under the treasury, part of which is allotted for the SIP.
Total compensation expense recognized on the vesting of the fair value of stock awards
amounted to US$0.9 million and US$1.1 million, and US$2.3 million and US$2.0 million for
the three and six months ended June 30, 2019 and 2020, respectively.
16.2 Dividends Declared
On March 20, 2020, the Board of ICTSI declared a cash dividend of US$0.07 (P=3.31) per share
for a total of US$130.1 million to stockholders of record as of April 3, 2020 with a payment date
of April 16, 2020.
16.3 Cost of Shares Held by Subsidiaries
In March 2020, IWI CTHI acquired a total of 3,271,190 ICTSI common shares for
US$5.6 million.
As at December 31, 2019 and June 30, 2020, ICTHI held 3,800,000 of ICTSI’s preferred A
shares while IWI CTHI held 734,970 and 4,006,160 common shares of ICTSI, respectively.
16.4 Treasury Shares
The Company did not acquire any of its common shares during the three-month periods ended
June 30, 2019 and 2020.

SEC Form 17-Q Q2 2020 32
16.5 Other Comprehensive Loss
This account consists of:
Cumulative
Translation
Adjustments
Mark-to-
Market Gains
(Losses) on
Derivatives
Revaluation
Increment
Unrealized
Mark-to-
Market
Gain on
Financial
Assets at
FVOCI
Share in Other
Comprehensiv
e Income
(Loss) of Joint
Ventures
Actuarial
Gains on
Defined
Benefit Plans
Total
Comprehensiv
e
Income (Loss)
Balance at January 1, 2019, as restated (US$155,126) (US$1,534) US$610 US$980 (US$1,040) US$605 (US$155,505)
Translation differences arising from
translation of foreign
operations’ financial statements 7,125 – – – – – 7,125
Net change in actuarial loss on defined
benefit plans – – – – – (113) (113)
Net change in unrealized mark-to-
market values of derivatives – (19,409) – – – – (19,409)
Net change in unrealized mark-to-
market values of financial
assets at FVOCI – – – (66) – (66)
Share in other comprehensive gain of
joint ventures – – – – 2,713 – 2,713
Income tax relating to components of
other comprehensive income – 5,363 – – – – 5,363
Balance at June 30, 2019 (US$148,001) (US$15,580) US$610 US$914 US$1,673 US$492 (US$159,892)
Cumulative
Translation
Adjustments
Mark-to-
Market Loss
on Derivatives
Revaluation
Increment
Unrealized
Mark-to-
Market Gain
Financial
Assets at
FVOCI
Share in
Other
Comprehensi
ve Income of
Joint
Ventures
Actuarial
Gains
(Losses) on
Defined
Benefit Plans
Total
Comprehensi
ve
Income
(Loss)
Balance at January 1, 2020 (US$151,767) (US$15,422) US$610 US$1,310 US$3,837 (US$1,149) (US$162,581)
Translation differences arising from
translation of foreign
operations’ financial statements (77,175) – – – – – (77,175)
Net change in actuarial loss on defined
benefit plans – – – – – (708) (708)
Net change in unrealized mark-to-
market values of derivatives – (25,004) – – – – (25,004)
Share in other comprehensive gain of
joint ventures – – – – 2,093 – 2,093
Income tax relating to components of
other comprehensive income – (2,290) – – – – (2,290)
Balance at June 30, 2020 (US$228,942) (US$42,716) US$610 US$1,310 US$5,930 (US$1,857) (US$265,665)
16.6 Perpetual Capital Securities
On January 10, 2018, the Board approved the principal terms and conditions and issuance of the
US$350.0 million 5.875 percent fixed-for-life Senior Guaranteed Perpetual Capital Securities
(the “New Securities”). The New Securities were unconditionally and irrevocably guaranteed by
ICTSI.
On January 11, 2018, the Board approved the issuance of additional Senior Guaranteed
Perpetual Capital Securities amounting to US$50.0 million (“Additional Securities”) which was
consolidated and formed a single series with the New Securities initially offered on
January 10, 2018. The Additional Securities were also unconditionally and irrevocably
guaranteed by ICTSI.
The cash proceeds received by RCBV from the issuance of the New and Additional Securities
amounted to US$392.3 million, net of debt issuance costs, which were allotted for the financing
of acquisitions and capital expenditures and for general corporate purposes.
On March 14, 2019, RCBV (the “Issuer”) and ICTSI (the “Guarantor”) sent a notice to The
Hong Kong and Shanghai Banking Corporation Limited (HSBC, as “Trustee” and “Agent”) for
the redemption of the remaining US$139.7 million of the US$300-million Senior Guaranteed
Perpetual Capital Securities (“Securities”) and payment of accrued distributions on May 5, 2019.
On May 2, 2019, RCBV redeemed the remaining US$139.7 million of the US$300-million
Senior Guaranteed Perpetual Capital Securities (“Securities”) and paid the associated accrued
distributions of US$4.4 million. The difference amounting to US$4.6 million between the
redemption price of US$139.7 million and the carrying value of the Securities of
US$135.1 million was directly charged to retained earnings.

SEC Form 17-Q Q2 2020 33
On July 16, 2020, RCBV issued US$300.0 million 5.00 percent Senior Unsecured Perpetual
Capital Securities unconditionally and irrevocably guaranteed by ICTSI at a price of
98.979 percent. The new issue was partly used to redeem the tendered US$66.5 million from the
US$450.0 million 5.50 percent Senior Guaranteed Perpetual Capital Securities (of which
US$264.9 million was outstanding) at a tender price of 100.75 percent, and pay the related
accrued distributions of US$723.8 thousand. The amount equivalent to the proceeds from the
new issue, net of debt issuance costs, was recognized as additional perpetual capital securities.
The cash proceeds received by RCBV, net of debt issuance costs and amount paid for the
redemption of the US$66.5 million 5.50 percent Senior Guaranteed Perpetual Capital Securities
including the related accrued distributions, amounted to US$226.7 million.
RCBV paid distributions amounting to US$32.5 million and US$28.2 million for the six months
ended June 30, 2019 and 2020. Interest expense on Perpetual Capital Securities, which
represents cumulative distributions to holders of Perpetual Capital Securities, amounted to
US$32.5 million and US$28.2 million for the six months ended June 30, 2019 and 2020.
However, the interest expense has not been recognized in the unaudited interim consolidated
statements of income but instead directly charged against retained earnings since the Perpetual
Capital Securities are presented as part of equity attributable to equity holders of the parent. For
purposes of computing for earnings per share, the cumulative distributions to holders of
Perpetual Capital Securities are deducted from net income attributable to equity holders of the
parent.
16.7 Non-controlling Interests
On April 10, 2019, IWI CTHI acquired 2,050,000 common shares of BIPI, representing
20% non-controlling interest from Atlantic, Gulf & Pacific Company of Manila, Inc. (AG&P)
for US$8.0 million (Php416.1 million). This transaction increased IWI CTHI’s ownership in
BIPI from 60% to 80% (see Note 1.3) and reduced non-controlling interests by US$7.5 million
(Php391.6 million). The difference between the purchase price and carrying value of the
non-controlling interest of US$0.5 million (Php24.5 million) was recognized in equity as
“Excess of consideration over the carrying value of non-controlling interests acquired or
disposed” in the 2019 unaudited interim consolidated balance sheet.
The dividends distributed to non-controlling shareholders for the six months period ended
June 30 are as follows (in thousands):
2019 2020
IDRC US$9,600 US$14,400
YICT 2,405 2,418
PICT 2,186 2,081
SBITHI – 523
BIPI – 295
AGCT 499 –
LGICT 383 –
US$15,073 US$19,717
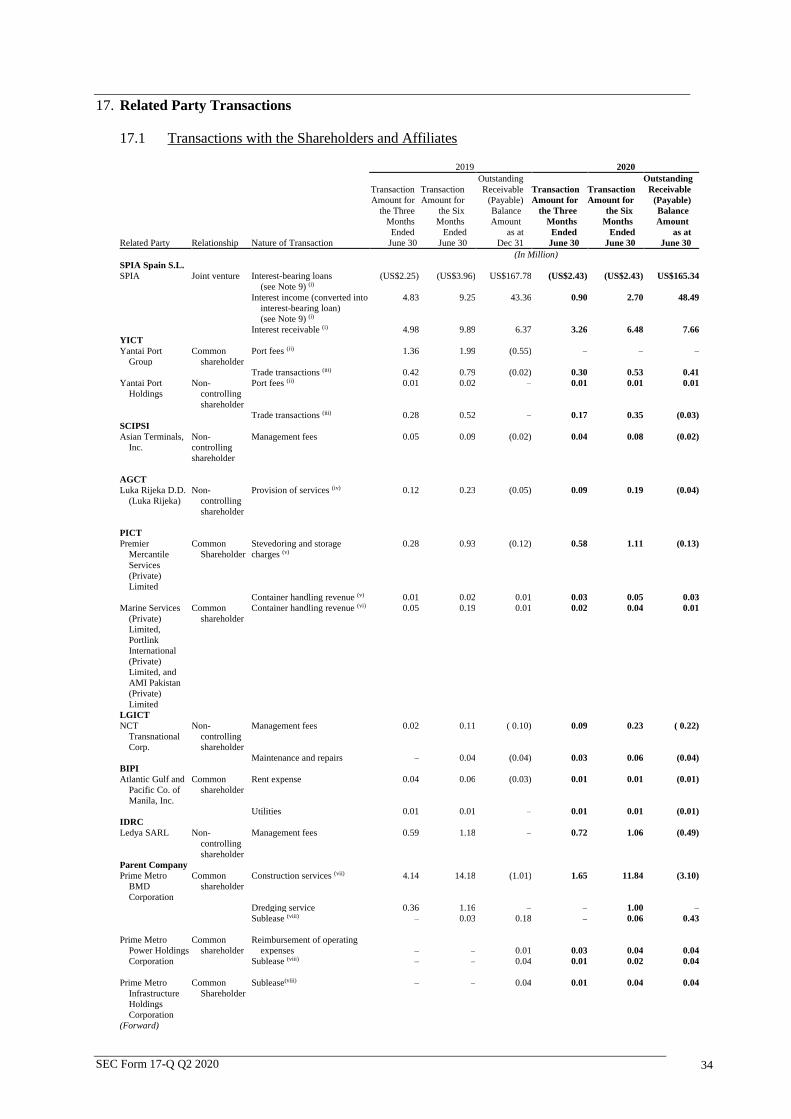
SEC Form 17-Q Q2 2020 34
17. Related Party Transactions
17.1 Transactions with the Shareholders and Affiliates
2019 2020
Related Party Relationship Nature of Transaction
Transaction
Amount for
the Three
Months
Ended
June 30
Transaction
Amount for
the Six
Months
Ended
June 30
Outstanding
Receivable
(Payable)
Balance
Amount
as at
Dec 31
Transaction
Amount for
the Three
Months
Ended
June 30
Transaction
Amount for
the Six
Months
Ended
June 30
Outstanding
Receivable
(Payable)
Balance
Amount
as at
June 30
(In Million)
SPIA Spain S.L.
SPIA Joint venture Interest-bearing loans
(see Note 9) (i)
(US$2.25) (US$3.96) US$167.78 (US$2.43) (US$2.43) US$165.34
Interest income (converted into
interest-bearing loan)
(see Note 9) (i)
4.83 9.25 43.36 0.90 2.70 48.49
Interest receivable (i) 4.98 9.89 6.37 3.26 6.48 7.66
YICT
Yantai Port
Group
Common
shareholder
Port fees (ii) 1.36 1.99 (0.55) – – –
Trade transactions (iii) 0.42 0.79 (0.02) 0.30 0.53 0.41
Yantai Port
Holdings
Non-
controlling
shareholder
Port fees (ii) 0.01 0.02 – 0.01 0.01 0.01
Trade transactions (iii) 0.28 0.52 – 0.17 0.35 (0.03)
SCIPSI
Asian Terminals,
Inc.
Non-
controlling
shareholder
Management fees 0.05 0.09 (0.02) 0.04 0.08 (0.02)
AGCT
Luka Rijeka D.D.
(Luka Rijeka)
Non-
controlling
shareholder
Provision of services (iv) 0.12 0.23 (0.05) 0.09 0.19 (0.04)
PICT
Premier
Mercantile
Services
(Private)
Limited
Common
Shareholder
Stevedoring and storage
charges (v)
0.28 0.93 (0.12) 0.58 1.11 (0.13)
Container handling revenue (v) 0.01 0.02 0.01 0.03 0.05 0.03
Marine Services
(Private)
Limited,
Portlink
International
(Private)
Limited, and
AMI Pakistan
(Private)
Limited
Common
shareholder
Container handling revenue (vi) 0.05 0.19 0.01 0.02 0.04 0.01
LGICT
NCT
Transnational
Corp.
Non-
controlling
shareholder
Management fees 0.02 0.11 ( 0.10) 0.09 0.23 ( 0.22)
Maintenance and repairs – 0.04 (0.04) 0.03 0.06 (0.04)
BIPI
Atlantic Gulf and
Pacific Co. of
Manila, Inc.
Common
shareholder
Rent expense 0.04 0.06 (0.03) 0.01 0.01 (0.01)
Utilities 0.01 0.01 – 0.01 0.01 (0.01)
IDRC
Ledya SARL Non-
controlling
shareholder
Management fees 0.59 1.18 – 0.72 1.06 (0.49)
Parent Company
Prime Metro
BMD
Corporation
Common
shareholder
Construction services (vii) 4.14 14.18 (1.01) 1.65 11.84 (3.10)
Dredging service 0.36 1.16 – – 1.00 –
Sublease (viii) – 0.03 0.18 – 0.06 0.43
Prime Metro
Power Holdings
Common
shareholder
Reimbursement of operating
expenses – – 0.01 0.03 0.04 0.04
Corporation Sublease (viii) – – 0.04 0.01 0.02 0.04
Prime Metro
Infrastructure
Common
Shareholder
Sublease(viii) – – 0.04 0.01 0.04 0.04
Holdings
Corporation
(Forward)
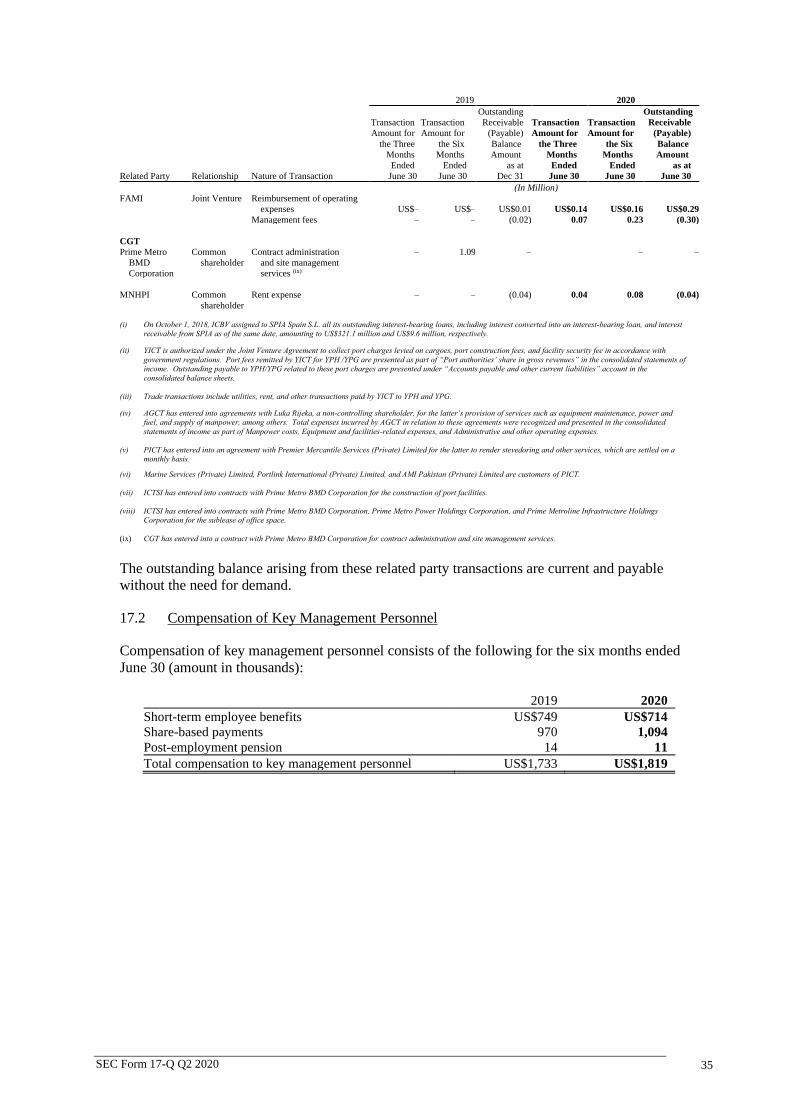
SEC Form 17-Q Q2 2020 35
2019 2020
Related Party Relationship Nature of Transaction
Transaction
Amount for
the Three
Months
Ended
June 30
Transaction
Amount for
the Six
Months
Ended
June 30
Outstanding
Receivable
(Payable)
Balance
Amount
as at
Dec 31
Transaction
Amount for
the Three
Months
Ended
June 30
Transaction
Amount for
the Six
Months
Ended
June 30
Outstanding
Receivable
(Payable)
Balance
Amount
as at
June 30
(In Million)
FAMI Joint Venture Reimbursement of operating
expenses US$– US$– US$0.01 US$0.14 US$0.16 US$0.29
Management fees – – (0.02) 0.07 0.23 (0.30)
CGT
Prime Metro
BMD
Corporation
Common
shareholder
Contract administration
and site management
services (ix)
– 1.09 – – –
MNHPI Common
shareholder
Rent expense – – (0.04) 0.04 0.08 (0.04)
(i) On October 1, 2018, ICBV assigned to SPIA Spain S.L. all its outstanding interest-bearing loans, including interest converted into an interest-bearing loan, and interest
receivable from SPIA as of the same date, amounting to US$321.1 million and US$9.6 million, respectively.
(ii) YICT is authorized under the Joint Venture Agreement to collect port charges levied on cargoes, port construction fees, and facility security fee in accordance with
government regulations. Port fees remitted by YICT for YPH /YPG are presented as part of “Port authorities’ share in gross revenues” in the consolidated statements of
income. Outstanding payable to YPH/YPG related to these port charges are presented under “Accounts payable and other current liabilities” account in the
consolidated balance sheets.
(iii) Trade transactions include utilities, rent, and other transactions paid by YICT to YPH and YPG.
(iv) AGCT has entered into agreements with Luka Rijeka, a non-controlling shareholder, for the latter’s provision of services such as equipment maintenance, power and
fuel, and supply of manpower, among others. Total expenses incurred by AGCT in relation to these agreements were recognized and presented in the consolidated
statements of income as part of Manpower costs, Equipment and facilities-related expenses, and Administrative and other operating expenses.
(v) PICT has entered into an agreement with Premier Mercantile Services (Private) Limited for the latter to render stevedoring and other services, which are settled on a
monthly basis.
(vi) Marine Services (Private) Limited, Portlink International (Private) Limited, and AMI Pakistan (Private) Limited are customers of PICT.
(vii) ICTSI has entered into contracts with Prime Metro BMD Corporation for the construction of port facilities.
(viii) ICTSI has entered into contracts with Prime Metro BMD Corporation, Prime Metro Power Holdings Corporation, and Prime Metroline Infrastructure Holdings
Corporation for the sublease of office space.
(ix) CGT has entered into a contract with Prime Metro BMD Corporation for contract administration and site management services.
The outstanding balance arising from these related party transactions are current and payable
without the need for demand.
17.2 Compensation of Key Management Personnel
Compensation of key management personnel consists of the following for the six months ended
June 30 (amount in thousands):
2019 2020
Short-term employee benefits US$749 US$714
Share-based payments 970 1,094
Post-employment pension 14 11
Total compensation to key management personnel US$1,733 US$1,819

SEC Form 17-Q Q2 2020 36
18. Earnings Per Share Computation
The table below shows the computation of basic and diluted earnings per share for the three and
six months ended June 30 (amounts are in thousands, except number of shares and per share
data):
For the Three Months Ended June 30 For the Six Months Ended June 30
2019
(Unaudited)
2020
(Unaudited)
2019
(Unaudited)
2020
(Unaudited)
Net income attributable to equity holders of the parent, as presented in the unaudited interim
consolidated statements of income US$56,067 US$53,782 US$128,470 US$113,379
Adjustment for the effect of cumulative distribution on subordinated perpetual capital
securities (see Note 16.6) (16,270) (14,087) (32,539) (28,174)
Net income attributable to equity holders of the
parent, as adjusted (a) US$39,797 US$39,695 US$95,931 US$85,205
Common shares outstanding at beginning of year 2,045,177,671 2,045,177,671 2,045,177,671 2,045,177,671
Weighted treasury shares (32,180,968) (43,234,245) (32,180,968) (43,234,245)
Weighted shares held by subsidiaries (734,970) (3,188,363) (734,970) (3,188,363)
Weighted average shares outstanding (b) 2,012,261,733 1,998,755,063 2,012,261,733 1,998,755,063
Effect of dilutive stock awards 3,807,507 4,273,099 3,807,507 4,273,099
Weighted average shares outstanding adjusted for
potential common shares (c) 2,016,069,240 2,003,028,162 2,016,069,240 2,003,028,162
Basic earnings per share (a/b) US$0.020 US$0.020 US$0.048 US$0.043
Diluted earnings per share (a/c) US$0.020 US$0.020 US$0.048 US$0.043
19. Contingencies
Due to the nature of the Group’s business, it is involved in various legal proceedings, both as
plaintiff and defendant, from time to time. Management and its legal counsels believe that the
Group has substantial legal and factual bases for its position and is of the opinion that losses
arising from the existing legal actions and proceedings, if any, will not have a material adverse
impact on the Group’s interim condensed consolidated financial position and results of
operations.
20. Financial Instruments
20.1 Fair values
Set out below is a comparison of carrying amounts and fair values of the Group’s financial
instruments by category whose fair value is different from its carrying amount (amount in
thousands):
December 31, 2019 June 30, 2020
Carrying Amount Fair Value Carrying Amount Fair Value
Financial Liabilities
Other financial liabilities:
Long-term debt US$1,662,629 US$1,752,912 US$1,769,349 US$1,861,253
Lease liabilities 1,189,175 1,191,281 1,108,139 1,356,568
Concession rights payable 660,741 646,423 632,530 700,549
US$3,512,545 US$3,590,616 US$3,510,018 US$3,918,370
Carrying values of cash and cash equivalents, receivables, accounts payable and other current
liabilities and loans payable approximate their fair values due to the short-term nature of the
transactions.
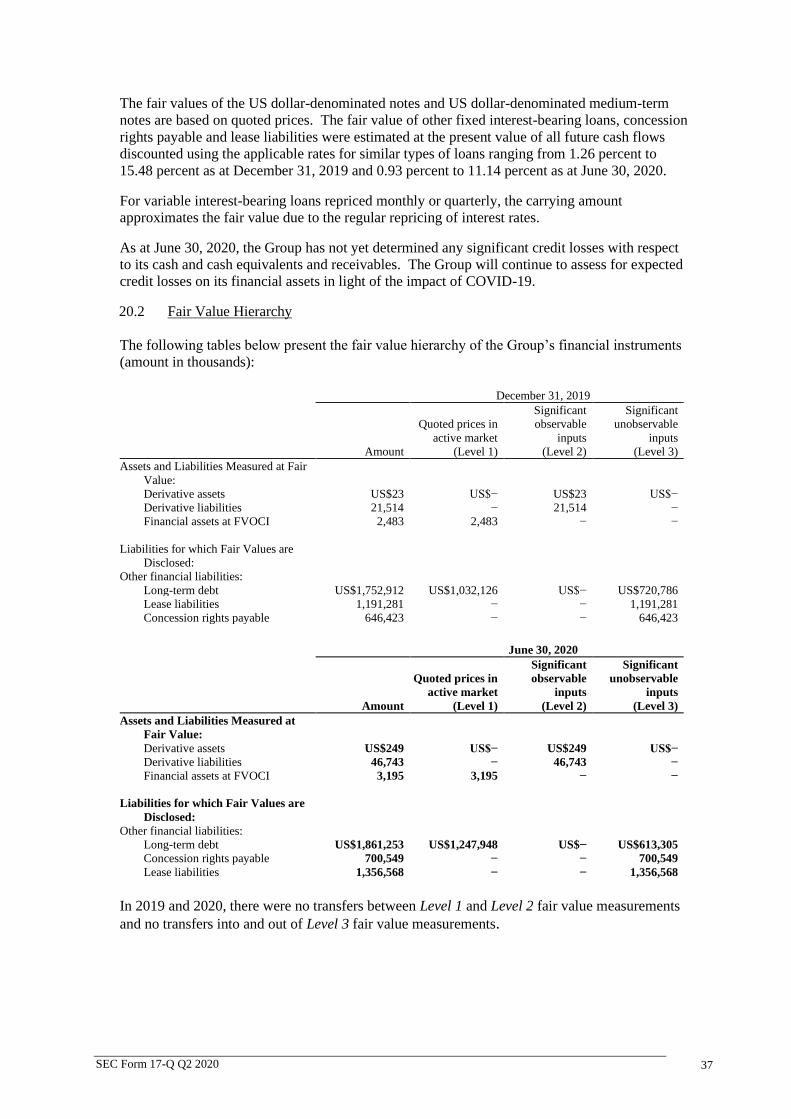
SEC Form 17-Q Q2 2020 37
The fair values of the US dollar-denominated notes and US dollar-denominated medium-term
notes are based on quoted prices. The fair value of other fixed interest-bearing loans, concession
rights payable and lease liabilities were estimated at the present value of all future cash flows
discounted using the applicable rates for similar types of loans ranging from 1.26 percent to
15.48 percent as at December 31, 2019 and 0.93 percent to 11.14 percent as at June 30, 2020.
For variable interest-bearing loans repriced monthly or quarterly, the carrying amount
approximates the fair value due to the regular repricing of interest rates.
As at June 30, 2020, the Group has not yet determined any significant credit losses with respect
to its cash and cash equivalents and receivables. The Group will continue to assess for expected
credit losses on its financial assets in light of the impact of COVID-19.
20.2 Fair Value Hierarchy
The following tables below present the fair value hierarchy of the Group’s financial instruments
(amount in thousands):
December 31, 2019
Amount
Quoted prices in
active market
(Level 1)
Significant
observable
inputs
(Level 2)
Significant
unobservable
inputs
(Level 3)
Assets and Liabilities Measured at Fair
Value:
Derivative assets US$23 US$− US$23 US$−
Derivative liabilities 21,514 − 21,514 −
Financial assets at FVOCI 2,483 2,483 − −
Liabilities for which Fair Values are
Disclosed:
Other financial liabilities:
Long-term debt US$1,752,912 US$1,032,126 US$− US$720,786
Lease liabilities 1,191,281 − − 1,191,281
Concession rights payable 646,423 − − 646,423
June 30, 2020
Amount
Quoted prices in
active market
(Level 1)
Significant
observable
inputs
(Level 2)
Significant
unobservable
inputs
(Level 3)
Assets and Liabilities Measured at
Fair Value:
Derivative assets US$249 US$− US$249 US$−
Derivative liabilities 46,743 − 46,743 −
Financial assets at FVOCI 3,195 3,195 − −
Liabilities for which Fair Values are
Disclosed:
Other financial liabilities:
Long-term debt US$1,861,253 US$1,247,948 US$− US$613,305
Concession rights payable 700,549 − − 700,549
Lease liabilities 1,356,568 − − 1,356,568
In 2019 and 2020, there were no transfers between Level 1 and Level 2 fair value measurements
and no transfers into and out of Level 3 fair value measurements.
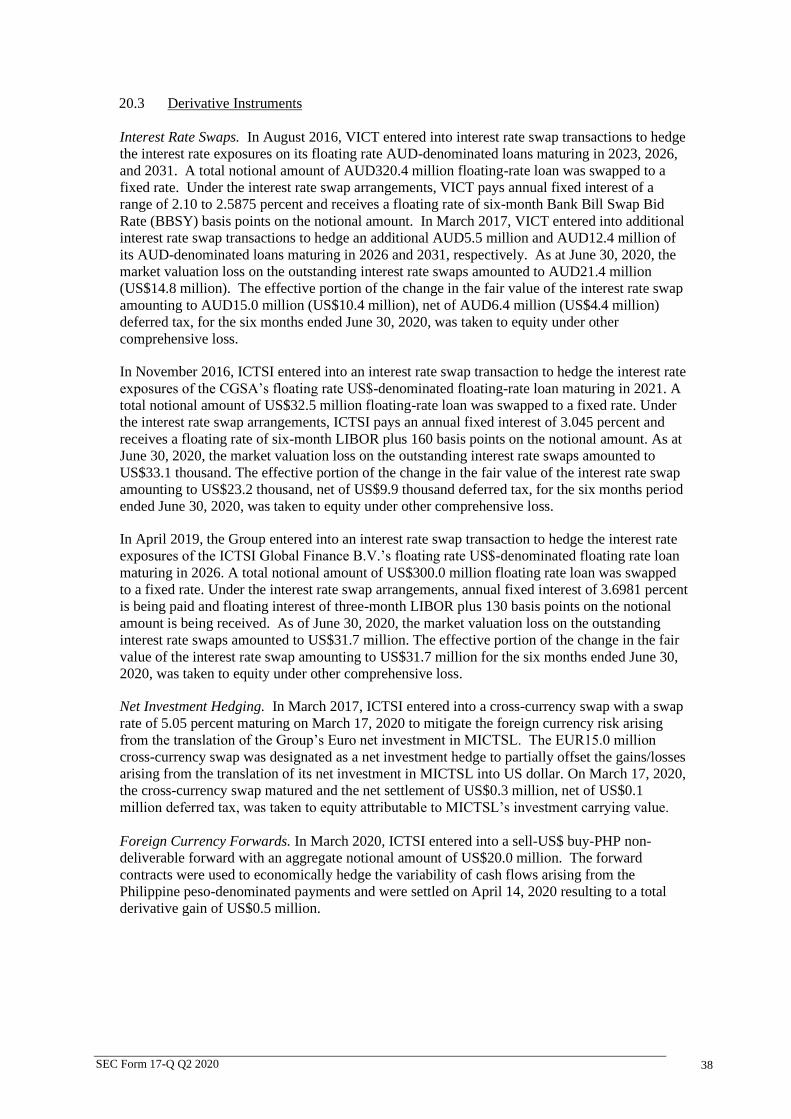
SEC Form 17-Q Q2 2020 38
20.3 Derivative Instruments
Interest Rate Swaps. In August 2016, VICT entered into interest rate swap transactions to hedge
the interest rate exposures on its floating rate AUD-denominated loans maturing in 2023, 2026,
and 2031. A total notional amount of AUD320.4 million floating-rate loan was swapped to a
fixed rate. Under the interest rate swap arrangements, VICT pays annual fixed interest of a
range of 2.10 to 2.5875 percent and receives a floating rate of six-month Bank Bill Swap Bid
Rate (BBSY) basis points on the notional amount. In March 2017, VICT entered into additional
interest rate swap transactions to hedge an additional AUD5.5 million and AUD12.4 million of
its AUD-denominated loans maturing in 2026 and 2031, respectively. As at June 30, 2020, the
market valuation loss on the outstanding interest rate swaps amounted to AUD21.4 million
(US$14.8 million). The effective portion of the change in the fair value of the interest rate swap
amounting to AUD15.0 million (US$10.4 million), net of AUD6.4 million (US$4.4 million)
deferred tax, for the six months ended June 30, 2020, was taken to equity under other
comprehensive loss.
In November 2016, ICTSI entered into an interest rate swap transaction to hedge the interest rate
exposures of the CGSA’s floating rate US$-denominated floating-rate loan maturing in 2021. A
total notional amount of US$32.5 million floating-rate loan was swapped to a fixed rate. Under
the interest rate swap arrangements, ICTSI pays an annual fixed interest of 3.045 percent and
receives a floating rate of six-month LIBOR plus 160 basis points on the notional amount. As at
June 30, 2020, the market valuation loss on the outstanding interest rate swaps amounted to
US$33.1 thousand. The effective portion of the change in the fair value of the interest rate swap
amounting to US$23.2 thousand, net of US$9.9 thousand deferred tax, for the six months period
ended June 30, 2020, was taken to equity under other comprehensive loss.
In April 2019, the Group entered into an interest rate swap transaction to hedge the interest rate
exposures of the ICTSI Global Finance B.V.’s floating rate US$-denominated floating rate loan
maturing in 2026. A total notional amount of US$300.0 million floating rate loan was swapped
to a fixed rate. Under the interest rate swap arrangements, annual fixed interest of 3.6981 percent
is being paid and floating interest of three-month LIBOR plus 130 basis points on the notional
amount is being received. As of June 30, 2020, the market valuation loss on the outstanding
interest rate swaps amounted to US$31.7 million. The effective portion of the change in the fair
value of the interest rate swap amounting to US$31.7 million for the six months ended June 30,
2020, was taken to equity under other comprehensive loss.
Net Investment Hedging. In March 2017, ICTSI entered into a cross-currency swap with a swap
rate of 5.05 percent maturing on March 17, 2020 to mitigate the foreign currency risk arising
from the translation of the Group’s Euro net investment in MICTSL. The EUR15.0 million
cross-currency swap was designated as a net investment hedge to partially offset the gains/losses
arising from the translation of its net investment in MICTSL into US dollar. On March 17, 2020,
the cross-currency swap matured and the net settlement of US$0.3 million, net of US$0.1
million deferred tax, was taken to equity attributable to MICTSL’s investment carrying value.
Foreign Currency Forwards. In March 2020, ICTSI entered into a sell-US$ buy-PHP non-
deliverable forward with an aggregate notional amount of US$20.0 million. The forward
contracts were used to economically hedge the variability of cash flows arising from the
Philippine peso-denominated payments and were settled on April 14, 2020 resulting to a total
derivative gain of US$0.5 million.

SEC Form 17-Q Q2 2020 39
21. Trends, Events, or Uncertainties Affecting Recurring Revenues and Profit
The Group is exposed to a number of trends, events, and uncertainties which can affect its
recurring revenues and profits. These include levels of general economic activity and
containerized trade volume in countries where it operates, as well as certain cost items, such as
labor, fuel, and power. In addition, the Group operates in a number of jurisdictions other than the
Philippines and collects revenues in various currencies. Continued appreciation of the US dollar
relative to other major currencies, particularly the Philippine peso, Australian dollar, Brazilian
real, Mexican peso, and the Euro, may adversely affect the Group’s reported levels of revenues
and profits.
On March 11, 2020, the World Health Organization has declared the novel coronavirus
(COVID-19) outbreak a global pandemic.
In the Philippines, in a move to contain the COVID-19 outbreak, the Office of the President of
the Philippines issued a Memorandum directive on March 13, 2020 to impose stringent social
distancing measures in the National Capital Region effective March 15, 2020. On
March 16, 2020, Presidential Proclamation No. 929 was issued, declaring a State of Calamity
throughout the Philippines for a period of six (6) months and imposed an enhanced community
quarantine (ECQ) throughout the island of Luzon until April 12, 2020, which was extended to
April 30, 2020. Through several extensions, Metro Manila and certain areas of the country were
placed under different categories of community quarantine depending on the risk classification
of the area.
Likewise, government authorities in other countries where the Group operates, adopted
measures, including lockdowns, to control the spread of the virus and mitigate the impact of the
outbreak.
These measures have caused disruptions to businesses, global supply chain, and economic
activities, and its impact continues to evolve.
The scale and duration of these developments remain uncertain as of the report date. The Group
has started to observe declines in general business, including container throughput and revenues.
It is not possible to estimate the overall impact of the outbreak’s near-term and longer effects,
however, the Group has already incurred and will continue to incur costs as the Group continue
to mitigate the adverse impact of the outbreak on its operations. The outbreak could have a
material impact on the Group’s financial results for the rest of 2020 and even periods thereafter.

SEC Form 17-Q Q2 2020 40
Item 2. Management’s Discussion and Analysis or Plan of Operations
The following discussion and analysis relate to the consolidated financial position and results of
operations of ICTSI and its wholly and majority-owned subsidiaries (collectively known as “ICTSI
Group”) and should be read in conjunction with the accompanying unaudited interim consolidated
financial statements and related notes as of and for the quarter ended June 30, 2020. References to
“ICTSI”, “the Company”, and “Parent Company” pertain to ICTSI Parent Company, while
references to “the Group” pertain to ICTSI and its subsidiaries.
2.1 Overview
The Group is an international operator of common user container terminals serving the global
container shipping industry. Its business is the acquisition, development, operation and management
of container terminals focusing on facilities with total annual throughput ranging from 50,000 to
3,000,000 twenty-foot equivalent units (TEUs). It also handles general cargoes and provides a
number of ancillary services such as storage, container packing and unpacking, inspection, weighing,
and services for refrigerated containers or reefers. As of report date, the Group is involved in 32
terminal concessions and port development projects in 19 countries worldwide. There are ten
terminal operations, including an inland container terminal, a barge terminal, and combined terminal
operations in Subic in the Philippines, two each in Indonesia, Papua New Guinea and Brazil; one
each in China, Ecuador, Poland, Georgia, Madagascar, Croatia, Pakistan, Mexico, Honduras, Iraq,
Argentina, Colombia, Democratic Republic (DR) of Congo, and Australia; an existing concession to
construct, develop and operate a port in Tuxpan, Mexico, and a recently signed concession to
develop, operate and maintain the multipurpose terminal in Kribi, Cameroon.
ICTSI was established in 1987 in connection with the privatization of Manila International Container
Terminal (MICT) in the Port of Manila, and has built upon the experience gained in rehabilitating,
developing and operating MICT to establish an extensive international network concentrated in
emerging market economies. International acquisitions principally in Asia, Europe, Middle East and
Africa (EMEA), and Americas substantially contributed to the growth in volume, revenues,
EBITDA, and net income. ICTSI’s business strategy is to continue to develop its existing portfolio
of terminals and proactively seek acquisition opportunities that meet its investment criteria.
The Group operates principally in one industry segment which is cargo handling and related
services. ICTSI has organized its business into three geographical segments:
▪ Asia
o Manila - Manila International Container Terminal, Port of Manila, Philippines (MICT)
o Zambales - New Container Terminal (NCT) 1 and 2, Subic Bay Freeport Zone, Olongapo
City, Philippines (SBITC/ICTSI Subic)
o Batangas - Bauan Terminal, Bauan, Philippines (BIPI)
o Laguna - Laguna Gateway Inland Container Terminal, Calamba City, Laguna, Philippines
(LGICT)
o Cavite - Cavite Gateway Terminal, Tanza, Cavite, Philippines (CGT)
o Davao - Sasa Wharf, Port of Davao (DIPSSCOR) and Hijo International Port, Davao del
Norte, Philippines (HIPS)
o General Santos - Makar Wharf, Port of General Santos, Philippines (SCIPSI)
o Misamis Oriental - Phividec Industrial Estate, Tagaloan, Philippines (MICTSI)
o Manila - Manila North Harbour Port, Inc., North Harbor, Manila, Philippines (MNHPI)
o Indonesia - Makassar Port Container Terminal, Makassar, South Sulawesi, Indonesia (MTS)
and Port of Tanjung Priok, Jakarta, Indonesia (OJA)
o China - Yantai International Container Terminal, Port of Yantai, Shandong Province, China
(YICT)
o Pakistan - Port of Karachi, Karachi, Pakistan (PICT)
o Australia - Webb Dock Container Terminal and ECP at Webb Dock East, Port of
Melbourne, Australia (VICT)

SEC Form 17-Q Q2 2020 41
o Papua New Guinea - Port of Motukea, Papua New Guinea (MITL) and Port of Lae, Papua
New Guinea (SPICTL)
▪ EMEA
o Poland - Baltic Container Terminal, Gdynia, Poland (BCT)
o Georgia - Port of Batumi, Batumi, Georgia (BICTL)
o Croatia - Brajdica Container Terminal, Rijeka, Croatia (AGCT)
o Madagascar - Port of Toamasina, Toamasina, Madagascar (MICTSL)
o DR Congo - Matadi Gateway Terminal, Mbengu, Matadi, Democratic Republic of Congo
(IDRC)
o Iraq - Basra Gateway Terminal at Port of Umm Qasr, Iraq (ICTSI Iraq)
▪ Americas
o Brazil - Suape Container Terminal, Suape, Brazil (TSSA) and Terminal de Contêineres, Port
of Rio de Janeiro City, Brazil (ICTSI Rio)
o Ecuador - Port of Guayaquil, Guayaquil, Ecuador (CGSA)
o Argentina - Port of La Plata, Buenos Aires Province, Argentina (Tecplata)
o Mexico - Port of Manzanillo, Manzanillo, Mexico (CMSA) and Port of Tuxpan, Mexico
(TMT)
o Colombia - Port of Buenaventura, Buenaventura, Colombia (SPIA)
o Honduras - Puerto Cortés, Republic of Honduras (OPC)
Concessions for port operations entered into, acquired, developed and terminated by ICTSI and
subsidiaries for the last two years are summarized below:
Port of Rio de Janeiro City, Brazil. On July 19, 2019, ICTSI, through its wholly-owned subsidiary
ICTSI Americas B.V, signed a Share Purchase Agreement with Boreal Empreendimentos e
Participações S.A. (Boreal) to acquire 100% of the shares of Libra Terminal Rio S.A. (now ICTSI
Rio Brasil Terminal 1 S.A.), which holds the concession rights to operate, manage and develop the
container terminal Terminal de Contêineres 1 (T1Rio) in the port of Rio de Janeiro City, Federative
Republic of Brazil. The concession of T1Rio commenced in 1998 and was extended in 2011 until
2048. On December 12, 2019, the Share Purchase Agreement was completed after all conditions
precedent and required regulatory approvals were obtained, and on the same day, ICTSI took over
the operations of T1Rio.
Manila North Harbour Port, Inc., Philippines. On September 21, 2017, the BOD of ICTSI granted
the authority to acquire shares in MNHPI. On the same date, ICTSI signed a Share Purchase
Agreement (SPA) with Petron Corporation for the acquisition of 10,449,000 MNHPI shares,
representing 34.83% of the total issued and outstanding shares of MNHPI for a consideration of
Php1.75 billion (US$33.8 million). The completion of the SPA was subject to several conditions,
one of which was the approval of the acquisition by the Philippine Ports Authority (PPA) which was
obtained on October 20, 2017. The SPA was completed on October 30, 2017. An additional
investment cost of Php2.45 billion (US$47.3 million) was incurred in relation to this acquisition.
On September 5, 2018, ICTSI has signed a SPA with Harbour Centre Port Terminal, Inc. (HCPTI)
for the acquisition of 4,550,000 shares in MNHPI from HCPTI. The subject shares represent
15.17% of the total issued and outstanding shares of MNHPI. The consideration is Php910.0 million
(US$17.3 million). The Philippine Competition Commission and the PPA approved the acquisition
of shares on March 15, 2019 and April 26, 2019, respectively. With the approval of the PPA,
ICTSI's shareholdings in MNHPI increased from 34.83% to 50.00% effective on April 26, 2019. An
additional investment cost of Php2.7 billion (US$50.3 million) was incurred in relation to this
acquisition.
Port of Motukea and Port of Lae, Papua New Guinea. In September 2017, ICTSI received a
notification from PNG Ports Corporation Limited (PNGPCL), a Papua New Guinea (PNG) state-
owned enterprise, of the confirmation by the Independent Consumer and Competition Commission

SEC Form 17-Q Q2 2020 42
in PNG with respect to the two 25-year agreements signed by ICTSI through its subsidiaries,
Motukea International Terminal Limited (MITL) and South Pacific International Container Terminal
Limited (SPICTL), with PNGPCL for the operation, management and development of the two
international ports in Motukea and Lae in PNG.
SPICTL and MITL were allowed by PNGPCL to take over the port facilities and begin operations at
the Port of Lae in February 2018 and at the Port of Motukea in May 2018, respectively. The
terminal operating agreements and other related contracts took effect on June 1, 2018 after all the
parties have complied with the agreed conditions precedent.
Port of Kribi, Cameroon. On June 14, 2019, ICTSI was declared as the preferred bidder for the
concession of Multi-Purpose Terminal of the Port of Kribi, Cameroon by the port authority, Port
Autoneme de Kribi (PAK).
On July 27, 2020, the 25-year concession contract was officially signed by Kribi Multipurpose
Terminal (KMT), a Cameroonian subsidiary of ICTSI, and PAK.
Under the concession contract, KMT will develop, operate and maintain the multipurpose facility at
Kribi, a newly built deep-water port located 150 kilometers South of Douala. Phase 1 consists of 265
meters of berth and a 10-hectare yard.
Phase 2 consists of an additional 350 meters of berth and a 23-hectare yard. Kribi port is surrounded
by the Kribi Industrial Area, a 262 square-kilometer zone intended to accommodate new industrial
and logistical developments that support the growing economy of Cameroon and the Cameroon-
Chad-Central African Republic transit corridor.
Extension of Contracts
Port of Guayaquil, Guayaquil, Ecuador. On December 3, 2019, ICTSI, through its subsidiary,
CGSA which operates the Port of Guayaquil in Ecuador, signed an extension to its Concession
Agreement with the La Autoridad Portuaria de Guayaquil which extended the original Concession
Agreement until December 31, 2046 from the original term until July 31, 2027.
Davao Sasa Port, Philippines. On April 21, 2006, the Philippine Ports Authority (PPA) granted
DIPSSCOR a ten-year contract for cargo handling services at Sasa Wharf, Port of Davao in the
Philippines that expired on April 20, 2016. Thereafter, the PPA granted DIPSSCOR a series of
hold-over authority (HOA) on a temporary basis over the cargo handling services at Sasa Wharf,
Port of Davao. On May 8, 2019, the PPA granted to DIPSSCOR the HOA to operate arrastre,
stevedoring and related cargo handling services which was valid from February 27, 2019 until
December 31, 2019. Pursuant to the PPA Memorandum Circular No. 15-2020 dated April 7, 2020,
“Guidelines in the Processing of PPA Permits During the Enhanced Community Quarantine (ECQ)
Due to COVID-19 Pandemic”, all HOAs to operate cargo handling services that expired/are expiring
during the ECQ period are deemed extended until June 30, 2020, unless extended by the PPA. On
June 30, 2020, the PPA issued Memorandum Circular No. 23-2020, “Extension of Validity of PPA
Approvals/Permits During the Enhanced Community Quarantine (ECQ), Modified ECQ (MECQ),
and General CQ (GCQ) Due to COVID-19 Pandemic ”, in view of the extension of the community
quarantine with an intention to extend all HOAs to operate cargo handling services that expired/are
expiring during the ECQ/MECQ/GCQ periods until July 31, 2020.
Makar Wharf, Port of General Santos, South Cotabato, Philippines. On February 20, 2006, the PPA
granted South Cotabato Integrated Port Services, Inc. (SCIPSI) a ten-year contract for the exclusive
management and operation of arrastre, stevedoring, bagging and crated cargo handling services at
Makar Wharf, Port of General Santos, General Santos City in the Philippines that expired on
February 19, 2016. Thereafer, the PPA granted SCIPSI a series of HOA on a temporary basis over
the cargo handling services at Makar Wharf, Port of General Santos. On December 3, 2019, the
PPA granted to SCIPSI the HOA to operate arrastre, stevedoring and related cargo handling services
which was valid from February 25, 2019 until December 31, 2019. Pursuant to the PPA
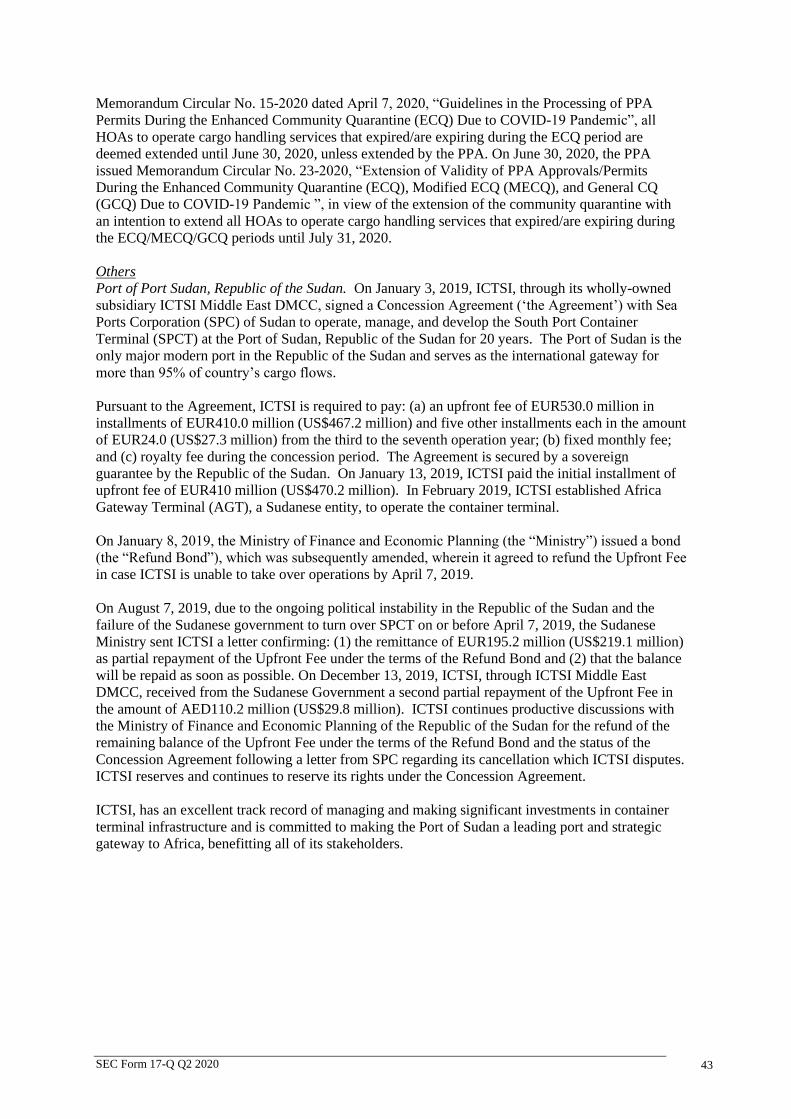
SEC Form 17-Q Q2 2020 43
Memorandum Circular No. 15-2020 dated April 7, 2020, “Guidelines in the Processing of PPA
Permits During the Enhanced Community Quarantine (ECQ) Due to COVID-19 Pandemic”, all
HOAs to operate cargo handling services that expired/are expiring during the ECQ period are
deemed extended until June 30, 2020, unless extended by the PPA. On June 30, 2020, the PPA
issued Memorandum Circular No. 23-2020, “Extension of Validity of PPA Approvals/Permits
During the Enhanced Community Quarantine (ECQ), Modified ECQ (MECQ), and General CQ
(GCQ) Due to COVID-19 Pandemic ”, in view of the extension of the community quarantine with
an intention to extend all HOAs to operate cargo handling services that expired/are expiring during
the ECQ/MECQ/GCQ periods until July 31, 2020.
Others
Port of Port Sudan, Republic of the Sudan. On January 3, 2019, ICTSI, through its wholly-owned
subsidiary ICTSI Middle East DMCC, signed a Concession Agreement (‘the Agreement’) with Sea
Ports Corporation (SPC) of Sudan to operate, manage, and develop the South Port Container
Terminal (SPCT) at the Port of Sudan, Republic of the Sudan for 20 years. The Port of Sudan is the
only major modern port in the Republic of the Sudan and serves as the international gateway for
more than 95% of country’s cargo flows.
Pursuant to the Agreement, ICTSI is required to pay: (a) an upfront fee of EUR530.0 million in
installments of EUR410.0 million (US$467.2 million) and five other installments each in the amount
of EUR24.0 (US$27.3 million) from the third to the seventh operation year; (b) fixed monthly fee;
and (c) royalty fee during the concession period. The Agreement is secured by a sovereign
guarantee by the Republic of the Sudan. On January 13, 2019, ICTSI paid the initial installment of
upfront fee of EUR410 million (US$470.2 million). In February 2019, ICTSI established Africa
Gateway Terminal (AGT), a Sudanese entity, to operate the container terminal.
On January 8, 2019, the Ministry of Finance and Economic Planning (the “Ministry”) issued a bond
(the “Refund Bond”), which was subsequently amended, wherein it agreed to refund the Upfront Fee
in case ICTSI is unable to take over operations by April 7, 2019.
On August 7, 2019, due to the ongoing political instability in the Republic of the Sudan and the
failure of the Sudanese government to turn over SPCT on or before April 7, 2019, the Sudanese
Ministry sent ICTSI a letter confirming: (1) the remittance of EUR195.2 million (US$219.1 million)
as partial repayment of the Upfront Fee under the terms of the Refund Bond and (2) that the balance
will be repaid as soon as possible. On December 13, 2019, ICTSI, through ICTSI Middle East
DMCC, received from the Sudanese Government a second partial repayment of the Upfront Fee in
the amount of AED110.2 million (US$29.8 million). ICTSI continues productive discussions with
the Ministry of Finance and Economic Planning of the Republic of the Sudan for the refund of the
remaining balance of the Upfront Fee under the terms of the Refund Bond and the status of the
Concession Agreement following a letter from SPC regarding its cancellation which ICTSI disputes.
ICTSI reserves and continues to reserve its rights under the Concession Agreement.
ICTSI, has an excellent track record of managing and making significant investments in container
terminal infrastructure and is committed to making the Port of Sudan a leading port and strategic
gateway to Africa, benefitting all of its stakeholders.

SEC Form 17-Q Q2 2020 44
2.2 Results of Operations and Key Performance Indicators
2.2.1 Results of Operations
The following table shows a summary of the results of operations for the second quarter and
six months ended June 30, 2020 as compared with the same period in 2019 as derived from the
accompanying unaudited interim consolidated financial statements.
Table 2.1 Unaudited Consolidated Statements of Income
For the Three Months Ended June 30 For the Six Months Ended June 30
(In thousands, except % change data) 2019 2020 % Change 2019 2020 % Change
Gross revenues from port operations US$368,001 US$348,485 (5.3) US$751,785 US$724,261 (3.7)
Revenues from port operations,
net of port authorities’ share 321,871 308,011 (4.3) 656,442 639,204 (2.6)
Total income (net revenues, interest and
other income) 334,901 316,133 (5.6) 679,619 657,336 (3.3)
Total expenses (operating, financing and
other expenses) 251,776 234,564 (6.8) 493,151 491,218 (0.4)
EBITDA1 201,856 204,218 1.2 424,399 416,370 (1.9)
EBIT2 144,023 148,938 3.4 309,174 305,360 (1.2)
Net income attributable to equity holders of
the parent 56,067 53,782 (4.1) 128,470 113,379 (11.7)
Earnings per share
Basic US$0.020 US$0.020 0.0 US$0.048 US$0.043 -10.4
Diluted 0.020 0.020 0.0 0.048 0.043 -10.4
__________________ 1 EBITDA is not a uniform or legally defined financial measure. It generally represents earnings before interest, taxes, depreciation and amortization. EBITDA is presented because the Group believes it is an important measure of its performance and liquidity.
EBITDA is also frequently used by securities analysts, investors and other interested parties in the evaluation of companies in the
industry.
The Group’s EBITDA figures are not; however, readily comparable with other companies’ EBITDA figures as they are calculated
differently and thus, must be read in conjunction with related additional explanations. EBITDA has limitations as an analytical tool and should not be considered in isolation or as a substitute for analysis of the Group’s results as reported under PFRS. Some of the
limitations concerning EBITDA are:
▪ EBITDA does not reflect cash expenditures or future requirements for capital expenditures or contractual
commitments;
▪ EBITDA does not reflect changes in, or cash requirements for working capital needs; ▪ EBITDA does not reflect fixed (and in-substance fixed) port fees and lease payments that are capitalized as concession
assets under IFRIC 12 and right-of-use assets under PFRS 16;
▪ EBITDA does not reflect the interest expense, or the cash requirements necessary to service interest or principal debt payments;
▪ Although depreciation and amortization are non-cash charges, the assets being depreciated or amortized will often
have to be replaced in the future, and EBITDA does not reflect any cash requirements for such replacements; and ▪ Other companies in the industry may calculate EBITDA differently, which may limit its usefulness as a comparative
measure.
Because of these limitations, EBITDA should not be considered as a measure of discretionary cash available to the Group to invest in
the growth of the business. The Group compensates for these limitations by relying primarily on the PFRS results and uses EBITDA
only as supplementary information. 2 EBIT, or Earnings Before Interest and Taxes, is calculated by taking net revenues from port operations and deducting cash
operating expenses and depreciation and amortization.

SEC Form 17-Q Q2 2020 45
The following table presents the computation of EBITDA as derived from the Group’s unaudited
interim consolidated net income attributable to equity holders of the parent for the second quarter
and six months ended June 30, 2020 as compared with the same period in 2019:
Table 2.2 EBITDA Computation
For the Three Months Ended June 30
For the Six Months Ended June 30
(In thousands, except % change data) 2019 2020 % Change 2019 2020 % Change
Net income attributable to equity holders
of the parent US$56,067 US$53,782 (4.1) US$128,470 US$113,379 (11.7)
Minority interests 8,498 8,690 2.3 17,600 17,931 1.9
Provision for income tax 18,560 19,097 2.9 40,398 34,808 (13.8)
Income before income tax 83,125 81,569 (1.9) 186,468 166,118 (10.9)
Add (deduct):
Depreciation and amortization 57,833 55,280 (4.4) 115,225 111,010 (3.7)
Interest and other expenses 73,928 75,491 2.1 145,883 157,374 7.9
Interest and other income (13,030) (8,122) (37.7) (23,177) (18,132) (21.8)
EBITDA US$201,856 US$204,218 1.2 US$424,399 US$416,370 (1.9)
2.2.2 Key Performance Indicators
The five (5) key performance indicators (KPIs) include gross moves per hour per crane, crane
availability and berth utilization, which affect the operations of the Group, and volume growth in
twenty-foot equivalent unit (TEU) and gross revenue growth, which are both financial in nature.
These KPIs are discussed in detail in the succeeding paragraphs.
2020 Compared with 2019
Gross moves per hour per crane ranged to 15.1 to 30.8 moves per hour in 2020 from 14.7 to
29.1 moves per hour in 2019. Crane availability ranged to 78.5 percent to 97.7 percent in 2020 from
75.2 percent to 98.4 percent in 2019. Berth utilization was at 16.0 percent to 74.7 percent in 2020
and 19.8 percent to 80.8 percent in 2019.
2019 Compared with 2018
Gross moves per hour per crane ranged to 14.7 to 29.1 moves per hour in 2019 from 13.8 to
33.6 moves per hour in 2018. Crane availability ranged to 75.2 percent to 98.4 percent in 2019 from
77.2 percent to 99.7 percent in 2018. Berth utilization was at 19.8 percent to 80.8 percent in 2019
and 16.7 percent to 91.3 percent in 2018.
The gross moves per hour per crane is a measure of crane productivity while working on vessels
during discharging or loading operations. The crane availability relates to the efficiency of the
maintenance of the crane. While berth utilization is a measure of how long the berth is utilized for a
given period and this indicator measures the efficiency of the operations and the productivity on the
vessel.
2.3 Comparison of Operating Results for the Second Quarters Ended June 30, 2020 and 2019
2.3.1 TEU Volume
The below table presents the volume (in TEU) handled by the Group for the second quarters ended
June 30, 2019 and 2020:
Table 2.3 Volume
For the Three Months Ended June 30
2019 2020 % Change
Asia 1,354,478 1,152,022 (14.9)
Americas 752,389 711,602 (5.4)
EMEA 456,377 427,155 (6.4)
2,563,244 2,290,779 (10.6)

SEC Form 17-Q Q2 2020 46
The Group’s consolidated volume decreased by 10.6 percent to 2,290,779 TEUs for the second
quarter of 2020 from 2,563,244 TEUs for the same period in 2019 as trade activities declined due to
the impact of COVID-19 pandemic and lockdown restrictions. Excluding contribution of ICTSI
Rio, consolidated volume would have decreased by 12.1 percent in 2020.
Volume from the Asia operations, consisting of terminals in the Philippines, China, Indonesia,
Pakistan, Australia, and Papua New Guinea decreased by 14.9 percent to 1,152,022 TEUs for the
second quarter of 2020 from 1,354,478 TEUs for the same period in 2019 as trade activities declined
at most of the Philippine terminals, PICT and YICT due to the impact of COVID-19 pandemic and
lockdown restrictions; partially tapered by new services at VICT. The Asia operations accounted for
52.8 percent and 50.3 percent of the consolidated volume for the quarters ended June 30, 2019 and
2020, respectively.
Volume from the Americas segment, consisting of terminals in Brazil, Ecuador, Honduras and
Mexico, decreased by 5.4 percent to 711,602 TEUs for the second quarter of 2020 from 752,389
TEUs for the same period in 2019 mainly due to decline in trade activities at OPC, CMSA, CGSA,
and TSSA due to the impact of COVID-19 pandemic and lockdown restrictions, tapered by the
contribution of a new terminal, ICTSI Rio. Excluding contribution of ICTSI Rio, volume from the
Americas segment would have decreased by 10.5 percent in the second quarter of 2020. The
Americas operations accounted for 29.4 percent and 31.1 percent of the consolidated volume for the
second quarters ended June 30, 2019 and 2020, respectively.
Volume from the EMEA segment, consisting of terminals in Iraq, DR Congo, Poland, Georgia,
Madagascar and Croatia, reported a 6.4 percent decline to 427,155 TEUs for the second quarter of
2020 from 456,377 TEUs for the same period in 2019 mainly due to the impact of COVID-19
pandemic resulting to decrease in vessel calls and lower trade volumes at MICTSL, BCT, and IDRC,
partially tapered by increased trade activities at AGCT and ICTSI Iraq. The EMEA operations
accounted for 17.8 percent and 18.6 percent of the Group’s consolidated volume for the second
quarters ended June 30, 2019 and 2020, respectively.
2.3.2 Total Income
Total income consists of: (1) Revenues from port operations, net of port authorities’ share in gross
revenues; (2) Interest income; (3) Foreign exchange gain; and (4) Other income.
The table below illustrates the consolidated total income for the second quarters ended June 30, 2019
and 2020:
Table 2.4 Total Income
For the Three Months Ended June 30
(In thousands, except % change data) 2019 2020 % Change
Gross revenues from port operations US$368,001 US$348,485 (5.3)
Port authorities’ share in gross revenues 46,130 40,474 (12.3)
Net revenues 321,871 308,011 (4.3)
Interest income 6,999 4,710 (32.7)
Foreign exchange gain 1,319 307 (76.7)
Other income 4,712 3,105 (34.1)
Total income US$334,901 US$316,133 (5.6)
For the second quarter of 2020, net revenues stood at 97.4 percent of the total consolidated income
while interest income, foreign exchange gain and other income accounted for 1.5 percent,
0.1 percent and 1.0 percent, respectively. For the same period in 2019, net revenues stood at
96.1 percent of the total consolidated income while interest income, foreign exchange gain and other
income accounted for 2.1 percent, 0.4, and 1.4 percent, respectively.
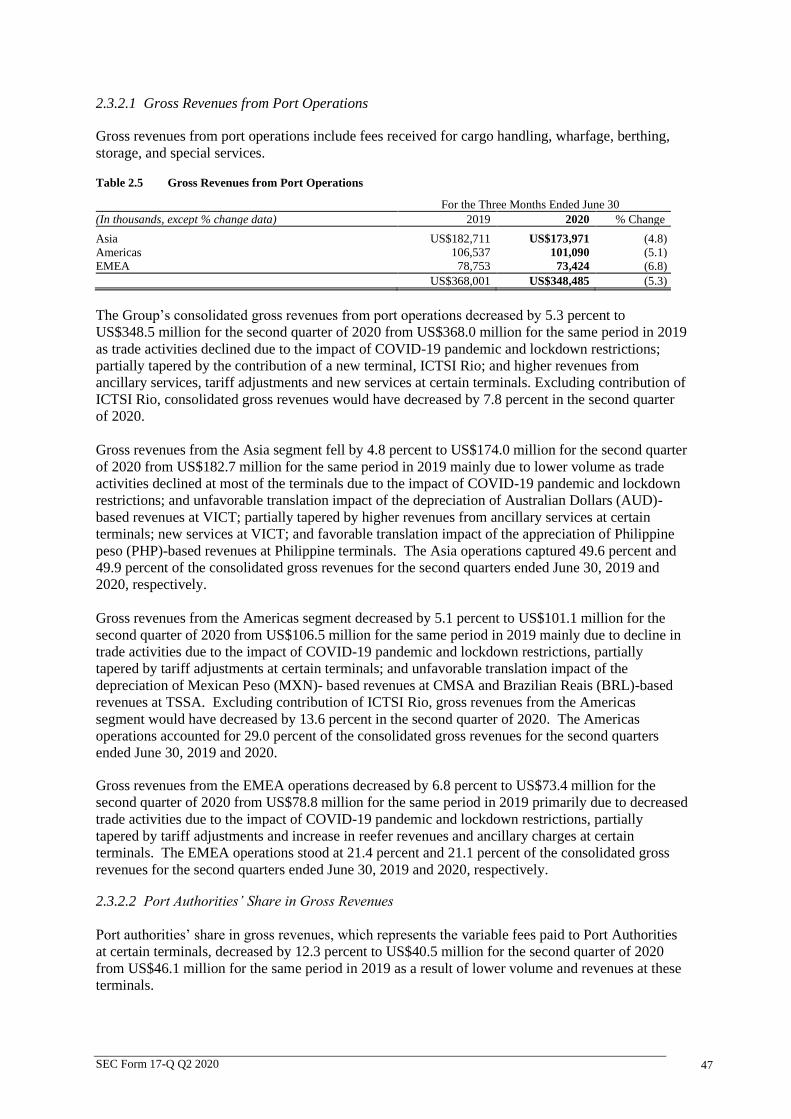
SEC Form 17-Q Q2 2020 47
2.3.2.1 Gross Revenues from Port Operations
Gross revenues from port operations include fees received for cargo handling, wharfage, berthing,
storage, and special services.
Table 2.5 Gross Revenues from Port Operations
For the Three Months Ended June 30
(In thousands, except % change data) 2019 2020 % Change
Asia US$182,711 US$173,971 (4.8)
Americas 106,537 101,090 (5.1)
EMEA 78,753 73,424 (6.8)
US$368,001 US$348,485 (5.3)
The Group’s consolidated gross revenues from port operations decreased by 5.3 percent to
US$348.5 million for the second quarter of 2020 from US$368.0 million for the same period in 2019
as trade activities declined due to the impact of COVID-19 pandemic and lockdown restrictions;
partially tapered by the contribution of a new terminal, ICTSI Rio; and higher revenues from
ancillary services, tariff adjustments and new services at certain terminals. Excluding contribution of
ICTSI Rio, consolidated gross revenues would have decreased by 7.8 percent in the second quarter
of 2020.
Gross revenues from the Asia segment fell by 4.8 percent to US$174.0 million for the second quarter
of 2020 from US$182.7 million for the same period in 2019 mainly due to lower volume as trade
activities declined at most of the terminals due to the impact of COVID-19 pandemic and lockdown
restrictions; and unfavorable translation impact of the depreciation of Australian Dollars (AUD)-
based revenues at VICT; partially tapered by higher revenues from ancillary services at certain
terminals; new services at VICT; and favorable translation impact of the appreciation of Philippine
peso (PHP)-based revenues at Philippine terminals. The Asia operations captured 49.6 percent and
49.9 percent of the consolidated gross revenues for the second quarters ended June 30, 2019 and
2020, respectively.
Gross revenues from the Americas segment decreased by 5.1 percent to US$101.1 million for the
second quarter of 2020 from US$106.5 million for the same period in 2019 mainly due to decline in
trade activities due to the impact of COVID-19 pandemic and lockdown restrictions, partially
tapered by tariff adjustments at certain terminals; and unfavorable translation impact of the
depreciation of Mexican Peso (MXN)- based revenues at CMSA and Brazilian Reais (BRL)-based
revenues at TSSA. Excluding contribution of ICTSI Rio, gross revenues from the Americas
segment would have decreased by 13.6 percent in the second quarter of 2020. The Americas
operations accounted for 29.0 percent of the consolidated gross revenues for the second quarters
ended June 30, 2019 and 2020.
Gross revenues from the EMEA operations decreased by 6.8 percent to US$73.4 million for the
second quarter of 2020 from US$78.8 million for the same period in 2019 primarily due to decreased
trade activities due to the impact of COVID-19 pandemic and lockdown restrictions, partially
tapered by tariff adjustments and increase in reefer revenues and ancillary charges at certain
terminals. The EMEA operations stood at 21.4 percent and 21.1 percent of the consolidated gross
revenues for the second quarters ended June 30, 2019 and 2020, respectively.
2.3.2.2 Port Authorities’ Share in Gross Revenues
Port authorities’ share in gross revenues, which represents the variable fees paid to Port Authorities
at certain terminals, decreased by 12.3 percent to US$40.5 million for the second quarter of 2020
from US$46.1 million for the same period in 2019 as a result of lower volume and revenues at these
terminals.

SEC Form 17-Q Q2 2020 48
2.3.2.3 Interest Income, Foreign Exchange Gain and Other Income
Consolidated interest income decreased by 32.7 percent to US$4.7 million for the second quarter of
2020 from US$7.0 million for the same period in 2019 mainly due to lower interest income earned
from advances to SPIA, a joint venture.
Foreign exchange gain decreased to US$0.3 million for the second quarter of 2020 from
US$1.3 million for the same period in 2019 mainly due to the unfavorable translation impact of
certain currencies against US dollar. Foreign exchange gain mainly arises from the settlement and
translation or restatement adjustments of foreign currency-denominated monetary assets and
liabilities.
Other income decreased to US$3.1 million for the second quarter of 2020 from US$4.7 million for
the same period in 2019 mainly due to tax refund granted to certain terminals in 2019. Other income
includes the Group’s rental, dividend income, and other sundry income accounts.
2.3.3 Total Expenses
The table below shows the breakdown of total expenses for the second quarters ended June 30, 2019
and 2020.
Table 2.6 Total Expenses
Total cash operating expenses of the Group decreased by 13.5 percent to US$103.8 million for the
second quarter ended June 30, 2020 from US$120.0 million for the same period in 2019 mainly due
to the decline in volume and continuous group-wide cost reduction and optimization measures; and
favorable translation impact of BRL-based expenses at TSSA, AUD-based expenses at VICT,
MXN- based expenses at CMSA and Pakistan Rupee (PKR)- based expenses at PICT, tapered by
mandated and contracted salary rate adjustments at certain terminals and contribution of ICTSI Rio.
Excluding the contribution of ICTSI Rio, consolidated cash operating expenses would have
decreased by 17.4 percent in 2020.
2.3.3.1 Manpower Costs
Manpower costs decreased by 3.0 percent to US$57.7 million for the second quarter of 2020 from
US$59.5 million for the same period in 2019 primarily driven by the slow down of operations due to
the impact of COVID-19 pandemic and lockdown restrictions and the continuous monitoring of cost
optimization measures, partially tapered by contribution of new terminal, ICTSI Rio, and
government-mandated and contracted salary rate adjustments at certain terminals. Excluding
contribution of ICTSI Rio, consolidated manpower costs would have decreased by 7.8 percent in
2020.
Manpower costs accounted for 49.6 percent and 55.6 percent of consolidated cash operating
expenses for the second quarters ended June 30, 2019 and 2020, respectively.
For the Three Months Ended June 30
(In thousands, except % change data) 2019 2020 % Change
Manpower costs US$59,519 US$57,747 (3.0)
Equipment and facilities-related expenses 27,934 21,684 (22.4)
Administrative and other operating expenses 32,562 24,362 (25.2)
Total cash operating expenses 120,015 103,793 (13.5)
Depreciation and amortization 57,833 55,280 (4.4)
Interest expense and financing charges on borrowings 27,976 25,460 (9.0)
Interest expense on lease liabilities 25,859 22,510 (13.0)
Interest expense on concession rights payable 9,986 12,844 28.6
Equity in net loss of joint ventures and an associate 6,266 4,165 (33.5)
Foreign exchange loss and others 3,841 10,512 173.7
Total expenses US$251,776 US$234,564 (6.8)

SEC Form 17-Q Q2 2020 49
2.3.3.2 Equipment and Facilities-Related Expenses
Equipment and facilities-related expenses consist mainly of repairs and maintenance costs of port
equipment and facilities, power and light, tools expenses, equipment rentals, and fuel, oil and
lubricants.
Equipment and facilities-related expenses decreased by 22.4 percent to US$21.7 million for the
second quarter of 2020 from US$27.9 million for the same period in 2019 mainly due to lower fuel
consumption, including lower fuel prices, decrease in repairs and maintenance, and decrease in
equipment rental driven by the decline in volume. Excluding contribution of ICTSI Rio,
consolidated equipment and facilities-related expenses would have decreased by 24.5 percent in
2020.
Equipment and facilities-related expenses represented 23.3 percent and 20.9 percent of consolidated
cash operating expenses for the second quarters ended June 30, 2019 and 2020, respectively.
2.3.3.3 Administrative and Other Operating Expenses
Administrative and other operating expenses decreased by 25.2 percent to US$24.4 million for the
second quarter of 2020 from US$32.6 million for the same period in 2019 due to reduction in
professional fees, sponsorships, transportation and travel costs, and other office expenses as a result
of continuous group-wide cost reduction and optimization measures implemented. Excluding
contribution of ICTSI Rio, consolidated administrative and other operating expenses would have
decreased by 29.0 percent in 2020.
Administrative and other operating expenses stood at 27.1 percent and 23.5 percent of consolidated
cash operating expenses for the second quarters ended June 30, 2019 and 2020, respectively.
2.3.3.4 Depreciation and Amortization
Depreciation and amortization expense decreased by 4.4 percent to US$55.3 million for the second
quarter of 2020 from US$57.8 million for the same period in 2019 mainly due to lower amortization
expense on the concession rights assets at CGSA as a result of the extension of its concession period
in December 2019 by an additional 19 years; and at Tecplata arising from the reduced carrying value
of its concession right assets following the non-recurring impairment charge in 2019, partially
tapered by the contribution of new terminal, ICTSI Rio.
2.3.3.5 Interest and Financing Charges on Borrowings
Interest and financing charges on borrowings decreased by 9.0 percent to US$25.5 million for the
second quarter of 2020 from US$28.0 million for the same period in 2019 mainly due to interest
reduction from prepayments of portion of ICTSI Middle East DMCC loan in July and December
2019, settlement of senior notes at ICTSI Parent in March 2020, and repayment of loans at VICT,
tapered by the capitalization of borrowing costs in 2019.
2.3.3.6 Interest Expense on Lease Liabilities
Interest expense on lease liabilities decreased by 13.0 percent to US$22.5 million for the second
quarter of 2020 from US$25.9 million for the same period in 2019 mainly due to favorable
translation impact of BRL-based interest expense at TSSA, MXN-based interest expense at CMSA,
and AUD-based interest expense at VICT.

SEC Form 17-Q Q2 2020 50
2.3.3.7 Interest Expense on Concession Rights Payable
Interest expense on concession rights payable increased by 28.6 percent to US$12.8 million for the
second quarter ended June 30, 2020 from US$10.0 million for the same period in 2019 mainly due to
the liability for concession rights recognized at a new terminal, ICTSI Rio.
2.3.3.8 Equity in Net Loss of Joint Ventures and An Associate
Equity in net loss of joint ventures and an associate decreased by 33.5 percent to US$4.2 million in
the second quarter of 2020 from US$6.3 million for the same period in 2019 mainly due to decrease
in the Company’s share in net loss at SPIA.
2.3.3.9 Foreign Exchange Loss and Others
Foreign exchange loss and others increased to US$10.5 million in the second quarter of 2020 from
US$3.8 million for the same period in 2019 mainly due to increase in foreign exchange loss arising
from the unfavorable translation impact of certain currencies against US dollar and COVID-19
related and restructuring costs. Foreign exchange loss mainly results from the translation or
restatement as well as from the settlement of foreign currency-denominated monetary assets and
liabilities.
2.3.4 EBITDA and EBIT
Consolidated EBITDA increased by 1.2 percent to US$204.2 million for the second quarter of 2020
from US$201.9 million for the same period in 2019 primarily due to lower cash operating expenses
resulting from continuous group-wide cost reduction and optimization measures and positive
contribution of a new terminal, ICTSI Rio, tapered by the decrease in revenues. Excluding
contribution of ICTSI Rio, consolidated EBITDA would have decreased by 1.0 percent in 2020.
EBITDA margin increased to 58.6 percent in 2020 from 54.9 percent in 2019.
Meanwhile, consolidated EBIT increased by 3.4 percent to US$148.9 million for the second quarter
of 2020 from US$144.0 million for the same period in 2019 mainly due to positive EBITDA, and
lower depreciation and amortization charges. Excluding contribution of ICTSI Rio, consolidated
EBIT would have increased by 1.9 percent in 2020. EBIT margin increased to 42.7 percent in 2020
from 39.1 percent in 2019.
2.3.5 Income Before Income Tax and Provision for Income Tax
Consolidated income before income tax decreased by 1.9 percent to US$81.6 million for the quarter
ended June 30, 2020 from US$83.1 million for the same period in 2019 primarily due to increase in
interest on concession rights payable and lower interest and other income, partially tapered by
decrease in equity in net loss of joint ventures and an associate. Excluding contribution of ICTSI
Rio, consolidated income before income tax would have decreased by 1.6 percent in 2020. The ratio
of consolidated income before income tax to consolidated gross revenues stood at 22.6 percent and
23.4 percent in 2019 and 2020, respectively.
Consolidated provision for current and deferred income taxes increased to US$19.1 million for the
second quarter of 2020 from US$18.6 million for the same period in 2019 mainly due to lower
deferred income tax benefit on reduced net operating losses at VICT, partially tapered by lower
taxable income at most of the terminals. Effective income tax rate in 2019 and 2020 stood at
22.3 percent and 23.4 percent, respectively.

SEC Form 17-Q Q2 2020 51
2.3.6 Net Income
Consolidated net income decreased by 3.2 percent to US$62.5 million for the quarter ended
June 30, 2020 from US$64.6 million for the same period in 2019. Excluding contribution of ICTSI
Rio, consolidated net income would have decreased by 3.0 percent in 2020. The ratio of
consolidated net income to gross revenues stood at 17.5 percent and 17.9 percent in 2019 and 2020,
respectively.
Consolidated net income attributable to equity holders decreased by 4.1 percent to US$53.8 million
for the quarter ended June 30, 2020 from US$56.1 million for the same period in 2019. Excluding
contribution of ICTSI Rio, consolidated net income attributable to equity holders would have
decreased by 3.8 percent in 2020.
Basic and diluted earnings per share amounted to US$0.020 both in 2020 and in 2019.
2.4 Comparison of Operating Results for the Six Months Ended June 30, 2020 and 2019
2.4.1 TEU Volume
The below table presents the volume (in TEU) handled by the Group for the six months ended
June 30, 2019 and 2020:
Table 2.7 Volume
For the Six Months Ended June 30
2019 2020 % Change
Asia 2,653,248 2,416,663 (8.9)
Americas 1,498,004 1,499,549 0.1
EMEA 890,664 883,553 (0.8)
5,041,916 4,799,765 (4.8)
Consolidated volume handled by the Group decreased by 4.8 percent to 4,799,765 TEUs for the first
six months of 2020 from 5,041,916 TEUs for the same period in 2019 as global trade activities
declined due to the impact of COVID-19 pandemic and lockdown restrictions. Excluding
contribution of ICTSI Rio, consolidated volume would have decreased by 6.5 percent in 2020.
Volume from the Asia segment decreased by 8.9 percent to 2,416,663 TEUs for the first six months
of 2020 from 2,653,248 TEUs for the same period in 2019 as trade activities declined at most of the
Philippine and rest of Asia terminals, due to the impact of COVID-19 pandemic and lockdown
restrictions; partially tapered by new services at VICT. The Asia operations accounted for 52.6
percent and 50.3 percent of the consolidated volume for the six months ended June 30, 2019 and
2020.
Volume from the Americas segment increased marginally by 0.1 percent to 1,499,549 TEUs for the
first six months of 2020 from 1,498,004 TEUs for the same period in 2019 mainly due to
contribution of a new terminal, ICTSI Rio; tapered by decline in trade activities at OPC, CMSA, and
CGSA due to the impact of COVID-19 pandemic and lockdown restrictions. Excluding contribution
of ICTSI Rio, volume from the Americas segment would have decreased by 5.6 percent in the first
six months of 2020. The Americas operations accounted for 29.7 percent and 31.2 percent of the
consolidated volume for the six months ended June 30, 2019 and 2020, respectively.
Volume from the EMEA segment marginally decreased by 0.8 percent to 883,553 TEUs for the first
six months of 2020 from 890,664 TEUs for the same period in 2019 primarily due to decline in trade
activities due to the impact of COVID-19 pandemic and lockdown restrictions, partially tapered by
increased trade activities at AGCT, BICTL, and ICTSI Iraq. The EMEA segment stood at 17.7
percent and 18.4 percent of the consolidated volume for the six months ended June 30, 2019 and
2020, respectively.

SEC Form 17-Q Q2 2020 52
2.4.2 Total Income
Table 2.8 Total Income
For the Six Months Ended June 30
(In thousands, except % change data) 2019 2020 % Change
Gross revenues from port operations US$751,785 US$724,261 (3.7)
Port authorities’ share in gross revenues 95,343 85,057 (10.8)
Net revenues 656,442 639,204 (2.6)
Interest income 13,101 9,447 (27.9)
Foreign exchange gain 2,881 2,459 (14.6)
Other income 7,195 6,226 (13.5)
Total income US$679,619 US$657,336 (3.3)
For the six months ended June 30, 2020, net revenues accounted for 97.2 percent of the total
consolidated income while interest income, foreign exchange gain and other income represented
1.4 percent, 0.4 percent and 1.0 percent, respectively. For the same period in 2019, net revenues
accounted for 96.6 percent of the total consolidated income while interest income, foreign exchange
gain, and other income represented 1.9 percent, 0.4 percent and 1.1 percent, respectively.
2.4.2.1 Gross Revenues from Port Operations
Gross revenues from port operations include fees received for cargo handling, wharfage, berthing,
storage, and special services.
Table 2.9 Gross Revenues from Port Operations
For the Six Months Ended June 30
(In thousands, except % change data) 2019 2020 % Change
Asia US$378,959 US$354,381 (6.5)
Americas 218,552 221,536 1.4
EMEA 154,274 148,344 (3.8)
US$751,785 US$724,261 (3.7)
The Group’s consolidated gross revenues from port operations decreased by 3.7 percent to
US$724.3 million for the first six months of 2020 from US$751.8 million for the same period in
2019 as global trade activities declined due to the impact of COVID-19 pandemic and lockdown
restrictions; partially tapered by the contribution of a new terminal, ICTSI Rio; tariff adjustments
and new services at certain terminals. Excluding contribution of ICTSI Rio, consolidated gross
revenues would have decreased by 6.4 percent in the first six months of 2020.
Gross revenues from the Asia segment decreased by 6.5 percent to US$354.4 million for the first six
months of 2020 from US$379.0 million for the same period in 2019 as trade activities declined at
most of the terminals due to the impact of COVID-19 pandemic and lockdown restrictions; lower
revenues from ancillary services at certain terminals; and unfavorable translation impact of the
depreciation of Australian Dollars (AUD)-based revenues at VICT; partially tapered by new services
at VICT; and favorable translation impact of the appreciation of Philippine peso (PHP)-based
revenues at Philippine terminals. The Asia segment accounted for 50.4 percent and 48.9 percent of
the consolidated gross revenues for the six months ended June 30, 2019 and 2020, respectively.
Gross revenues from the Americas segment marginally increased by 1.4 percent to US$221.5 million
for the first six months of 2020 from US$218.6 million for the same period in 2019 mainly due to
the contribution of ICTSI Rio; tariff adjustments at certain terminals; tapered by volume decline due
to the impact of COVID-19 pandemic and lockdown restrictions; unfavorable translation impact of
the depreciation of MXN and BRL-based revenues at CMSA and TSSA, respectively. The
Americas segment stood at 29.1 percent and 30.6 percent of the consolidated gross revenues for the
six months ended June 30, 2019 and 2020, respectively. Excluding the contribution of ICTSI Rio,
gross revenues from the Americas segment would have decreased by 8.1 percent in the first six
months of 2020.

SEC Form 17-Q Q2 2020 53
Gross revenues from the EMEA segment decreased by 3.8 percent to US$148.3 million for the first
six months of 2020 from US$154.3 million for the same period in 2019 primarily due to lower trade
activities due to the impact of COVID-19 pandemic and lockdown restrictions; tapered by volume
growth in BICTL, AGCT and ICTSI Iraq; and tariff adjustments at certain terminals. The EMEA
operations accounted for 20.5 percent of the consolidated gross revenues for the six months ended
June 30, 2019 and 2020.
2.4.2.2 Port Authorities’ Share in Gross Revenues
Port authorities’ share in gross revenues, which represents the variable fees paid to Port Authorities
by certain terminals, decreased by 10.8 percent to US$85.1 million for the first six months of 2020
from US$95.3 million for the same period in 2019 as a result of lower volume and revenues at these
terminals.
2.4.2.3 Interest Income, Foreign Exchange Gain, and Other Income
Consolidated interest income decreased by 27.9 percent to US$9.4 million for the first six months of
2020 from US$13.1 million for the same period in 2019 mainly due to lower interest income earned
from advances to SPIA, a joint venture.
Foreign exchange gain decreased to US$2.5 million for the first six months of 2020 from
US$2.9 million for the same period in 2019 mainly due to the unfavorable translation impact of
certain currencies against US dollar. Foreign exchange gain mainly arises from the settlement and
translation or restatement adjustments of foreign currency-denominated monetary assets and
liabilities.
Other income decreased to US$6.2 million for the first six months of 2020 from US$7.2 million for
the same period in 2019 mainly due to tax refund granted to certain terminals in 2019. Other income
includes the Group’s rental, dividend income, and other sundry income accounts of ICTSI and
subsidiaries.
2.4.3 Total Expenses
The table below shows the breakdown of total expenses for the six months ended June 30, 2019 and
2020:
Table 2.10 Total Expenses
For the Six Months Ended June 30
(In thousands, except % change data) 2019 2020 % Change
Manpower costs US$116,831 US$119,215 2.0
Equipment and facilities-related expenses 54,891 49,769 (9.3)
Administrative and other expenses 60,321 53,850 (10.7)
Total cash operating expenses 232,043 222,834 (4.0)
Depreciation and amortization 115,225 111,010 (3.7)
Interest expense and financing charges on borrowings 53,739 51,971 (3.3)
Interest expense on lease liabilities 51,786 47,181 (8.9)
Interest expense on concession rights payable 19,995 25,927 29.7
Equity in net loss of joint ventures and an associate 12,398 9,680 (21.9)
Foreign exchange loss and others 7,965 22,615 183.9
Total expenses US$493,151 US$491,218 (0.4)

SEC Form 17-Q Q2 2020 54
The Group’s cash operating expenses decreased by 4.0 percent to US$222.8 million for the six
months ended June 30, 2020 from US$232.0 million for the same period in 2019 mainly due to
continuous group-wide cost reduction and optimization measures and favorable translation impact of
BRL-based expenses at TSSA, AUD-based expenses at VICT, MXN-based expenses at CMSA and
PKR- based expenses at PICT, tapered by the contribution of new terminal, ICTSI Rio. Excluding
contribution of ICTSI Rio, consolidated cash operating expenses would have decreased by 8.8
percent in 2020.
2.4.3.1 Manpower Costs
Manpower costs increased by 2.0 percent to US$119.2 million for the first six months of 2020 from
US$116.8 million for the same period in 2019 primarily due to contribution of a new terminal,
ICTSI Rio; and government-mandated and contracted salary rate adjustments at certain terminals,
partially tapered by continuous cost optimization measures. Excluding contribution of ICTSI Rio,
consolidated manpower costs would have decreased by 3.5 percent in 2020.
Manpower costs accounted for 50.3 percent and 53.5 percent of consolidated cash operating
expenses for the six months ended June 30, 2019 and 2020, respectively.
2.4.3.2 Equipment and Facilities-related Expenses
Equipment and facilities-related expenses consist mainly of repairs and maintenance costs of port
equipment and facilities, power and light, tools expenses, equipment rentals, and fuel, oil and
lubricants.
Equipment and facilities-related expenses decreased by 9.3 percent to US$49.8 million for the first
six months of 2020 from US$54.9 million for the same period in 2019 mainly due to decrease in
repairs and maintenance; lower fuel consumption, including lower fuel prices; and decrease in
equipment rental driven by decline in volume. Excluding contribution of ICTSI Rio, consolidated
equipment and facilities-related expenses would have decreased by 12.7 percent in 2020.
Equipment and facilities-related expenses stood at 23.7 percent and 22.3 percent of consolidated
cash operating expenses for the six months ended June 30, 2019 and 2020, respectively.
2.4.3.3 Administrative and Other Operating Expenses
Administrative and other operating expenses decreased by 10.7 percent to US$53.9 million for the
first six months of 2020 from US$60.3 million for same period in 2019 due to reduction in
professional fees, sponsorships, transportation and travel costs, and other office expenses as a result
of continuous group-wide cost reduction and optimization measures implemented. Excluding
contribution of ICTSI Rio, consolidated administrative and other operating expenses would have
decreased by 15.3 percent in 2020.
Administrative and other operating expenses accounted for 26.0 percent and 24.2 percent of
consolidated cash operating expenses for the six months ended June 30, 2019 and 2020, respectively.
2.4.3.4 Depreciation and Amortization
Depreciation and amortization expense decreased by 3.7 percent to US$111.0 million for the first
six months of 2020 from US$115.2 million for the same period in 2019 mainly due to lower
amortization expense on the concession rights assets at CGSA as a result of the extension of its
concession period in December 2019 by an additional 19 years; and at Tecplata arising from the
reduced carrying value of its concession right assets following the non-recurring impairment charge
in 2019, partially tapered by the contribution of new terminal, ICTSI Rio.

SEC Form 17-Q Q2 2020 55
2.4.3.5 Interest and Financing Charges on Borrowings
Interest and financing charges on borrowings decreased marginally by 3.3 percent to
US$52.0 million for the first six months of 2020 from US$53.7 million for the same period in 2019
due to interest reduction from prepayment of the portion of ICTSI Middle East DMCC loan in July
and December 2019, settlement of senior notes at ICTSI Parent in March 2020 and repayment of
loans at VICT, tapered by the capitalization of borrowing costs in 2019.
2.4.3.6 Interest Expense on Lease Liabilities
Interest expense on lease liabilities decreased by 8.9 percent to US$47.2 million for the first six
months of 2020 from US$51.8 million for the same period in 2019 mainly due to favorable
translation impact of BRL-based interest expense at TSSA, MXN-based interest expense at CMSA,
and AUD-based interest expense at VICT.
2.4.3.7 Interest Expense on Concession Rights Payable
Interest on concession rights payable increased by 29.7 percent to US$25.9 million for the six
months ended June 30, 2020 from US$20.0 million for the same period in 2019 mainly due to the
concession rights liabilities recognized at a new terminal, ICTSI Rio.
2.4.3.8 Equity in Net Loss of Joint Ventures and An Associate
Equity in net loss of joint ventures and an associate decreased by 21.9 percent to US$9.7 million for
the first six months of 2020 from US$12.4 million for the same period in 2019 mainly due to the
decrease in the Company’s share in net loss at SPIA.
2.4.3.9 Foreign Exchange Loss and Others
Foreign exchange loss and others increased to US$22.6 million for the first six months of 2020 from
US$8.0 million for the same period in 2019 mainly due to increase in foreign exchange loss arising
from the unfavorable translation impact of certain currencies against US dollar and COVID-19
related and restructuring costs. Foreign exchange loss mainly results from the translation or
restatement as well as from the settlement of foreign currency-denominated monetary assets and
liabilities.
2.4.4 EBITDA and EBIT
Consolidated EBITDA decreased by 1.9 percent to US$416.4 million for the first six months of 2020
from US$424.4 million for the same period in 2019 primarily due to decrease in revenues, tapered
by lower cash operating expenses resulting from continuous group-wide cost reduction and
optimization measures and positive contribution of a new terminal, ICTSI Rio. Excluding
contribution of ICTSI Rio, consolidated EBITDA would have decreased by 4.2 percent in 2020.
EBITDA margin increased to 57.5 percent in 2020 from 56.5 percent in 2019.
Meanwhile, consolidated EBIT decreased by 1.2 percent to US$305.4 million for the first six months
of 2020 from US$309.2 million for the same period in 2019 mainly due to lower EBITDA, partially
tapered by lower depreciation and amortization charges. Excluding contribution of ICTSI Rio,
consolidated EBIT would have decreased by 2.8 percent in 2020. EBIT margin increased to
42.2 percent in 2020 from 41.1 percent in 2019.
2.4.5 Income Before Income Tax and Provision for Income Tax
Consolidated income before income tax decreased by 10.9 percent to US$166.1 million for the first
six months of 2020 from US$186.5 million for the same period in 2019 primarily due to lower
operating income; and increase in interest on concession rights payables, partially tapered by
decrease in equity in net loss of joint ventures and an associate.

SEC Form 17-Q Q2 2020 56
Excluding the contribution of ICTSI Rio, consolidated income before income tax would have
decreased by 10.8 percent in 2020. The ratio of consolidated income before income tax to
consolidated gross revenues stood at 24.8 percent and 22.9 percent in 2019 and 2020, respectively.
Consolidated provision for current and deferred income taxes decreased to US$34.8 million for the
first six months of 2020 from US$40.4 million for the same period in 2019 mainly due to lower
taxable income at most of the terminals, tapered by lower deferred income tax benefit on reduced net
operating losses at VICT. Effective income tax rate in 2019 and 2020 stood at 21.7 percent and
21.0 percent, respectively.
2.4.6 Net Income
Consolidated net income decreased by 10.1 percent to US$131.3 million for the first six months of
2020 from US$146.1 million for the same period in 2019. Excluding contribution of ICTSI Rio,
consolidated net income would have decreased by 10.0 percent in 2020. The ratio of consolidated
net income to gross revenues stood at 19.4 percent and 18.1 percent for the six months ended
June 30, 2019 and 2020, respectively.
Consolidated net income attributable to equity holders decreased by 11.7 percent to US$113.4
million for six months ended June 30, 2020 from US$128.5 million for the same period in 2019.
Excluding contribution of ICTSI Rio, consolidated net income attributable to equity holders would
have decreased by 11.6 percent in 2020.
Basic and diluted earnings per share decreased to US$0.043 in 2020 from US$0.048 in 2019.
2.5 Trends, Events or Uncertainties Affecting Revenues and Profits
The Group is exposed to a number of trends, events, and uncertainties which can affect its recurring
revenues and profits. These include levels of general economic activity and containerized trade
volume in countries where it operates, as well as certain cost items, such as labor, fuel, and power. In
addition, the Group operates in a number of jurisdictions other than the Philippines and collects
revenues in various currencies. Continued appreciation of the US dollar relative to other major
currencies, particularly the Philippine peso, Australian dollar, Brazilian real, Mexican peso, and the
Euro, may adversely affect the Group’s reported levels of revenues and profits.
On March 11, 2020, the World Health Organization has declared the novel coronavirus (COVID-19)
outbreak a global pandemic.
In the Philippines, in a move to contain the COVID-19 outbreak, the Office of the President of the
Philippines issued a Memorandum directive on March 13, 2020 to impose stringent social distancing
measures in the National Capital Region effective March 15, 2020. On March 16, 2020, Presidential
Proclamation No. 929 was issued, declaring a State of Calamity throughout the Philippines for a
period of six (6) months and imposed an enhanced community quarantine (ECQ) throughout the
island of Luzon until April 12, 2020, which was extended to April 30, 2020. Through several
extensions, Metro Manila and certain areas of the country were placed under different categories of
community quarantine depending on the risk classification of the area.
Likewise, government authorities in other countries where the Group operates, adopted measures,
including lockdowns, to control the spread of the virus and mitigate the impact of the outbreak.
These measures have caused disruptions to businesses, global supply chain, and economic activities,
and its impact continues to evolve.
The scale and duration of these developments remain uncertain as of the report date. The Group has
started to observe declines in general business, including container throughput and revenues. It is not
possible to estimate the overall impact of the outbreak’s near-term and longer effects, however, the
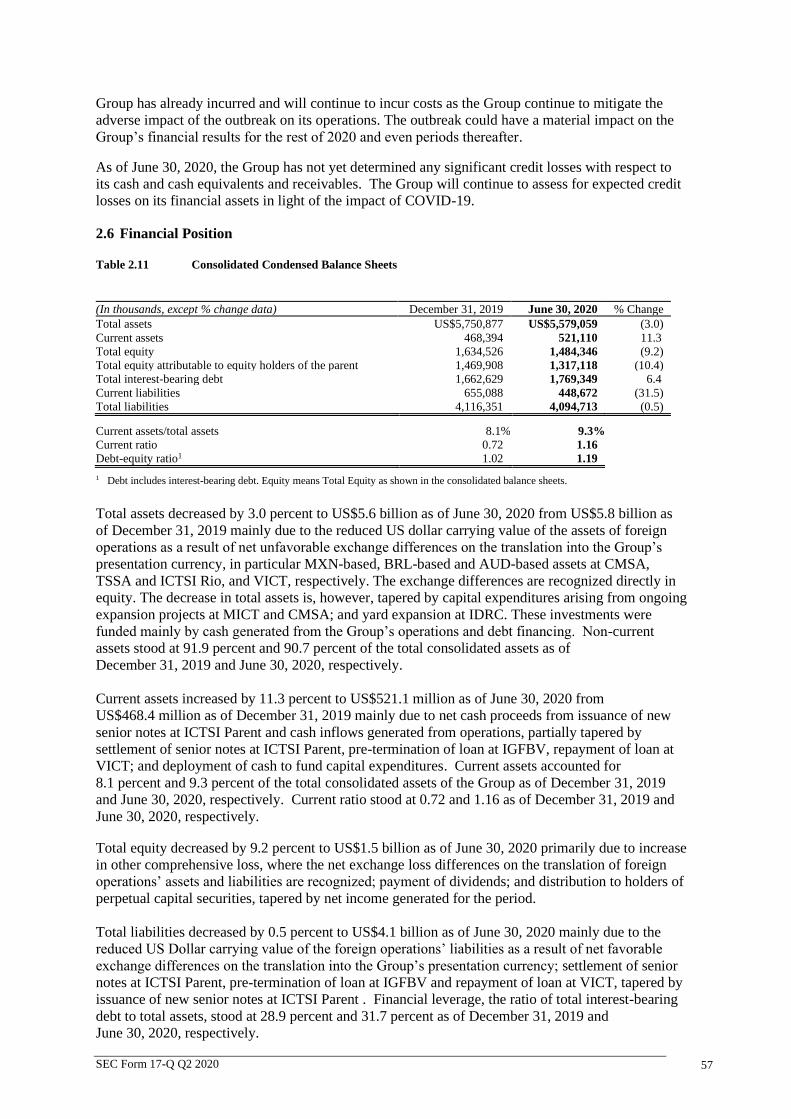
SEC Form 17-Q Q2 2020 57
Group has already incurred and will continue to incur costs as the Group continue to mitigate the
adverse impact of the outbreak on its operations. The outbreak could have a material impact on the
Group’s financial results for the rest of 2020 and even periods thereafter.
As of June 30, 2020, the Group has not yet determined any significant credit losses with respect to
its cash and cash equivalents and receivables. The Group will continue to assess for expected credit
losses on its financial assets in light of the impact of COVID-19.
2.6 Financial Position
Table 2.11 Consolidated Condensed Balance Sheets
(In thousands, except % change data) December 31, 2019 June 30, 2020 % Change
Total assets US$5,750,877 US$5,579,059 (3.0)
Current assets 468,394 521,110 11.3
Total equity 1,634,526 1,484,346 (9.2)
Total equity attributable to equity holders of the parent 1,469,908 1,317,118 (10.4)
Total interest-bearing debt 1,662,629 1,769,349 6.4
Current liabilities 655,088 448,672 (31.5)
Total liabilities 4,116,351 4,094,713 (0.5)
Current assets/total assets 8.1% 9.3%
Current ratio 0.72 1.16
Debt-equity ratio1 1.02 1.19
1 Debt includes interest-bearing debt. Equity means Total Equity as shown in the consolidated balance sheets.
Total assets decreased by 3.0 percent to US$5.6 billion as of June 30, 2020 from US$5.8 billion as
of December 31, 2019 mainly due to the reduced US dollar carrying value of the assets of foreign
operations as a result of net unfavorable exchange differences on the translation into the Group’s
presentation currency, in particular MXN-based, BRL-based and AUD-based assets at CMSA,
TSSA and ICTSI Rio, and VICT, respectively. The exchange differences are recognized directly in
equity. The decrease in total assets is, however, tapered by capital expenditures arising from ongoing
expansion projects at MICT and CMSA; and yard expansion at IDRC. These investments were
funded mainly by cash generated from the Group’s operations and debt financing. Non-current
assets stood at 91.9 percent and 90.7 percent of the total consolidated assets as of
December 31, 2019 and June 30, 2020, respectively.
Current assets increased by 11.3 percent to US$521.1 million as of June 30, 2020 from
US$468.4 million as of December 31, 2019 mainly due to net cash proceeds from issuance of new
senior notes at ICTSI Parent and cash inflows generated from operations, partially tapered by
settlement of senior notes at ICTSI Parent, pre-termination of loan at IGFBV, repayment of loan at
VICT; and deployment of cash to fund capital expenditures. Current assets accounted for
8.1 percent and 9.3 percent of the total consolidated assets of the Group as of December 31, 2019
and June 30, 2020, respectively. Current ratio stood at 0.72 and 1.16 as of December 31, 2019 and
June 30, 2020, respectively.
Total equity decreased by 9.2 percent to US$1.5 billion as of June 30, 2020 primarily due to increase
in other comprehensive loss, where the net exchange loss differences on the translation of foreign
operations’ assets and liabilities are recognized; payment of dividends; and distribution to holders of
perpetual capital securities, tapered by net income generated for the period.
Total liabilities decreased by 0.5 percent to US$4.1 billion as of June 30, 2020 mainly due to the
reduced US Dollar carrying value of the foreign operations’ liabilities as a result of net favorable
exchange differences on the translation into the Group’s presentation currency; settlement of senior
notes at ICTSI Parent, pre-termination of loan at IGFBV and repayment of loan at VICT, tapered by
issuance of new senior notes at ICTSI Parent . Financial leverage, the ratio of total interest-bearing
debt to total assets, stood at 28.9 percent and 31.7 percent as of December 31, 2019 and
June 30, 2020, respectively.

SEC Form 17-Q Q2 2020 58
Meanwhile, current liabilities decreased by 31.5 percent to US$448.7 million as of June 30, 2020
from US$655.1 million as of December 31, 2019 mainly due to settlement of the current portion of
the senior notes at ICTSI Parent.
2.6.1 Material Variances Affecting the Balance Sheet
Balance sheet accounts as of June 30, 2020 with variances of plus or minus 5.0 percent against
December 31, 2019 balances are discussed, as follows:
Noncurrent Assets
1. Property and equipment decreased by 7.5 percent to US$1.3 billion as of June 30, 2020 due to
the reduced US dollar carrying value of the property and equipment of foreign operations as a
result of net unfavorable exchange differences on the translation, mainly at CMSA, VICT and
TSSA, into the Group’s presentation currency, partially tapered by capital expenditures arising
from yard expansion at IDRC and expansion project at CMSA.
2. Right-of-use assets decreased by 5.4 percent to US$544.4 million as of June 30, 2020 due to net
unfavorable exchange differences on the translation of foreign operations’ right of use assets,
mainly at CMSA, VICT and TSSA, into the Group’s presentation currency, partially tapered by
the recognition of additional right-of-use asset at CMSA.
3. Deferred tax assets decreased by 7.6 percent to US$297.0 million as of June 30, 2020 mainly
due to net unfavorable exchange differences on the translation of foreign operations’ deferred
tax assets, mainly at CMSA, TSSA and ICTSI Rio, into the Group’s presentation currency,
partially tapered by deferred income tax benefit from loss carry-over at VICT.
4. Other noncurrent assets increased by 5.9 percent to US$365.7 million mainly due to deposits
made in relation to investments and concession-related projects.
Current Assets
5. Cash and cash equivalents increased to US$296.8 million as of June 30, 2020 mainly due to cash
inflows generated from operations; net cash proceeds from issuance of new senior notes at
ICTSI Parent, tapered by settlement of outstanding balance of senior notes at ICTSI Parent and
pre-termination of loans at IGFBV.
6. Receivables decreased by 5.7 percent to US$117.3 million mainly due to net unfavorable
exchange differences on the translation of foreign operations’ receivables, mainly at TSSA
CMSA, ICTSI Rio and PICT into the Group’s presentation currency.
7. Derivative assets increased to US$249 thousand as of June 30, 2020 due to recognition of gain
on mark-to-market valuation from foreign currency forward at ICTSI Parent.
Equity
8. Cost of shares held by subsidiaries increased by 7.5 percent to US$79.8 million as of
June 30, 2020 mainly due to the acquisition of ICTSI common shares by its wholly-owned
subsidiary, IWI CTHI during the period.
9. Retained earnings decreased by 14.9 percent to US$256.1 million as of June 30, 2020 mainly
due to dividends declared during the period; and distribution to holders of perpetual capital
securities, partially tapered by net income attributable to equity holders of the parent for the
period amounting to US$113.4 million.
10. Other comprehensive loss increased by 63.4 percent to US$265.7 million as of
June 30, 2020 mainly due to net unfavorable exchange differences on translation of
foreign operations’ financial statements.
Noncurrent Liabilities
11. Noncurrent portion of long-term debt increased by 20.6 percent to US$1.7 billion as of
June 30, 2020 mainly due to issuance of new senior notes at ICTSI Parent amounting to
US$400.0 million, partially tapered by pre-termination of loans at IGFBV and partial repayment
of loans at VICT, IDRC, YICT, SPICTL and MITL.
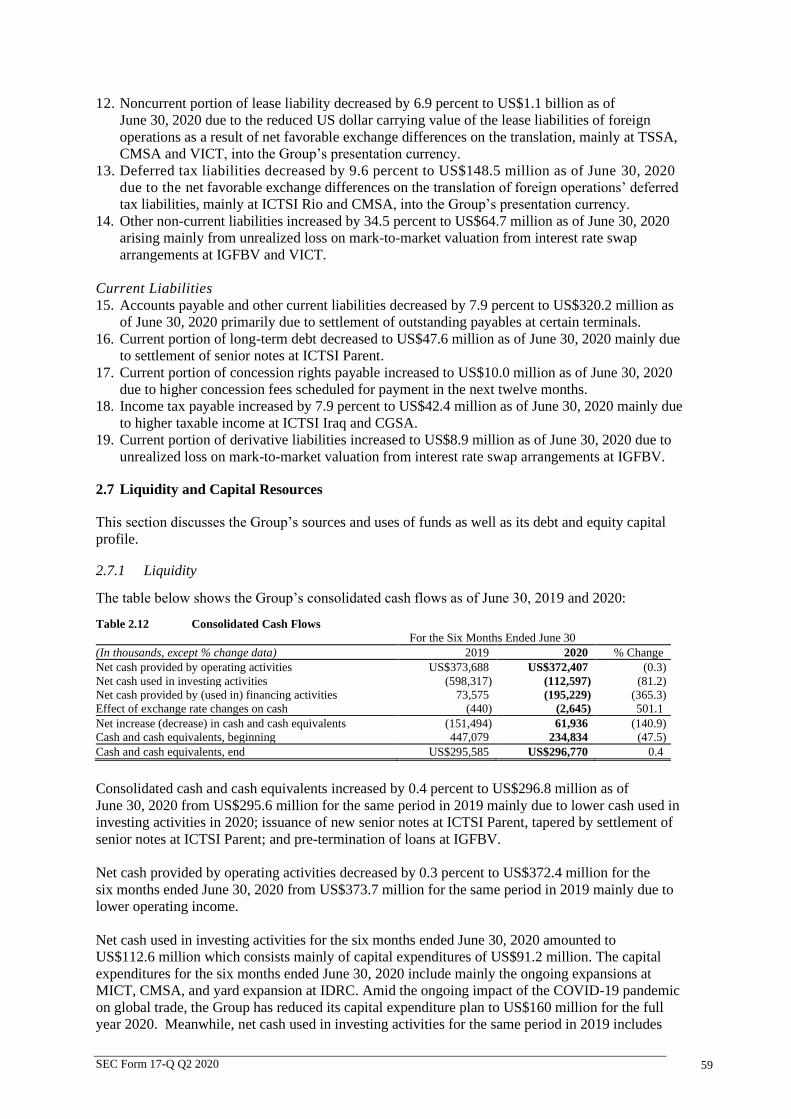
SEC Form 17-Q Q2 2020 59
12. Noncurrent portion of lease liability decreased by 6.9 percent to US$1.1 billion as of
June 30, 2020 due to the reduced US dollar carrying value of the lease liabilities of foreign
operations as a result of net favorable exchange differences on the translation, mainly at TSSA,
CMSA and VICT, into the Group’s presentation currency.
13. Deferred tax liabilities decreased by 9.6 percent to US$148.5 million as of June 30, 2020
due to the net favorable exchange differences on the translation of foreign operations’ deferred
tax liabilities, mainly at ICTSI Rio and CMSA, into the Group’s presentation currency.
14. Other non-current liabilities increased by 34.5 percent to US$64.7 million as of June 30, 2020
arising mainly from unrealized loss on mark-to-market valuation from interest rate swap
arrangements at IGFBV and VICT.
Current Liabilities
15. Accounts payable and other current liabilities decreased by 7.9 percent to US$320.2 million as
of June 30, 2020 primarily due to settlement of outstanding payables at certain terminals.
16. Current portion of long-term debt decreased to US$47.6 million as of June 30, 2020 mainly due
to settlement of senior notes at ICTSI Parent.
17. Current portion of concession rights payable increased to US$10.0 million as of June 30, 2020
due to higher concession fees scheduled for payment in the next twelve months.
18. Income tax payable increased by 7.9 percent to US$42.4 million as of June 30, 2020 mainly due
to higher taxable income at ICTSI Iraq and CGSA.
19. Current portion of derivative liabilities increased to US$8.9 million as of June 30, 2020 due to
unrealized loss on mark-to-market valuation from interest rate swap arrangements at IGFBV.
2.7 Liquidity and Capital Resources
This section discusses the Group’s sources and uses of funds as well as its debt and equity capital
profile.
2.7.1 Liquidity
The table below shows the Group’s consolidated cash flows as of June 30, 2019 and 2020:
Table 2.12 Consolidated Cash Flows
Consolidated cash and cash equivalents increased by 0.4 percent to US$296.8 million as of
June 30, 2020 from US$295.6 million for the same period in 2019 mainly due to lower cash used in
investing activities in 2020; issuance of new senior notes at ICTSI Parent, tapered by settlement of
senior notes at ICTSI Parent; and pre-termination of loans at IGFBV.
Net cash provided by operating activities decreased by 0.3 percent to US$372.4 million for the
six months ended June 30, 2020 from US$373.7 million for the same period in 2019 mainly due to
lower operating income.
Net cash used in investing activities for the six months ended June 30, 2020 amounted to
US$112.6 million which consists mainly of capital expenditures of US$91.2 million. The capital
expenditures for the six months ended June 30, 2020 include mainly the ongoing expansions at
MICT, CMSA, and yard expansion at IDRC. Amid the ongoing impact of the COVID-19 pandemic
on global trade, the Group has reduced its capital expenditure plan to US$160 million for the full
year 2020. Meanwhile, net cash used in investing activities for the same period in 2019 includes
For the Six Months Ended June 30
(In thousands, except % change data) 2019 2020 % Change
Net cash provided by operating activities US$373,688 US$372,407 (0.3)
Net cash used in investing activities (598,317) (112,597) (81.2)
Net cash provided by (used in) financing activities 73,575 (195,229) (365.3)
Effect of exchange rate changes on cash (440) (2,645) 501.1
Net increase (decrease) in cash and cash equivalents (151,494) 61,936 (140.9)
Cash and cash equivalents, beginning 447,079 234,834 (47.5)
Cash and cash equivalents, end US$295,585 US$296,770 0.4
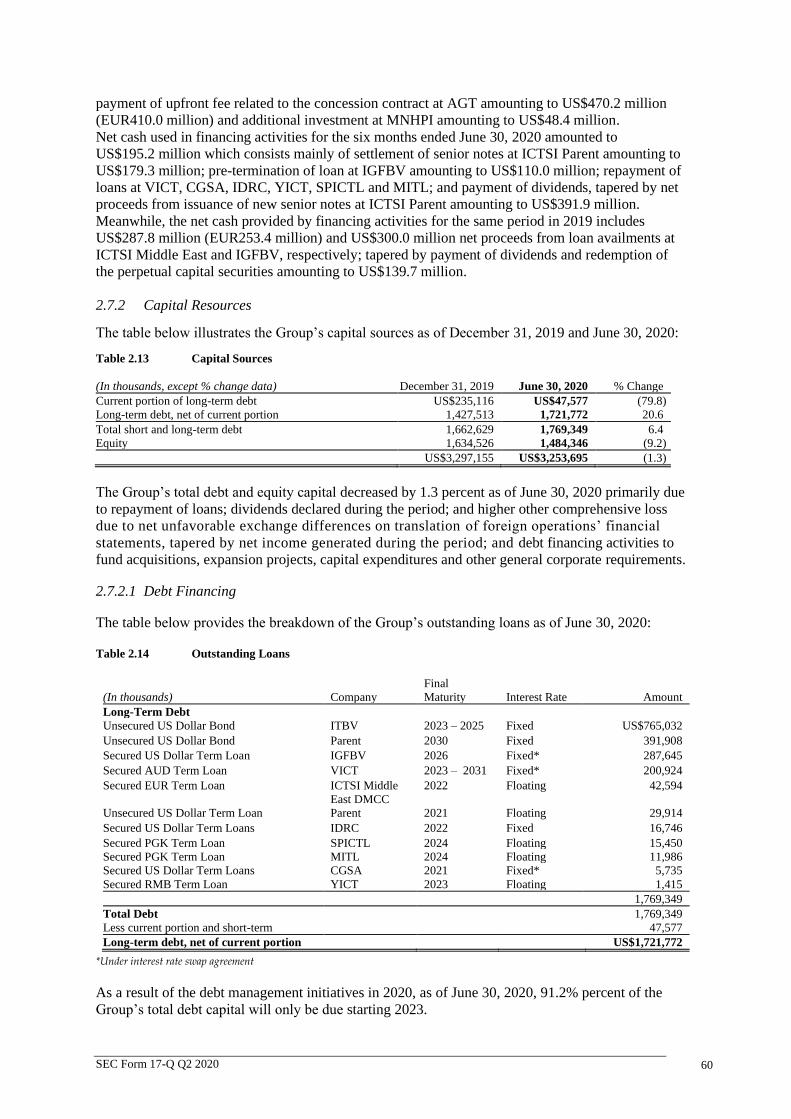
SEC Form 17-Q Q2 2020 60
payment of upfront fee related to the concession contract at AGT amounting to US$470.2 million
(EUR410.0 million) and additional investment at MNHPI amounting to US$48.4 million.
Net cash used in financing activities for the six months ended June 30, 2020 amounted to
US$195.2 million which consists mainly of settlement of senior notes at ICTSI Parent amounting to
US$179.3 million; pre-termination of loan at IGFBV amounting to US$110.0 million; repayment of
loans at VICT, CGSA, IDRC, YICT, SPICTL and MITL; and payment of dividends, tapered by net
proceeds from issuance of new senior notes at ICTSI Parent amounting to US$391.9 million.
Meanwhile, the net cash provided by financing activities for the same period in 2019 includes
US$287.8 million (EUR253.4 million) and US$300.0 million net proceeds from loan availments at
ICTSI Middle East and IGFBV, respectively; tapered by payment of dividends and redemption of
the perpetual capital securities amounting to US$139.7 million.
2.7.2 Capital Resources
The table below illustrates the Group’s capital sources as of December 31, 2019 and June 30, 2020:
Table 2.13 Capital Sources
(In thousands, except % change data) December 31, 2019 June 30, 2020 % Change
Current portion of long-term debt US$235,116 US$47,577 (79.8)
Long-term debt, net of current portion 1,427,513 1,721,772 20.6
Total short and long-term debt 1,662,629 1,769,349 6.4
Equity 1,634,526 1,484,346 (9.2)
US$3,297,155 US$3,253,695 (1.3)
The Group’s total debt and equity capital decreased by 1.3 percent as of June 30, 2020 primarily due
to repayment of loans; dividends declared during the period; and higher other comprehensive loss
due to net unfavorable exchange differences on translation of foreign operations’ financial
statements, tapered by net income generated during the period; and debt financing activities to
fund acquisitions, expansion projects, capital expenditures and other general corporate requirements.
2.7.2.1 Debt Financing
The table below provides the breakdown of the Group’s outstanding loans as of June 30, 2020:
Table 2.14 Outstanding Loans
(In thousands) Company
Final
Maturity Interest Rate Amount
Long-Term Debt
Unsecured US Dollar Bond ITBV 2023 – 2025 Fixed US$765,032
Unsecured US Dollar Bond Parent 2030 Fixed 391,908
Secured US Dollar Term Loan IGFBV 2026 Fixed* 287,645
Secured AUD Term Loan VICT 2023 – 2031 Fixed* 200,924
Secured EUR Term Loan ICTSI Middle
East DMCC
2022 Floating 42,594
Unsecured US Dollar Term Loan Parent 2021 Floating 29,914
Secured US Dollar Term Loans IDRC 2022 Fixed 16,746
Secured PGK Term Loan SPICTL 2024 Floating 15,450
Secured PGK Term Loan MITL 2024 Floating 11,986
Secured US Dollar Term Loans CGSA 2021 Fixed* 5,735
Secured RMB Term Loan YICT 2023 Floating 1,415
1,769,349
Total Debt 1,769,349
Less current portion and short-term 47,577
Long-term debt, net of current portion US$1,721,772
*Under interest rate swap agreement
As a result of the debt management initiatives in 2020, as of June 30, 2020, 91.2% percent of the
Group’s total debt capital will only be due starting 2023.

SEC Form 17-Q Q2 2020 61
The table below is a summary of debt maturities, net of unamortized debt issuance cost, of the Group
as of June 30, 2020:
Table 2.15 Outstanding Debt Maturities
(In thousands) Amount
2020 US$17,691
2021 66,926
2022 71,165
2023 480,829
2024 and onwards 1,132,738
Total US$1,769,349
MTN Programme
On January 9, 2013, ICTSI Treasury B.V. (ICTSI Treasury), a majority-owned subsidiary through
ICTSI Ltd., established the MTN Programme that would allow ICTSI Treasury from time to time to
issue medium-term notes (MTN), unconditionally and irrevocably guaranteed by ICTSI and listed on
the Singapore Stock Exchange. The aggregate nominal amount of the MTN outstanding will not at
any time exceed US$750.0 million (or its equivalent in other currencies), subject to increase as
described in the terms and conditions of the Programme Agreement. In August 2013, the maximum
aggregate nominal amount of the MTN outstanding that may be issued under the Programme was
increased to US$1.0 billion.
Pursuant to the MTN Programme, on January 9, 2013, ICTSI Treasury and ICTSI signed a
Subscription Agreement with HSBC and UBS AG, Hong Kong Branch, for the issuance of 10-year
US$300.0 million guaranteed MTN (the “Original MTN”). The Original MTN were issued on
January 16, 2013 to mature on January 16, 2023 at a fixed interest rate of 4.625 percent p.a., net of
applicable taxes, set at a price of 99.014 and payable semi-annually in arrears. Moreover, on
January 28, 2013, an additional US$100.0 million guaranteed MTN was issued to form a single
series with the original MTN.
In June 2013, ICTSI purchased a total of US$6.0 million of ICTSI Treasury’s US$400.0 million
MTN at US$5.7 million.
In September 2013, ICTSI Treasury further issued US$207.5 million notes from the MTN
Programme at a fixed interest rate of 5.875 percent p.a. payable semi-annually and will be due in
2025 (“2025 Notes”), in exchange for US$178.9 million of ICTSI’s US$450.0 million senior notes
due in 2020 (“2020 Notes”). Concurrent with the exchange offer, noteholders of the 2020 Notes
provided their consent to the modifications to the terms and conditions of the 2020 Notes to conform
to the terms and conditions of all the notes issued under the MTN Programme. Moreover, on
April 30, 2014, an additional US$75.0 million notes were issued to form a single series with the
2025 Notes.
In January 2015, an additional US$117.5 million notes were issued to form a single series with the
2025 Notes. Of this new issue, US$102.6 million was used to fund the exchange for
US$91.8 million of the 2020 Notes. The cash proceeds received by ITBV amounted to US$11.6
million, net of debt issuance cost. These new Notes were consolidated and formed a single series
with the US$282.5 million 5.875 percent guaranteed Notes due 2025 issued on September 17, 2013
and April 30, 2014.
As at June 30, 2020, the carrying value of notes under the MTN programme amounted to US$765.0
million.
The aggregate net proceeds of the issuances under the MTN Programme were used to fund new
projects and capital expenditures, refinance some of ICTSI’s existing debt and for other general
corporate purposes.

SEC Form 17-Q Q2 2020 62
US Dollar-denominated Notes
In March 2010, ICTSI signed a Subscription Agreement with HSBC and JP Morgan Securities, Ltd.
for the issuance of US$250.0 million ten-year senior notes (the “Original Notes”) bearing interest at
a fixed rate of 7.375 percent, net of applicable taxes, payable semi-annually in arrears. In
April 2010, ICTSI tapped a further US$200.0 million (the “Further Notes”) of the Original Notes
increasing the size to US$450.0 million. The Further Notes were issued in May 2010 bearing
interest at the fixed rate of 7.375 percent, net of applicable taxes. The Original and Further Notes
are collectively referred to as the “2020 Notes”.
The net proceeds of the 2020 Notes amounting to US$448.1 million were used to fund ICTSI’s
investments in existing and new terminal construction activities, refinance some of its existing debt
and for other general corporate purposes.
The 2020 Notes were not registered with the SEC. The Notes were offered in offshore transactions
outside the United States in reliance on Regulation S under the Securities Act of 1933, as amended,
and, subject to certain exceptions, may not be offered or sold within the United States. The 2020
Notes are traded and listed in the Singapore Stock Exchange.
In 2013 and 2015, ICTSI redeemed an aggregate of US$270.7 million of the 2020 Notes in exchange
for the 2025 Notes under the MTN Programme. ICTSI fully redeemed the outstanding balance of
the 2020 Notes on March 17, 2020.
In March 2017, ICTSI entered into a cross-currency swap with a swap rate of 5.05 percent maturing
on March 17, 2020 to mitigate the foreign currency risk arising from the translation of the Group’s
Euro net investment in MICTSL. The EUR15.0 million cross-currency swap was designated as a net
investment hedge to partially offset the gains/losses arising from the translation of its net investment
in MICTSL into US dollar. On March 17, 2020, the cross-currency swap matured and the net
settlement of US$0.3 million was taken to equity attributable to MICTSL’s investment carrying
value.
On June 10, 2020, ICTSI signed a Subscription Agreement with Citigroup Global Markets Limited,
Credit Suisse (Hong Kong) Limited and J.P. Morgan Securities Plc for the issuance of ten-year
senior notes (the “Senior Notes”). The Senior Notes were issued on June 17, 2020 with an aggregate
principal amount of US$400.0 million, maturing on June 17, 2030, at a fixed interest rate of 4.75
percent per annum, payable semi-annually in arrears and at a price of 99.607.
The net proceeds of the Senior Notes amounting to US$391.9 million were used to refinance and
extend the maturity of the Group’s liabilities and for general corporate purposes.
The Senior Notes were not registered with the Philippine SEC. The Senior Notes were offered in
offshore transactions outside the United States in reliance on Regulation S under the Securities Act
and, subject to certain exceptions, may not be offered or sold within the United States. The Senior
Notes are traded and listed in the Singapore Stock Exchange.
Project Finance Facilities
VICT. On July 15, 2016, VICT signed the syndicated project finance facilities with various
international and regional banks for a principal amount of US$300.0 million (AUD398.0 million),
comprising of term facilities totaling US$284.9 million (AUD378.0 million) with interest rates based
on Australian Bank Bill Swap Reference Rate (bid) (BBSY) plus an average margin of 3.1 percent
per annum and maturities until 2023, 2026 and 2031 and working capital facility of US$15.1 million
(AUD20.0 million). In 2020, VICT paid US$25.4 million (AUD38.5 million) of the loan from the
term facilities. As at June 30, 2020, the outstanding balance of the loans amounted to US$200.9
million (AUD291.1 million), net of debt issuance costs.

SEC Form 17-Q Q2 2020 63
In August 2016, VICT entered into interest rate swap transactions to hedge the interest rate
exposures on its floating rate AUD-denominated loans maturing in 2023, 2026, and 2031. A total
notional amount of AUD320.4 million floating-rate loan was swapped to a fixed rate. Under the
interest rate swap arrangements, VICT pays annual fixed interest of a range of 2.10 to 2.5875
percent and receives a floating rate of six-month Bank Bill Swap Bid Rate (BBSY) basis points on
the notional amount. In March 2017, VICT entered into additional interest rate swap transactions to
hedge an additional AUD5.5 million and AUD12.4 million of its AUD-denominated loans maturing
in 2026 and 2031, respectively. As at June 30, 2020, the market valuation loss on the outstanding
interest rate swaps amounted to AUD21.4 million (US$14.8 million).
US dollar and Foreign Currency-denominated Term Loans and Securities
CGSA. On March 29, 2016, CGSA (as “Borrower”), Metropolitan Bank and Trust Company (as
“Lender”) and ICTSI (as “Surety”) signed a loan agreement which consists of two tranches of loans
amounting to US$32.5 million (Tranche I) and US$7.5 million (Tranche II) with interest based on
three-month LIBOR plus an agreed margin. Tranche I has a final maturity in March 2021 while
Tranche II in May 2017. On May 30, 2017, CGSA fully paid the loan under Tranche II. In 2020,
CGSA has paid a total amount of US$3.8 million of the loan under Tranche I. As at June 30, 2020,
the outstanding balance of the loan with MBTC amounted to US$5.7 million.
In November 2016, ICTSI entered into an interest rate swap transaction to hedge the interest rate
exposures of the CGSA’s floating rate US$-denominated floating rate loan maturing in 2021. A
total notional amount of US$32.5 million floating rate loan was swapped to fixed rate. Under the
interest rate swap arrangements, ICTSI pays annual fixed interest of 3.045 percent and receives
floating rate of six-month LIBOR plus 160 basis points on the notional amount. As at June 30,
2020, the market valuation loss on the outstanding interest rate swaps amounted to US$33.1
thousand.
YICT. On April 26, 2017, YICT obtained a US$21.8 million (RMB150.0 million) loan from
Agricultural Bank of China at an interest rate published by People's Bank of China (PBOC) minus
an agreed margin and a final maturity in November 2023 to refinance its maturing loan. As at
June 30, 2020, the outstanding balance of the loan amounted to US$1.4 million (RMB10.0 million).
SPICTL and MITL. On April 13, 2018, Australia and New Zealand (ANZ) Banking Group (PNG)
Limited granted PGK-denominated bridge loan facilities to SPICTL and MITL amounting to
US$31.1 million (PGK101.0 million) and US$25.2 million (PGK82.0 million), respectively, with
interest based on ANZ’s published Indicator Lending Rate minus an agreed margin and initial tenor
of six months from drawdown date. The loans availed by SPICTL and MITL in April 2018 and May
2018, respectively, were both extended further and matured on December 2, 2019.
On November 27, 2019, SPICTL and MITL, as borrowers, and Australia and New Zealand (ANZ)
Banking Group (PNG) Limited, as lender, signed a loan agreement which consists of a PGK five-
year term loan facility of US$31.6 million (PGK106.9 million) and a PGK revolving loan facility of
US$5.9 million (PGK20.0 million), with interest based on ANZ’s published Indicator Lending Rate
minus an agreed margin. In 2019, SPICTL and MITL has availed US$17.8 million
(PGK60.2 million) and US$13.8 million (PGK46.7 million), respectively, from the term loan
facility. The outstanding balance of the term loans of SPICTL and MITL amounted to
US$15.5million (PGK53.3 million) and US$12.0 million (PGK41.3 million), respectively.
IDRC. On October 9, 2018, IDRC availed of a four-year term loan with Rawbank DRC amounting
to US$25.0 million at a fixed interest rate. In 2020, IDRC has paid US$3.1 million of the loan. As
at June 30, 2020, the outstanding balance of the loan amounted to US$14.6 million.
On May 6, 2019, IDRC availed of another four-year term loan with Rawbank DRC amounting to
US$3.0 million at a fixed interest rate. In 2020, IDRC has paid US$0.3 million of the loan. As at
June 30, 2020, the outstanding balance of the loan amounted to US$2.2 million.
SEC Form 17-Q Q2 2020 64
ICTSI Middle East DMCC. On January 9, 2019, ICTSI Middle East DMCC, as borrower, and
ICTSI, as guarantor, signed a term loan facility agreement with Citigroup Global Markets Asia
Limited and Standard Chartered Bank, the original mandated lead arrangers and bookrunners, for the
principal amount of US$297.6million (EUR260.0 million) with interest rate based on EURIBOR
plus an agreed margin and maturing on December 20, 2022. The term facility agreement was
entered into pursuant to the Loan Facility Programme Agreement dated July 24, 2014 between
ICTSI Global Finance B.V. as the borrower, ICTSI as the guarantor, and The Bank of New York
Mellon, Singapore Branch as the trustee (“Loan Programme”). ICTSI Middle East DMCC acceded
to the Loan Programme as an additional borrower and an additional obligor thereunder.
On January 10, 2019, ICTSI Middle East DMCC has fully drawn the EUR260.0 million from the
facility. On June 12, 2019, ICTSI Middle East DMCC, as borrower, and ICTSI, as guarantor, signed
an amendment and syndication agreement with various international and local banks for the term
loan facility. On July 15, 2019 and December 17, 2019, partial pre-payment of US$219.1 million
(EUR195.2 million) and US$30.0 million (EUR26.8 million), respectively, was made on the
EUR260 term loan facility. As at June 30, 2020, the outstanding balance of the loan amounted to
US$42.6 million (EUR37.9 million), net of debt issuance costs.
ICTSI Global Finance B.V.. On March 21, 2019, IGFBV, as borrower, Metropolitan Bank and Trust
Company, as lender, and ICTSI, as surety, signed a term loan facility amounting to
US$300.0 million with interest based on three-month LIBOR plus an agreed margin and a tenor of 7
years. On April 29, 2019, IGFBV has fully availed the term loan facility. As at June 30, 2020, the
outstanding balance of the term loan facility amounted to US$287.6 million, net of debt issuance
costs.
In April 2019, ICTSI entered into an interest rate swap transaction to hedge the interest rate
exposures of the ICTSI Global Finance B.V.’s floating rate US$-denominated floating rate loan
maturing in 2026. A total notional amount of US$300.0 million floating rate loan was swapped to
fixed rate. Under the interest rate swap arrangements, ICTSI pays annual fixed interest of 3.6981
percent and receives floating rate of three-month LIBOR plus 130 basis points on the notional
amount. As at June 30, 2020, the market valuation loss on the outstanding interest rate swaps
amounted to US$31.7 million.
On November 26, 2019, December 5, 2019 and January 6, 2020, IGFBV availed of an 18-month
loan from MUFG Bank Ltd. (MUFG) with interest based on three-month LIBOR plus an agreed
margin, amounting to US$45.0 million, US$45.0 million and US$20.0 million, respectively. IGFBV
fully paid the loans on June 18, 2020.
On March 13, 2020, ICTSI availed of short-term loans from Citibank N.A., Philippine National
Bank (PNB), and Standard Chartered Bank (SCB) totaling to US$200.0 million at prevailing market
rates with maturity dates of June 11, 2020 and September 9, 2020. ICTSI fully paid the loans with
Citibank, PNB, and SCB on June 11, 2020, June 15, 2020 and June 18, 2020, respectively.
On March 20, 2020, ICTSI availed additional short-term loans from MUFG and HSBC totaling to
US$90.0 million at prevailing market rates with maturity dates of September 18, 2020 and March
22, 2021. ICTSI fully paid the loans on June 18, 2020.
On March 24, 2020, ICTSI Parent availed of 18-month loan from Metropolitan Bank and Trust Co.
(MBTC) amounting to US$100.0 million with interest based on prevailing market rate. ICTSI fully
paid the loan on June 18, 2020.
On April 14, 2020, ICTSI availed of 18-month loans from MBTC totaling to Php1.5 billion
(US$29.6 million) with interest based on the prevailing market rate. The loans will mature on
October 14, 2021.

SEC Form 17-Q Q2 2020 65
2.7.2.2 Covenants
The loans from local and foreign banks impose certain restrictions with respect to corporate
reorganization, disposition of all or a substantial portion of ICTSI’s and subsidiaries’ assets,
acquisitions of futures or stocks, and extending loans to others, except in the ordinary course of
business. ICTSI is also required to comply with a specified financial ratio relating to their debt to
EBITDA up to 4 times when incurring additional debt.
There was no material change in the covenants related to the Group’s long-term debts. As at
June 30, 2020, ICTSI and subsidiaries were in compliance with their loan covenants except for
VICT whose Debt Service Coverage Ratio requirement was not met but having been irrevocably
waived by the creditors on December 20, 2019, no event of default has occurred.
There were no other significant transactions pertaining to the Group’s long-term debt as at
June 30, 2020, except as discussed above.
2.7.2.3 Equity Financing
Perpetual Capital Securities
On January 29, 2015, RCBV issued US$300.0 million 6.25 percent Senior Guaranteed Perpetual
Capital Securities unconditionally and irrevocably guaranteed by ICTSI at a price of 99.551 percent
or US$298.7 million. The new issue was partly used to finance the tendered US$230.0 million
8.375 percent Subordinated Guaranteed Perpetual Capital Securities (“Original Securities) at a
tender price of 107.625 or US$247.5 million. The cash proceeds received by RCBV amounted to
US$46.7 million, net of debt issuance cost.
On August 26, 2015, RCBV issued US$450.0 million 5.50 percent Senior Guaranteed Perpetual
Capital Securities unconditionally and irrevocably guaranteed by ICTSI. The cash proceeds
received by RCBV amounted to US$436.3 million, net of debt issue cost, will be used for
refinancing, funding capital expenditures and general corporate purposes.
On March 10, 2016, RCBV (the “Issuer”) and ICTSI (the “Guarantor”) sent a notice to The Hong
Kong and Shanghai Banking Corporation Limited (HSBC, as “Trustee” and “Agent”) for the
redemption of the remaining US$108.3 million of the US$350-million Subordinated Guaranteed
Perpetual Capital Securities and payment of accrued distributions. The securities were eventually
redeemed in May 2016.
On October 3, 2016, RCBV tendered its US$300.0 million 6.25 percent and US$450.0 million 5.50
percent Senior Guaranteed Perpetual Capital Securities for redemption at a price of 106.75 and
105.75, respectively. On October 20, 2016, RCBV redeemed a total of US$345.5 million of the
tendered securities and paid the associated accrued distributions of US$9.3 million. Together with
the redemption, RCBV issued US$375.0 million 4.875 percent Senior Guaranteed Perpetual Capital
Securities unconditionally and irrevocably guaranteed by ICTSI at a price of 99.225 percent. The
new issue was used to finance the redemption and payment of accrued distributions of the tendered
securities
On January 10, 2018, the Board approved the principal terms and conditions of the
US$350.0 million 5.875 percent fixed-for-life Senior Guaranteed Perpetual Capital Securities (the
“New Securities”). The New Securities were unconditionally and irrevocably guaranteed by ICTSI
at par. On January 11, 2018, the Board approved the issuance of additional Senior Guaranteed
Perpetual Capital Securities amounting to US$50.0 million (“Additional Securities”) which was
consolidated and formed a single series with the New Securities initially offered on January 10,
2018. The Additional Securities were also unconditionally and irrevocably guaranteed by
ICTSI. The cash proceeds received by RCBV from the issuance of the New and Additional

SEC Form 17-Q Q2 2020 66
Securities amounted to US$392.3 million, net of debt issuance costs, which shall be used for the
financing of acquisitions and capital expenditures and for general corporate purposes.
On March 14, 2019, RCBV (the “Issuer”) and ICTSI (the “Guarantor”) sent a notice to The Hong
Kong and Shanghai Banking Corporation Limited (HSBC, as “Trustee” and “Agent”) for the
redemption of the remaining US$139.7 million of the US$300-million Senior Guaranteed Perpetual
Capital Securities (“Securities”) and payment of accrued distributions on May 5, 2019. The
securities were redeemed on May 2, 2019.
2.8 Risks
ICTSI and its subsidiaries’ geographically diverse operations expose the Group to various market
risks, particularly foreign exchange risk, interest rate risk and liquidity risk, which movements may
materially impact the financial results of the Group. The importance of managing these risks has
significantly increased in light of the heightened volatility in both the Philippine and international
financial markets.
With a view to managing these risks, the Group has incorporated a financial risk management
function in its organization, particularly in the treasury operations.
2.8.1 Foreign Exchange Risk
The Group has geographically diverse operations and transacts in currencies other than its functional
currency. Consequently, the Group is exposed to the risk of fluctuation of the exchange rates
between the US dollar and other local currencies such as PHP, AUD, BRL, MXN and EUR that may
adversely affect its results of operations and financial position. The Group attempts to match its
revenues and expenses whenever possible and, from time to time, engages in hedging activities.
Changes in exchange rates affect the US dollar value of the Group’s revenues and costs that are
denominated in foreign currencies. The Group also enters into cross currency swap agreements in
order to manage its exposure to fluctuations in the net investments in its subsidiaries denominated in
foreign currencies.
The Group’s non-US dollar currency-linked revenues was 51.4 percent and 52.7 percent of gross
revenues for the periods ended June 30, 2019 and 2020, respectively. Foreign currency-linked
revenues include the following: (1) arrastre charges of MICT; and (2) non-US dollar revenues of
international subsidiaries. ICTSI incurs expenses in foreign currency for the operating and start up
requirements of its international subsidiaries. Concession fees payable to port authorities in certain
countries are either denominated in or linked to the US dollar.
The table below provides the currency breakdown of the Group’s revenue for the six months ended
June 30, 2020:
Table 2.16 Revenue Currency Profile
Subsidiary USD/EUR Composition Local Currency
ICTSI 38% USD 62% PhP SBITC/ICTSI Subic 45% USD 55% PhP
DIPSSCOR 100% PhP
HIPS 100% PhP SCIPSI 100% PhP
BIPI 100% PhP
MICTSI 100% PhP LGICT 11% USD 89% PhP
CGT 100% PhP
BCT 66% USD/10% EUR 24% PLN TSSA 100% BRL
MICTSL 100% EUR* PTMTS 100% IDR YICT 100% RMB
AGCT 79% EUR 21% HRK
(Forward)

SEC Form 17-Q Q2 2020 67
Subsidiary USD/EUR Composition Local Currency
CGSA 100% USD
BICTL 100% USD PICT 80% USD 20% PKR
OJA 73% USD 27% IDR
CMSA 36% USD 64% MXN OPC 100% USD
ICTSI Iraq 81% USD 19% IQD
IDRC 100% USD Tecplata 100% USD
ICTSI Rio 49% USD 51% BRL
VICT 100% AUD PNG 100% PGK
*MGA pegged to the EURO
2.8.2 Interest Rate Risk
The Group’s exposure to market risk for changes in interest rates (cash flow interest rate risk) relates
primarily to the Group’s bank loans and is addressed by a periodic review of the Group’s debt mix
with the objective of reducing interest cost and maximizing available loan terms. The Group also
enters into interest rate swap agreements in order to manage its exposure to interest rate fluctuations.
2.8.3 Liquidity Risk
The Group manages its liquidity profile to be able to finance its working capital and capital
expenditure requirements through internally generated cash and proceeds from debt and/or equity.
As part of the liquidity risk management, the Group maintains strict control of its cash and makes
sure that excess cash held by subsidiaries are upstreamed timely to the Parent Company. The Group
also monitors the receivables and payables turnover to ensure that these are at optimal levels. In
addition, it regularly evaluates its projected and actual cash flow information and continually
assesses the conditions in the financial market to pursue fund raising initiatives. These initiatives
may include accessing bank loans, project finance facilities and the debt capital markets.
ICTSI monitors and maintains a level of cash and cash equivalents and bank credit facilities deemed
adequate to finance the Group’s operations, ensure continuity of funding and to mitigate the effects
of fluctuations in cash flows.
There are no other known trends, demands, commitments, events or uncertainties that will materially
affect the company’s liquidity.

SEC Form 17-Q Q2 2020 68
PART II – OTHER INFORMATION
There are no other information not previously reported in SEC Form 17-C that need to be reported in
this section.

SEC Form 17-Q Q2 2020 69
ANNEX 1
INTERNATIONAL CONTAINER TERMINAL SERVICES, INC.
AND SUBSIDIARIES
SCHEDULE OF AGING OF RECEIVABLES
As at June 30, 2020
(Unaudited, in Thousands)
Trade Advances Total
Under six months US$88,483 US$24,766 US$113,249
Six months to one year 836 881 1,717
Over one year 407 1,877 2,284
US$89,726 US$27,524 US$117,250

SEC Form 17-Q Q2 2020 70
ANNEX 2
INTERNATIONAL CONTAINER TERMINAL SERVICES, INC.
AND SUBSIDIARIES
FINANCIAL SOUNDNESS INDICATORS
As at and for the Six Months Ended June 30
2019 2020
Liquidity ratios
Current ratio (a) 0.79 1.16
Interest rate coverage ratio (b) 7.90 8.01
Solvency ratios
Debt to equity ratio (c) 1.13 1.19
Asset to equity ratio (d) 3.44 3.76
Profitability ratio
EBITDA margin (e) 56.5% 57.5%
(a) Current assets over current liabilities
(b) EBITDA over interest expense and financing charges on borrowings
(c) Interest-bearing debts over total equity
(d) Total assets over total equity
(e) EBITDA over gross revenues from port operations
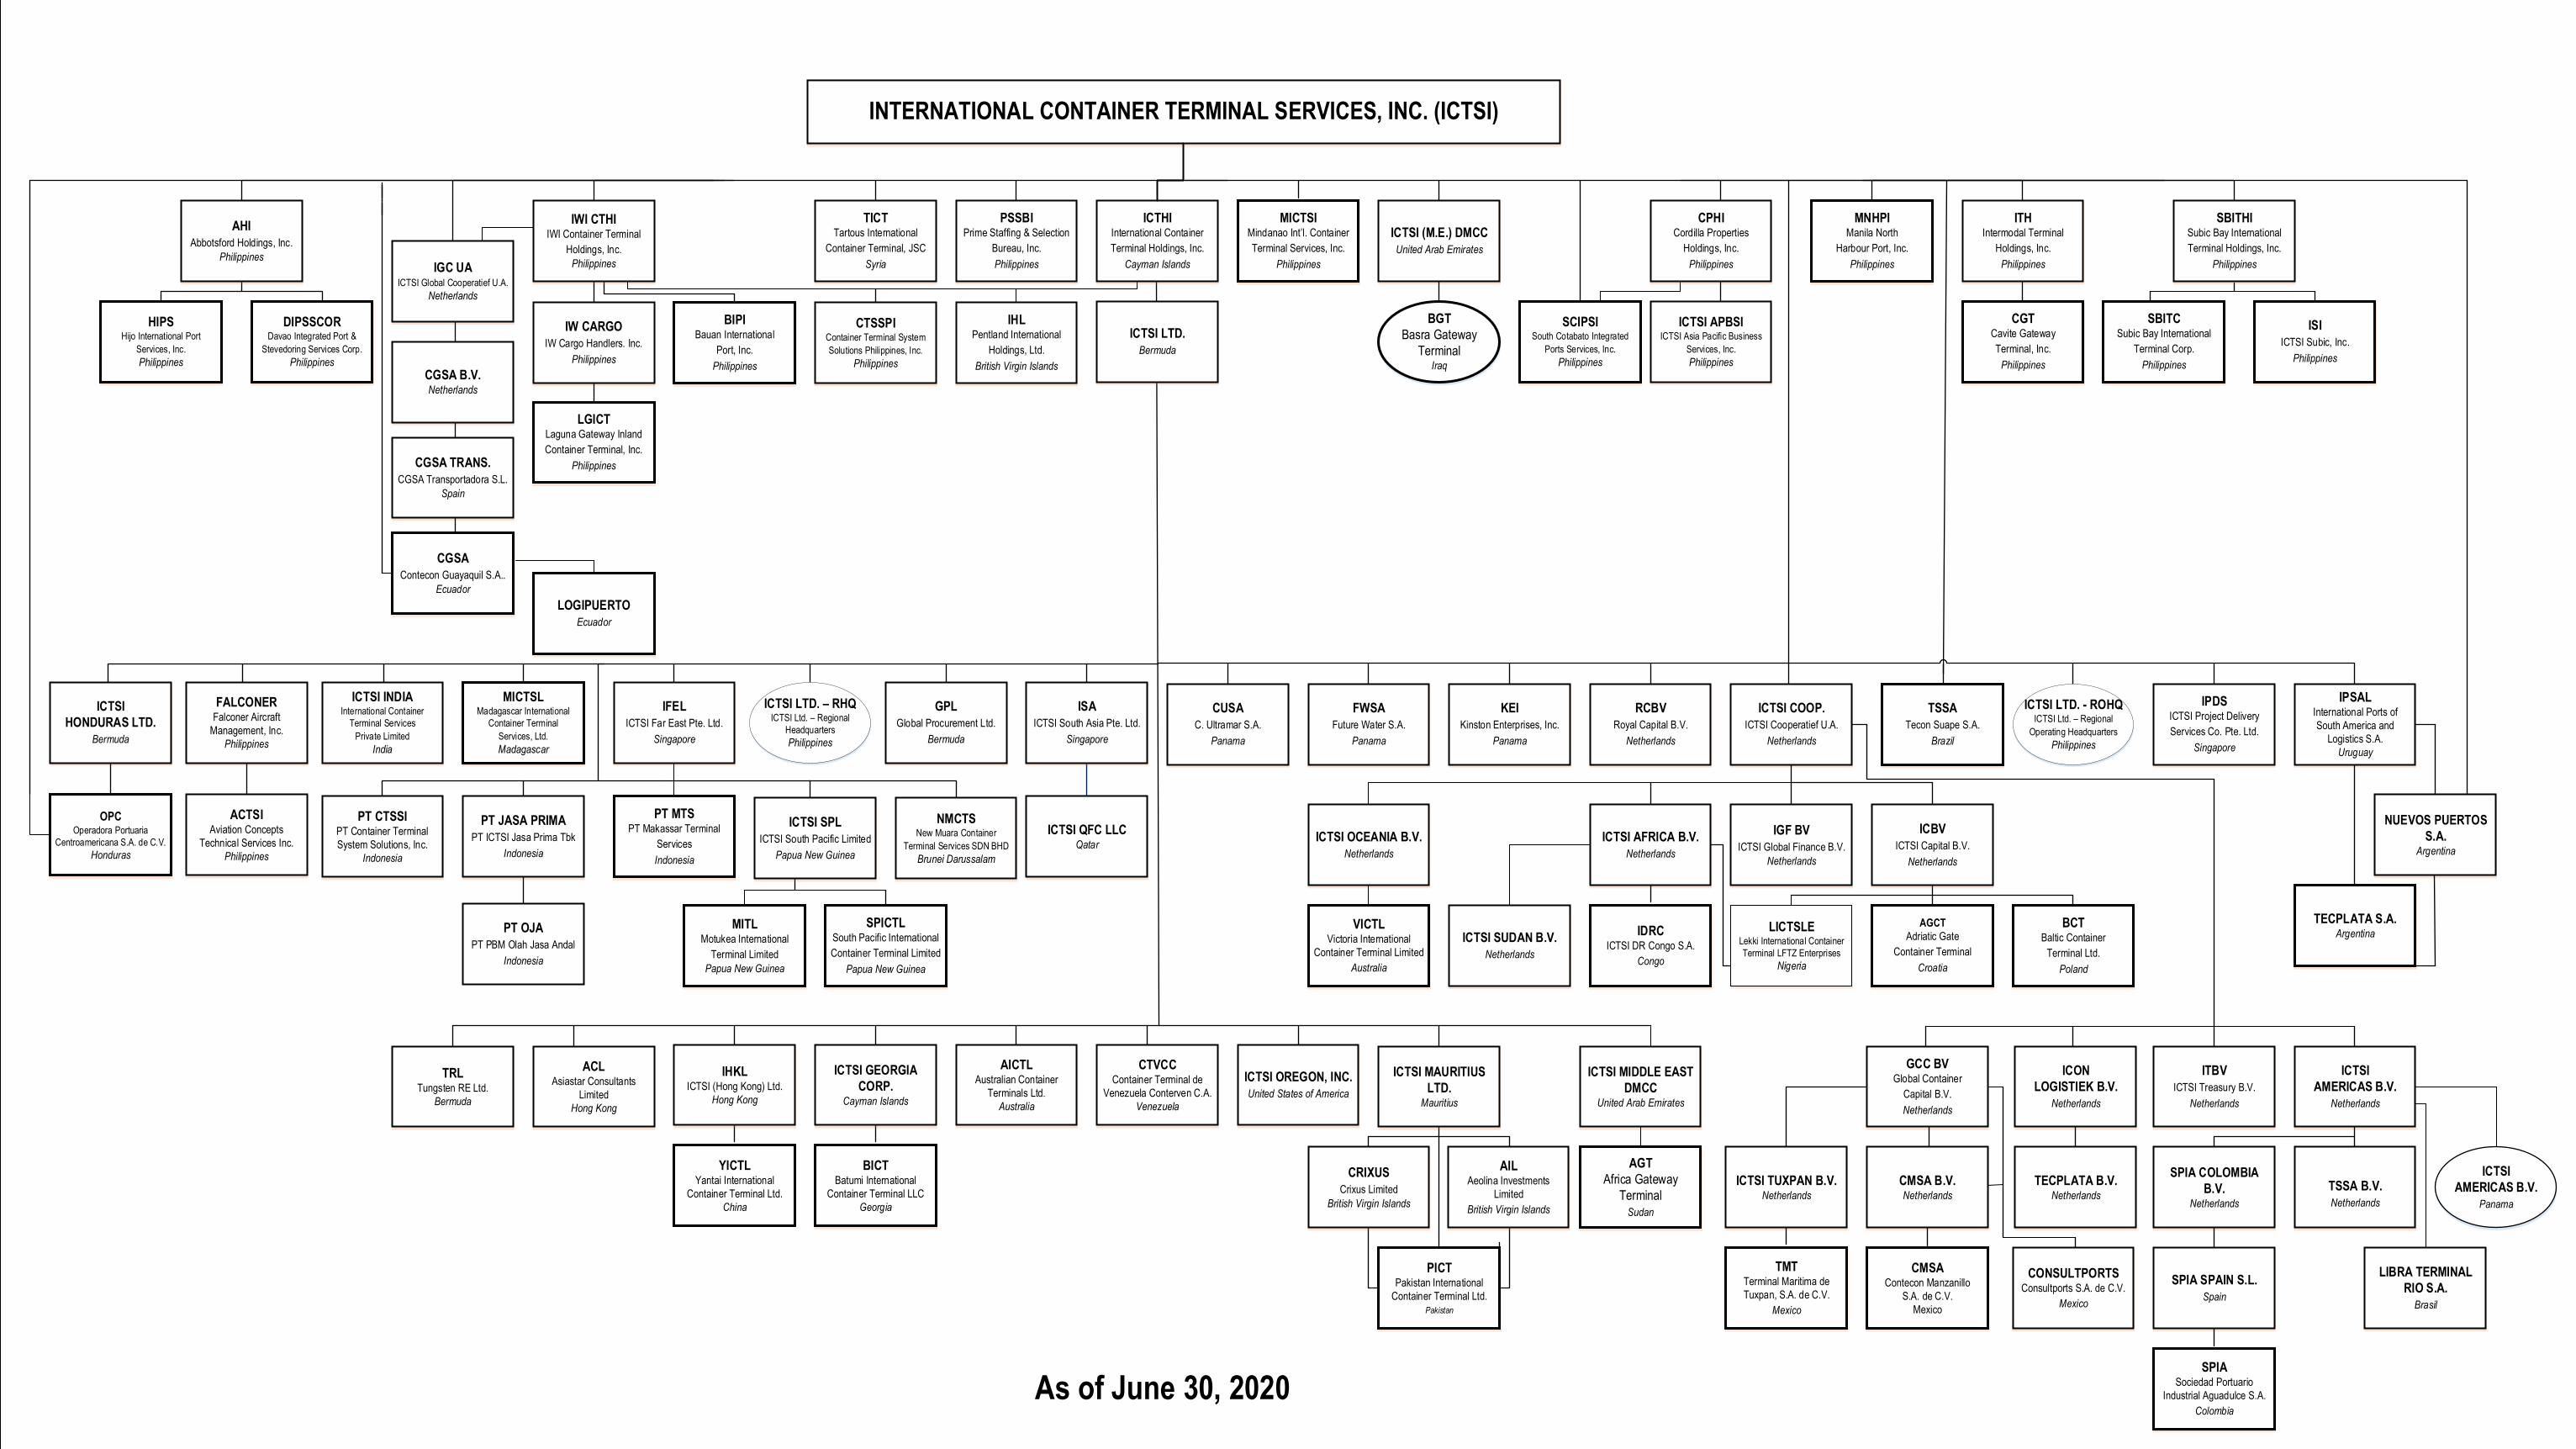
INTERNATIONAL CONTAINER TERMINAL SERVICES, INC. (ICTSI)
ICTHIInternational Container
Terminal Holdings, Inc.
Cayman Islands
ICTSI LTD.
Bermuda
PSSBIPrime Staffing & Selection
Bureau, Inc.
Philippines
TICTTartous International
Container Terminal, JSC
Syria
ISI
ICTSI Subic, Inc.
Philippines
IWI CTHIIWI Container Terminal
Holdings, Inc.
PhilippinesIGC UAICTSI Global Cooperatief U.A.
Netherlands
AHI
Abbotsford Holdings, Inc.
Philippines
MICTSIMindanao Int’l. Container
Terminal Services, Inc.
Philippines
ICTSI (M.E.) DMCC
United Arab Emirates
CPHICordilla Properties
Holdings, Inc.
Philippines
SBITHISubic Bay International
Terminal Holdings, Inc.
Philippines
ITHIntermodal Terminal
Holdings, Inc.
Philippines
LGICTLaguna Gateway Inland
Container Terminal, Inc.
Philippines
ICTSI
HONDURAS LTD.
Bermuda
CUSA
C. Ultramar S.A.
Panama
FWSA
Future Water S.A.
Panama
KEI
Kinston Enterprises, Inc.
Panama
RCBV
Royal Capital B.V.
Netherlands
ICTSI COOP.
ICTSI Cooperatief U.A.
Netherlands
TSSA
Tecon Suape S.A.
Brazil
IPDSICTSI Project Delivery
Services Co. Pte. Ltd.
Singapore
IPSALInternational Ports of
South America and
Logistics S.A.
Uruguay
OPCOperadora Portuaria
Centroamericana S.A. de C.V.
Honduras
PT CTSSI PT Container Terminal
System Solutions, Inc.
Indonesia
PT MTSPT Makassar Terminal
Services
Indonesia
ICTSI QFC LLCQatar
NUEVOS PUERTOS
S.A.Argentina
ICTSI AFRICA B.V.
Netherlands
ICTSI OCEANIA B.V.
Netherlands
ICTSI SUDAN B.V.
Netherlands
TECPLATA S.A.Argentina
AGCT
Adriatic Gate
Container Terminal
Croatia
LICTSLELekki International Container
Terminal LFTZ Enterprises
Nigeria
IDRCICTSI DR Congo S.A.
Congo
VICTLVictoria International
Container Terminal Limited
Australia
BICTBatumi International
Container Terminal LLC
Georgia
YICTLYantai International
Container Terminal Ltd.
China
PT OJA
PT PBM Olah Jasa Andal
Indonesia
ICTSI MIDDLE EAST
DMCCUnited Arab Emirates
ICTSI
AMERICAS B.V.
Netherlands
ICON
LOGISTIEK B.V.
Netherlands
ITBV
ICTSI Treasury B.V.
Netherlands
SPIA COLOMBIA
B.V.Netherlands
TECPLATA B.V.Netherlands
SPIA SPAIN S.L.
Spain
SPIASociedad Portuario
Industrial Aguadulce S.A.
Colombia
IHLPentland International
Holdings, Ltd.
British Virgin Islands
IW CARGO
IW Cargo Handlers. Inc.
Philippines
CGSA B.V.Netherlands
CGSA TRANS.
CGSA Transportadora S.L.
Spain
As of June 30, 2020
ICTSI MAURITIUS
LTD.Mauritius
SCIPSISouth Cotabato Integrated
Ports Services, Inc.
Philippines
ICTSI APBSIICTSI Asia Pacific Business
Services, Inc.
Philippines
SBITCSubic Bay International
Terminal Corp.
Philippines
CGTCavite Gateway
Terminal, Inc.
Philippines
BIPIBauan International
Port, Inc.
Philippines
ICTSI LTD. - ROHQICTSI Ltd. – Regional
Operating Headquarters
Philippines
PT JASA PRIMA
PT ICTSI Jasa Prima Tbk
Indonesia
TSSA B.V.
Netherlands
ISA
ICTSI South Asia Pte. Ltd.
Singapore
GPL
Global Procurement Ltd.
Bermuda
IFEL
ICTSI Far East Pte. Ltd.
Singapore
MICTSLMadagascar International
Container Terminal
Services, Ltd.
Madagascar
ICTSI INDIAInternational Container
Terminal Services
Private Limited
India
ICTSI LTD. – RHQICTSI Ltd. – Regional
Headquarters
Philippines
AILAeolina Investments
Limited
British Virgin Islands
CRIXUS
Crixus Limited
British Virgin Islands
PICTPakistan International
Container Terminal Ltd.
Pakistan
ICBV
ICTSI Capital B.V.
Netherlands
BCTBaltic Container
Terminal Ltd.
Poland
HIPSHijo International Port
Services, Inc.
Philippines
DIPSSCORDavao Integrated Port &
Stevedoring Services Corp.
Philippines
ICTSI
AMERICAS B.V.
Panama
CTSSPIContainer Terminal System
Solutions Philippines, Inc.
Philippines
NMCTSNew Muara Container
Terminal Services SDN BHD
Brunei Darussalam
SPICTLSouth Pacific International
Container Terminal Limited
Papua New Guinea
MITLMotukea International
Terminal Limited
Papua New Guinea
ICTSI SPL
ICTSI South Pacific Limited
Papua New Guinea
ACLAsiastar Consultants
Limited
Hong Kong
ICTSI OREGON, INC.
United States of America
CTVCCContainer Terminal de
Venezuela Conterven C.A.
Venezuela
AICTLAustralian Container
Terminals Ltd.
Australia
ICTSI GEORGIA
CORP.Cayman Islands
IHKLICTSI (Hong Kong) Ltd.
Hong Kong
IGF BV
ICTSI Global Finance B.V.
Netherlands
TRLTungsten RE Ltd.
Bermuda
MNHPIManila North
Harbour Port, Inc.
Philippines
CMSAContecon Manzanillo
S.A. de C.V.
Mexico
TMTTerminal Maritima de
Tuxpan, S.A. de C.V.
Mexico
CMSA B.V.Netherlands
ICTSI TUXPAN B.V.Netherlands
CONSULTPORTSConsultports S.A. de C.V.
Mexico
GCC BVGlobal Container
Capital B.V.
Netherlands
BGT
Basra Gateway
TerminalIraq
AGT
Africa Gateway
Terminal
Sudan
CGSA
Contecon Guayaquil S.A..
Ecuador
FALCONERFalconer Aircraft
Management, Inc.
Philippines
ACTSIAviation Concepts
Technical Services Inc.
Philippines
LIBRA TERMINAL
RIO S.A.
Brasil
LOGIPUERTO
Ecuador