ict solutions for highly-customized water demand management strategies
TRANSCRIPT

ICT solutions for highly-customized water demand management strategies
M. Giuliani, A. Cominola, A. Castelletti, P. Fraternali, J. Guardiola, J. Barba, M. Pulido-Velazquez, A.E. Rizzoli

Residential water demand modeling & management
resolution depends on the installed meter, the logging time can beshortened without installation of smart meters but simplyincreasing the traditional reading frequency by the users. However,so far only ad-hoc studies systematically collected and analyzeddata at daily resolution (e.g., Olmstead et al., 2007; Wong et al.,2010) and few water companies (e.g., Water Corporation in West-ern Australia and ThamesWater in London) started increasing theirreading frequency by direct involvement of their customers, whoare invited to self-read their consumption and communicate itonline to the water company (e.g., Anda et al., 2013).
2.2. High resolution data
The advent of high resolution sensors, with their ability ofsampling water consumption on sub-daily basis, opened up a newpotential to better characterize domestic water consumption. Twodistinctive metering approaches can be distinguished: intrusivemetering, which ensures direct estimates of the residential waterend-uses by installing high resolution sensors on-device, namelyone sensor for each water consuming appliance (e.g., washingmachine, toilet flush, shower-head); non-intrusive metering, whichregisters the total water flow at the household level over one singledetection point for the whole house.
Intrusive metering (see Rowlands et al., 2014, and referencestherein) is generally considered inapplicable in real-world, large-scale analysis as the number of sensors to be installed makes thisapproach resource intensive, costly, and hardly accepted byhousehold occupants (Cordell et al., 2003; Kim et al., 2008). On thecontrary, non-intrusive metering represents a more acceptable,though less accurate, alternative (Mayer and DeOreo, 1999). How-ever, this approach requires disaggregation algorithms to break-down the total consumption data at the household level into thedifferent end-use categories (see Section 3).
Several types of sensors have been developed (Table 2) byexploiting different technologies and physical properties of thewater flow (for a review see Arregui et al., 2006, and referencestherein):
! Accelerometers (e.g., Evans et al., 2004), which analyze vibra-tions in a pipe induced by the turbulence of the water flow. Asampling frequency of 100 Hz of the pipe vibrations allows
reconstructing the average flow within the pipe with a resolu-tion of 0.015 L (Kim et al., 2008).
! Ultrasonic sensors (Mori et al., 2004), which estimate the flowvelocity, and then determine the flow rate knowing the pipesection, by measuring the difference in time between ultrasonicbeams generated by piezoelectric devices and transmittedwithin the water flow. The transducers are generally operated inthe range 0.5e2 MHz and allow attaining an average resolutionaround 0.0018 L (e.g., Sanderson and Yeung, 2002).
! Pressure sensors (Froehlich et al., 2009, 2011), which consist insteel devices, equipped with an analog-digital converter and amicro-controller, continuously sampling pressure with a theo-retical maximum resolution of 2 kHZ. Flow rate is related to thepressure change generated by the opening/close of the waterdevices valves via Poiseuille's Law.
! Flowmeters (Mayer and DeOreo, 1999), which exploit the waterflow to spin either pistons (mechanic flow meters) or magnets(magnetic meters) and correlate the number of revolutions orpulse to the water volume passing through the pipe. Sensingresolution spans between 34.2 and 72 pulses per liter (i.e., 1pulse every 0.029 and 0.014 L, respectively) associated to alogging frequency in the range of 1e10 s (Kowalski andMarshallsay, 2005; Heinrich, 2007; Willis et al., 2013).
So far, only flow meters and pressure sensors have beenemployed in smart meters applications because ultrasonic sensorsare too costly and the use of accelerometers requires an intrusivecalibration phase with the placement of multiple meters distrib-uted on the pipe network for each single device of interest (Kimet al., 2008). It is worth noting that the “smartness” of these sen-sors is related both to their high sampling resolution and to theirintegration in efficient systems combining data collection, transfer,storage, and analysis. Although sensors can be equipped with dataloggers requiring human intervention to retrieve the data directlyfrom the sensors (Mayer et al., 2004), bluetooth and wireless con-nections have been recently exploited for improving data man-agement. For example, Froehlich et al. (2009) installed a network ofpressure sensors communicating via bluetooth with a laptopdeployed at each household, which runs a custom data logger toreceive, compress, and archive data. These latter are then uploadedto a web server at 30-min intervals.
2.3. Research challenges and future directions
While smart meters are becoming easily available, we identifieda list of open research and technical challenges that need to beaddressed to promote the coherent use of this wide range oftechnologies:
1. The first open research question relates to the management ofthe metered high resolution flow data. In particular, the devel-opment of robust, automated processes to transfer the gener-ated big data requires further elaborations, both in terms ofhardware and software performance due to existing issues withrespect towireless network reliability, black spots, power sourceand battery life (Stewart et al., 2010; Little and Flynn, 2012). Allthese aspects appear key also because the possibility of inte-grating water and energy meters and using the same data log-gers and transmission systems is expected to enhance thediffusion of high resolution water sensors (Benzi et al., 2011;Froes Lima and Portillo Navas, 2012).
2. The second open challenge concerns the design of centralized ordistributed information systems to store the data collected bythe smart meters (Oracle, 2009). A centralized system wouldallow checking the accuracy of the collected data, which can
Fig. 2. Five-years count of the 134 publications reviewed in this study.
A. Cominola et al. / Environmental Modelling & Software 72 (2015) 198e214200
Benefits and challenges of using smart meters for advancingresidential water demand modeling and management: A review
A. Cominola a, M. Giuliani a, D. Piga b, A. Castelletti a, c, *, A.E. Rizzoli da Department of Electronics, Information, and Bioengineering, Politecnico di Milano, Milan, Italyb IMT Institute for Advanced Studies Lucca, Lucca, Italyc Institute of Environmental Engineering, ETH Zurich, Zurich, Switzerlandd Istituto Dalle Molle di Studi sull'Intelligenza Artificiale, SUPSI-USI, Lugano, Switzerland
a r t i c l e i n f o
Article history:Received 2 April 2015Received in revised form21 July 2015Accepted 21 July 2015Available online xxx
Keywords:Smart meterResidential water managementWater demand modelingWater conservation
a b s t r a c t
Over the last two decades, water smart metering programs have been launched in a number of mediumto large cities worldwide to nearly continuously monitor water consumption at the single householdlevel. The availability of data at such very high spatial and temporal resolution advanced the ability incharacterizing, modeling, and, ultimately, designing user-oriented residential water demand manage-ment strategies. Research to date has been focusing on one or more of these aspects but with limitedintegration between the specialized methodologies developed so far. This manuscript is the firstcomprehensive review of the literature in this quickly evolving water research domain. The papercontributes a general framework for the classification of residential water demand modeling studies,which allows revising consolidated approaches, describing emerging trends, and identifying potentialfuture developments. In particular, the future challenges posed by growing population demands, con-strained sources of water supply and climate change impacts are expected to require more and moreintegrated procedures for effectively supporting residential water demand modeling and management inseveral countries across the world.
© 2015 Elsevier Ltd. All rights reserved.
1. Introduction
World's urban population is expected to raise from current54%e66% in 2050 and to further increase as a consequence of theunlikely stabilization of human population by the end of the cen-tury (Gerland et al., 2014). By 2030 the number of mega-cities,namely cities with more than 10 million inhabitants, will growover 40 (UNDESA, 2010). This will boost residential water demand(Cosgrove and Cosgrove, 2012), which nowadays covers a largeportion of the public drinking water supply worldwide (e.g.,60e80% in Europe (Collins et al., 2009), 58% in the United States(Kenny et al., 2009)).
The concentration of the water demands of thousands or mil-lions of people into small areas will considerably raise the stress onfinite supplies of available freshwater (McDonald et al., 2011a).Besides, climate and land use change will further increase the
number of people facingwater shortage (McDonald et al., 2011b). Insuch context, water supply expansion through the construction ofnew infrastructures might be an option to escape water stress insome situations. Yet, geographical or financial limitations largelyrestrict such options in most countries (McDonald et al., 2014).Here, acting on the water demand management side through thepromotion of cost-effective water-saving technologies, revisedeconomic policies, appropriate national and local regulations, andeducation represents an alternative strategy for securing reliablewater supply and reduce water utilities' costs (Gleick et al., 2003).
In recent years, a variety of water demand management stra-tegies (WDMS) has been applied (for a review, see Inman andJeffrey, 2006, and references therein). However, the effectivenessof these WDMS is often context-specific and strongly depends onour understanding of the drivers inducing people to consume orsave water (Jorgensen et al., 2009). Models that quantitativelydescribe how water demand is influenced and varies in relation toexogenous uncontrolled drivers (e.g., seasonality, climatic condi-tions) and demand management actions (e.g., water restrictions,pricing schemes, education campaigns) are essential to explorewater users' response to alternative WDMS, ultimately supporting
* Corresponding author. Department of Electronics, Information, and Bioengi-neering, Politecnico di Milano, Milan, Italy.
E-mail address: [email protected] (A. Castelletti).
Contents lists available at ScienceDirect
Environmental Modelling & Software
journal homepage: www.elsevier .com/locate/envsoft
http://dx.doi.org/10.1016/j.envsoft.2015.07.0121364-8152/© 2015 Elsevier Ltd. All rights reserved.
Environmental Modelling & Software 72 (2015) 198e214
36%
43%
13%6%
<1%
Analysis of 134 studies over the last 25 yearsCominola et al. (2015), Environmental Modelling & Software

A general procedure
Low resolution data
High resolution data
non-intrusive metering
intrusive metering
1. DATA GATHERING
Decision tree algorithms
Machine learning algorithms
2. WATER END USES CHARACTERIZATION
Descriptive models
Prescriptive models
behavioural modelling
multivariate analysis
3. USER MODELLING
4.PERSONALIZED WDMS
water consumption at the appliance-level
billed data
disaggregated water end uses
water consumption at the household-level
disaggregated water end uses
qualitative info on drivers of water consumption
quantitative prediction of users’ behaviours
High-resolution smart metered water consumption data
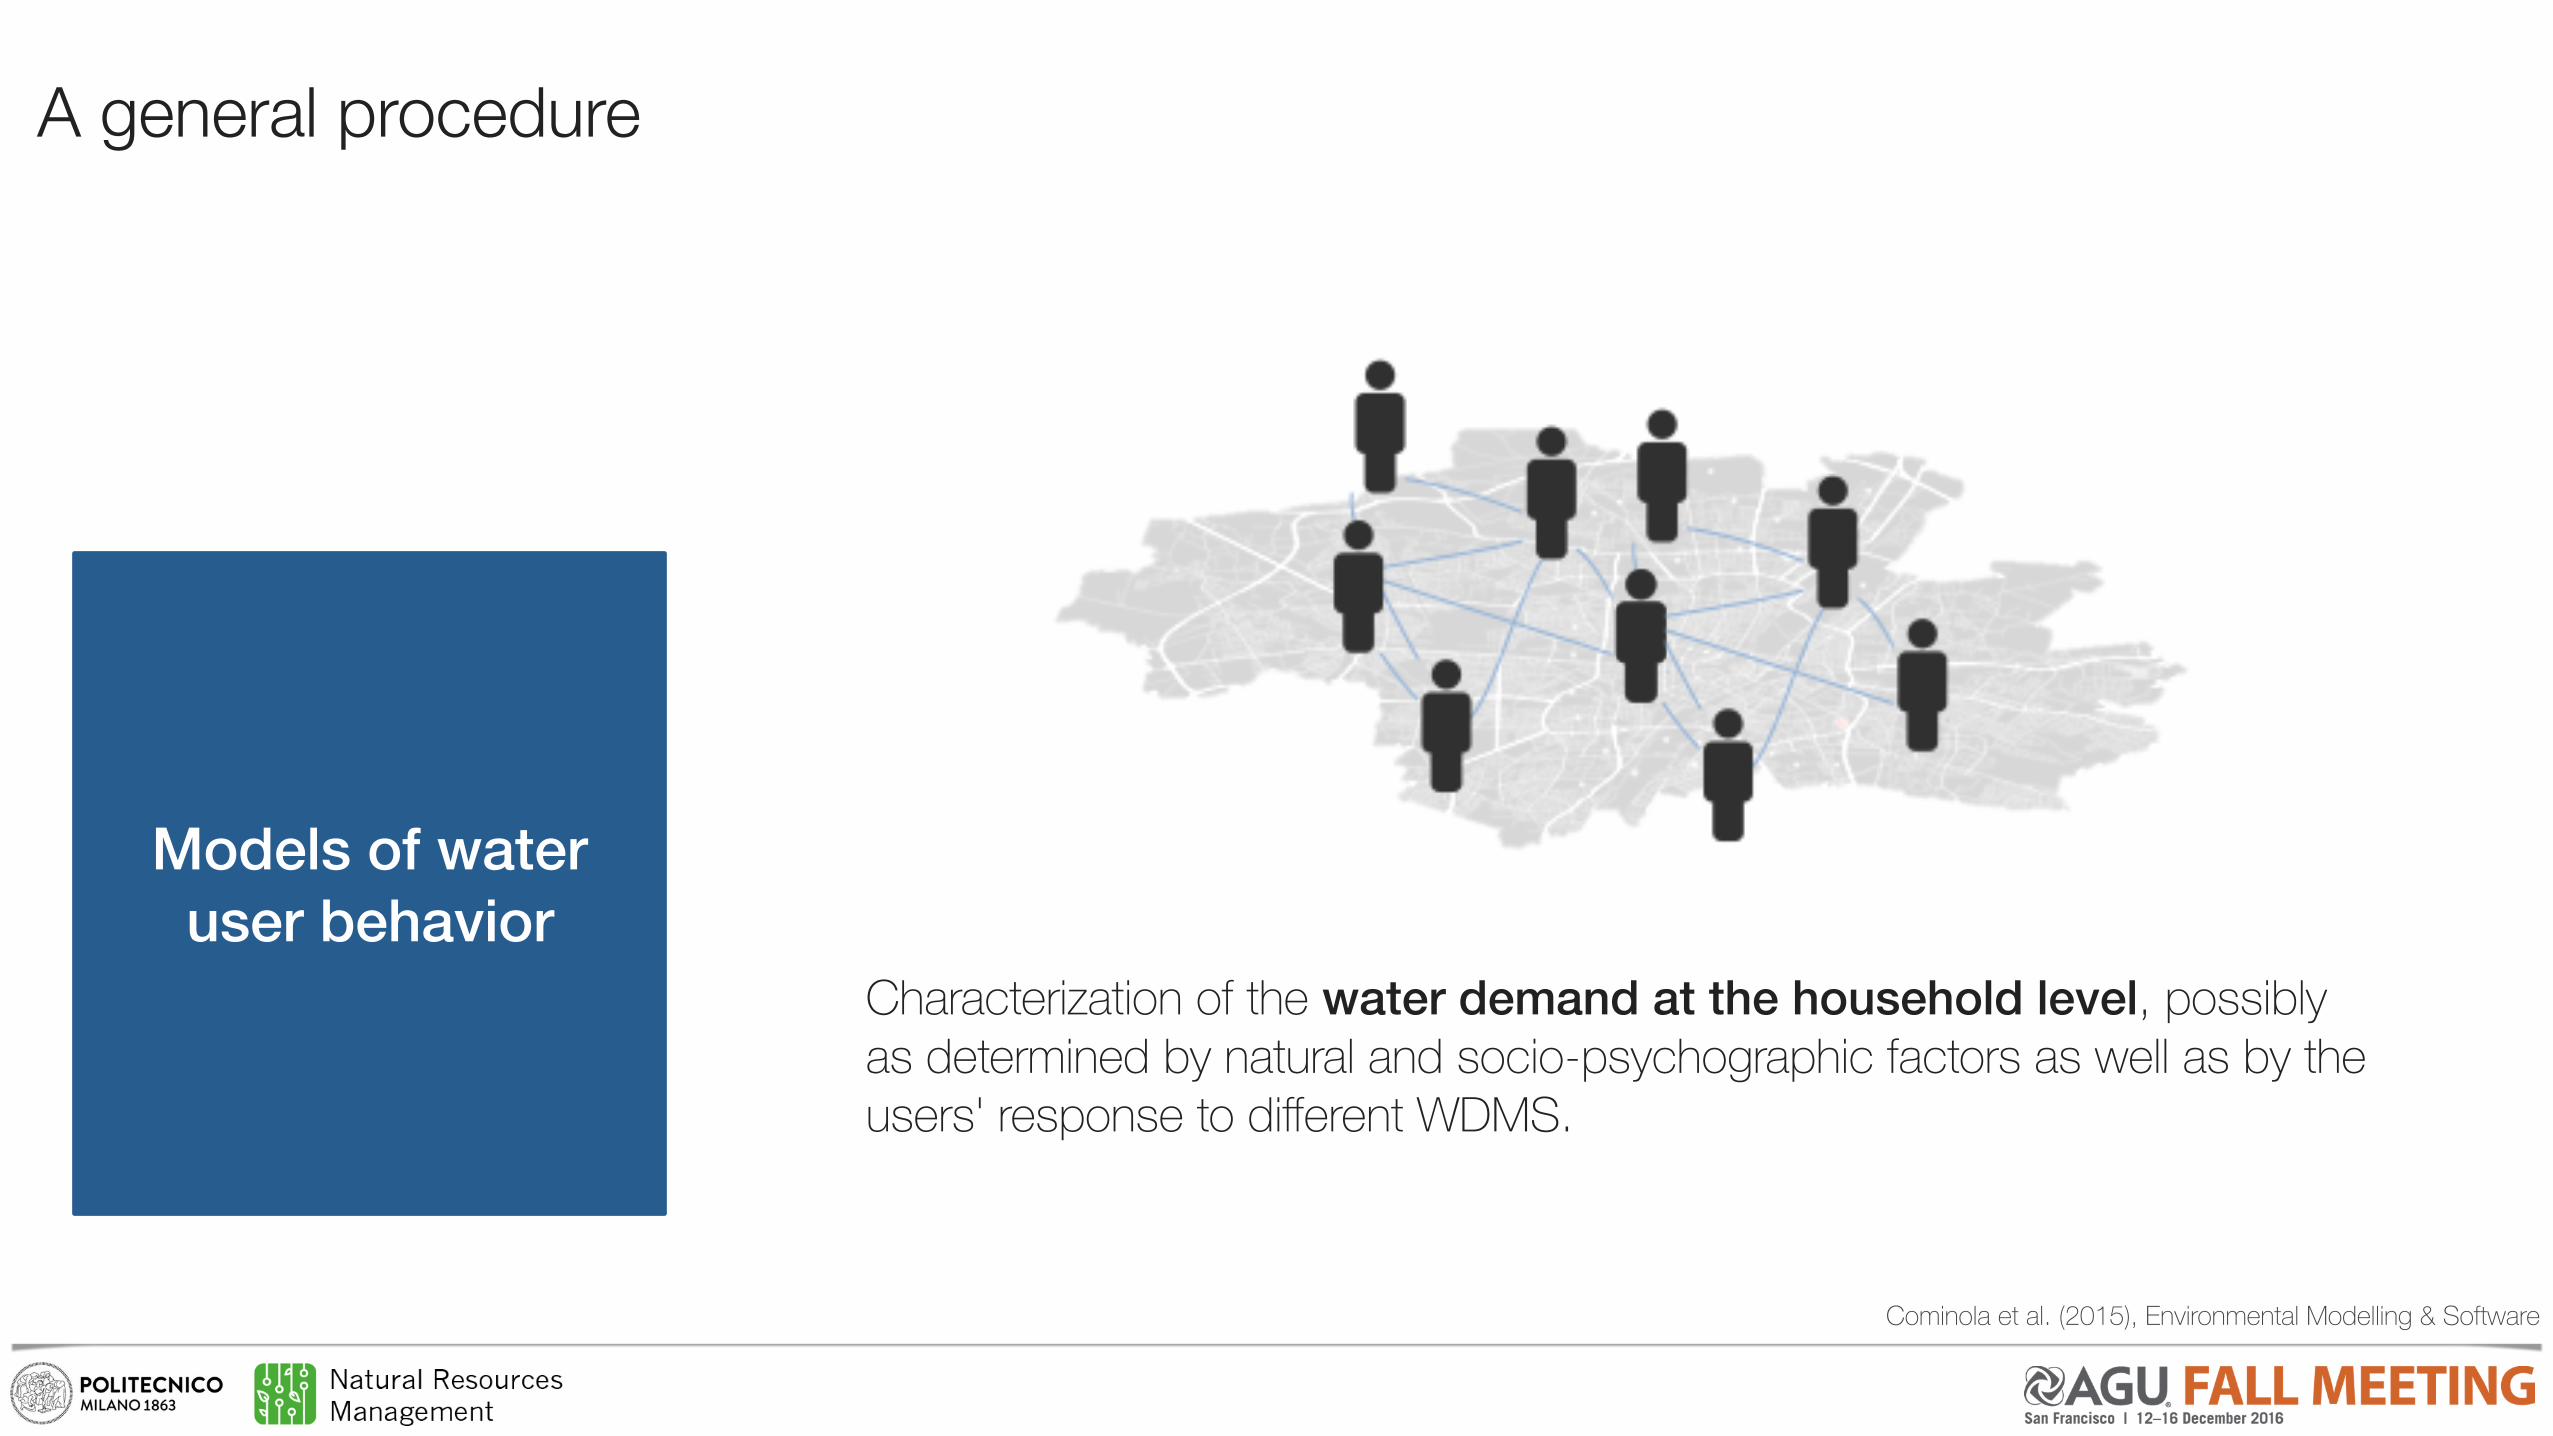
Models of water user behavior
quarterly / half yearly basis readings
1 kilolitre (=1m3)
Traditional water meters
Smart meters resolution: 72 pulses/L (=72k pulses/m3 )Data logging resolution: 5-10 s intervalInformation on time-of-day for consumption
Smart water meters
1000 L | quartely readings
0.013 L | 5-10 sec.
Cominola et al. (2015), Environmental Modelling & Software

A general procedure
Low resolution data
High resolution data
non-intrusive metering
intrusive metering
1. DATA GATHERING
Decision tree algorithms
Machine learning algorithms
2. WATER END USES CHARACTERIZATION
Descriptive models
Prescriptive models
behavioural modelling
multivariate analysis
3. USER MODELLING
4.PERSONALIZED WDMS
water consumption at the appliance-level
billed data
disaggregated water end uses
water consumption at the household-level
disaggregated water end uses
qualitative info on drivers of water consumption
quantitative prediction of users’ behaviours
Models of water user behavior
Models of water user behavior
Water Utility problem
Water Demand Management Strategies:
TECHNOLOGICAL (e.g., water efficient devices)
FINANCIAL (e.g., water price schemes, incentives)LEGISLATIVE (e.g., water usage restrictions)
OPERATION & MAINTENANCE (e.g., leak detection)EDUCATION (e.g., water awareness campaigns, workshops)
Cominola et al. (2015), Environmental Modelling & Software
A general procedure
Low resolution data
High resolution data
non-intrusive metering
intrusive metering
1. DATA GATHERING
Decision tree algorithms
Machine learning algorithms
2. WATER END USES CHARACTERIZATION
Descriptive models
Prescriptive models
behavioural modelling
multivariate analysis
3. USER MODELLING
4.PERSONALIZED WDMS
water consumption at the appliance-level
billed data
disaggregated water end uses
water consumption at the household-level
disaggregated water end uses
qualitative info on drivers of water consumption
quantitative prediction of users’ behaviours
Models of water user behavior
Models of water user behavior
Characterization of the water demand at the household level, possibly as determined by natural and socio-psychographic factors as well as by the users' response to different WDMS.
Cominola et al. (2015), Environmental Modelling & Software
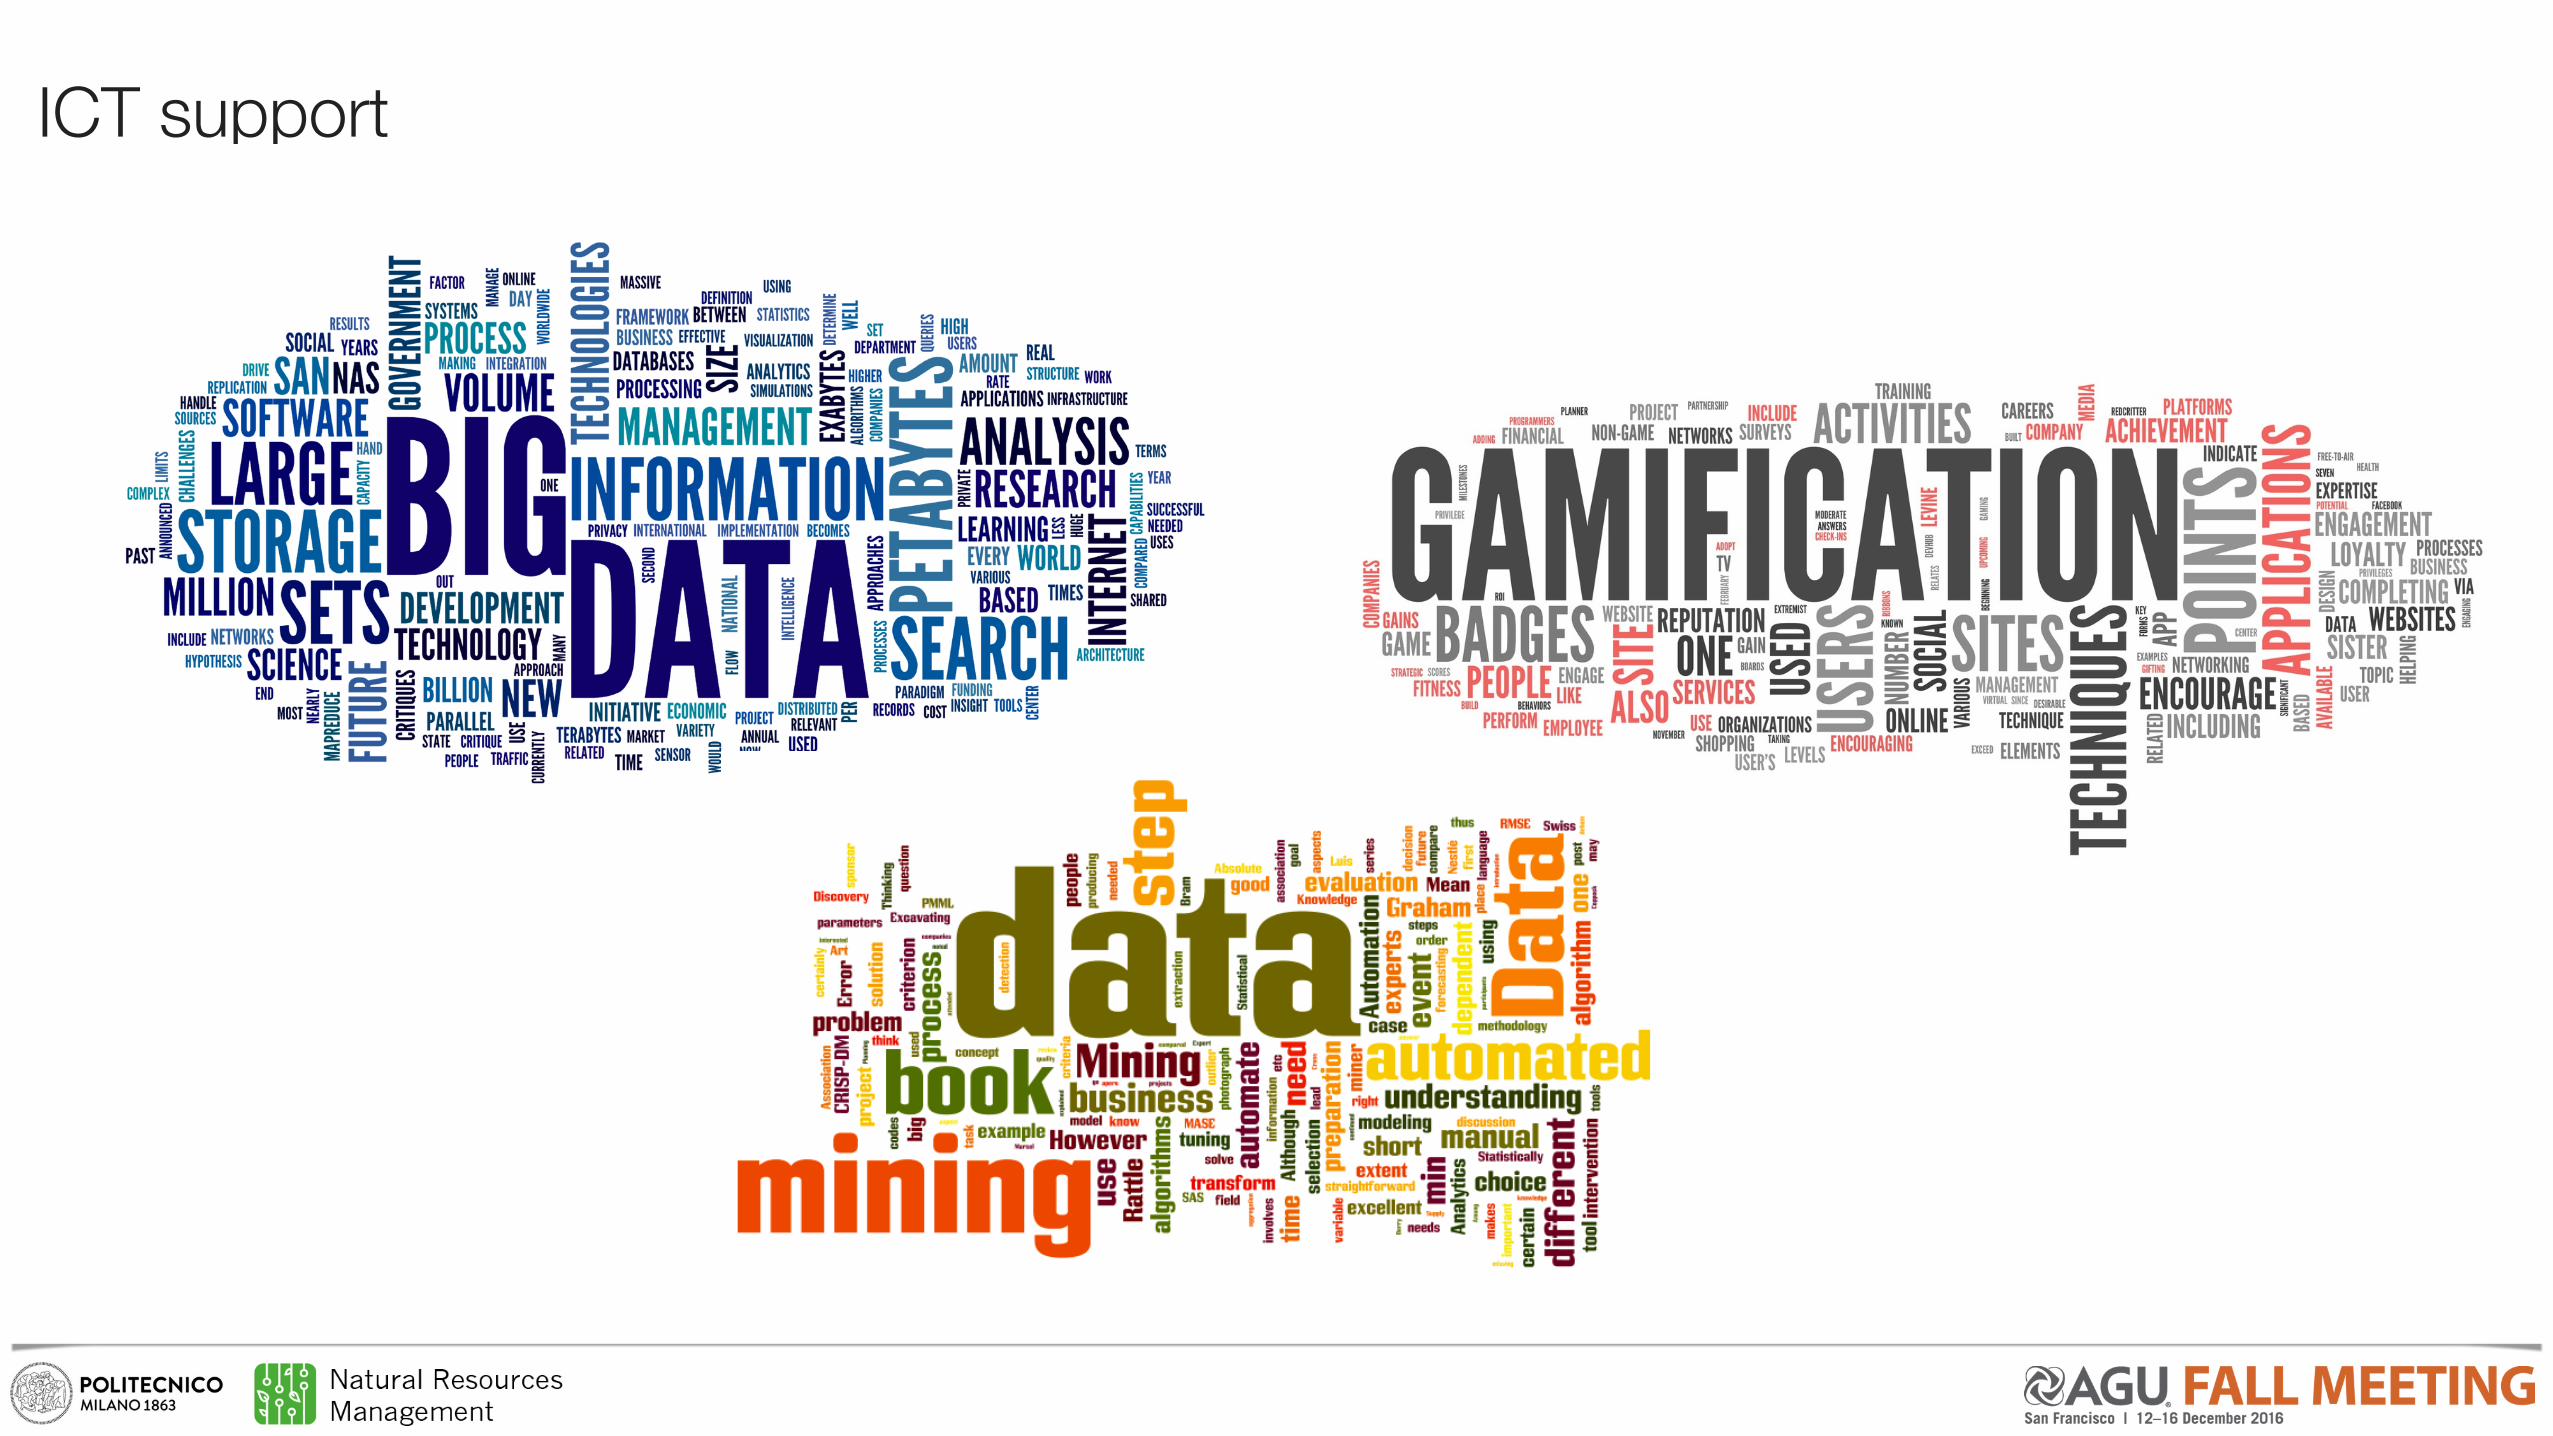
ICT support

Research questions
1) Can big-data analytics support the identification of consumption profiles?

Research questions
1) Can big-data analytics support the identification of consumption profiles?
2) Can gamification induce behavioral change?

SmartH2O Project in Valencia
VALENCIA | ESEMIVASA water supply utility
2 million customers served
490,000 water smart meters currently installed
Development plan: 650,000 water smart meters installed by end 2015
http://www.smarth2o-fp7.eu/
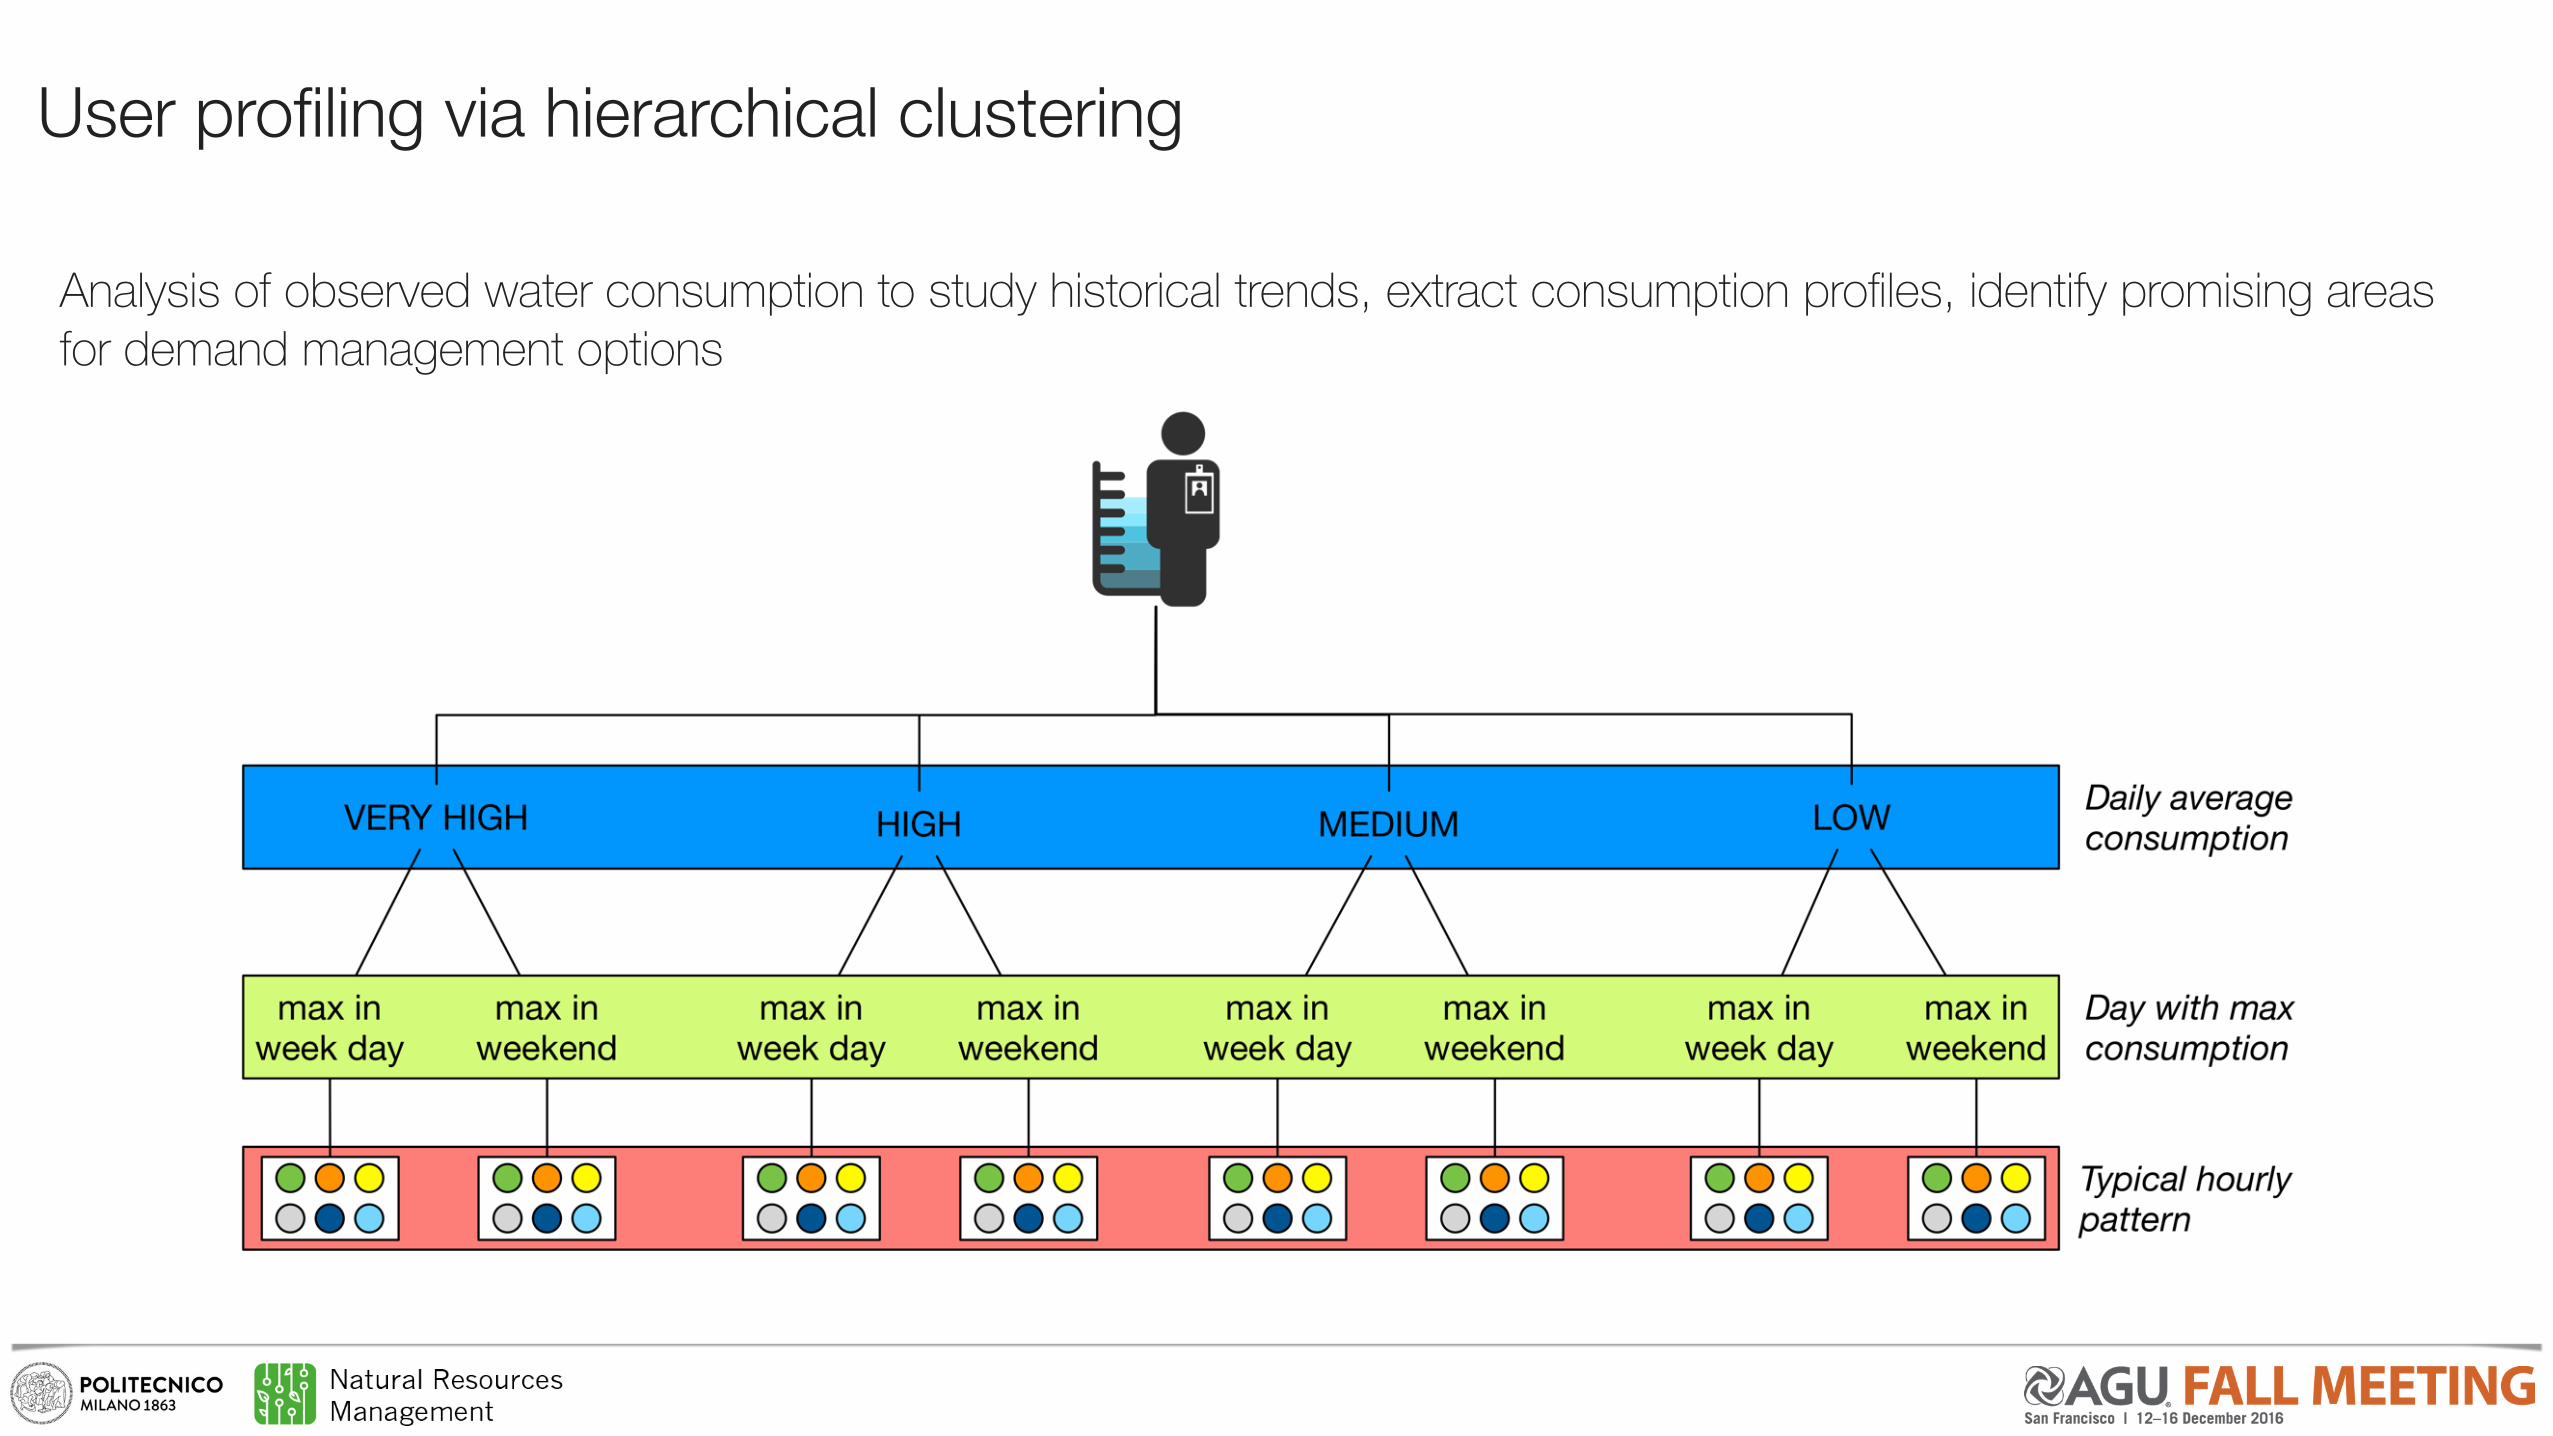
User profiling via hierarchical clustering
Analysis of observed water consumption to study historical trends, extract consumption profiles, identify promising areas for demand management options

Classification of average daily demand
very high (495 l/d)
high (250 l/d)
medium (130 l/d)
low (30 l/d)
DATASET:11,000 households
hourly readings 2 years monitoring period

Weekly patterns
DATASET:11,000 households
hourly readings 2 years monitoring period
max in week day max in weekend
very high (495 l/d)
high (250 l/d)
medium (130 l/d)
low (30 l/d)
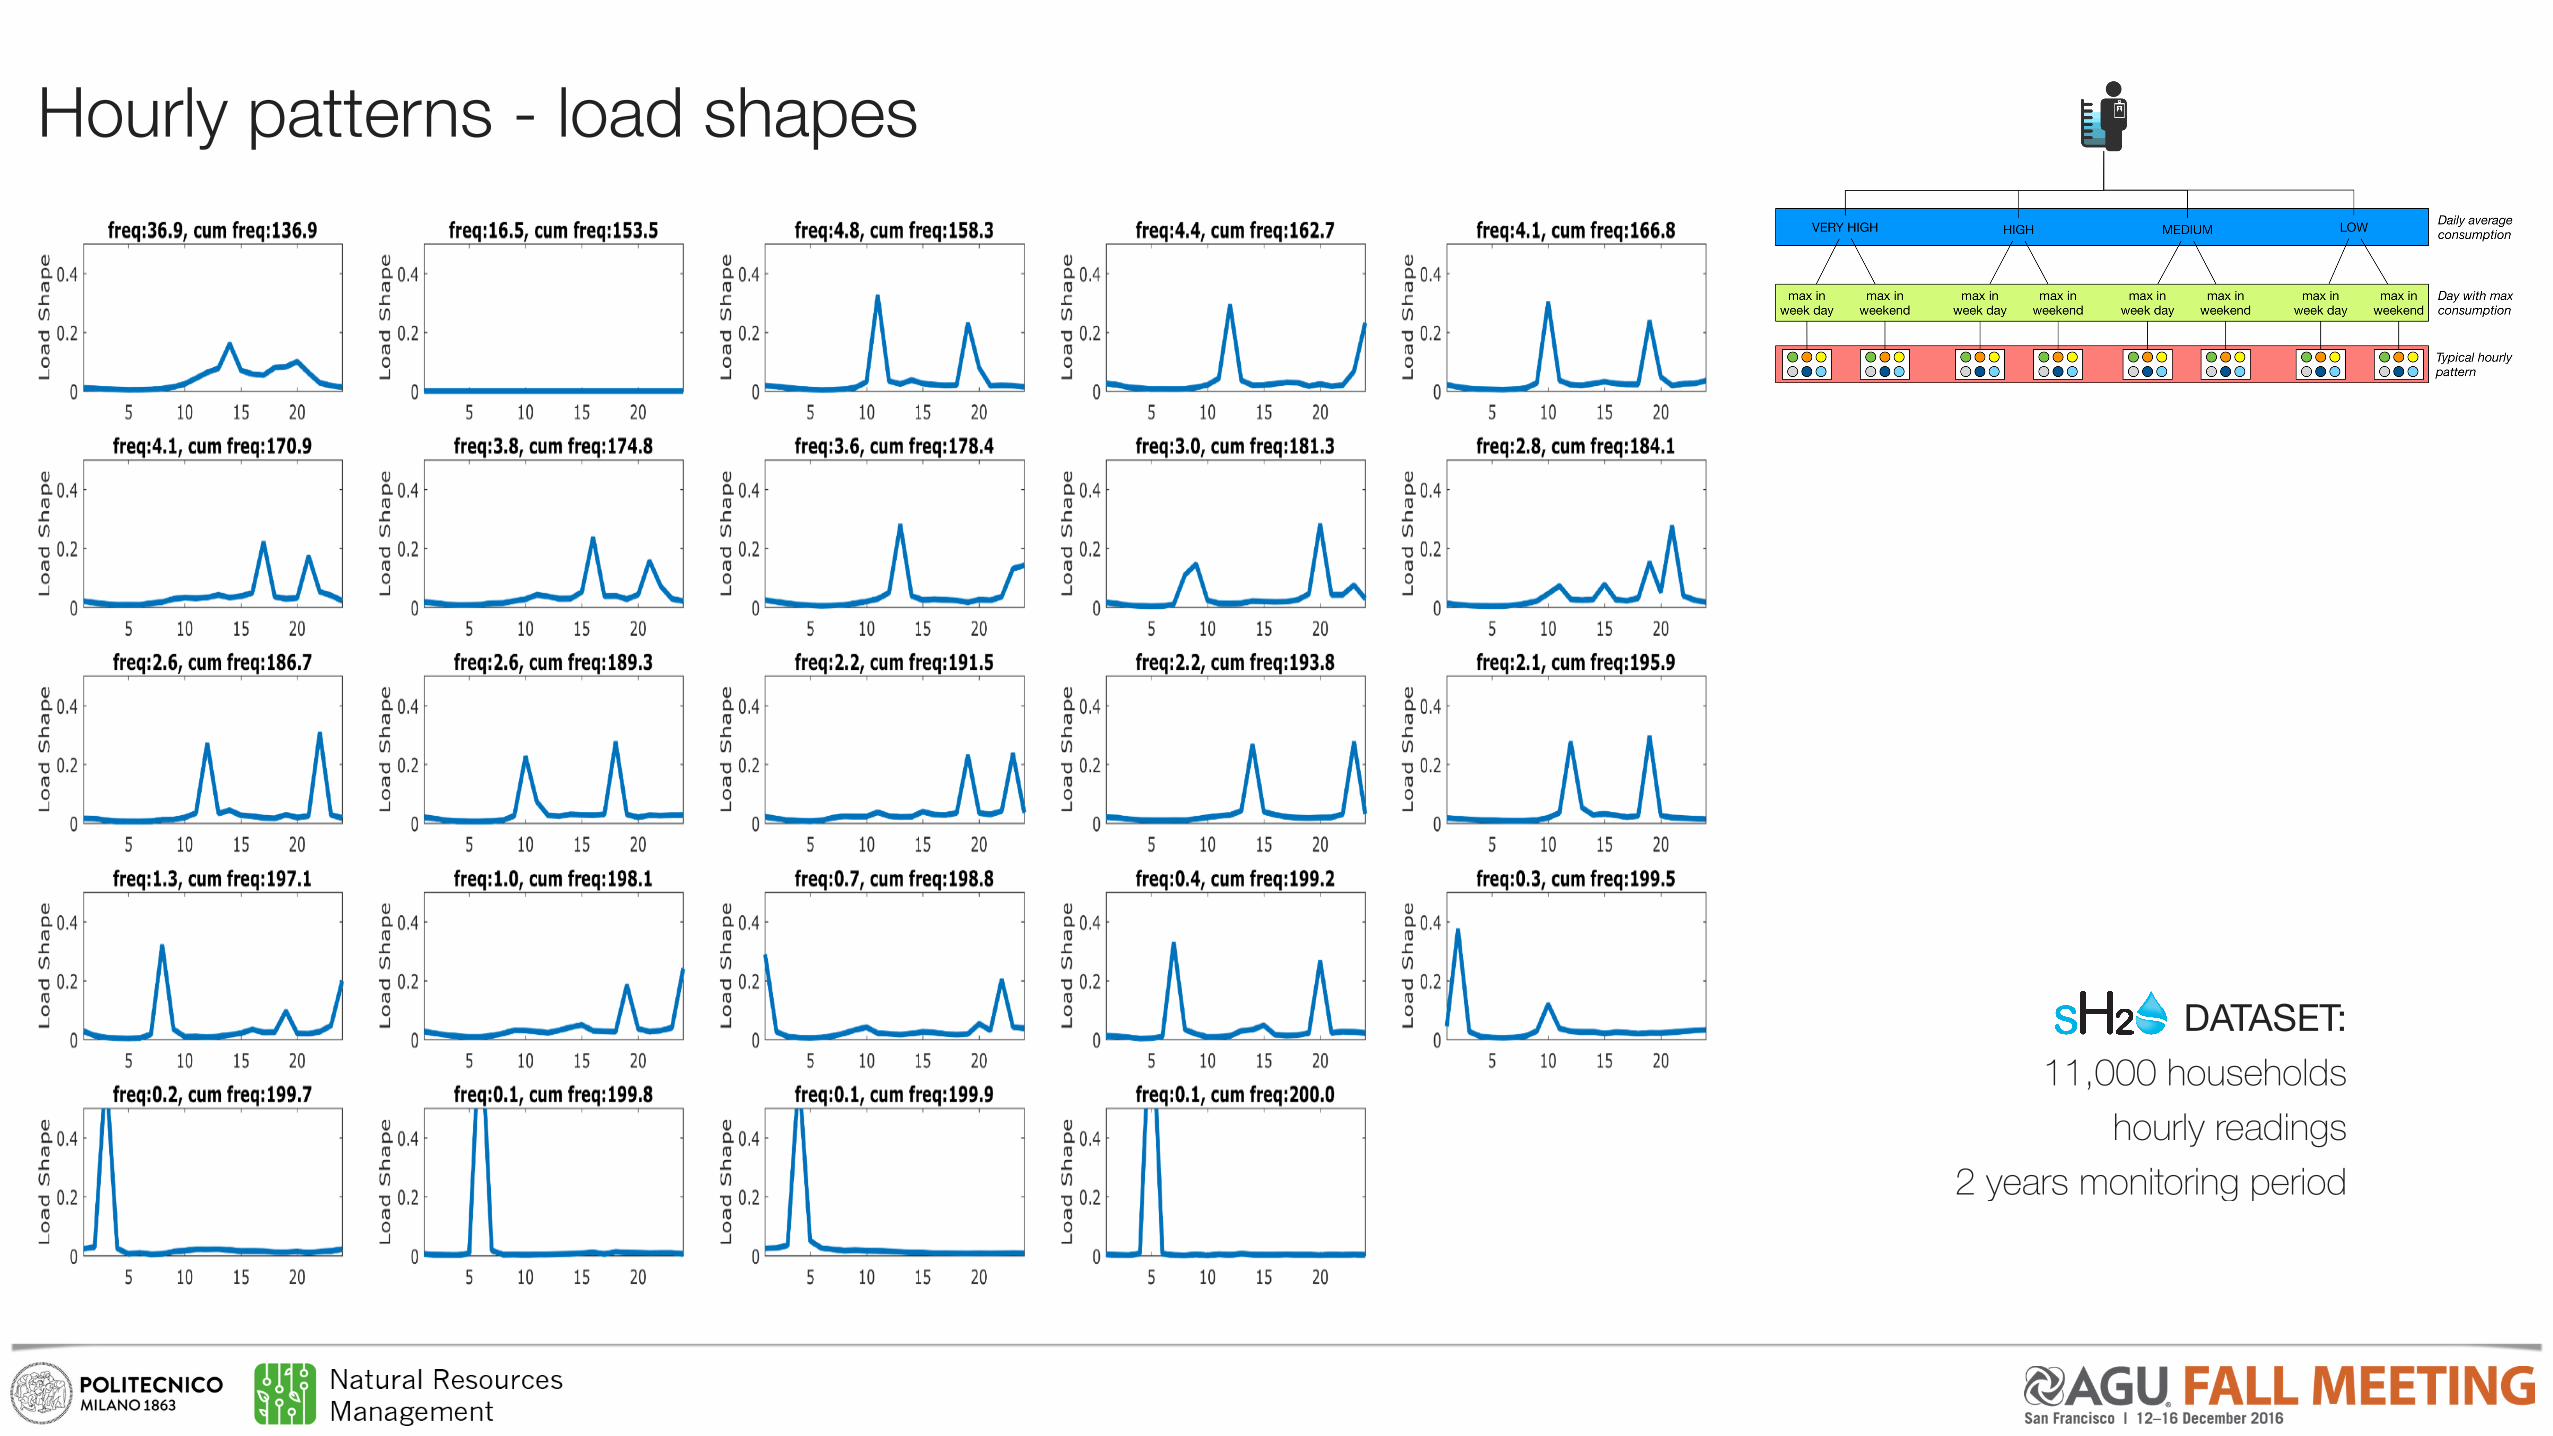
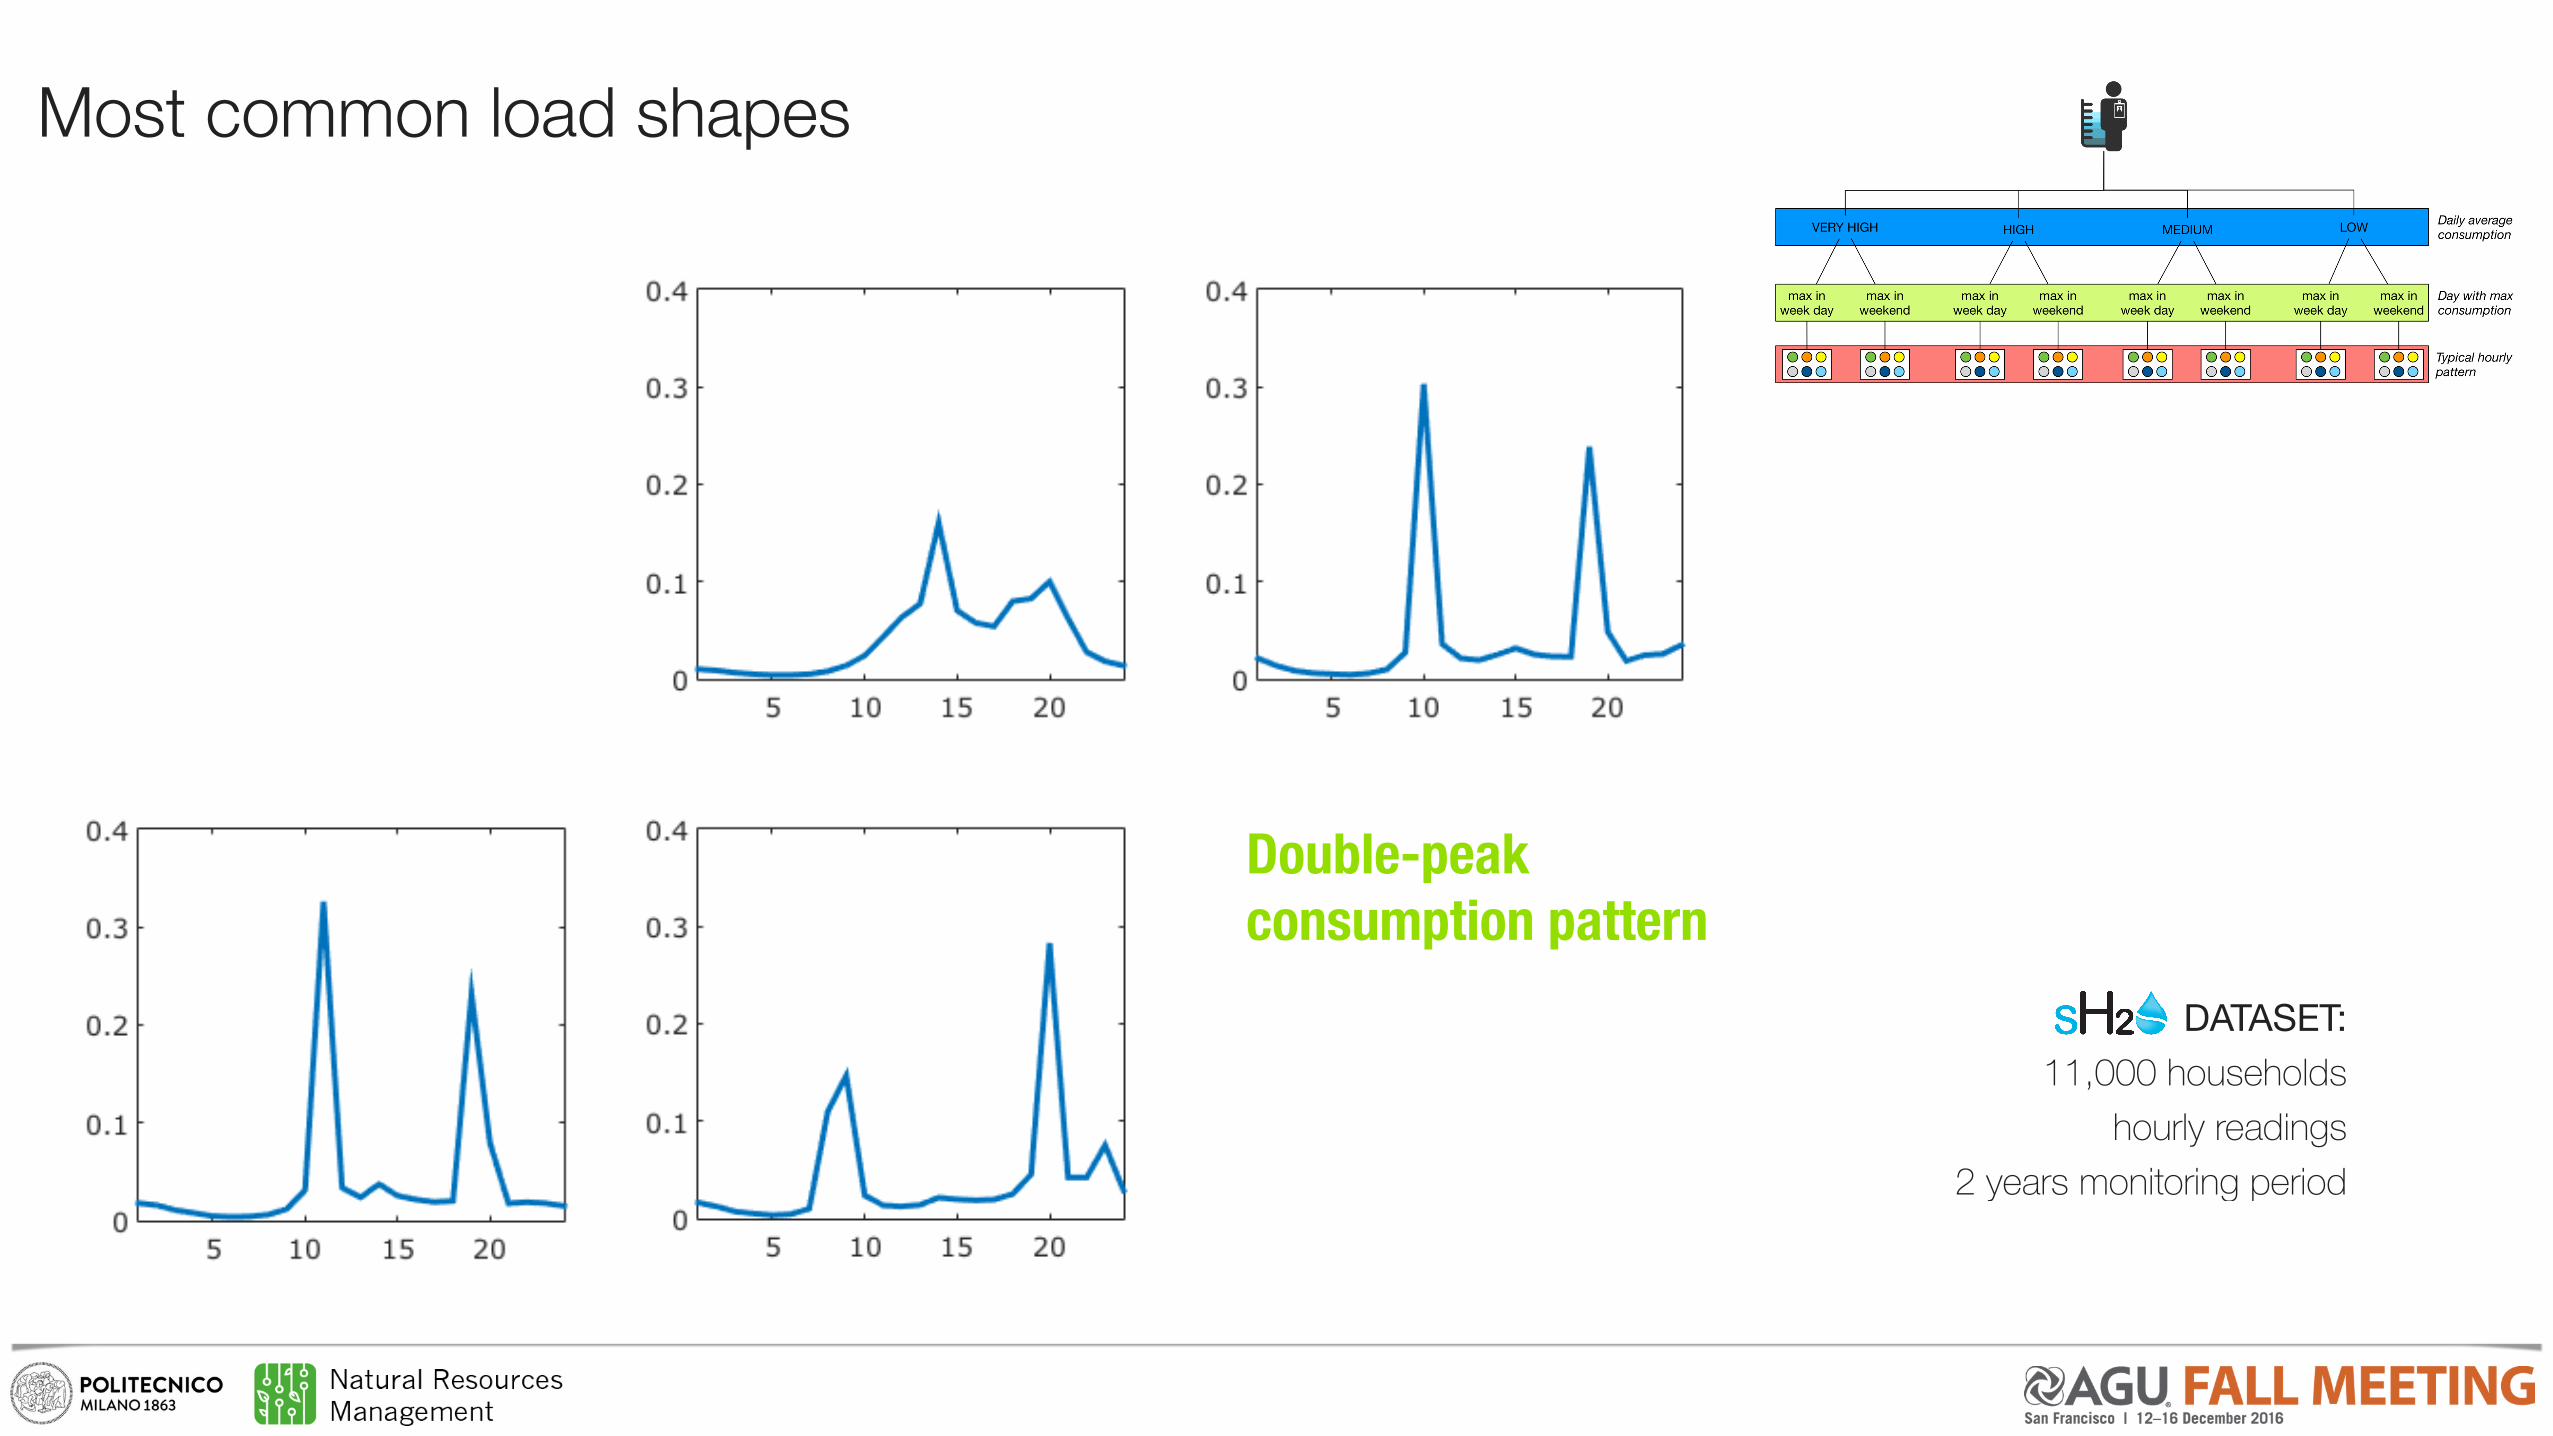
Hourly patterns - load shapes
DATASET:11,000 households
hourly readings 2 years monitoring period

Most common load shapes
DATASET:11,000 households
hourly readings 2 years monitoring period

Most common load shapes
DATASET:11,000 households
hourly readings 2 years monitoring period
Zero-consumption days
Most common load shapes
DATASET:11,000 households
hourly readings 2 years monitoring period
Double-peak consumption pattern

Model validation
SmartH2O – Final user behaviour models and ABM Platform -29 - Version 2.1
close to the observed one, with a very small under- and overestimation for medium and high users.
Figure 12. Empirical cumulative density function of daily consumption of EMIVASA users.
A more detailed comparison can be performed by comparing the empirical CDFs of simulated and observed consumption separated for weekdays and weekends, see Figure 13. Results show that our profiles successfully capture the differences in the users’ behaviours: despite the consumption during the weekend is generally higher than during weekdays. Both the CDFs computed from simulated consumptions are close to the observed ones. Moreover, the small error in under and over estimating consumption during weekdays explains the small error commented for Figure 12, while the CDF for weekends precisely follows the one of observed data.
daily average consumption

Model validation
SmartH2O – Final user behaviour models and ABM Platform -30 - Version 2.1
Figure 13. Empirical cumulative density function of daily consumption of EMIVASA users estimated for weekdays (left panel) and weekends (right panel) separately.
Finally, consistently with the analysis performed on SES data, we assessed the quality of our profiles in reproducing the hourly consumption patterns by comparing the empirical CDFs estimated on hourly consumption differentiated depending on different fractions of the days, specifically morning (i.e., from 5 to 9), middle day (i.e., from 10 to 16), evening (i.e., from 17 to 22), and night (i.e., from 23 to 4). The results reported in Figure 14 show that the combination of the daily consumption profiles with the typical load-shapes (Figure 11) allows capturing also the sub-daily variability of water consumption behaviours. In particular, the CDFs of estimated hourly water consumption very precisely follow the distributions of observed data for daily hours after 10 am, when most of water consumption happens. The simulation for night hours is also well performed: in those hours, hourly water consumption is close to zero for almost 90% of the time. Only the CDF of morning consumption (5 to 9 am), is underestimated by our model. As demonstrated by the load-shapes in Figure 11, their morning peak is delayed to day hours later than 10 am. Therefore, the smoothing process embedded in the recursive load-shape extraction algorithm tends to lower down to zero the simulated water consumption in morning hours (before 10 am), as positive hourly consumption in those hours show less frequent occurrences than those after 10am. In order to overcome this model error in future analysis, we will consider keeping a higher number of load shapes that better describe the heterogeneity of early morning consumption, and further sub-dividing day hours in finer intervals for analysis.
daily average consumption only week days only weekends
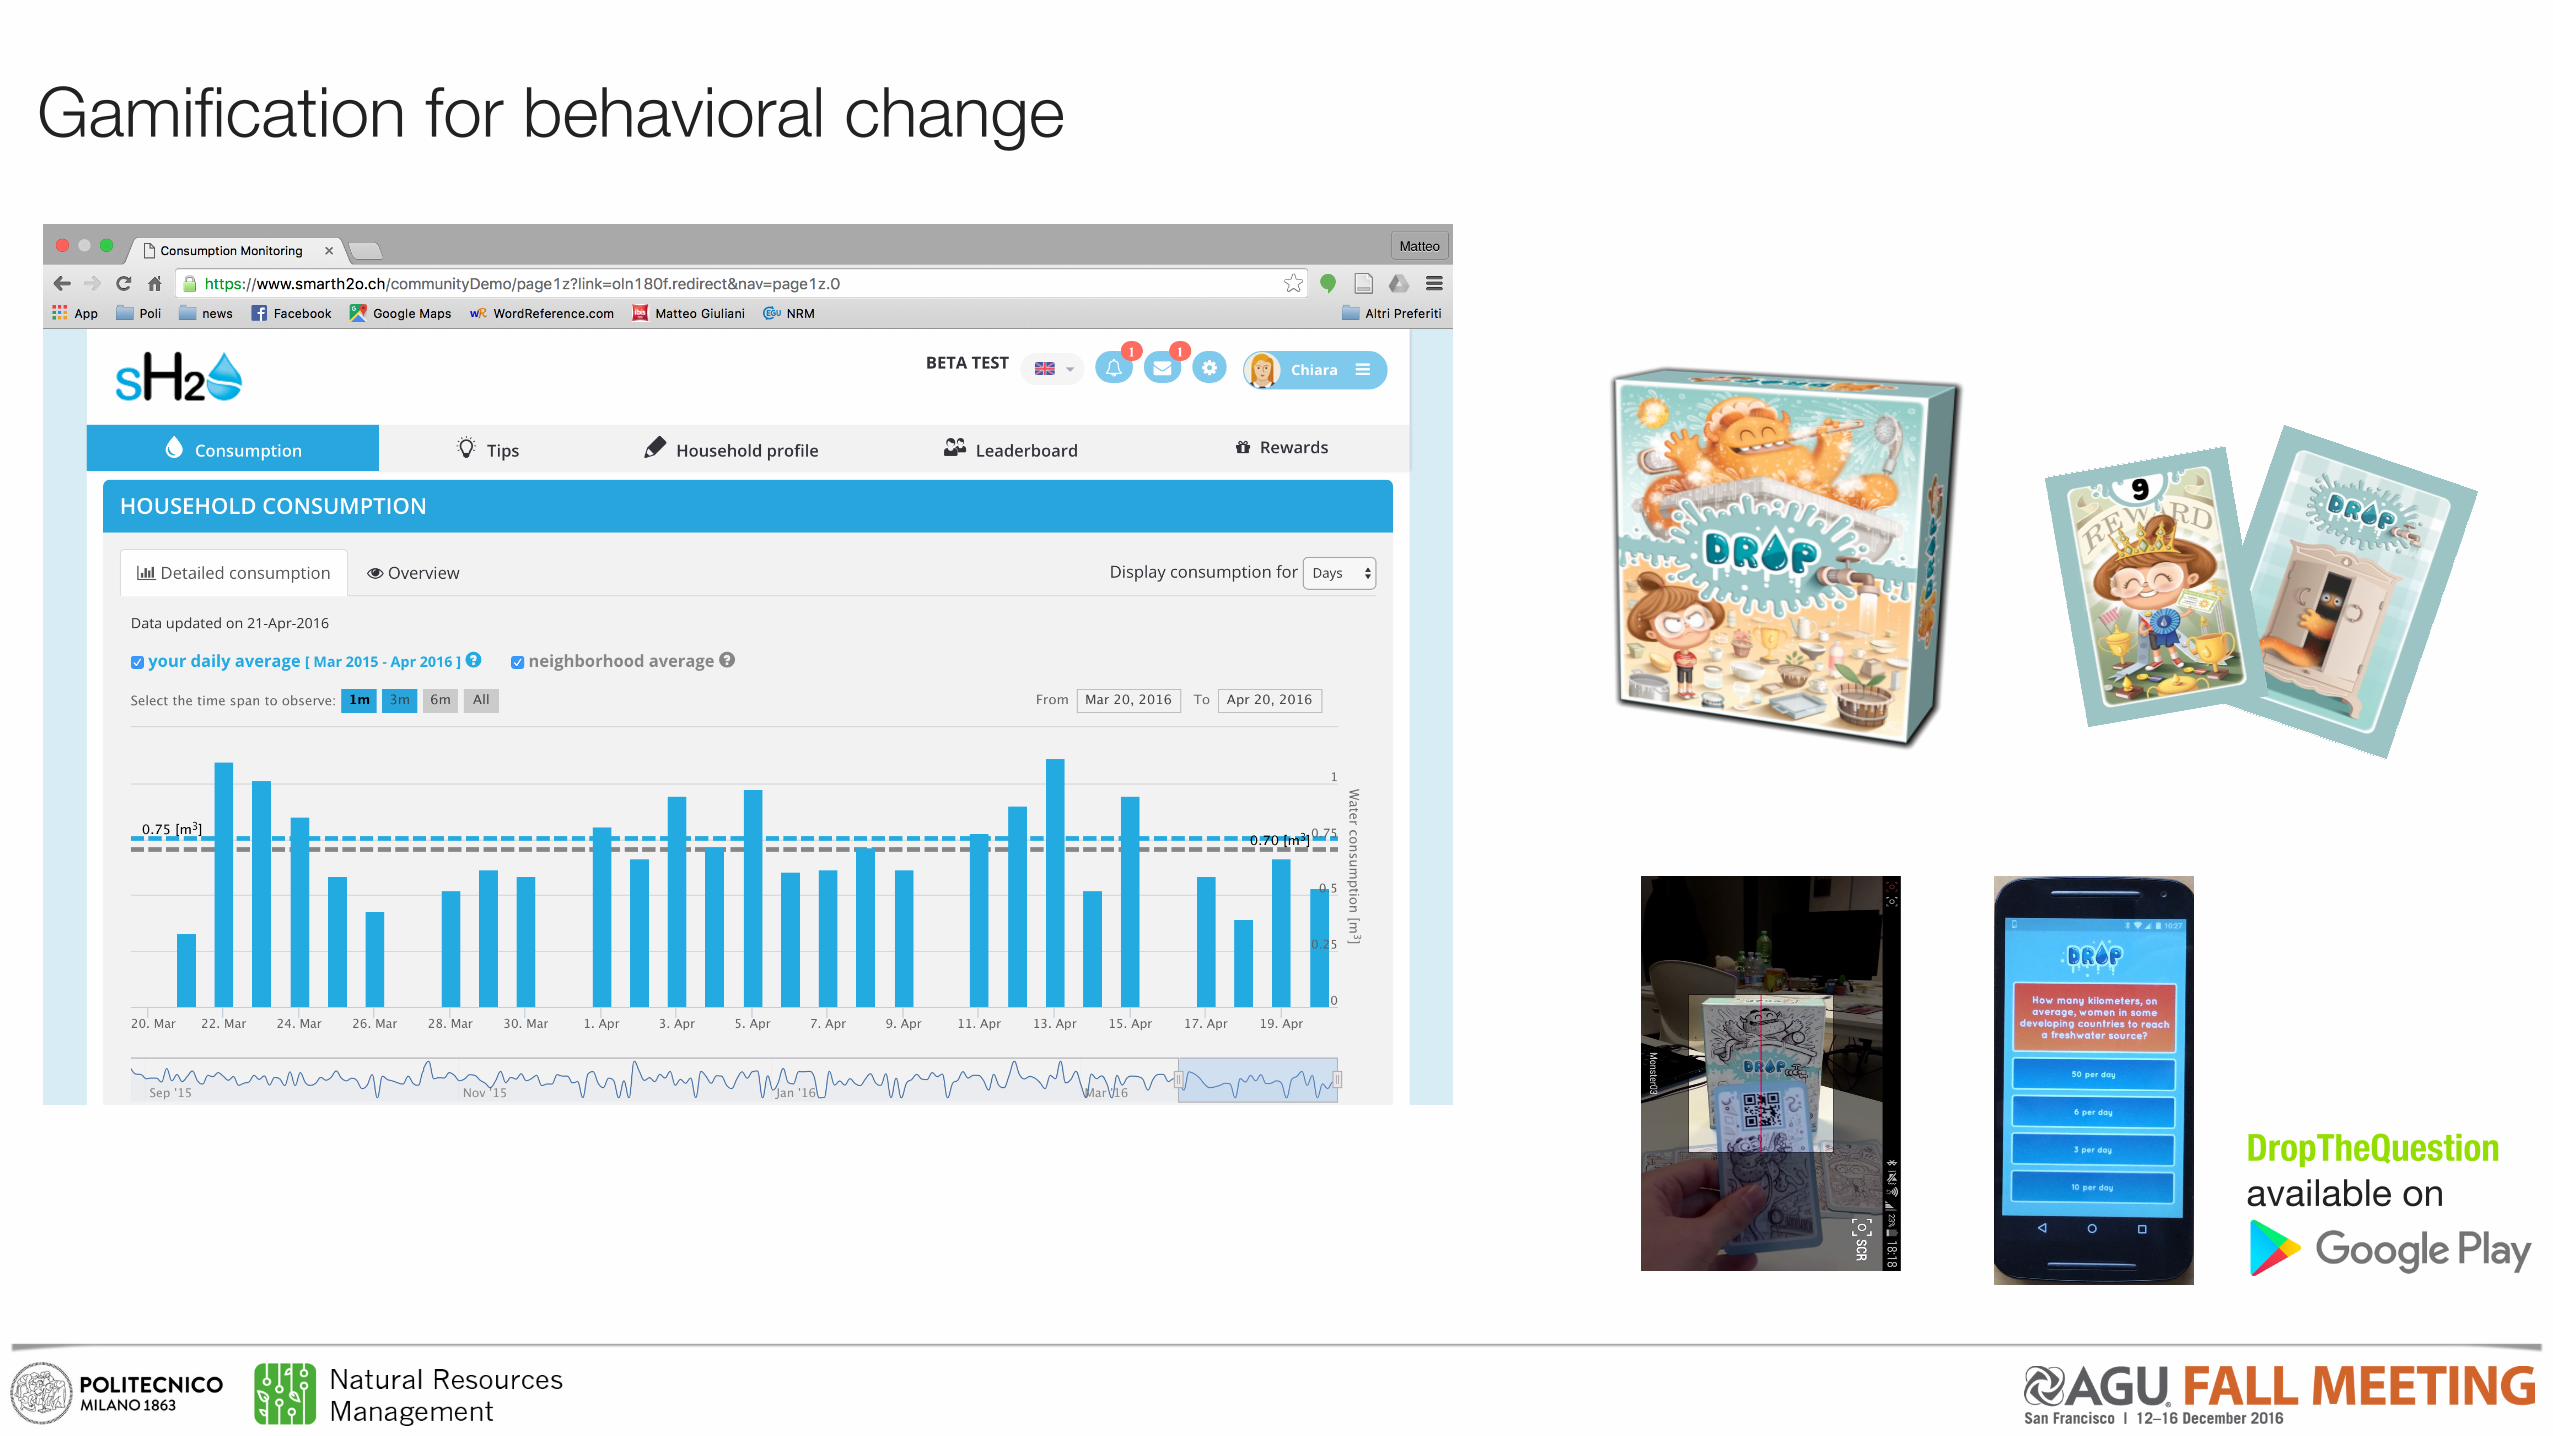
Gamification for behavioral change
DropTheQuestion available on

Water consumption reduction - preliminary results
historical consumption
cons
umpt
ion
afte
r sH2
O tr
eatm
ent
-10%
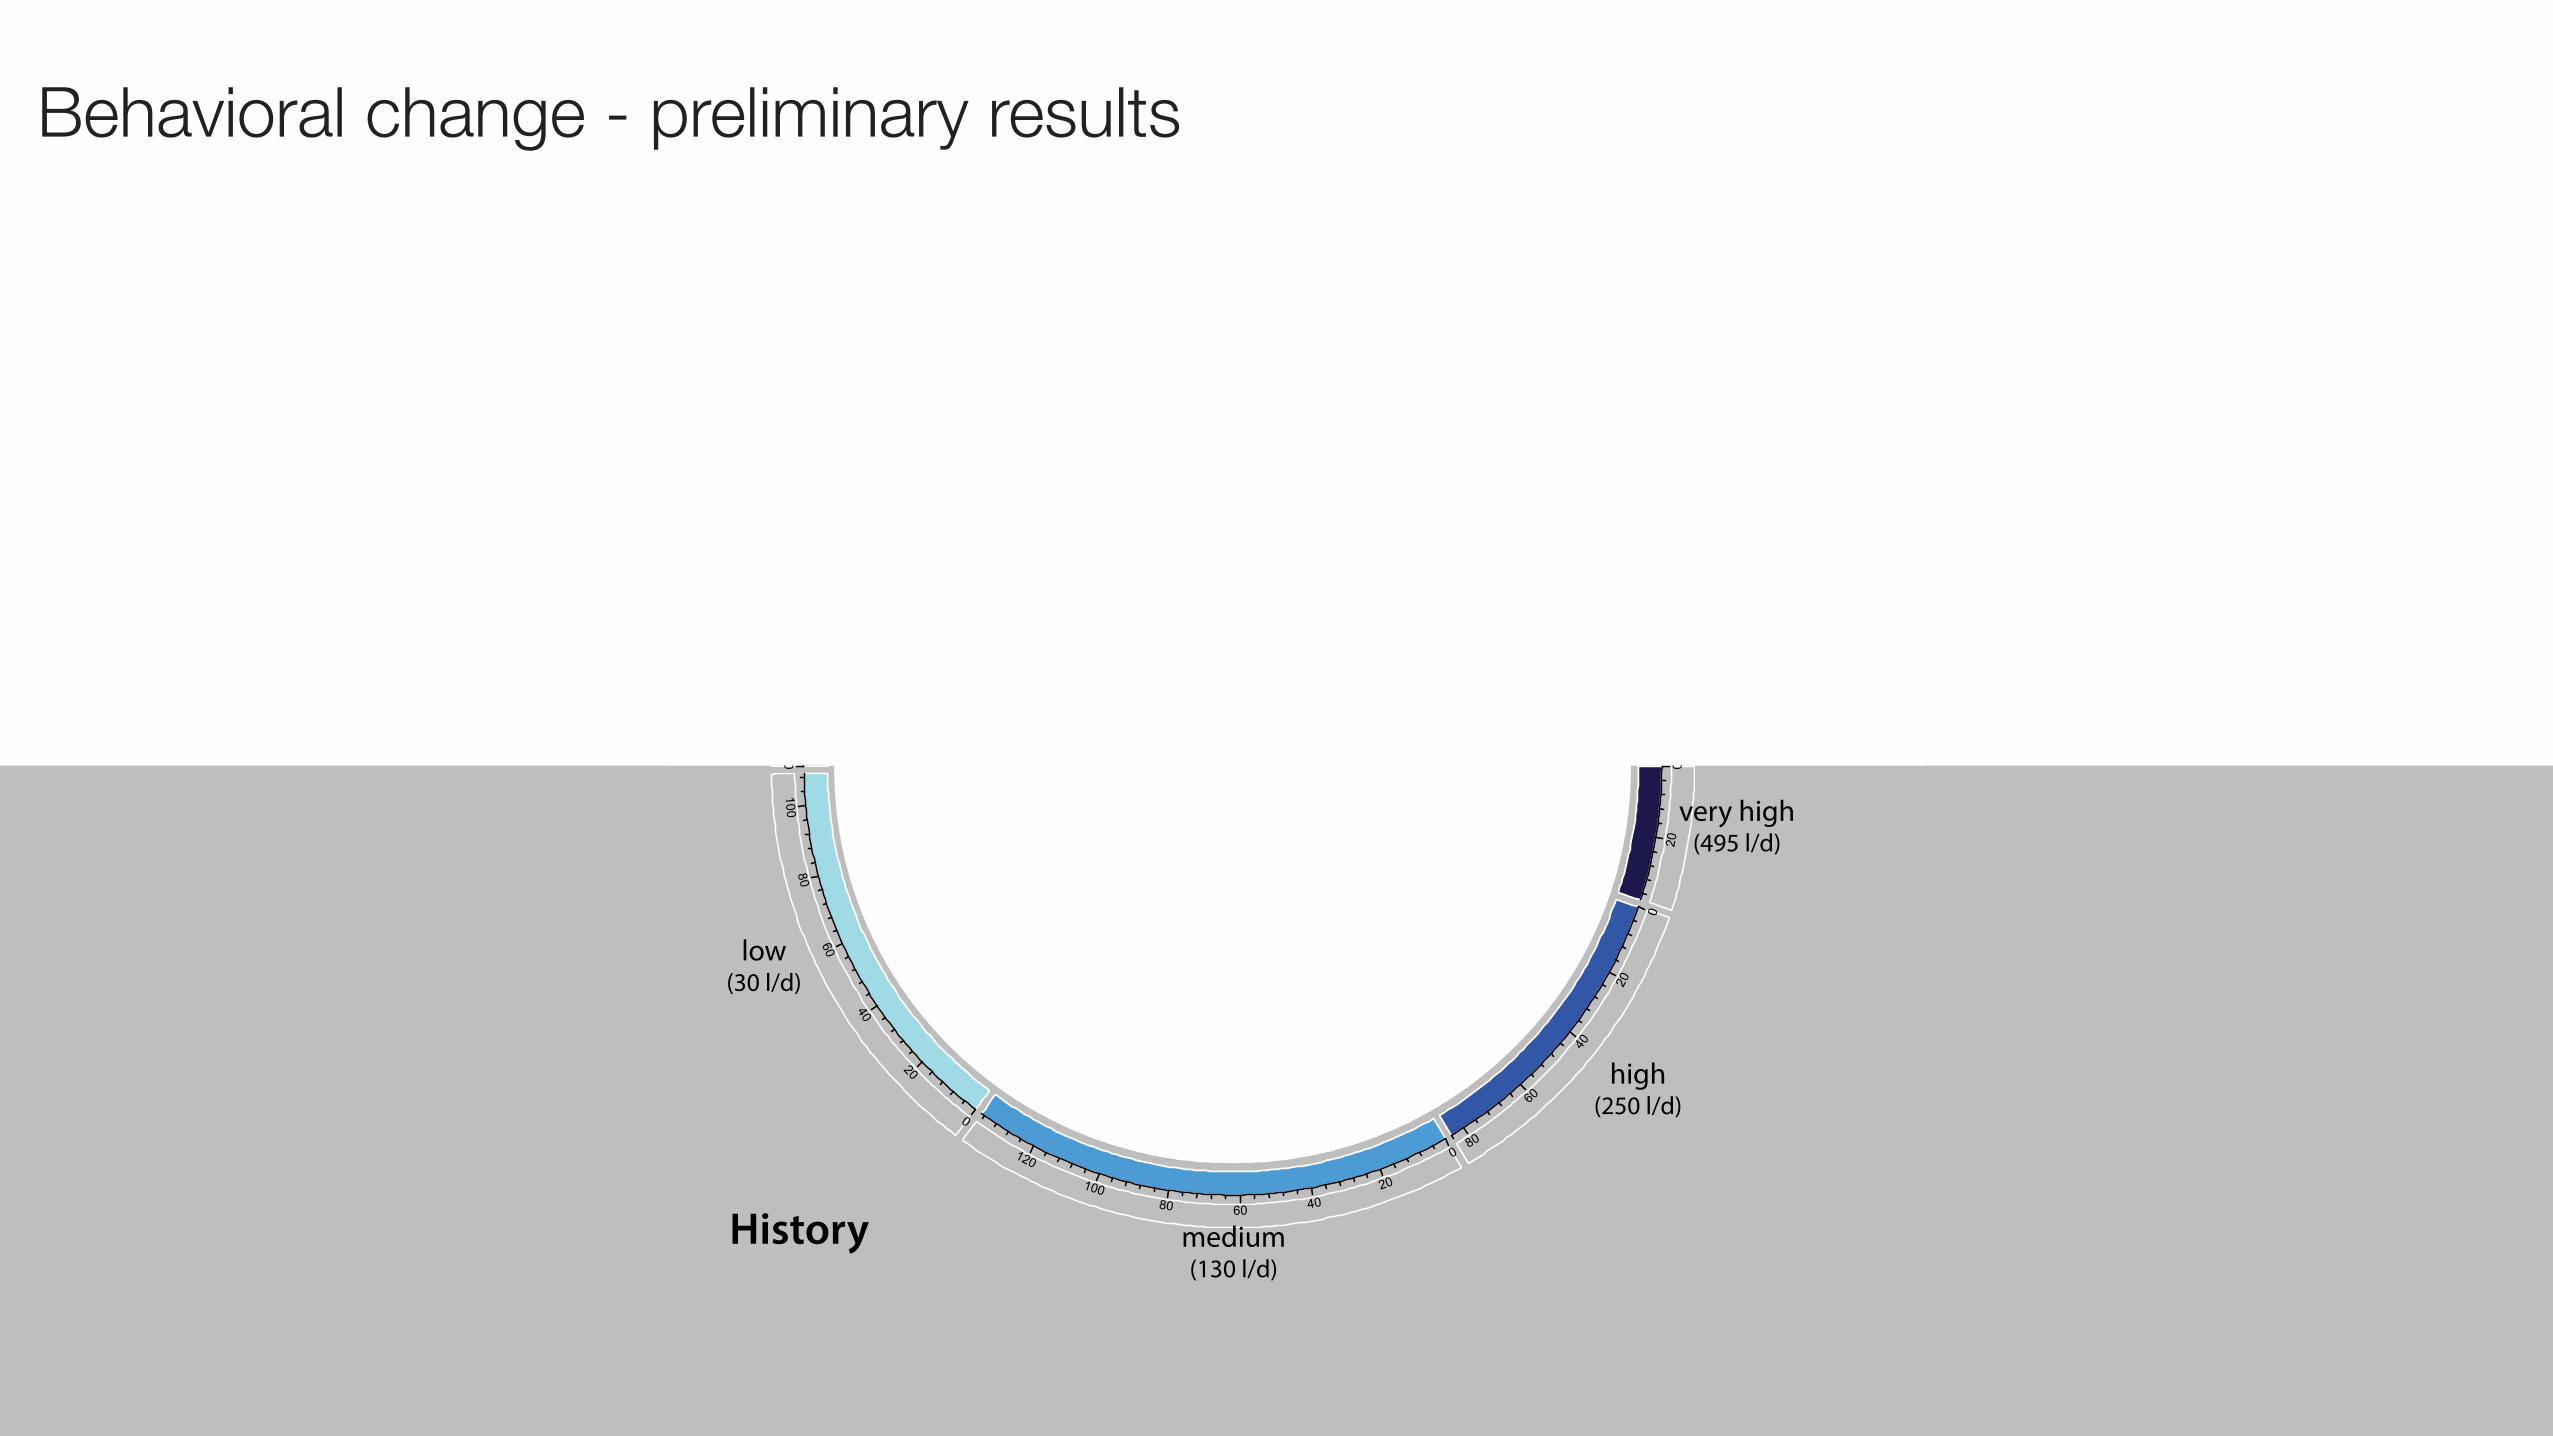
Behavioral change - preliminary results
020
0
20
40
60
800
20
406080100
120
0
20
40
60
80100
2040
60
80
100
0
0
20
4060 80 100
120
1400
20
40
60
800
20
low(30 l/d)
low(30 l/d)
medium(130 l/d)
medium(130 l/d)
high(250 l/d)
high(250 l/d)
very high(495 l/d)
very high(495 l/d)
After sH2O treatment
History stable behaviordecreasing demandincreasing demand
Behavioral change - preliminary results
-10%
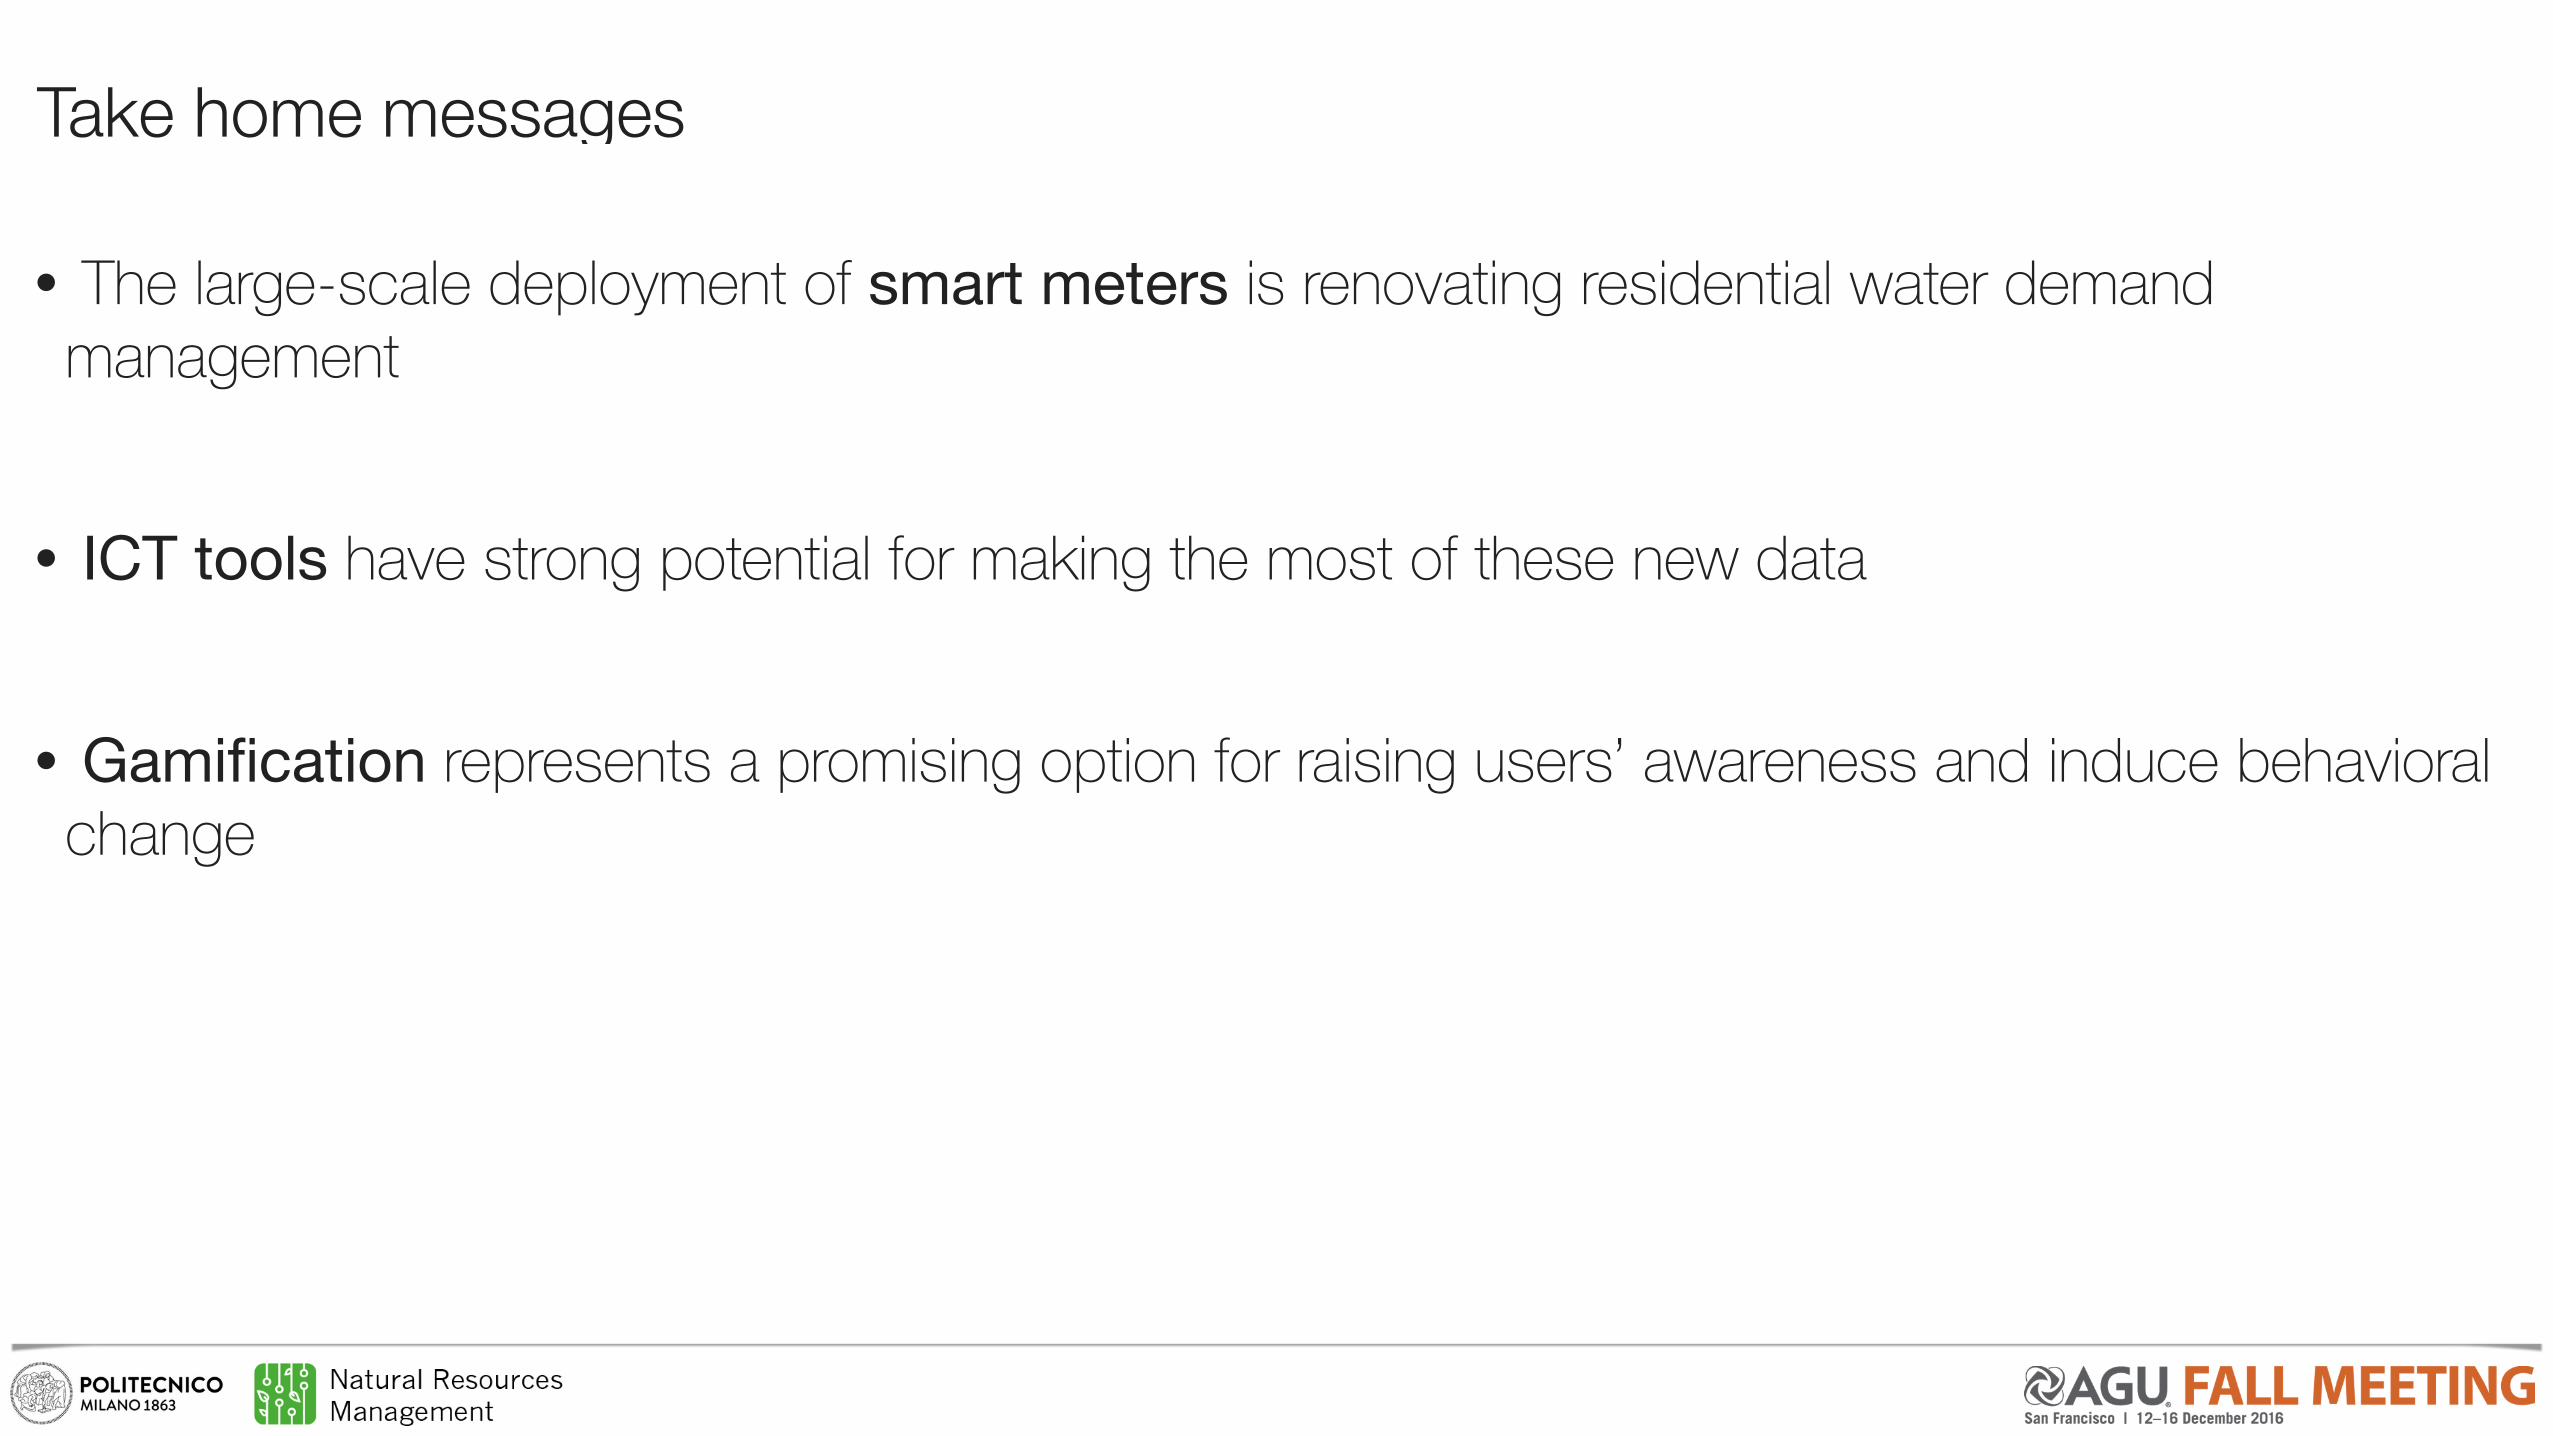
Take home messages
• The large-scale deployment of smart meters is renovating residential water demand management
• ICT tools have strong potential for making the most of these new data
• Gamification represents a promising option for raising users’ awareness and induce behavioral change
Next Steps
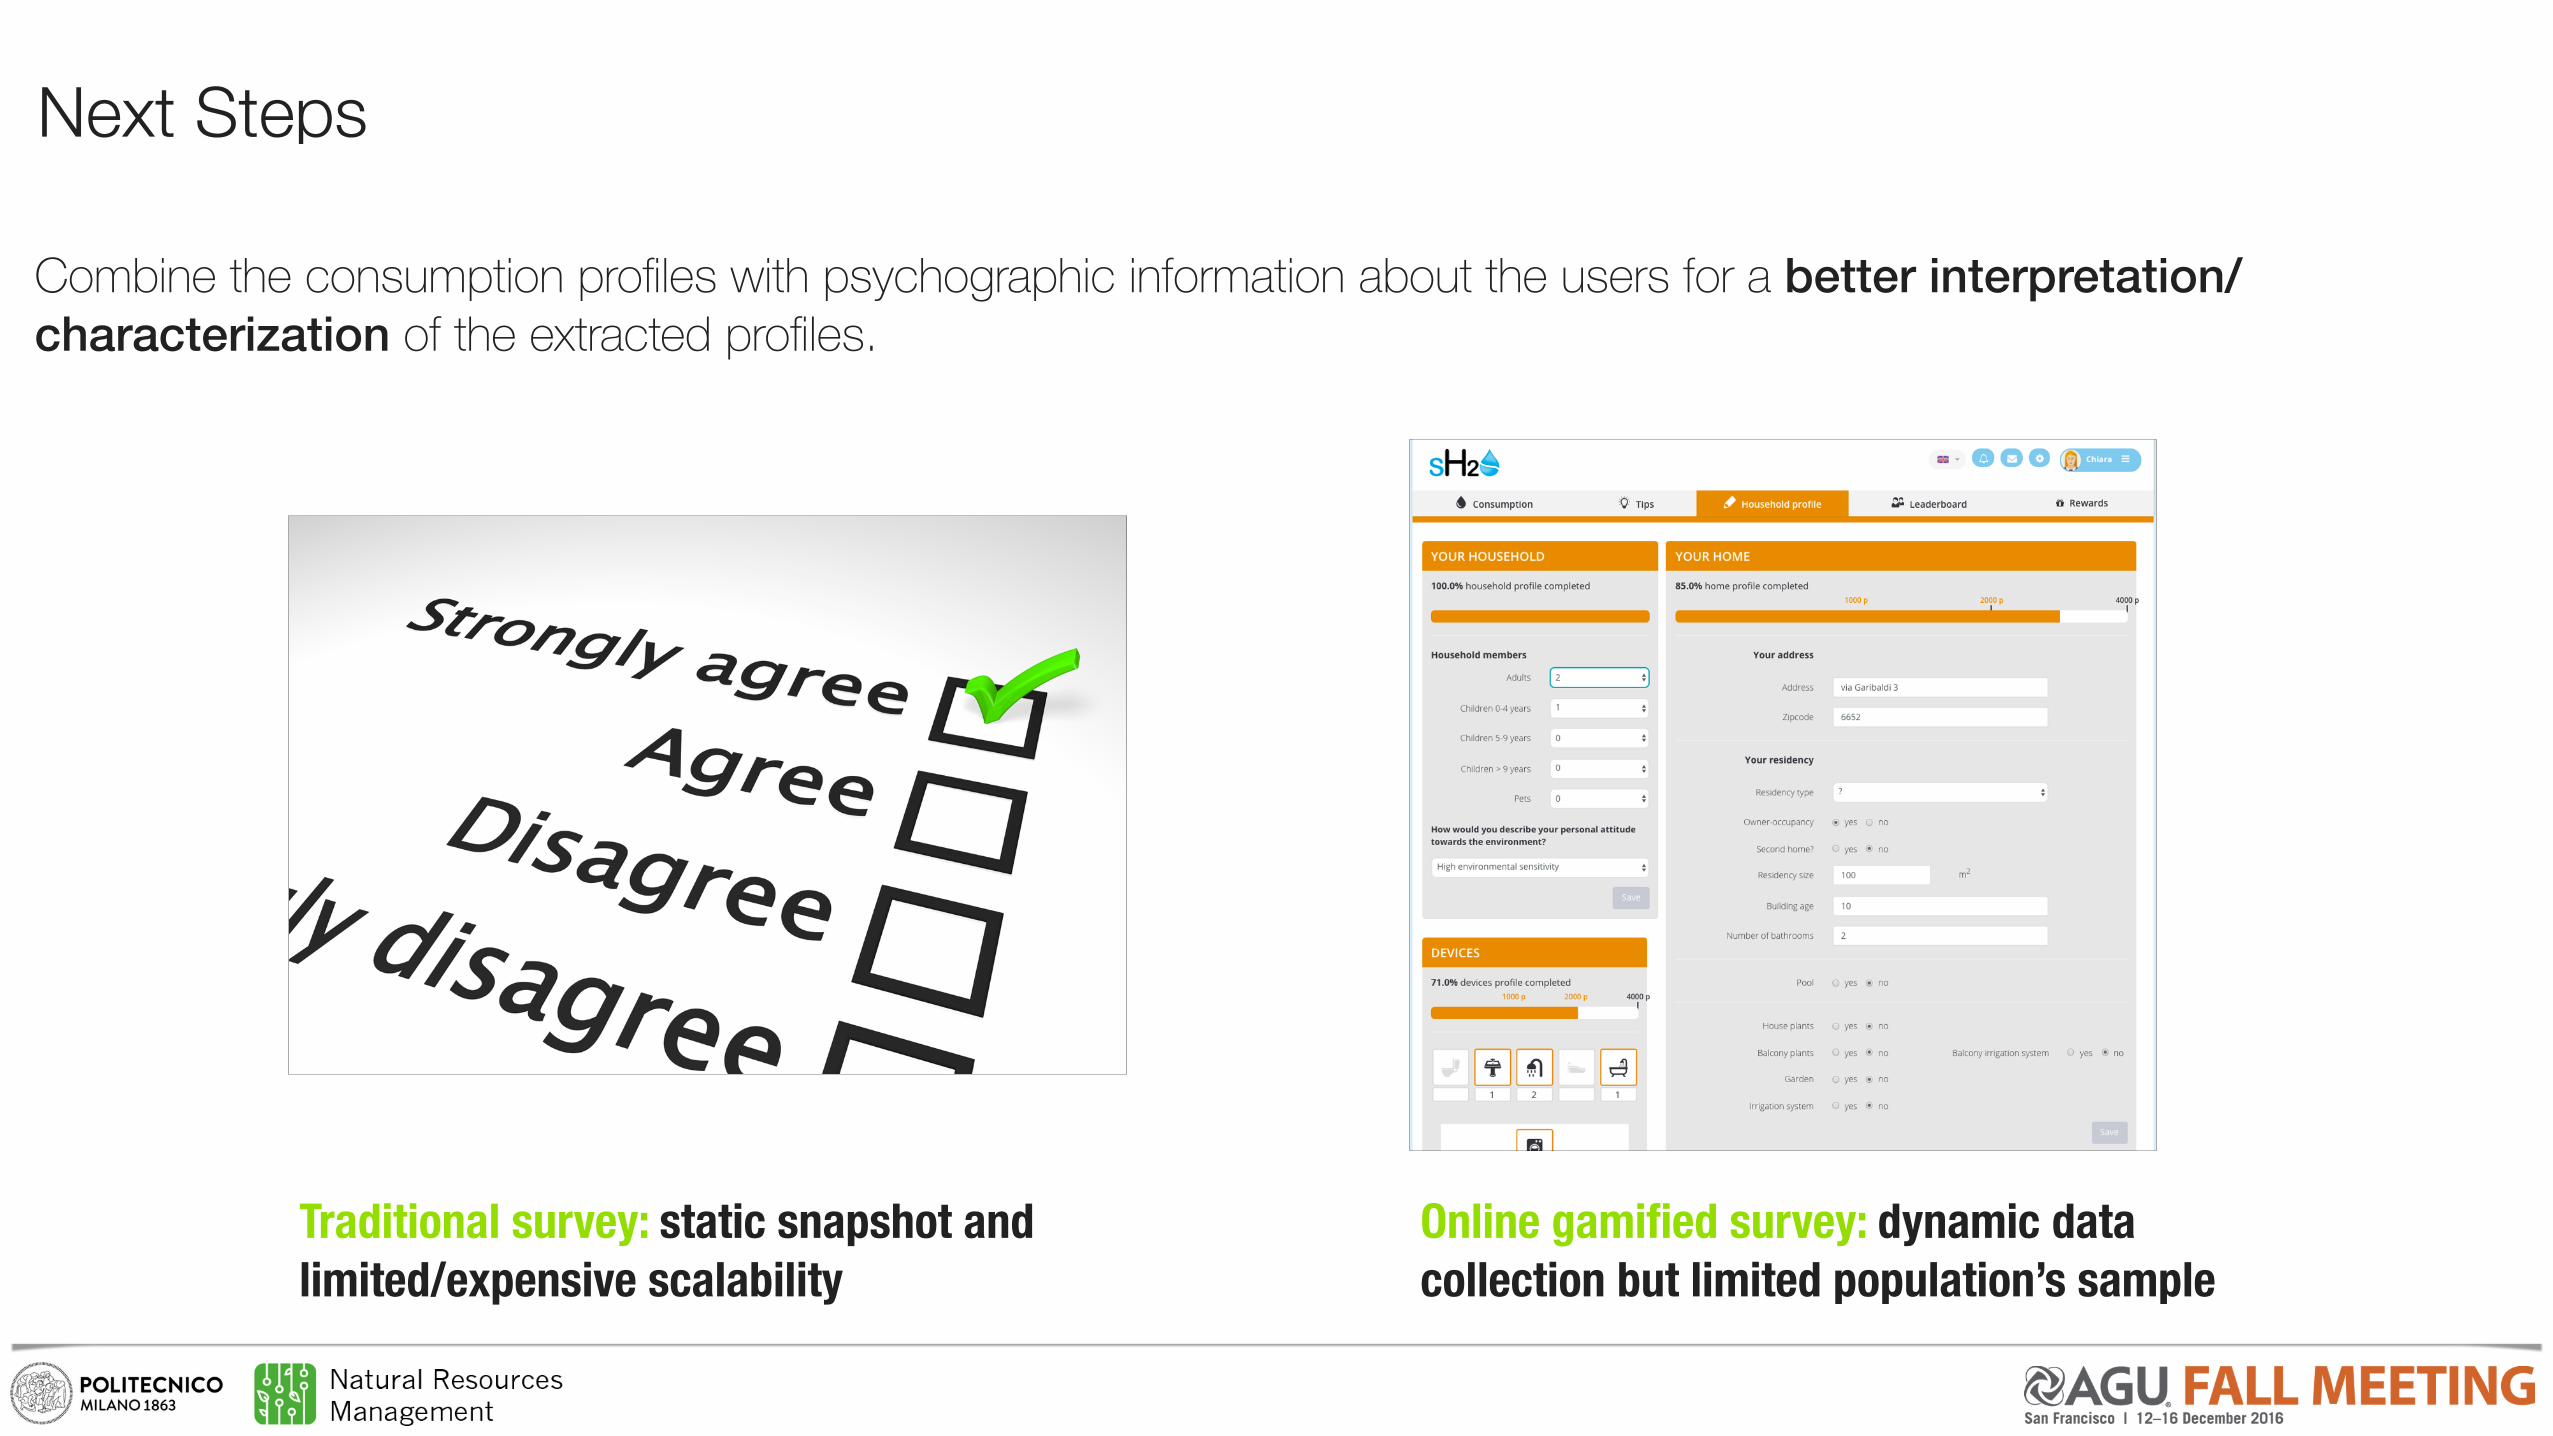
Combine the consumption profiles with psychographic information about the users for a better interpretation/characterization of the extracted profiles.
Traditional survey: static snapshot and limited/expensive scalability
Online gamified survey: dynamic data collection but limited population’s sample
