ict sector in india - itu
TRANSCRIPT
ICT Sector in India Status and Challenges
ITU Regional Workshop on ICT Statistics for Asia-Pacific2-4 October 2019 , Hanoi, Vietnam
Arvind PandeyDirector(P&M)
Ministry of Communications Government of India
e-mail: [email protected]

Contents
• Demographic Profile & Core Philosophy
• Indian Telecom Scenario
• ICT-Stakeholders
• Measurement of ICT data
• Coordination
• Legal Framework
• Issues and challenges
• Way Forward
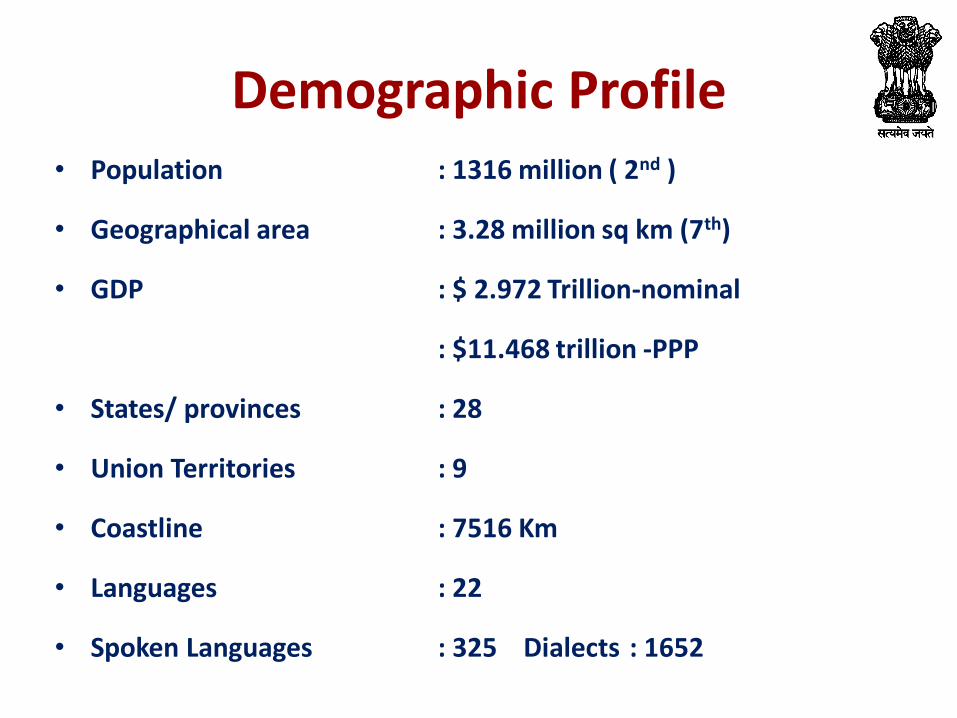
Demographic Profile • Population : 1316 million ( 2nd )
• Geographical area : 3.28 million sq km (7th)
• GDP : $ 2.972 Trillion-nominal
: $11.468 trillion -PPP
• States/ provinces : 28
• Union Territories : 9
• Coastline : 7516 Km
• Languages : 22
• Spoken Languages : 325 Dialects : 1652

Core Philosophy-Inclusive Development
– India’s Philosophy -“sabka saath sabka vikas” (Development forAll with involvement of All).
– Approach resulted into BB penetration from 15 Mn in 2012 to595.59 Mn in June 2019.
– Internet data consumption reached 46.23MnTB in 2018 andcurrently highest in the world.
– Heavy investment made by Govt through BharatNet program toconnect 250,000 Gram panchayat covering 600,000 villages-Connecting the unconnected.
– Indian approach for Technologies has always been inclusive andwill be inclusive, and India believes leveraging ICT for inclusivedevelopment of masses for solving social and economicalproblems of society.
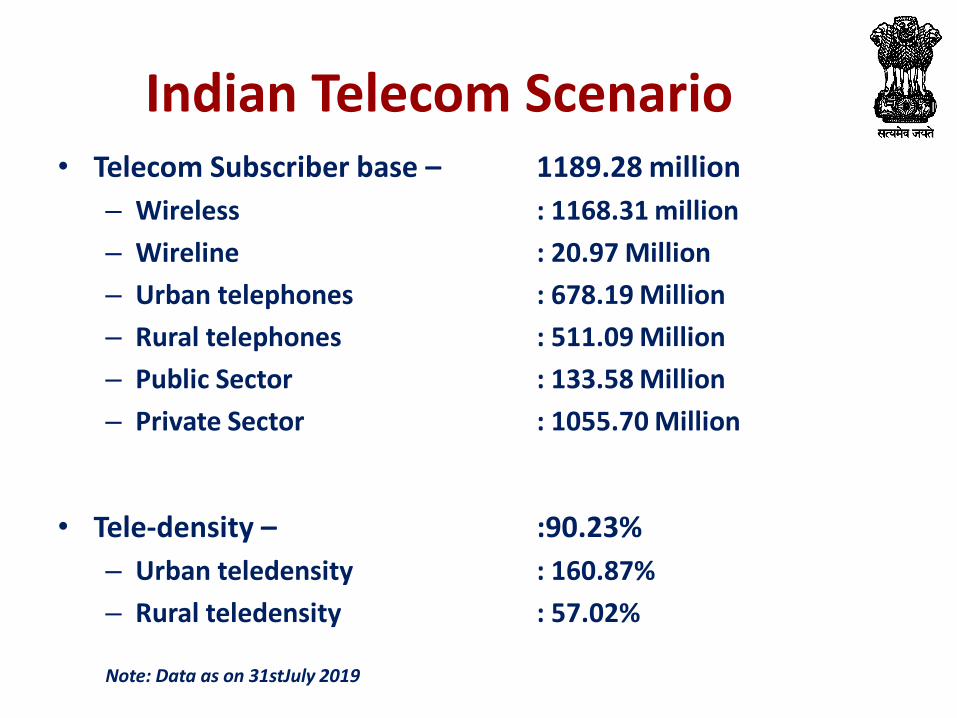
Indian Telecom Scenario• Telecom Subscriber base – 1189.28 million
– Wireless : 1168.31 million
– Wireline : 20.97 Million
– Urban telephones : 678.19 Million
– Rural telephones : 511.09 Million
– Public Sector : 133.58 Million
– Private Sector : 1055.70 Million
• Tele-density – :90.23%
– Urban teledensity : 160.87%
– Rural teledensity : 57.02%
Note: Data as on 31stJuly 2019
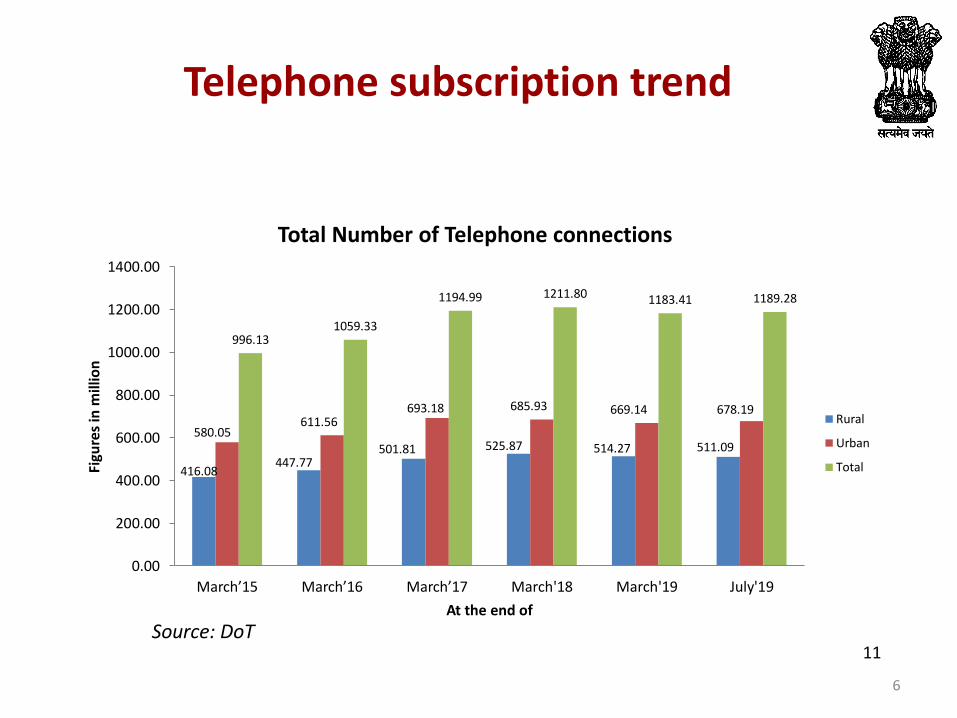
Telephone subscription trend
6
416.08447.77
501.81 525.87 514.27 511.09580.05
611.56693.18 685.93 669.14 678.19
996.131059.33
1194.99 1211.80 1183.41 1189.28
0.00
200.00
400.00
600.00
800.00
1000.00
1200.00
1400.00
March’15 March’16 March’17 March'18 March'19 July'19
Figu
res
in m
illio
n
At the end of
Total Number of Telephone connections
Rural
Urban
Total
Source: DoT11

Market Share of TSPs in Wireless connections - July 2019
Source: DoT
Bharti Group, 28.12%
Rel. Jio, 29.08%VodafoneIdea, 32.53%
PSUs , 10.27%
7
9

Market Share of TSPs in Wireline connections- July 2019
Source: DoT
Bharti Group, 20.53%
Reliance, 3.08%
VodafoneIdea, 1.74%
Tata Group, 8.67%
Quadarant , 1.03%
PSUs , 64.95%
8
10
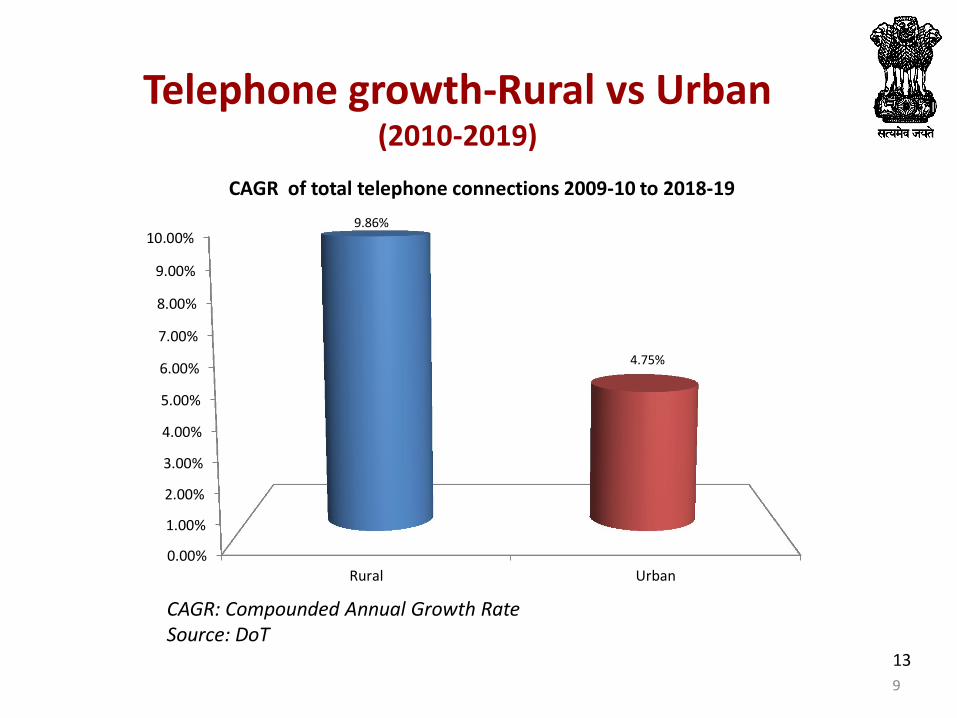
Telephone growth-Rural vs Urban(2010-2019)
9
0.00%
1.00%
2.00%
3.00%
4.00%
5.00%
6.00%
7.00%
8.00%
9.00%
10.00%
Rural Urban
9.86%
4.75%
CAGR of total telephone connections 2009-10 to 2018-19
CAGR: Compounded Annual Growth Rate Source: DoT
13

Indian Telecom Scenario
• Internet Subscribers :636.73 Million (March 2019)
– Broadband subscribers :594.59 Million (June 2019)
• Internet subscribers per 100 population : 48.48
– Urban internet subscribers per 100 population : 97.94
– Rural internet subscriber per 100 population : 25.36
• Data consumption - 46.23 Mn TB
– Average wireless data usage per subscriber per month -9.06 GB
– Tariff per GB of wireless data - Rs. 7.95 ( $ 0.1)

Internet connections trend
11
107.56 111.95136.52 145.82
227.01238.26
194.77230.71
285.68
348.12
409.72427.05
302.33
342.66
422.19
493.95
636.73665.31
0
100
200
300
400
500
600
700
March’15 March’16 March’17 March'18 March'19 June'19
Figu
res
in m
illio
n
At the end of
Number of Internet Connections
Rural
Urban
Total
Source: TRAI
15

Broadband connections trend
12
21.32 33.29
71.06
106.52
190.03 202.85
77.87
116.46
205.45
306.07
373.28391.74
99.19
149.75
276.52
412.59
563.31594.58
0
100
200
300
400
500
600
700
March’15 March’16 March’17 March'18 March'19 June'19
Figu
res
in m
illio
n
At the end of
Number of Broadband Connections
Rural
Urban
Total
Source: TRAI17

Broadband growth - Rural vs Urban( 2015-2019)
13
0.00%
10.00%
20.00%
30.00%
40.00%
50.00%
60.00%
Rural Urban
54.88%
36.81%
CAGR of Broadband Connections 2014-15 to 2018-19
CAGR: Compounded Annual Growth Rate Source: TRAI
19

Wireless Data Usage (All India)
14
4206.415
5430.0466521.893
8067.633
10418.076
12549.891
14253.256
15850.560
0.000
2000.000
4000.000
6000.000
8000.000
10000.000
12000.000
14000.000
16000.000
18000.000
Wireless Data Usage (in PB)
Quarter ending
Source: TRAI 20

Data Usage per subscriber
15
1248.001600.00
1945.002437.00
3206.00
8320.008740.00
9060.00
0.00
1000.00
2000.00
3000.00
4000.00
5000.00
6000.00
7000.00
8000.00
9000.00
10000.00
Data usage per month per subscribers (in MB)
Source: TRAI
21
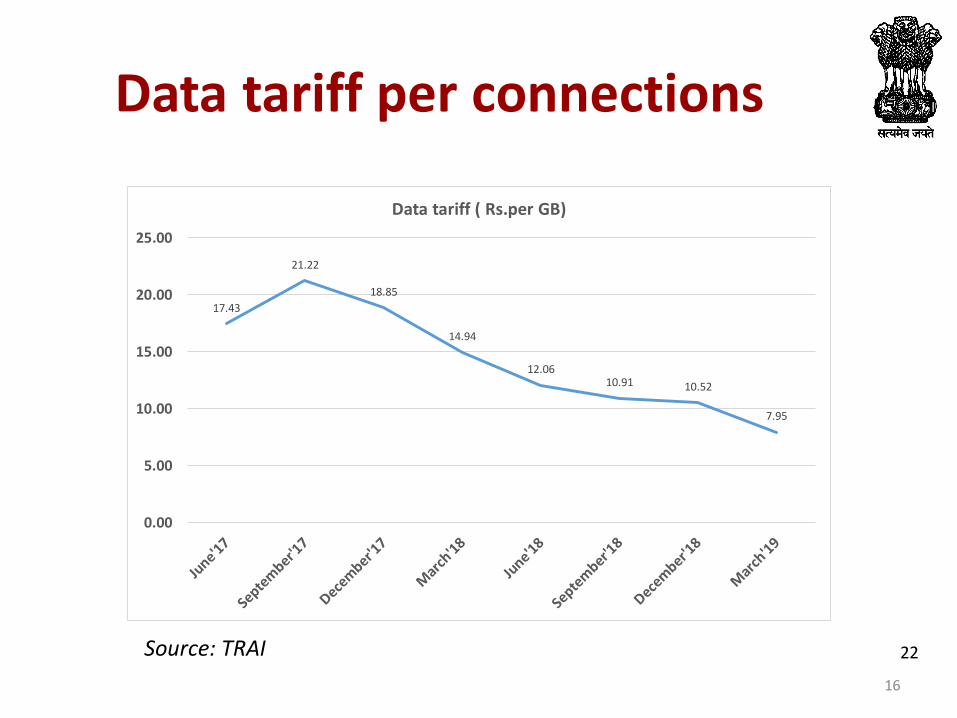
Data tariff per connections
16
17.43
21.22
18.85
14.94
12.0610.91 10.52
7.95
0.00
5.00
10.00
15.00
20.00
25.00
Data tariff ( Rs.per GB)
Source: TRAI 22

Minutes of Usage (MoU)
17
Source: TRAI
389 383 381405
584
692
0
100
200
300
400
500
600
700
800
March'14 March'15 March'16 March'17 March'18 March'19
Minutes of usage per subscriber per month (voice )
23

Wireless ARPU
18
ARPU: Average Revenue Per UserSource: TRAI
113
120
125
83
7671.39
0
20
40
60
80
100
120
140
March'14 March'15 March'16 March'17 March'18 March'19
monthly wireless ARPU (Rs.)
24

Telecom Coverage
• Number of Towers – 560,162
• Number of BTS (Base Trans-receiver Station) – 2,180,224
– 2G- 521,650 (23.92%)
– 3G- 358,158 (15.42%)
– 4G- 1,300,416 (59.64%)
( As on 12-07-2019)
Percentage of population covered with at least 2G - 97%
Percentage of population covered with at least 3G- 94 %
Percentage of population covered with at least 4G – 94%
19Source: DoT, TSPs25

ICT in India - Stakeholders
• Ministry of Communications
– Telecom Service Providers, Industry Associations-COAI,
TEMA, ISPAI, IAMAI, NASSCOM, etc.
• Regulatory and Appellate Bodies
• National Statistical Office (MoSPI)
• Ministry of Human Resource Development
(MHRD)

Ministry of Communications
• National Telecom Policy
• Issue of Licenses– Access service
– National Long Distance & International Long Distance
– Internet services
– Infrastructure Provider , VSAT service etc.
• Allotment of Spectrum
• Universal Service Obligation– BharatNet, NFS, Hilly Areas, Islands
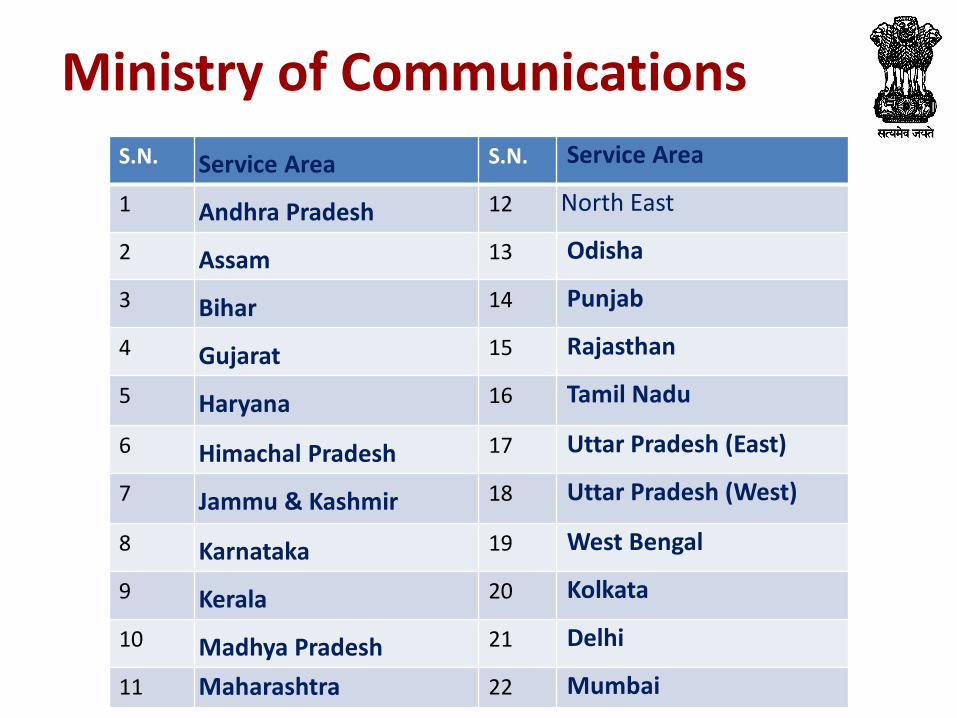
S.N. Service Area S.N. Service Area
1 Andhra Pradesh 12 North East
2 Assam 13 Odisha
3 Bihar 14 Punjab
4 Gujarat 15 Rajasthan
5 Haryana 16 Tamil Nadu
6 Himachal Pradesh 17 Uttar Pradesh (East)
7 Jammu & Kashmir 18 Uttar Pradesh (West)
8 Karnataka 19 West Bengal
9 Kerala 20 Kolkata
10 Madhya Pradesh 21 Delhi
11 Maharashtra 22 Mumbai
Ministry of Communications

Regulatory and Appellate Bodies
• Telecom Regulatory Authority of India (TRAI)– Recommendation to Ministry on policy issues
– Interconnect Agreement between TSPs
– Tariff-Regulation and Directions
• Telecom Dispute Settlement and Appellate Tribunal ( TDSAT)-– Adjudicate matter involving Licensor, Licensee, Regulator
and Group of consumers

Ministry of Statistics and Program Implementation-(MoSPI)
Lays down and maintains norms and standards in the field of statistics,involving concepts and definitions, methodology of data collection,processing of data and dissemination of results;
• Central Statistical Office (CSO)– National Account– Social Statistical Division– Economic Statistical Division
• National Sample Survey Office (NSSO)– Survey design– Data collection – Data processing – Publication

Ministry of Human Resource Development (MHRD)
Collects data on various indicators on education forPolicy making on primary, secondary and tertiaryeducation and sending statistics to UNESCO. ITU takesdata directly from UNESCO website.

Measurement of ICT Data
Individual access and Use collected by MoC & TRAI fromTelecom operators and Industry Associations• Subscription data- wireline, wireless, internet, Broadband• Teledensity-Urban, Rural• Telecom financial data• Usage and Revenue • Data usage of mobile users• Cable and Broadcasting data• Quality of Service indicators
Trade in ICT goods by DGCI&S - Import , Export
Trade in ICT services by RBI- Import, Export

Measurement of ICT Data
Household Surveys – conducted by NSSO
• Access to computers, internet by households; Use of internet
by individual; ICT Skill etc.
• Latest data–2014(71st round): 75th round just completed in
2019
Annual Survey of Industries & Economic Censuses
conducted by CSO
• Use, Access and Skill of computers, internet by establishments

Measurement of ICT Data
MHRD Collects data on various indicators on educationfor Policy making on primary, secondary and tertiaryeducation and sending statistics to UNESCO. ITU takesdata directly from UNESCO website. Data for IDI skill(proxy indicators) are as under:
– Mean years of Schooling
– Gross secondary enrolment ratio
– Gross tertiary enrolment ratio
– ICT skill

Coordination
Ministry of Communication, being nodal agency for ICTindicators, coordinates with
-- Telecom Regulatory Authority of India
– Telecom service Provides and their Associations
– National Statistical Office –household data
– Ministry of Human Resource Development- skill
data
– Inter-ministerial task force is set up for coordination on ICT
data

Legal Framework
The Indian Telegraph Act 1885
• License Terms and Conditions, Audit of TSPs
Telecom Regulatory Authority of India Act 1997
The Collection of Statistics Act 1953
Various Acts under MHRD
Issues and Challenges
• Size - Population, Geographical Area
• Difficult terrains- Mountains & Deserts
• Diversity - Language, Culture
• Digital Divide – Urban vs Rural
• Lack of dedicated surveys and Periodicity
• Decentralized systems – not integrated

Way Forward
• Technology based solution for survey so as to get
timely and good quality data
• Core group on various futuristic indicators like
Cyber security, Artificial Intelligence, M2M/ IoTs,
OTT, Spectrum, 5G etc.

Thank You