iconic brand builder · (% of net revenues, excludes younique) mid single digits penetration high...
TRANSCRIPT

COTYICONIC BRAND BUILDER
BARCLAYS BACK TO SCHOOL CONFERENCESeptember 3, 2019
1

WE HAVEA strong asset base and a roadmap to unlock significant value
2
STRONGASSET BASE

A DIVERSIFIED BEAUTY COMPANYCoty competes in key segments
Coty’s product portfolio covers key categories
F R A G R A N C E S
C O S M E T I C S
H A I R C A R E
S K I N C A R E
B O D Y C A R E
M A S SL U X U R Y P R O F E S S I O N A L
4

#1 Global Fragrance Maker
3 out of Top 10 Luxury Fragrance Brands
Average remaining license life ~8 years
LUXURYBUSINESSCOTY IS THE GLOBAL LEADER IN FRAGRANCES
5

LUXURY BUSINESS
1.9%
5.2%
4.1%
-1.1%
6.0%
4.7%
FY17 FY18 FY19
Coty luxury net revenues growing in-line to ahead of global luxury fragrance market
Steadily improving margins, with room for further expansion
Global Luxury Fragrances YoY
Coty Luxury Net Revenue YoY
Operating Margin
Source: NPD, Euromonitor, Coty estimates
6

Opportunity to leverage brands into adjacent categoriesLUXURY BUSINESS
COTY#1 Share
Market Size ($Bn)
Estimated Next 5Y CAGR
3% 4% 5% 6% 7% 8%
$20
$30
$40
$10
Luxury Fragrance Segment
▪ License agreements allow expansion into cosmetics and skincare
▪ Major growth opportunities in the ~$24B luxury cosmetics and ~$35B luxury skincare segments
▪ Gucci make-up relaunch off to a very strong start
Luxury Cosmetics Segment
Luxury Skincare Segment
Source: NPD, Euromonitor, Coty estimates
7
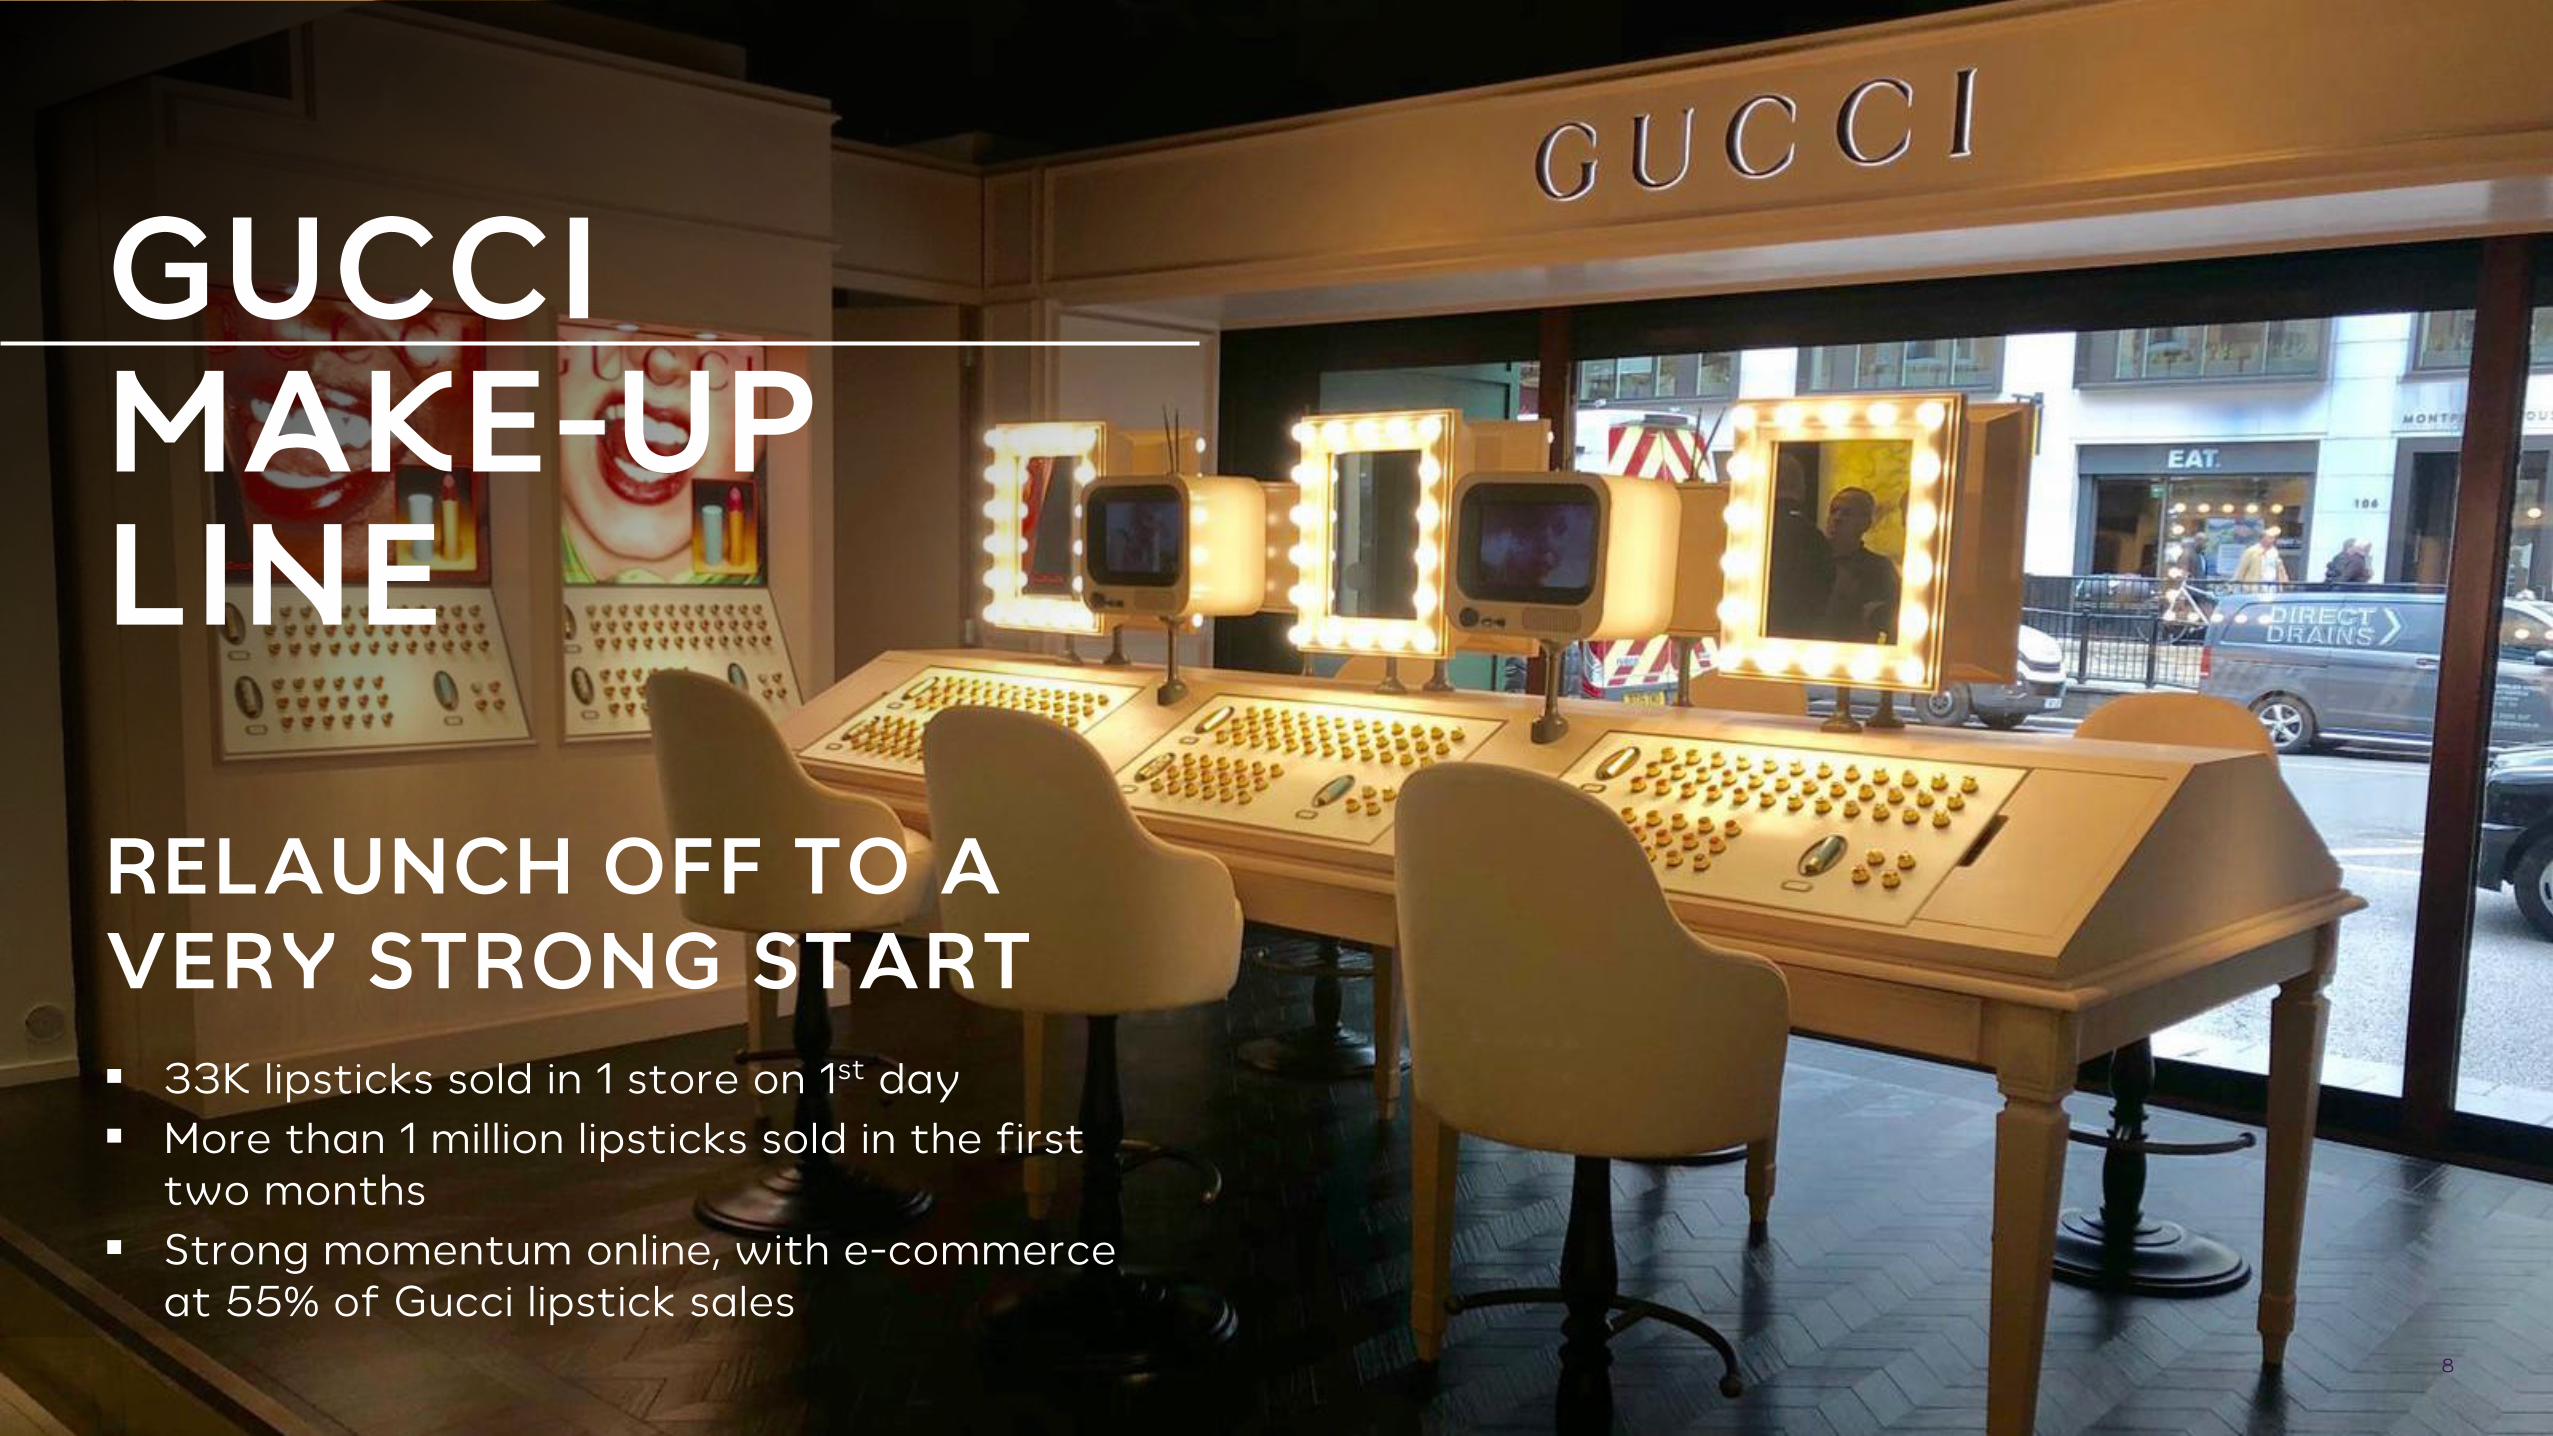
▪ 33K lipsticks sold in 1 store on 1st day▪ More than 1 million lipsticks sold in the first
two months▪ Strong momentum online, with e-commerce
at 55% of Gucci lipstick sales
GUCCIMAKE-UP LINE
RELAUNCH OFF TO A VERY STRONG START
8

SIGNIFICANT UNTAPPED POTENTIAL IN SKINCARE
<$100M in Revenues
#6 Skincare brand in China Sephora
~$200M in Revenues
#6 skincare brand in the U.S.
9

High loyalty and barriers to entry
Salon customers’ repeat purchase rate is >13x that of retail beauty consumers
PROFESSIONALBEAUTY
COTY IS A LEADER IN SALON HAIR
10

WELLA #1 SALON HAIR COLOR BRANDMajority of our salon customers have been buying Wella for >9 years
Strongly positioned for further growth
11

BRANDS WITH SIGNIFICANT GROWTH POTENTIAL
~$300M in Revenues
Top 5 markets still >70% of revenues
Reaching double-digit % awareness in 4 additional markets
>$200M in Revenues
U.S. still >55% of revenues
60%+ awareness and top 5 brand power in several additional key beauty markets
12

COTY’S FIRST
Haircare brand, offering a range of natural, vegan and cruelty-free products
93% to 99.7% natural origin, 100% recyclable packaging
Natural personal care market currently ~$4B and expected to grow ~5x in next 5 years
Example of white space opportunity
ECO-ETHICALBRAND
Source: Kline, Transparency Market Research13

Luxury Consumer Beauty Professional Beauty TOTAL COTY
E-Commerce Penetration(% of Net Revenues, excludes Younique)
Mid single digits
penetration
High single digits penetration
~30% Rev Growth
>25% Rev Growth
>30% Rev Growth
>30% Rev Growth
STRONG E-COMMERCE MOMENTUMAcross all divisions
(ex Younique)
FY18 FY19
14%
12%
10%
8%
6%
4%
2%
14

SIGNIFICANT VALUE IN
Luxury Professional Beauty&
Combined for ~68% of Coty EBITDA 15

A CLEAR PATH FOR IMPROVEMENT INCONSUMER BEAUTY
16

▪ Context: Measured mass beauty segment declining -1-2% annually in the last 3 years
▪ Drivers: Growing penetration of indie brands in unmeasured channels
▪ Our goal: Moderate revenue decline through premiumization of our brands to be in line with the market of -1-2% by FY23
11%
5%
-7%
-10%
Premium MassMainstream
MassValueMass
Coty USLFL
MASS BEAUTY SEGMENT IN MODERATE DECLINEOpportunity for value creation through growing premium mass segment
*Coty US Consumer Beauty excludes YouniqueSource: Nielsen, Coty Inc
US Color Cosmetics CAGR (‘16-’18)Coty US Consumer Beauty LFL CAGR (FY17-FY19)
17
Total Mass Beauty:-1% to -2%

ColorCosmetics
Hair Coloring& Styling
Mass Fragrances & Body Care
¹ Nail category only² Hair Styling only³ For Germany, refers to share in Mass Fragrances; in Brazil, refers to share in Body Care Source: Nielsen
CONSUMER BEAUTYStrong competitive position in key beauty geographies
18

INCREASE AT-SCALE ADVERTISING TO MORE BRANDS AND MARKETS
Number of priority brands in key markets supported through advertising at-scale
Example brands
3x
19

15
5
3
Launch Month Month 6 Month 7
Rimmel Wonder'Luxe UK Ranking
RIMMEL WONDER’LUXE CASE STUDY
TV SUPPORT AIRS
▪ Rimmel Wonder’Luxe launches in the UK at 12% premium to existing Wonder range
▪ With substantially increased TV support in recent months, Wonder’Luxe now #3 mascara in the UK and #1 for Rimmel
▪ Rimmel gains 0.4 points of market share, following share losses
PLANNED ACTIONSLaunch premium innovation and support with
4x increase to advertising relative to FY19 Source: Nielsen, Coty Inc
20

CREATE VALUE BY REVERSING PRICE EROSION IN OUR CATEGORIES AND BRANDSCoty sample brand price index relative to direct competitor brand C
oty
high
erpr
iced
Cot
y lo
wer
pric
ed
21
Past Yesterday Going Forward
Past Yesterday Past Yesterday Past YesterdayGoing Forward
Going Forward
Going Forward
Coty price index vs. competition = 100%

ACCELERATE HERO SUB-BRANDS IN ORDER TO BUILD BIGGER, SIMPLER BRANDS
Share of hero sub-brands
22

GRADUALLY RATIONALIZE OUR SKUSSimplifies our business and drives gross margin expansion
Value Engineer
Accelerate Growth
SKU Mapping of Top Cosmetics Brand in Key Market
~38% of SKUs
~70% of revenues
Reduce Complexity~25% of SKUs
~10% of revenues
SKU
Rel
evan
ce /
pro
duct
ivit
y
SKU Gross Margin
High
HighLow
~15% of SKUs
~10% of revenues
Rationalize~22% of SKUs
~10% of revenues
23
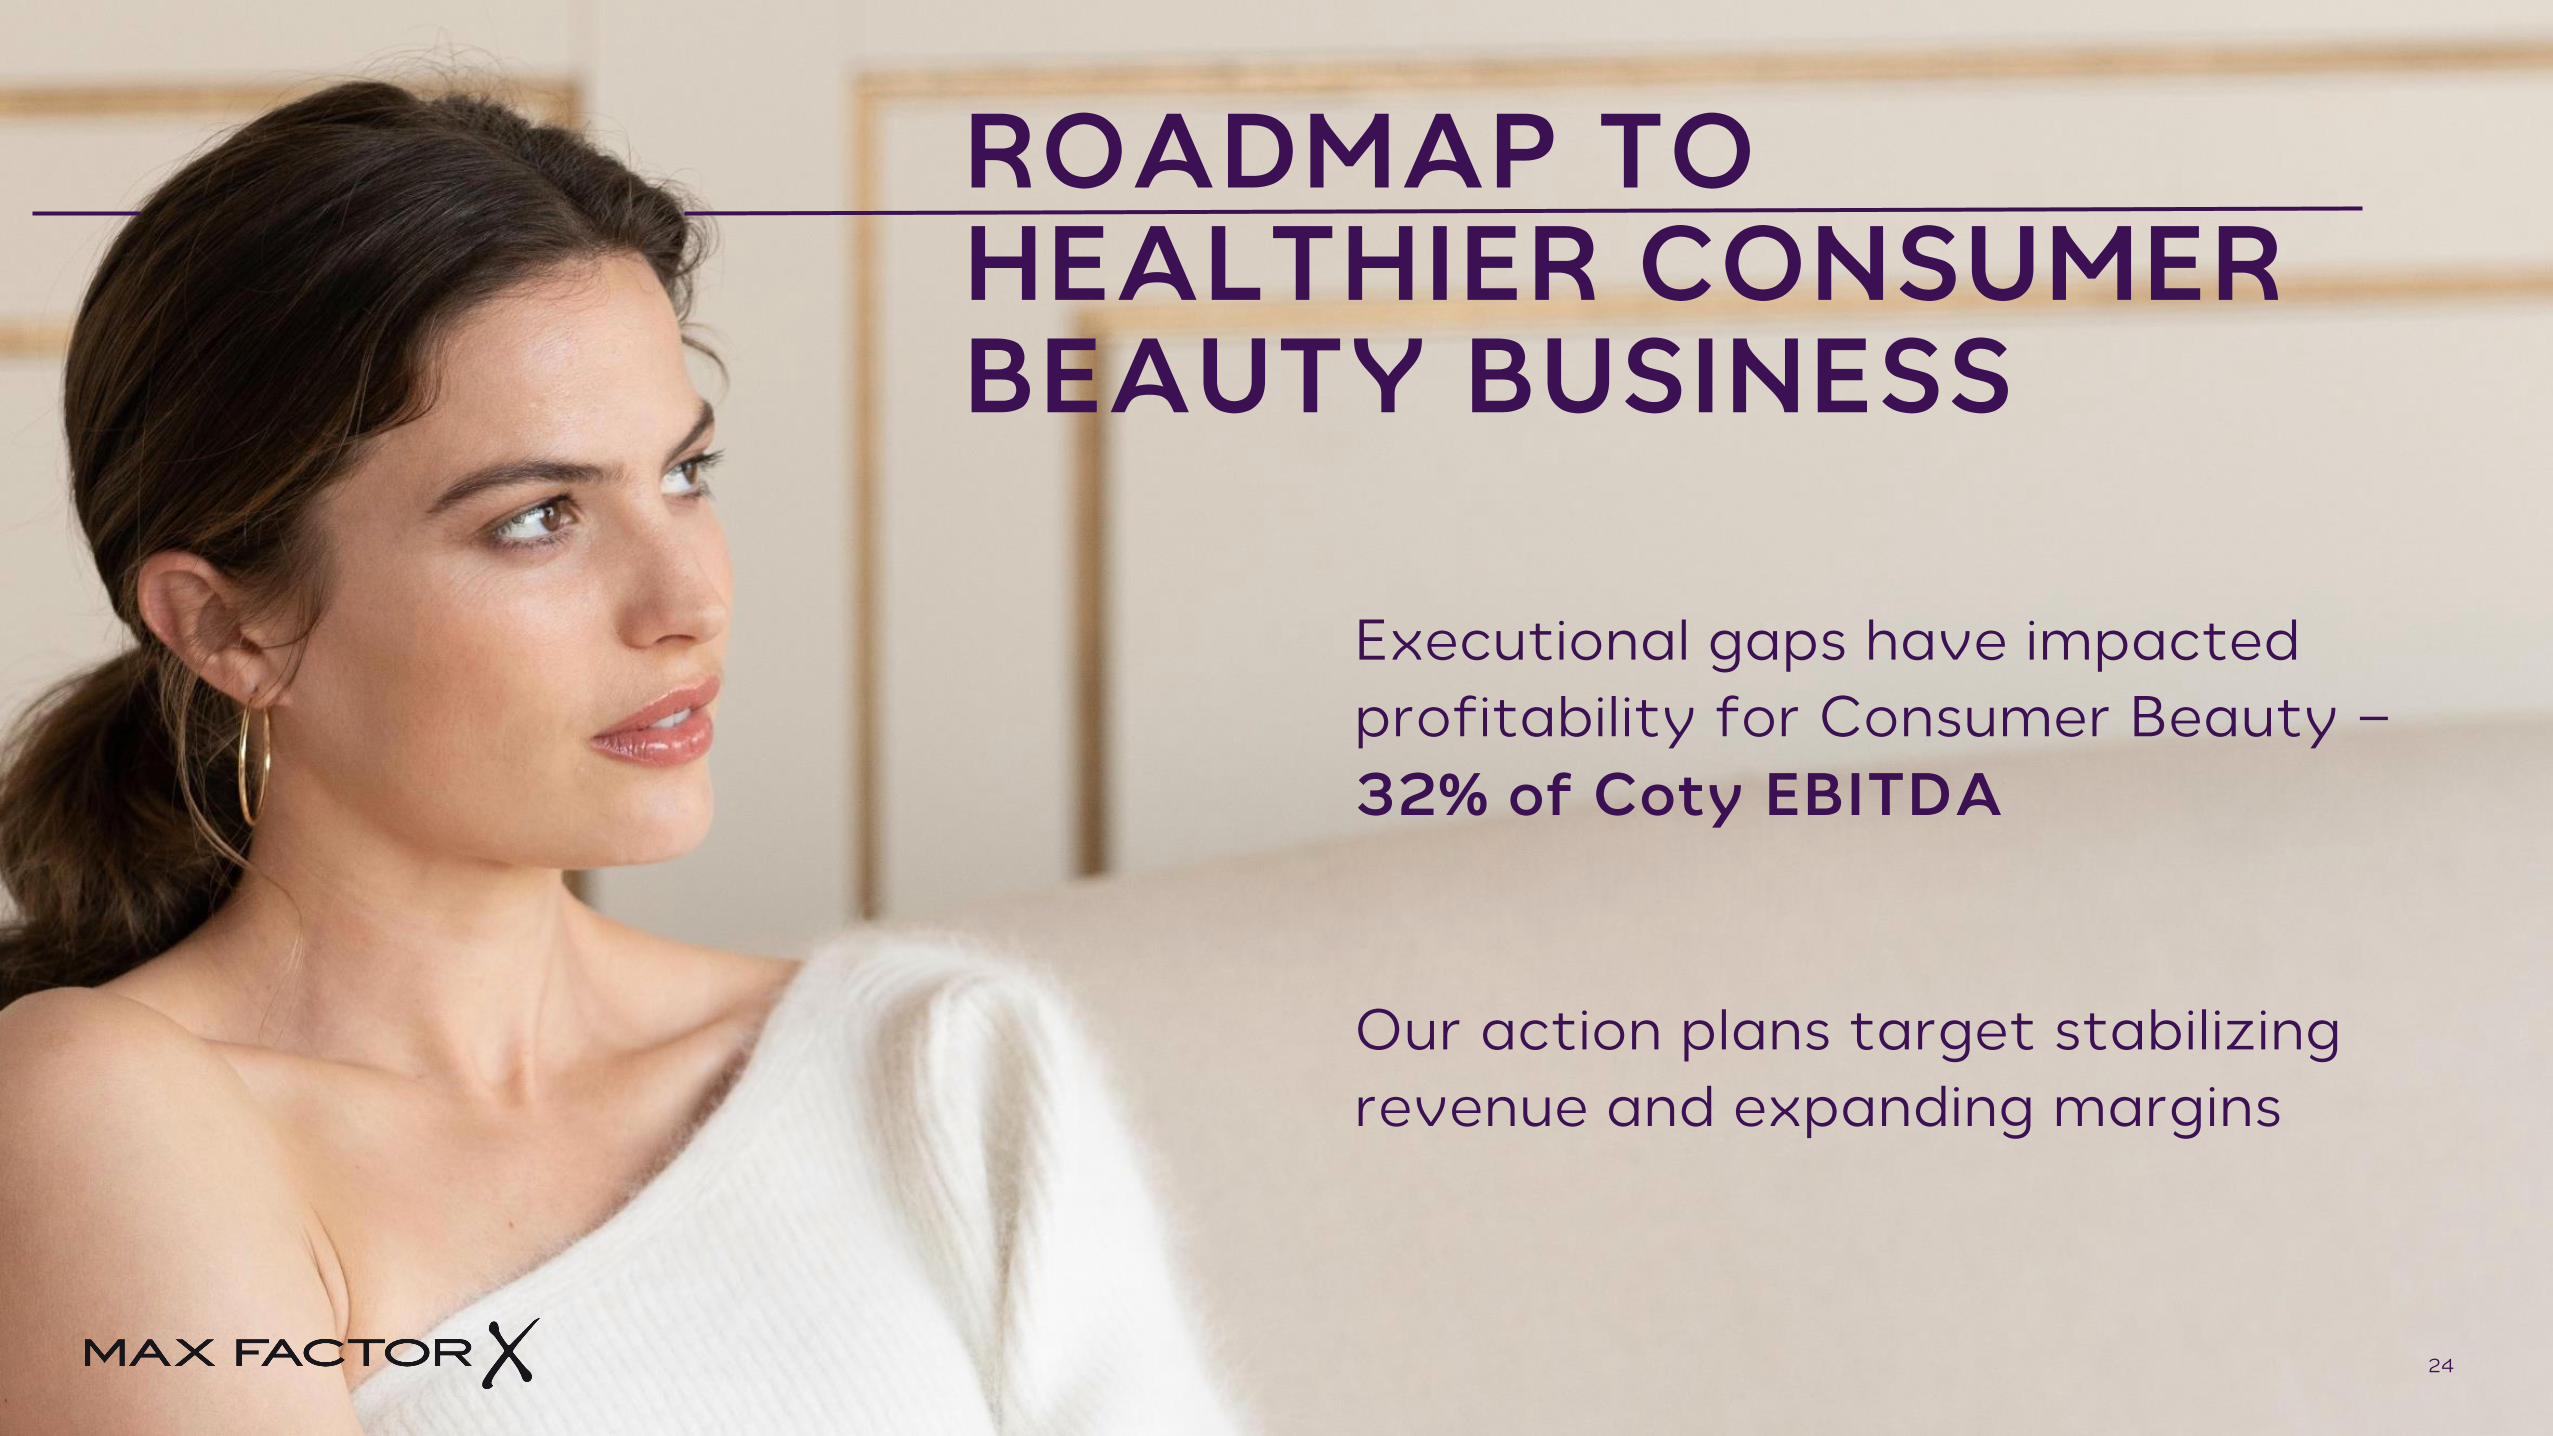
ROADMAP TO HEALTHIER CONSUMER BEAUTY BUSINESS
Executional gaps have impacted profitability for Consumer Beauty –32% of Coty EBITDA
Our action plans target stabilizing revenue and expanding margins
24

COMPELLING INVESTMENT OPPORTUNITY

Net revenues growth(constant FX & scope)
Free Cash Flow
Net Debt to EBITDA
Adjusted Operating Margin
0 to 2%(stable FY23 vs FY19)
~$1 billionLess than 4x
14% to 16%
OUR OBJECTIVESFY23 Targets
26

PROFITS - BUILDING SUSTAINABLE INCOME GROWTH
FCF
Mix / Value
Fixed Cost
COGS
Advertising
Net Revenues
Net Debt EPS
Operating Income(Margin +3-5%)
AssortmentPromotionInnovation~40% of gross margin expansion
ProductivitySKU Reduction~60% of gross margin expansion
Organization delayering
Mutualizing support functions
Working Media
Digital & Traditional
Gross Margin(>5%)
27

STRONG FINANCIAL POSITION AND PATH TO DELEVERAGE
▪ Ample liquidity and no major maturities until FY23
▪ Financing conditions allow flexibility
▪ Generating positive free cash flow, which will steadily increase to over $1Bn by FY23 and drive debt paydown

OUR NEW PATH STARTS NOW
Stable to slightly down YoY
+5-10% YoYStrong A&CP reinvestment
Moderate improvement YoY
LFL NET REVENUES
ADJUSTED OI(At Constant Scope
and Currency)
FREE CASH FLOW
FY20 Outlook
Mid-single digit growth YoYADJUSTED EPS
We have a strong asset base, and a roadmap to unlock significant value
30

Forward-Looking Statements
Certain statements in this presentation are forward-looking statements. These forward-looking statements reflect Coty Inc.’s (“Coty’s”) current views with respect to, among other things, Coty’s Turnaround Plan, strategic planning, targets, segment reporting and outlook for fiscal year 2020 and future reporting periods (including the extent and timing of revenue, profit and EPS trends and changes in operating cash flows and cash flows from operating activities and investing activities); Coty’s future operations and strategy, allocation and amount of advertising and consumer promotion costs, allocation and amount of research and development investments, ongoing and future cost efficiency and restructuring initiatives and programs (including the expected timing and impact), investments, licenses and portfolio changes, synergies, savings, performance, cost, timing and integration of acquisitions, future cash flows, liquidity and borrowing capacity, timing and size of cash outflows and debt deleveraging, the performance of launches or relaunches, the timing and impact of current or future destocking or shelf spaces losses, the impact and timing of supply chain disruptions and the resolution thereof, timing and extent of any future impairments, and the synergies, savings, impact, cost, timing and implementation of Coty’s Turnaround Plan, including operational and organizational structure changes, operational execution and simplification initiatives, the move of Coty’s headquarters, and the priorities of senior management. These forward-looking statements are generally identified by words or phrases, such as “anticipate”, “are going to”, “estimate”, “plan”, “project”, “expect”, “believe”, “intend”, “foresee”, “forecast”, “will”, “may”, “should”, “outlook”, “continue”, “temporary”, “target”, “aim”, “potential”, “goal” and similar words or phrases. These statements are based on certain assumptions and estimates that we consider reasonable, but are subject to a number of risks and uncertainties, many of which are beyond the control of Coty, which could cause actual results to differ materially from such statements. Such risks and uncertainties are identified in the periodic reports Coty has filed and may file with the Securities and Exchange Commission (the “SEC”) including, but not limited to: Coty’s ability successfully implement its multi-year Turnaround Plan and to develop and achieve its global business strategies, compete effectively in the beauty industry and achieve the benefits contemplated by its strategic initiatives within the expected time frame or at all, the integration of recent acquisitions with Coty’s business, operations, systems, financial data and culture and the ability to realize synergies, avoid future supply chain and other business disruptions, reduce costs and realize other potential efficiencies and benefits (including through its restructuring initiatives) at the levels and at the costs and within the time frames contemplated or at all, and managerial, integration, operational, regulatory, legal and financial risks, including diversion of management attention to and management of cash flows, expenses and costs associated with multiple ongoing and future strategic initiatives, internal reorganizations and restructuring activities, including the Turnaround Plan, and Coty’s ability to retain and attract key personnel and the impact of senior management transitions and organizational structure changes.
The foregoing review of important factors should not be construed as exhaustive and should be read in conjunction with the other cautionary statements that are included elsewhere. More information about potential risks and uncertainties that could affect Coty’s business and financial results is included under “Risk Factors” and “Management’s Discussion and Analysis of Financial Condition and Results of Operations” in Coty’s Annual Report on Form 10-K for the fiscal year ended June 30, 2019, and other periodic reports Coty has filed and may file with the Securities and Exchange Commission (the “SEC”) from time to time. Any forward-looking statements made in this presentation are qualified in their entirety by these cautionary statements. All forward-looking statements are made only as of the date of this presentation, and, Coty undertakes no obligation, other than as may be required by applicable law, update or revise any forward-looking or cautionary statements to reflect changes in assumptions, the occurrence of events, unanticipated or otherwise, or changes in future operating results over time or otherwise.
Non-GAAP Financial Measures
In this presentation, Coty presents certain non-GAAP financial measures that we believe enable management and investors to analyze and compare the underlying business results from period to period, including constant currency, organic like-for-like (LFL) and adjusted metrics, as well as free cash flow and net debt. Constant currency information compares results between periods as if exchange rates had remained constant period-over-period, with the current period’s resultscalculated at the prior-year period’s rates. The term “like-for-like” describes the Coty's core operating performance, excluding the financial impact of (i) acquired brands or businesses in the current year period until Coty has twelve months ofcomparable financial results, (ii) divested brands or businesses or early terminated brands in the prior year period to maintain comparable financial results with the current fiscal year period and (iii) foreign currency exchange translations to theextent applicable. Adjusted metrics exclude nonrecurring items, purchase price accounting related amortization, acquisition-related costs, restructuring costs and certain other information as noted within this presentation. Free cash flow is definedas net cash provided by operating activities, less capital expenditures, and net debt is defined as total debt less cash and cash equivalents. These non-GAAP financial measures should not be considered in isolation, or as a substitute for, or superiorto, financial measures calculated in accordance with GAAP. To the extent that Coty provides guidance, it does so only on a non-GAAP basis and does not provide reconciliations of such forward-looking non-GAAP measures to GAAP due to theinherent difficulty in forecasting and quantifying certain amounts that are necessary for such reconciliation, including adjustments that could be made for restructuring, integration and acquisition-related expenses, amortization expenses,adjustments to inventory, and other charges reflected in our reconciliation of historic numbers, the amount of which, based on historical experience, could be significant.
Outlook Information
In this presentation, Coty presents outlook information as of August 28, 2019.
Definitions and Notes
Fiscal year represents Coty’s fiscal year ended June 30.
DISCLAIMER
31