iclr friday forum: canadian megadisasters (june 17, 2016)
TRANSCRIPT
1CONFIDENTIAL ©2016 AIR WORLDWIDE
Canadian Megadisasters: An exploration of sensitivities and implications
for the insurance industry
Eric D. Robinson, PhD, Senior Scientist - Manager
2CONFIDENTIAL ©2016 AIR WORLDWIDE
What Constitutes a “MegaDisaster” or Extreme
Disaster Scenario?
Create a plausible, yet highly unlikely scenario that
might, one day, shock the marketGoal:
World Historical Events that had EDS Characteristics
1992: Hurricane Andrew, $17 Billion (USD 1992)
• 8 insolvencies, $27 Billion Economic loss
2005: Hurricane Katrina, $61.6 Billion (USD 2005)
2011: Tohoku Earthquake
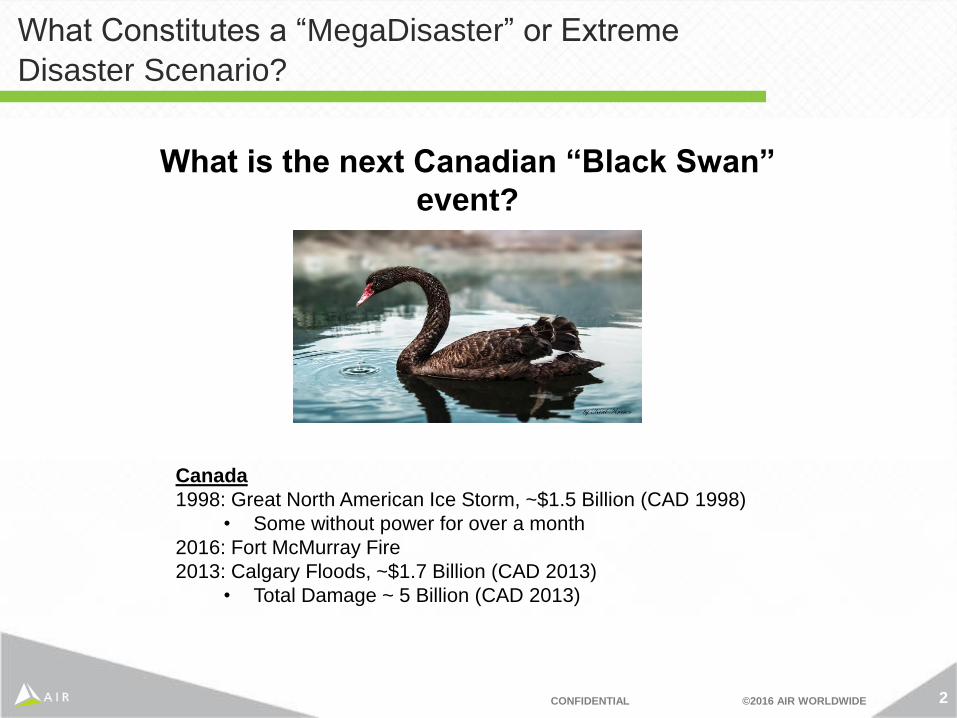
Canada
1998: Great North American Ice Storm, ~$1.5 Billion (CAD 1998)
• Some without power for over a month
2016: Fort McMurray Fire
2013: Calgary Floods, ~$1.7 Billion (CAD 2013)
• Total Damage ~ 5 Billion (CAD 2013)
What is the next Canadian “Black Swan”
event?
3CONFIDENTIAL ©2016 AIR WORLDWIDE
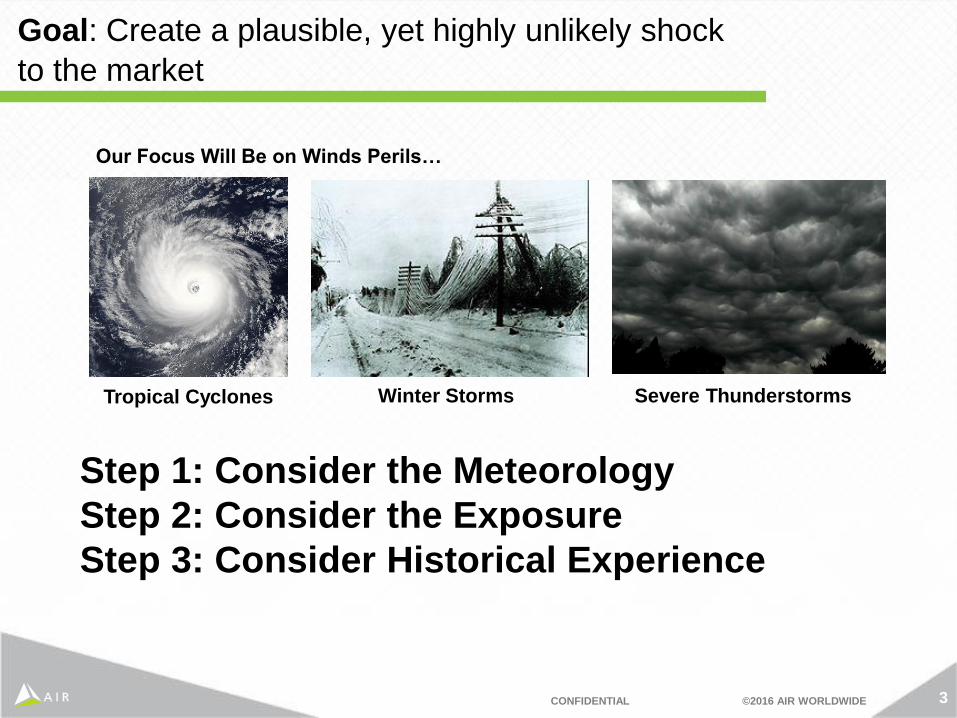
Goal: Create a plausible, yet highly unlikely shock
to the market
Our Focus Will Be on Winds Perils…
Tropical Cyclones Winter Storms Severe Thunderstorms
Step 1: Consider the Meteorology
Step 2: Consider the Exposure
Step 3: Consider Historical Experience
4CONFIDENTIAL ©2016 AIR WORLDWIDE
Tropical Cyclones
5CONFIDENTIAL ©2016 AIR WORLDWIDE
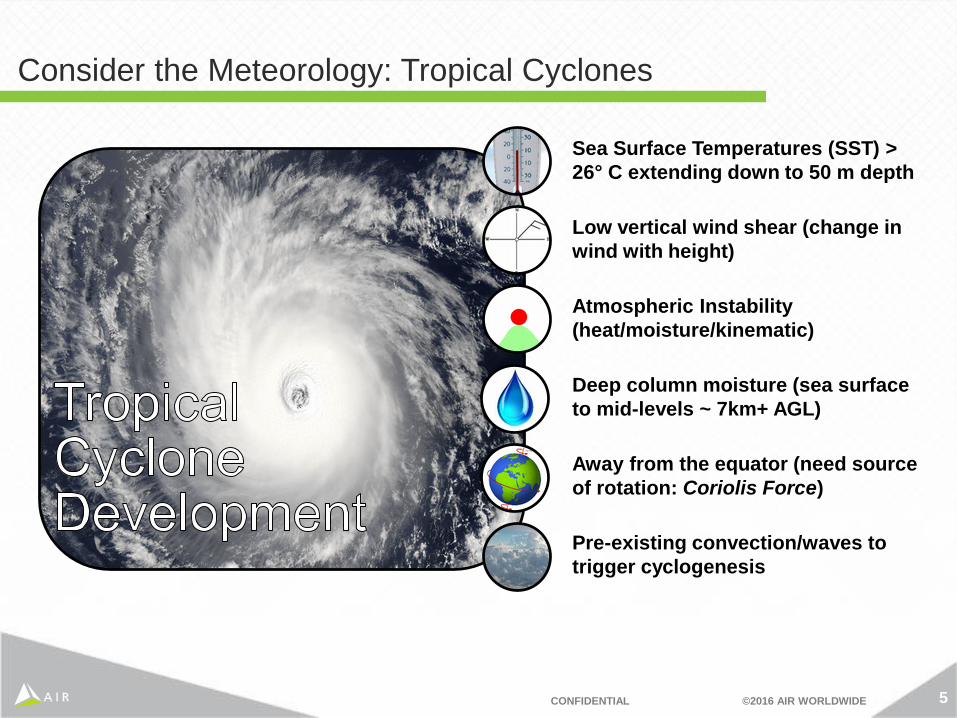
Consider the Meteorology: Tropical Cyclones
Sea Surface Temperatures (SST) >
26° C extending down to 50 m depth
Low vertical wind shear (change in
wind with height)
Atmospheric Instability
(heat/moisture/kinematic)
Deep column moisture (sea surface
to mid-levels ~ 7km+ AGL)
Away from the equator (need source
of rotation: Coriolis Force)
Pre-existing convection/waves to
trigger cyclogenesis
6CONFIDENTIAL ©2016 AIR WORLDWIDE
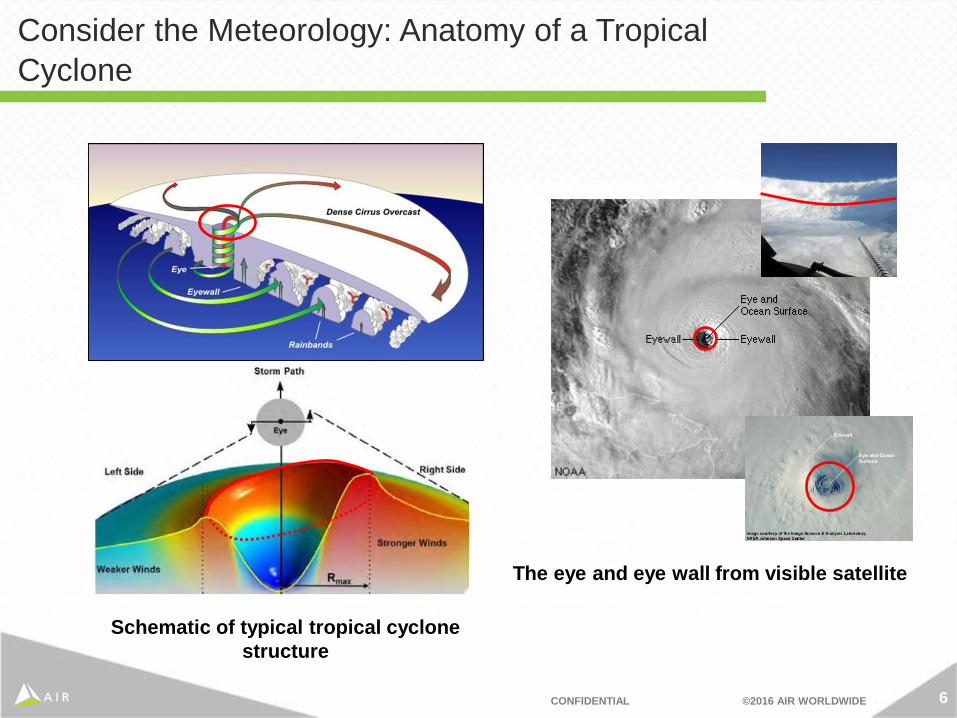
Consider the Meteorology: Anatomy of a Tropical
Cyclone
The eye and eye wall from visible satellite
Schematic of typical tropical cyclone
structure
7CONFIDENTIAL ©2016 AIR WORLDWIDE
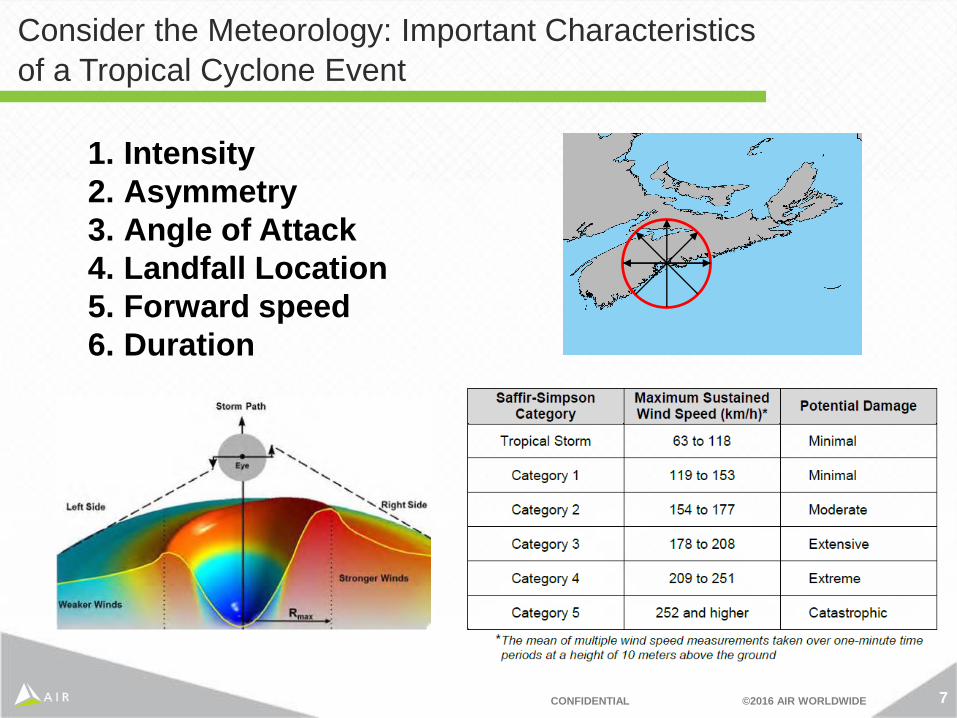
Consider the Meteorology: Important Characteristics
of a Tropical Cyclone Event
1. Intensity
2. Asymmetry
3. Angle of Attack
4. Landfall Location
5. Forward speed
6. Duration
8CONFIDENTIAL ©2016 AIR WORLDWIDE
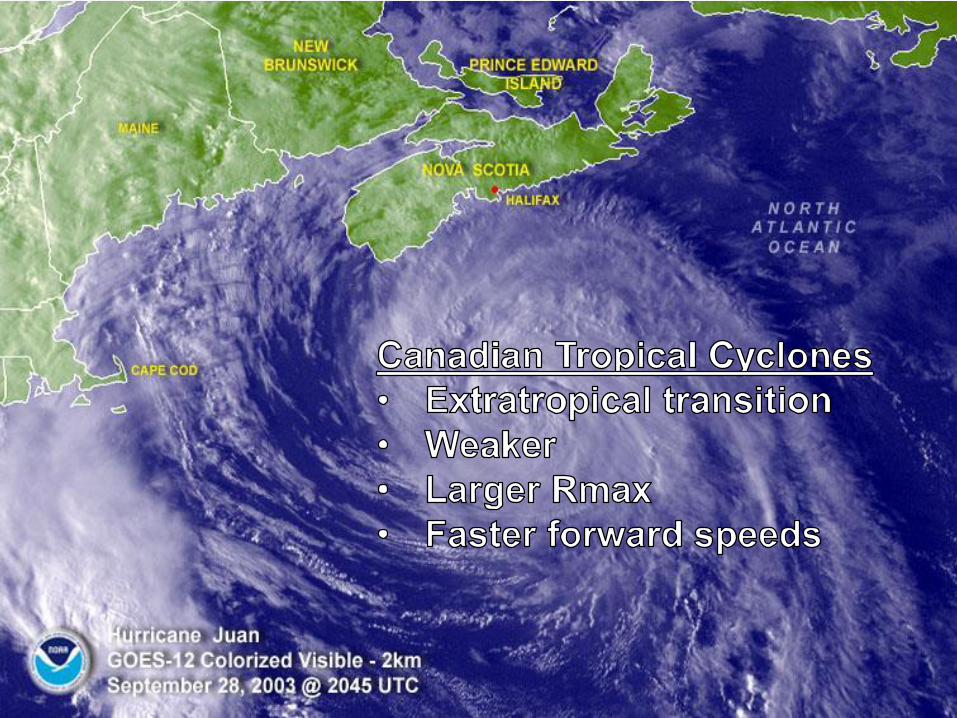
Tropical Cyclone
Impacts in Canada Are Similar to Northern U.S.
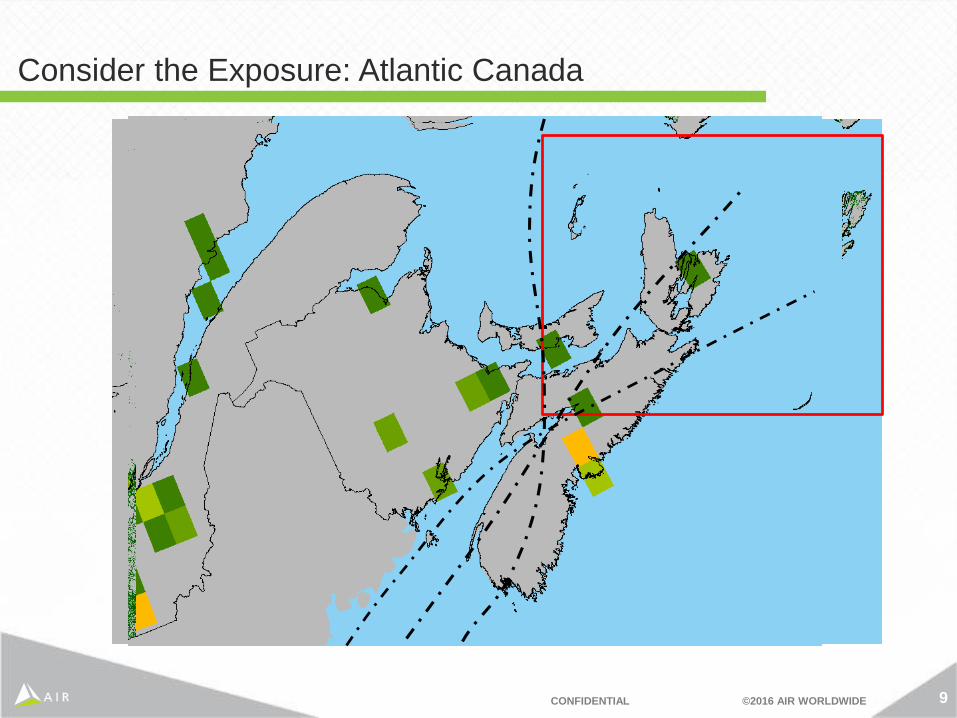
9CONFIDENTIAL ©2016 AIR WORLDWIDE
Consider the Exposure: Atlantic Canada
10CONFIDENTIAL ©2016 AIR WORLDWIDE
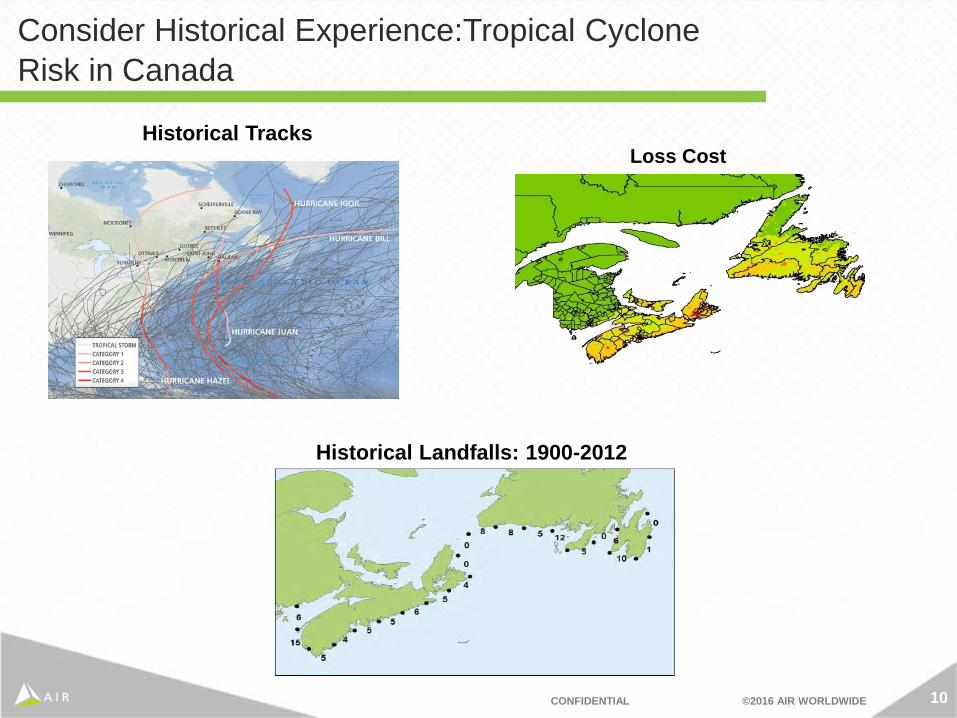
Consider Historical Experience:Tropical Cyclone
Risk in Canada
Loss CostHistorical Tracks
Historical Landfalls: 1900-2012
11CONFIDENTIAL ©2016 AIR WORLDWIDE
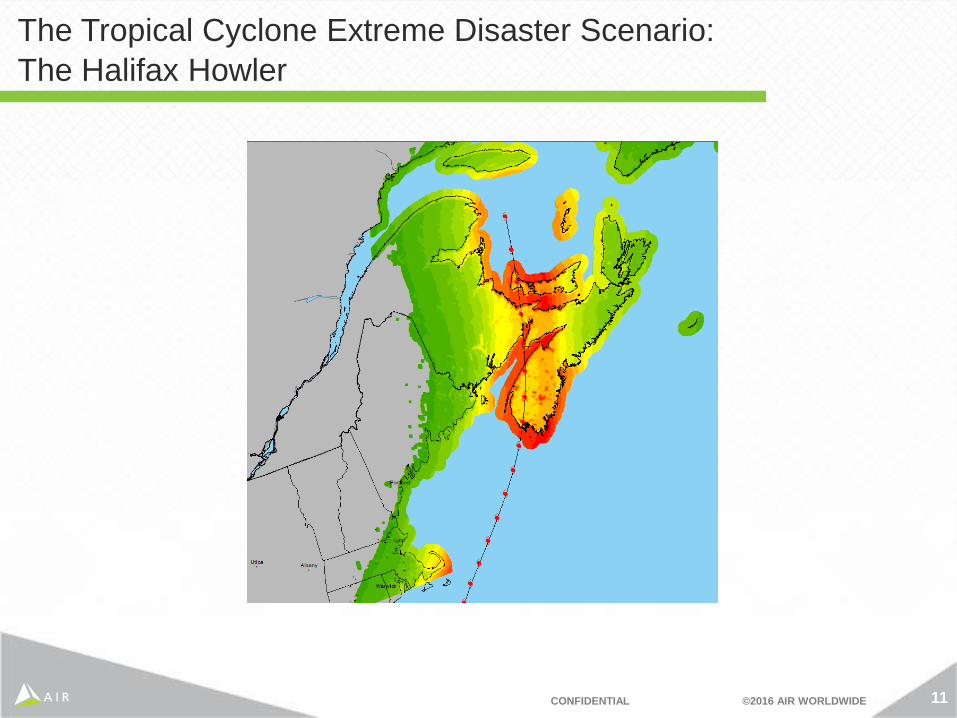
The Tropical Cyclone Extreme Disaster Scenario:
The Halifax Howler
12CONFIDENTIAL ©2016 AIR WORLDWIDE
Extratropical Cyclones
13CONFIDENTIAL ©2016 AIR WORLDWIDE
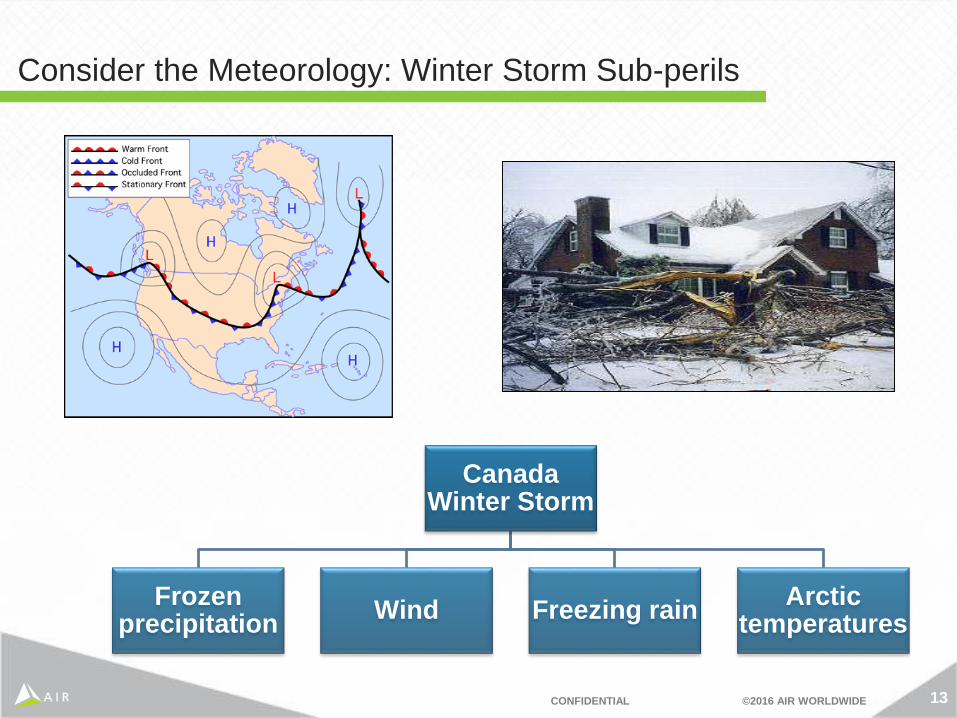
Consider the Meteorology: Winter Storm Sub-perils
Canada Winter Storm
Frozen precipitation
Wind Freezing rainArctic
temperatures
14CONFIDENTIAL ©2016 AIR WORLDWIDE
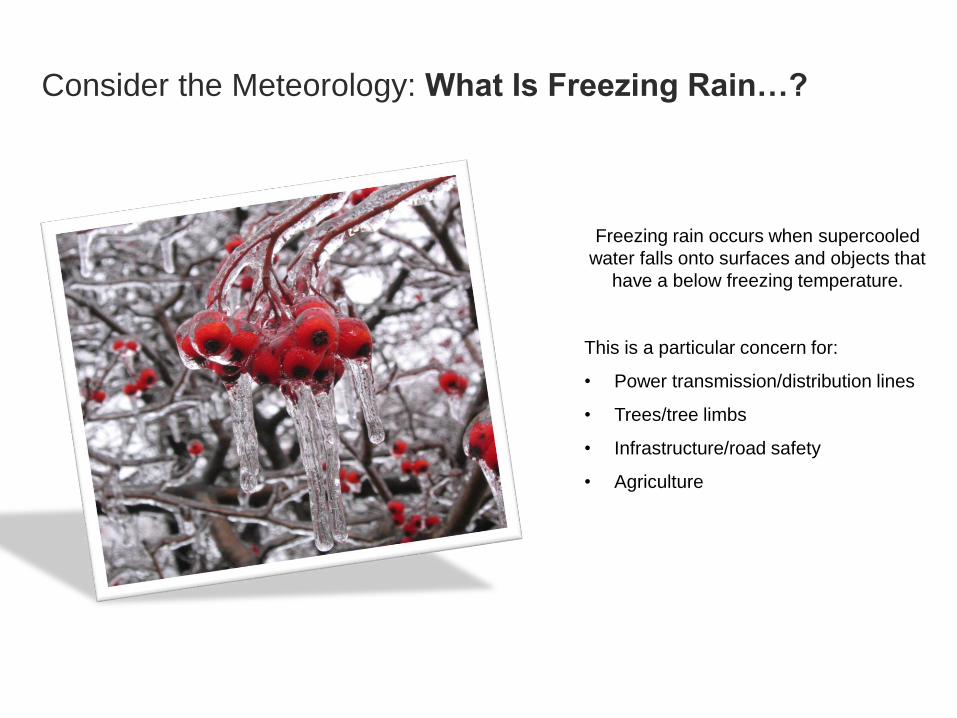
Consider the Meteorology: What Is Freezing Rain…?
Freezing rain occurs when supercooled
water falls onto surfaces and objects that
have a below freezing temperature.
This is a particular concern for:
• Power transmission/distribution lines
• Trees/tree limbs
• Infrastructure/road safety
• Agriculture
15CONFIDENTIAL ©2016 AIR WORLDWIDE
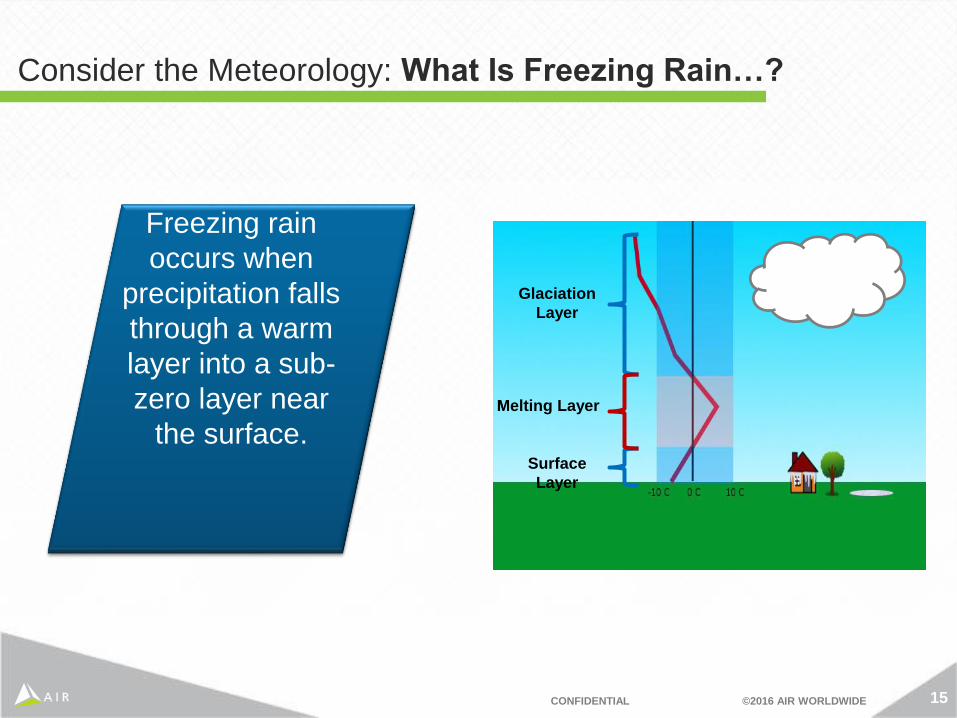
Glaciation
Layer
Melting Layer
Surface
Layer
Glaciation
Layer
Melting Layer
Surface
Layer
Snow occurs
when the entire
temperature
profile is below
zero, with
minimal warm
layers.
Freezing rain
occurs when
precipitation falls
through a warm
layer into a sub-
zero layer near
the surface.
Glaciation
Layer
Melting Layer
Surface
Layer
Consider the Meteorology: What Is Freezing Rain…?
16CONFIDENTIAL ©2016 AIR WORLDWIDE
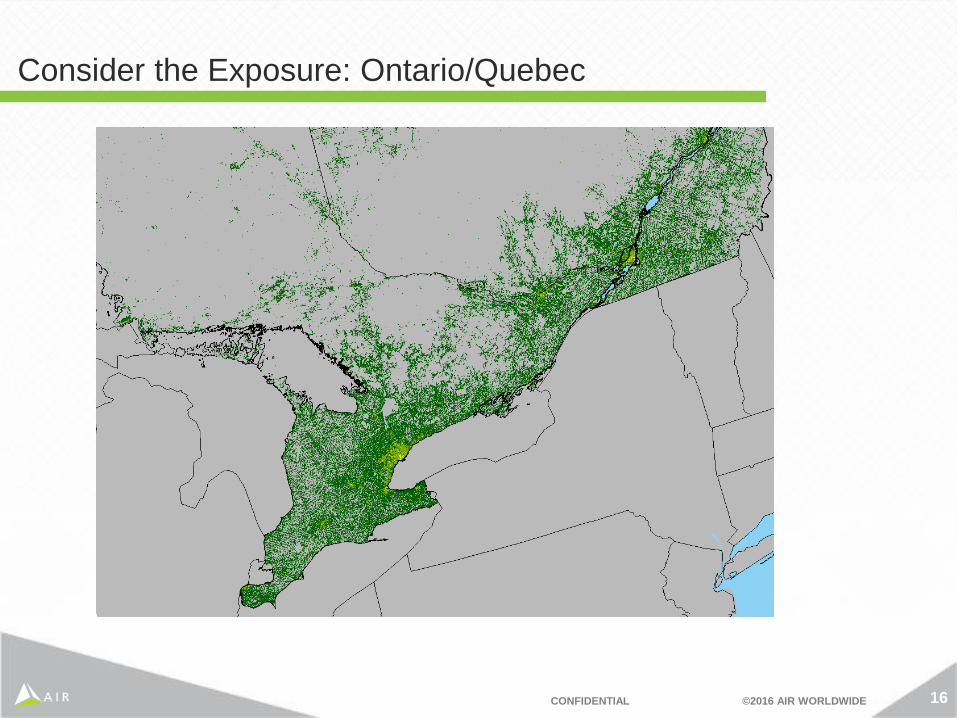
Consider the Exposure: Ontario/Quebec
17CONFIDENTIAL ©2016 AIR WORLDWIDE
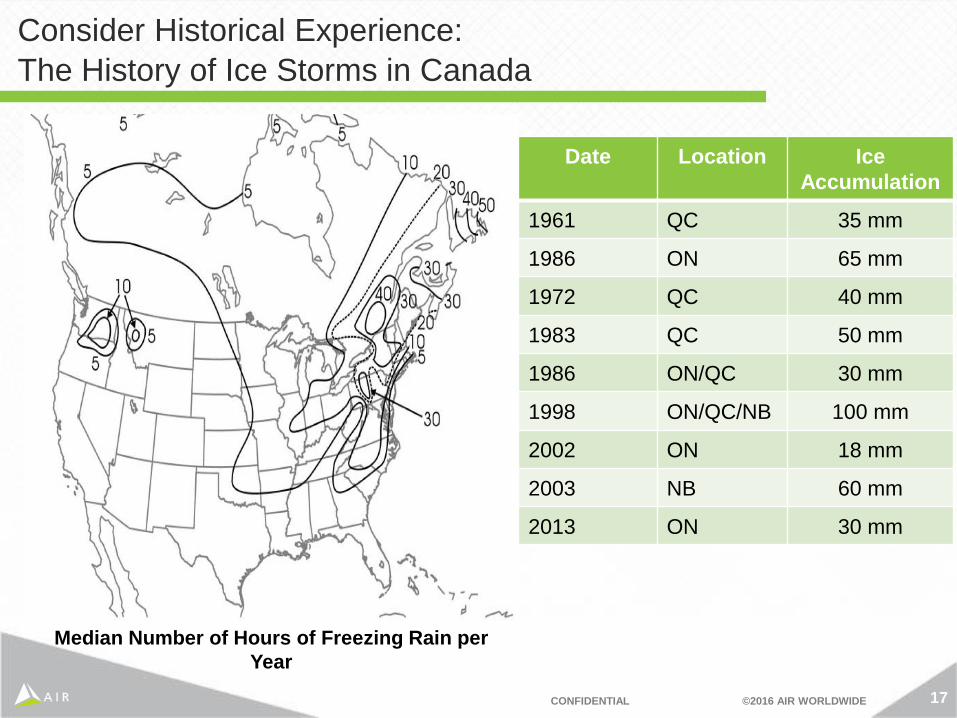
Consider Historical Experience:
The History of Ice Storms in Canada
Median Number of Hours of Freezing Rain per
Year
Date Location Ice
Accumulation
1961 QC 35 mm
1986 ON 65 mm
1972 QC 40 mm
1983 QC 50 mm
1986 ON/QC 30 mm
1998 ON/QC/NB 100 mm
2002 ON 18 mm
2003 NB 60 mm
2013 ON 30 mm
18CONFIDENTIAL ©2016 AIR WORLDWIDE
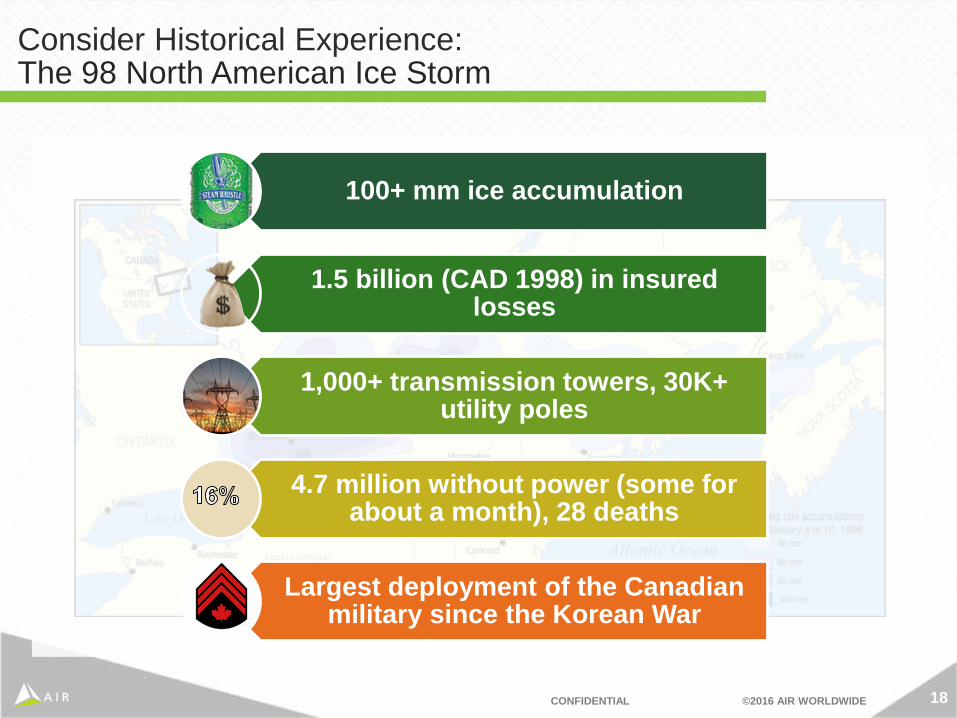
January 1998 Ice Storm in Quebec100+ mm ice accumulation
1.5 billion (CAD 1998) in insured losses
1,000+ transmission towers, 30K+ utility poles
4.7 million without power (some for about a month), 28 deaths
Largest deployment of the Canadian military since the Korean War
Consider Historical Experience:The 98 North American Ice Storm
19CONFIDENTIAL ©2016 AIR WORLDWIDE
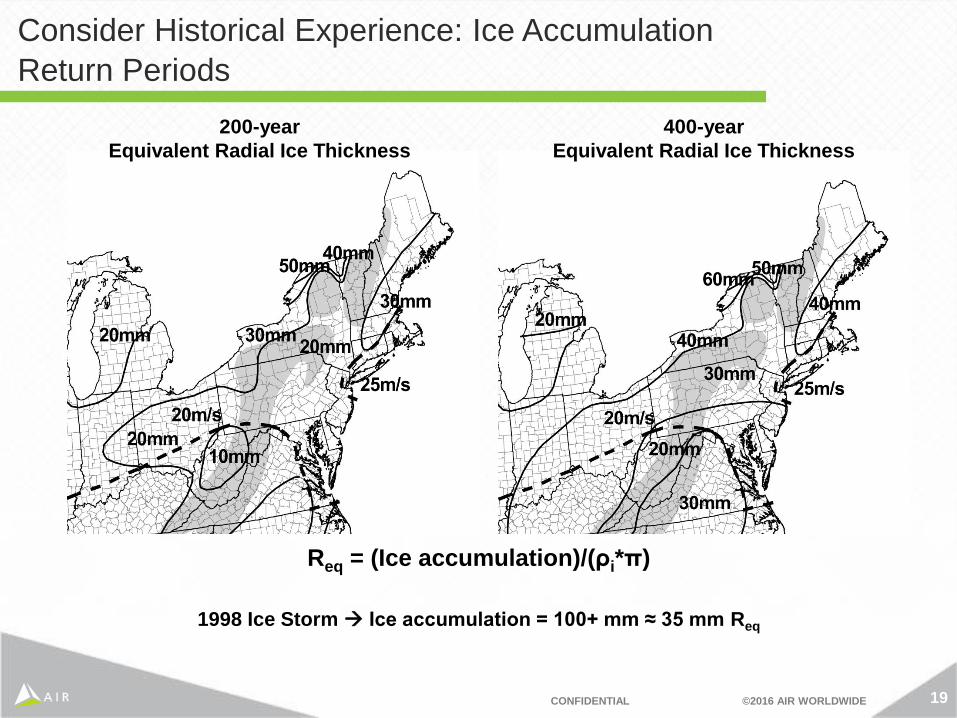
Consider Historical Experience: Ice Accumulation
Return Periods
200-year
Equivalent Radial Ice Thickness
400-year
Equivalent Radial Ice Thickness
Req = (Ice accumulation)/(ρi*π)
1998 Ice Storm Ice accumulation = 100+ mm ≈ 35 mm Req
20CONFIDENTIAL ©2016 AIR WORLDWIDE
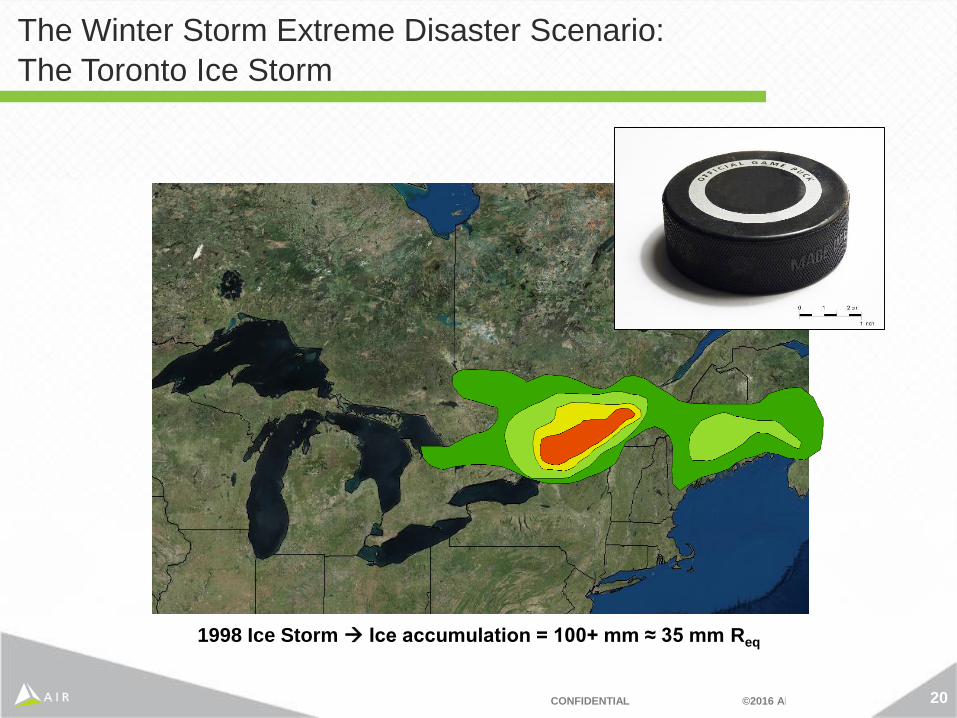
1998 Ice Storm Ice accumulation = 100+ mm ≈ 35 mm Req
The Winter Storm Extreme Disaster Scenario:
The Toronto Ice Storm

21CONFIDENTIAL ©2016 AIR WORLDWIDE
Severe Thunderstorms
22CONFIDENTIAL ©2016 AIR WORLDWIDE
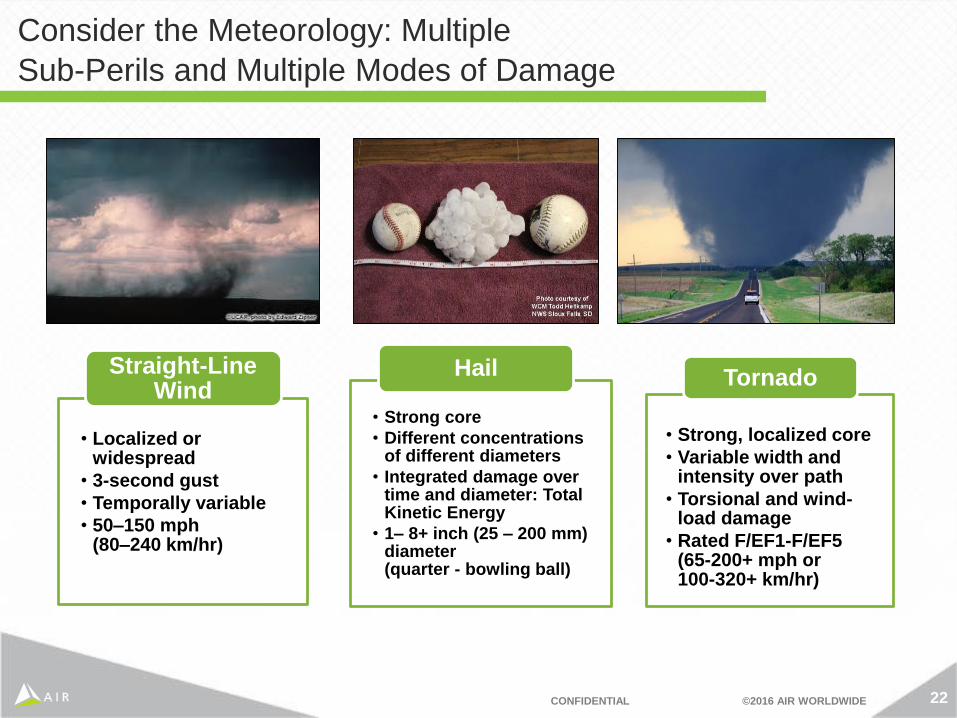
Consider the Meteorology: Multiple
Sub-Perils and Multiple Modes of Damage
• Localized or widespread
• 3-second gust
• Temporally variable
• 50–150 mph (80–240 km/hr)
Straight-Line Wind
• Strong core
• Different concentrations of different diameters
• Integrated damage over time and diameter: Total Kinetic Energy
• 1– 8+ inch (25 – 200 mm) diameter(quarter - bowling ball)
Hail
• Strong, localized core
• Variable width and intensity over path
• Torsional and wind-load damage
• Rated F/EF1-F/EF5(65-200+ mph or 100-320+ km/hr)
Tornado
23CONFIDENTIAL ©2016 AIR WORLDWIDE
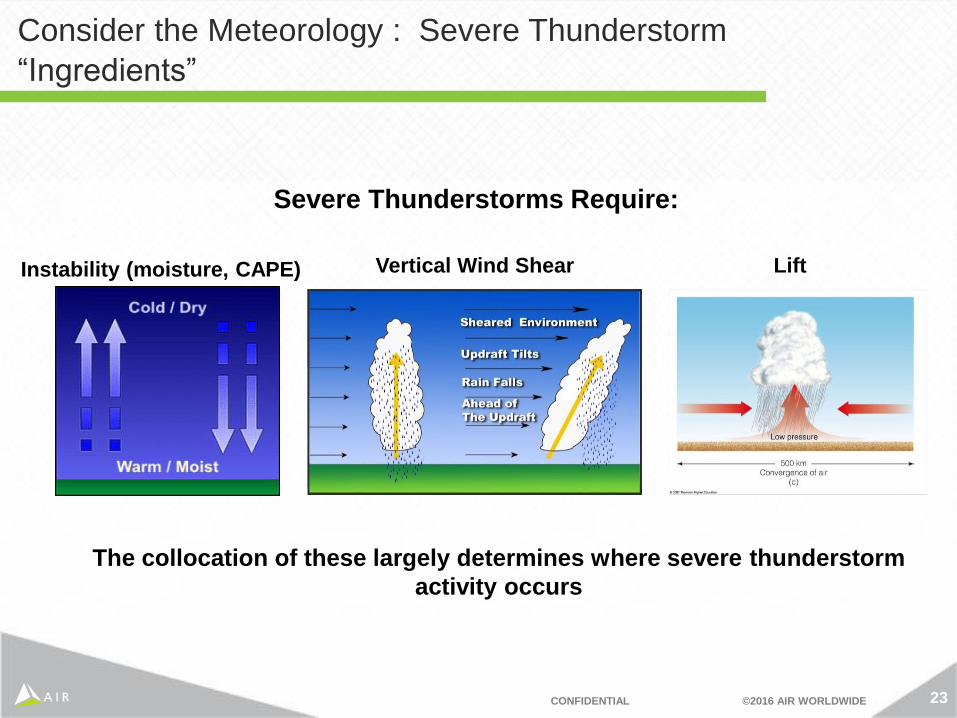
Consider the Meteorology : Severe Thunderstorm
“Ingredients”
Severe Thunderstorms Require:
Instability (moisture, CAPE) Vertical Wind Shear Lift
The collocation of these largely determines where severe thunderstorm
activity occurs
24CONFIDENTIAL ©2016 AIR WORLDWIDE
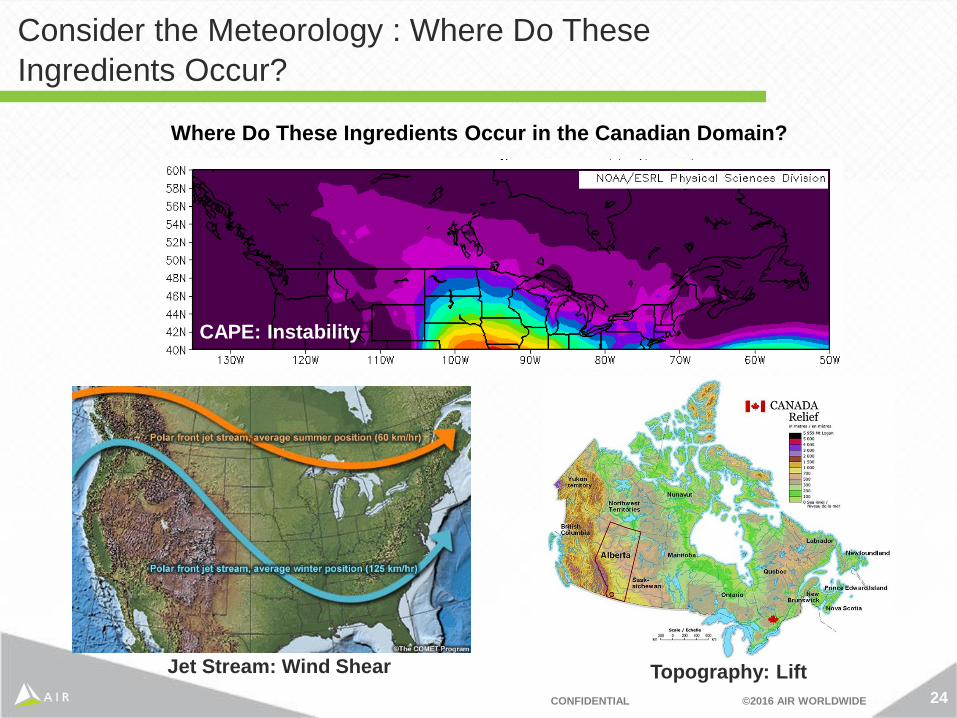
Consider the Meteorology : Where Do These
Ingredients Occur?
CAPE: Instability
Jet Stream: Wind Shear Topography: Lift
Where Do These Ingredients Occur in the Canadian Domain?
25CONFIDENTIAL ©2016 AIR WORLDWIDE
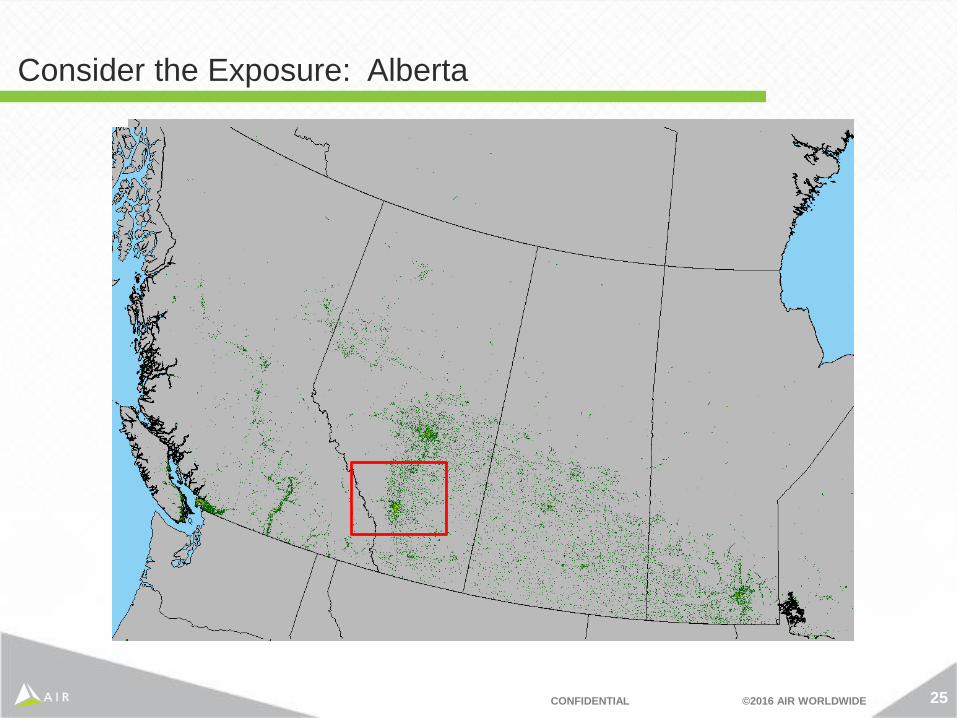
Consider the Exposure: Alberta
26CONFIDENTIAL ©2016 AIR WORLDWIDE
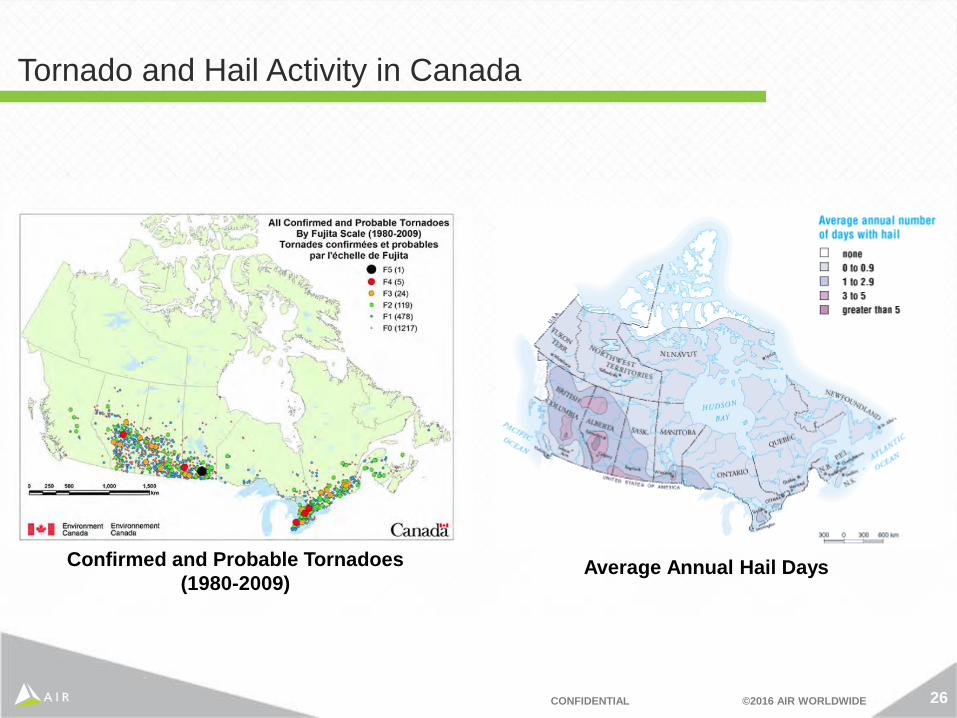
Tornado and Hail Activity in Canada
Confirmed and Probable Tornadoes
(1980-2009)Average Annual Hail Days
27CONFIDENTIAL ©2016 AIR WORLDWIDE
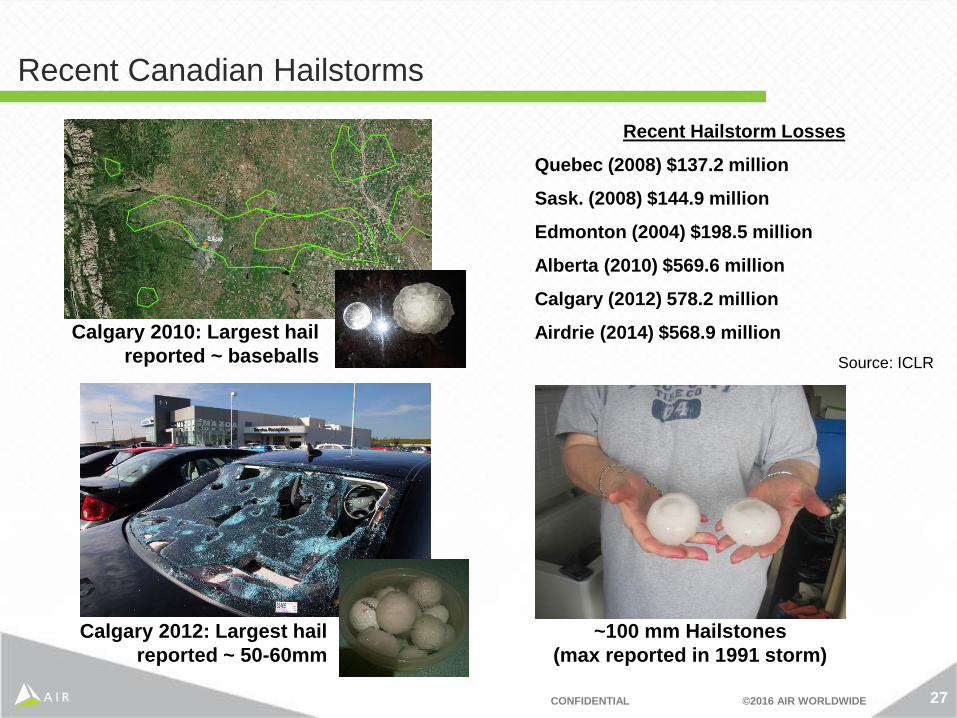
Recent Canadian Hailstorms
Recent Hailstorm Losses
Quebec (2008) $137.2 million
Sask. (2008) $144.9 million
Edmonton (2004) $198.5 million
Alberta (2010) $569.6 million
Calgary (2012) 578.2 million
Airdrie (2014) $568.9 million
Source: ICLR
Calgary 2010: Largest hail
reported ~ baseballs
Calgary 2012: Largest hail
reported ~ 50-60mm
~100 mm Hailstones
(max reported in 1991 storm)
28CONFIDENTIAL ©2016 AIR WORLDWIDE
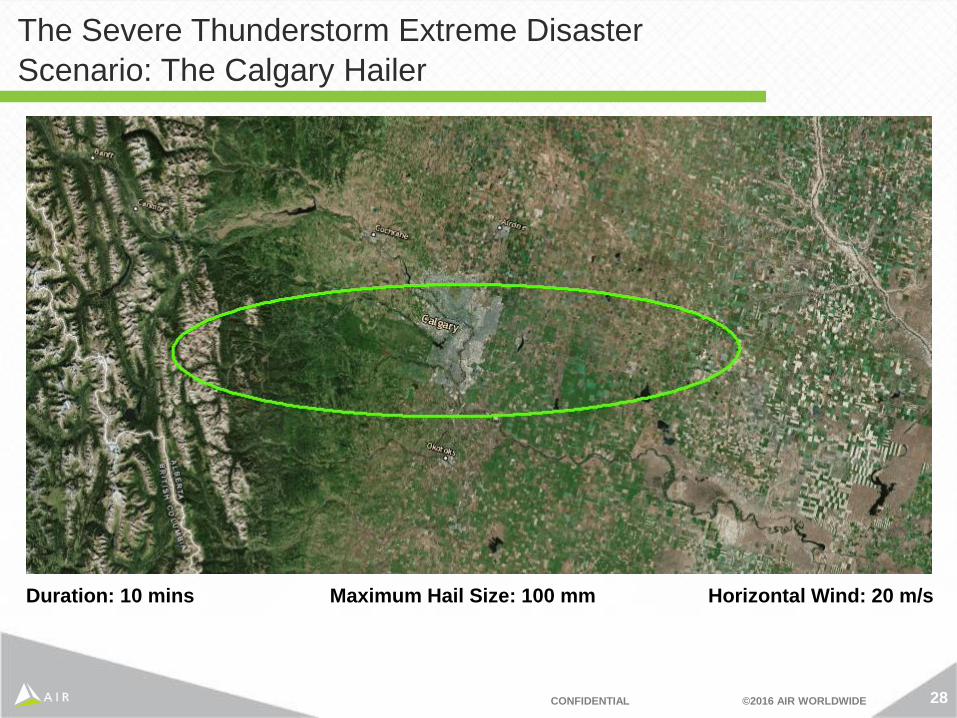
The Severe Thunderstorm Extreme Disaster
Scenario: The Calgary Hailer
Duration: 10 mins Maximum Hail Size: 100 mm Horizontal Wind: 20 m/s
29CONFIDENTIAL ©2016 AIR WORLDWIDE
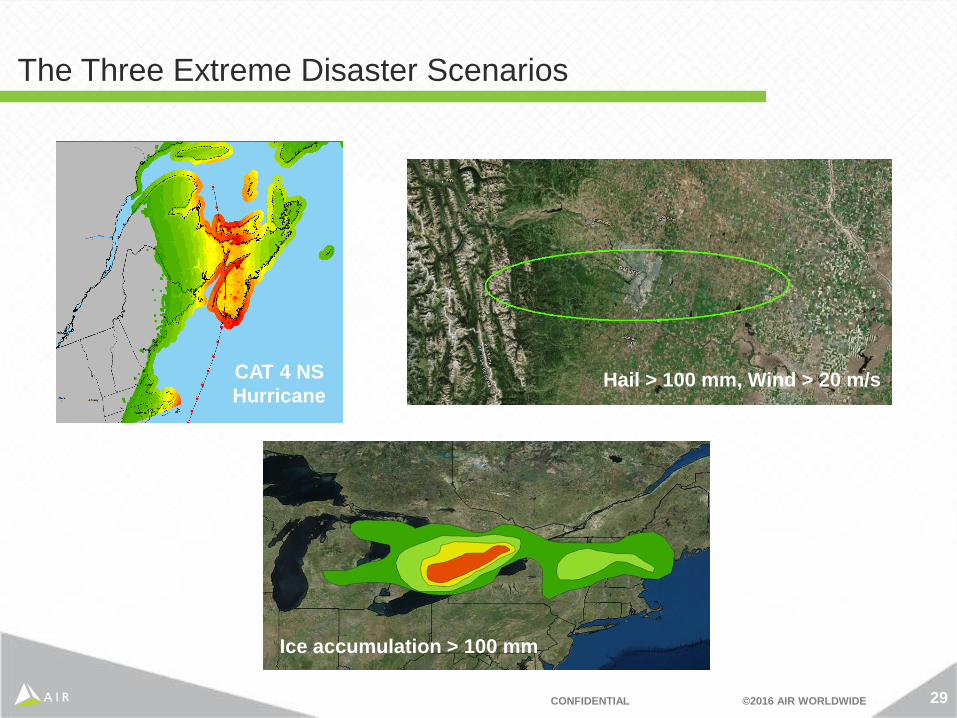
The Three Extreme Disaster Scenarios
Hail > 100 mm, Wind > 20 m/s
Ice accumulation > 100 mm
CAT 4 NS
Hurricane
30CONFIDENTIAL ©2016 AIR WORLDWIDE
Extreme Disaster Scenario
(EDS) Impacts
31CONFIDENTIAL ©2016 AIR WORLDWIDE
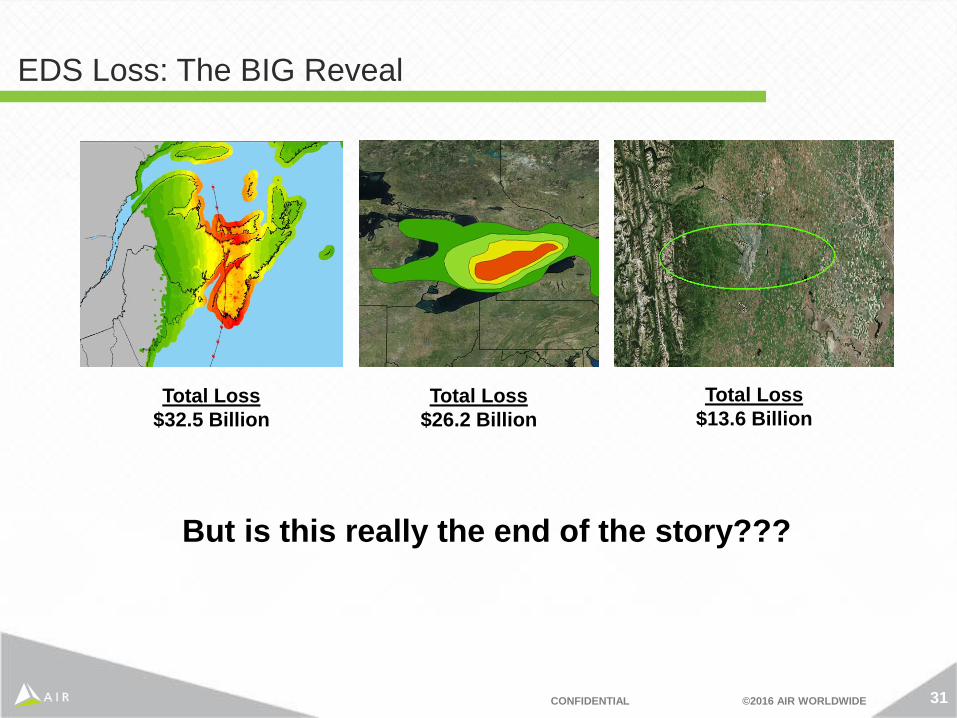
EDS Loss: The BIG Reveal
Total Loss
$32.5 Billion
Total Loss
$26.2 Billion
Total Loss
$13.6 Billion
But is this really the end of the story???
32CONFIDENTIAL ©2016 AIR WORLDWIDE
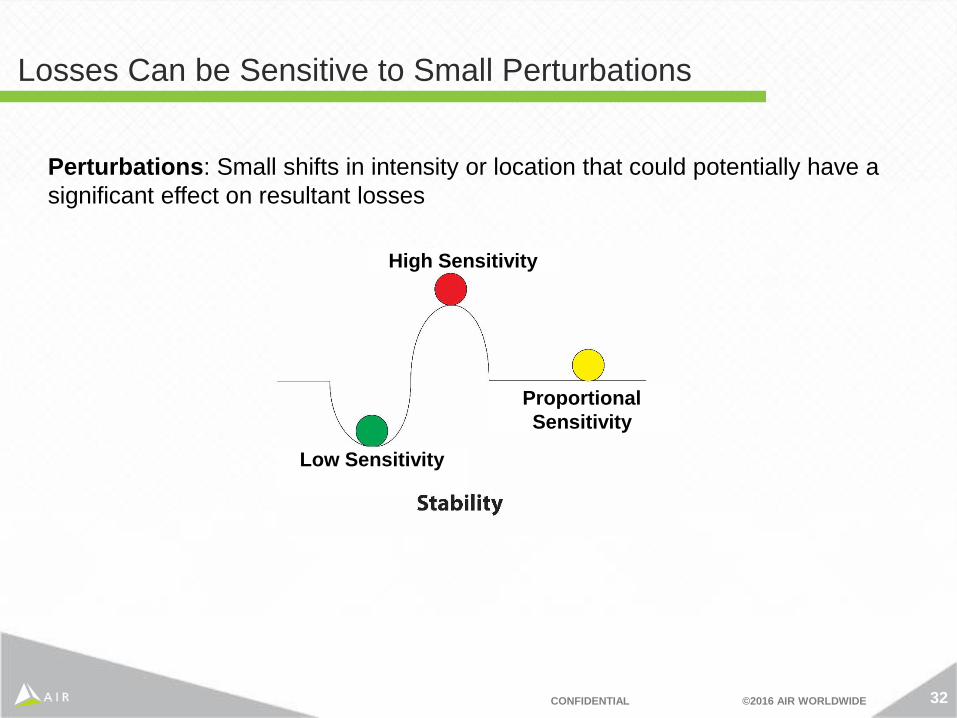
Losses Can be Sensitive to Small Perturbations
Perturbations: Small shifts in intensity or location that could potentially have a
significant effect on resultant losses
High Sensitivity
Low Sensitivity
Proportional
Sensitivity
33CONFIDENTIAL ©2016 AIR WORLDWIDE
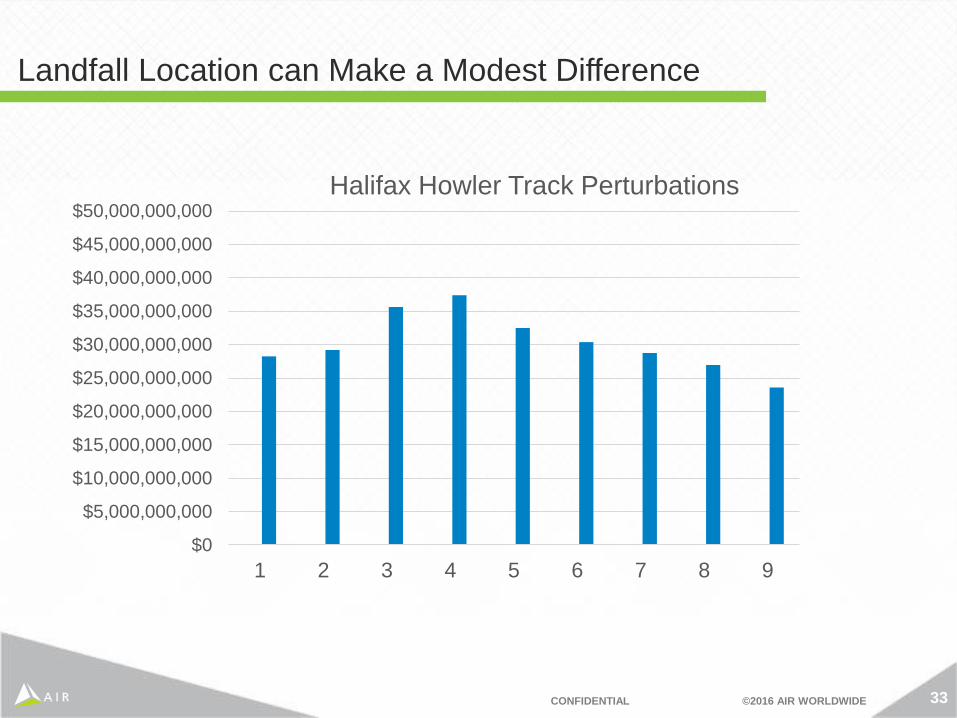
Landfall Location can Make a Modest Difference
$0
$5,000,000,000
$10,000,000,000
$15,000,000,000
$20,000,000,000
$25,000,000,000
$30,000,000,000
$35,000,000,000
$40,000,000,000
$45,000,000,000
$50,000,000,000
1 2 3 4 5 6 7 8 9
Halifax Howler Track Perturbations
34CONFIDENTIAL ©2016 AIR WORLDWIDE
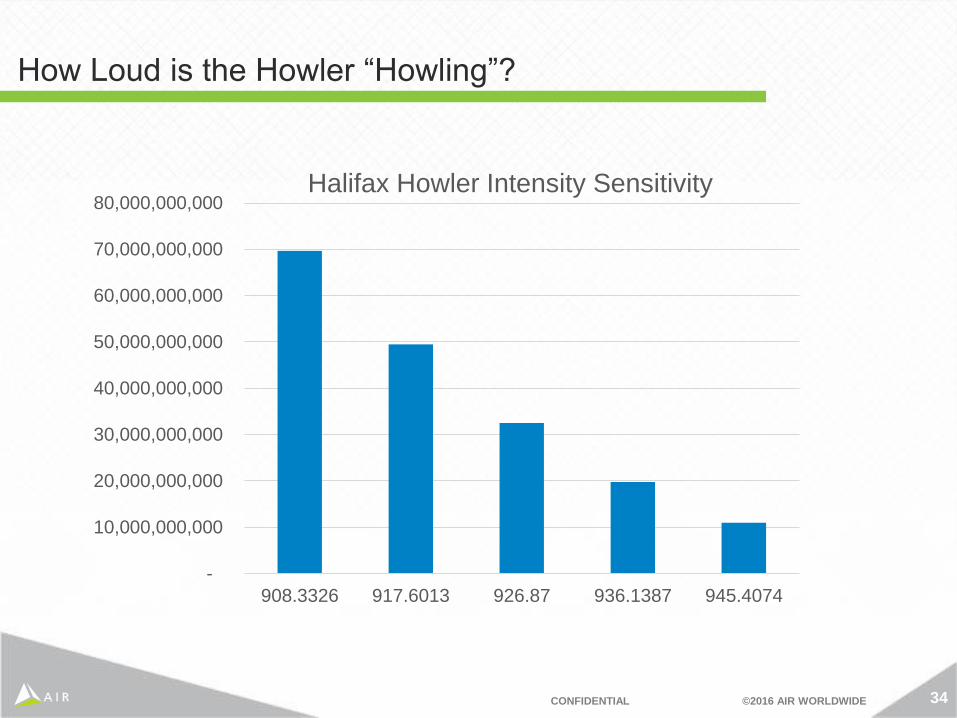
How Loud is the Howler “Howling”?
-
10,000,000,000
20,000,000,000
30,000,000,000
40,000,000,000
50,000,000,000
60,000,000,000
70,000,000,000
80,000,000,000
908.3326 917.6013 926.87 936.1387 945.4074
Halifax Howler Intensity Sensitivity
35CONFIDENTIAL ©2016 AIR WORLDWIDE
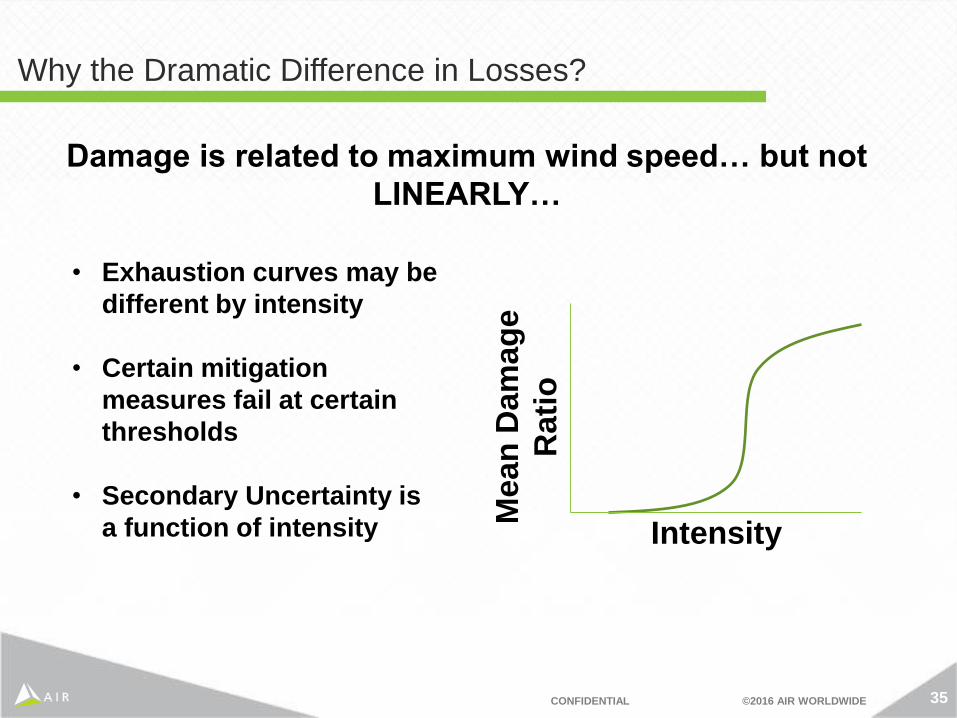
Why the Dramatic Difference in Losses?
Damage is related to maximum wind speed… but not
LINEARLY…
IntensityM
ean
Dam
ag
e
Rati
o
• Exhaustion curves may be
different by intensity
• Certain mitigation
measures fail at certain
thresholds
• Secondary Uncertainty is
a function of intensity
36CONFIDENTIAL ©2016 AIR WORLDWIDE
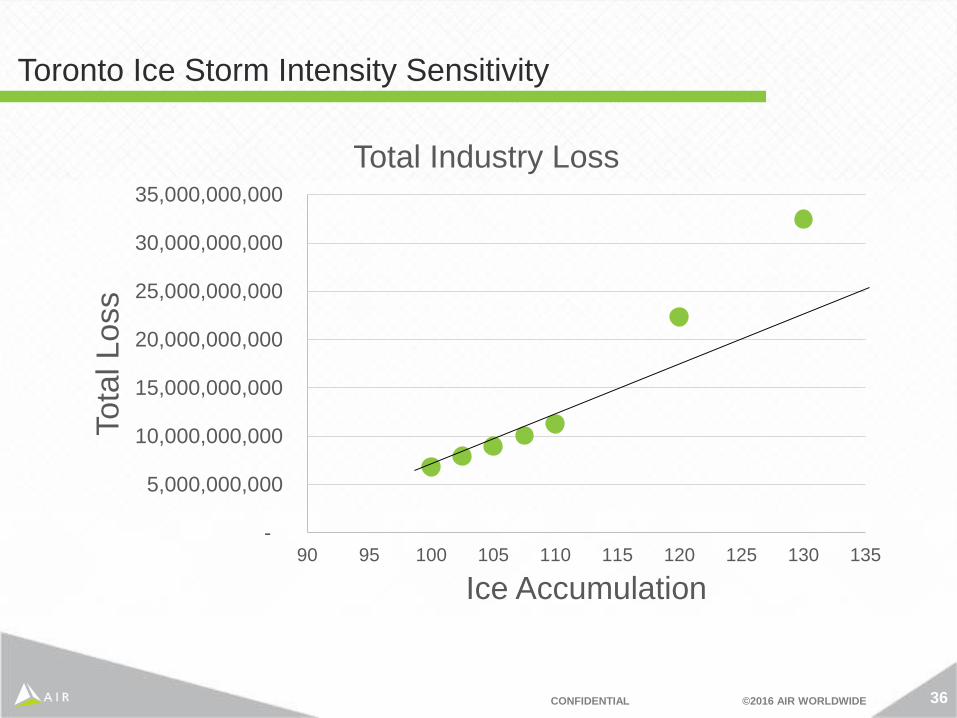
Toronto Ice Storm Intensity Sensitivity
-
5,000,000,000
10,000,000,000
15,000,000,000
20,000,000,000
25,000,000,000
30,000,000,000
35,000,000,000
90 95 100 105 110 115 120 125 130 135
Tota
l Loss
Ice Accumulation
Total Industry Loss
37CONFIDENTIAL ©2016 AIR WORLDWIDE
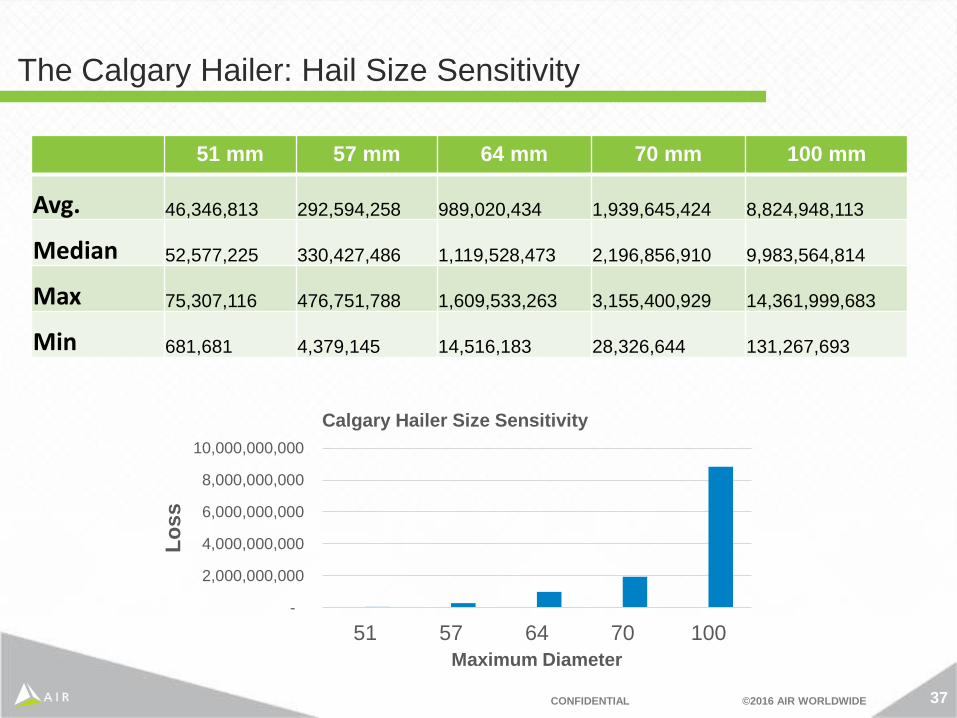
The Calgary Hailer: Hail Size Sensitivity
51 mm 57 mm 64 mm 70 mm 100 mm
Avg. 46,346,813 292,594,258 989,020,434 1,939,645,424 8,824,948,113
Median 52,577,225 330,427,486 1,119,528,473 2,196,856,910 9,983,564,814
Max 75,307,116 476,751,788 1,609,533,263 3,155,400,929 14,361,999,683
Min 681,681 4,379,145 14,516,183 28,326,644 131,267,693
-
2,000,000,000
4,000,000,000
6,000,000,000
8,000,000,000
10,000,000,000
51 57 64 70 100
Lo
ss
Maximum Diameter
Calgary Hailer Size Sensitivity
38CONFIDENTIAL ©2016 AIR WORLDWIDE
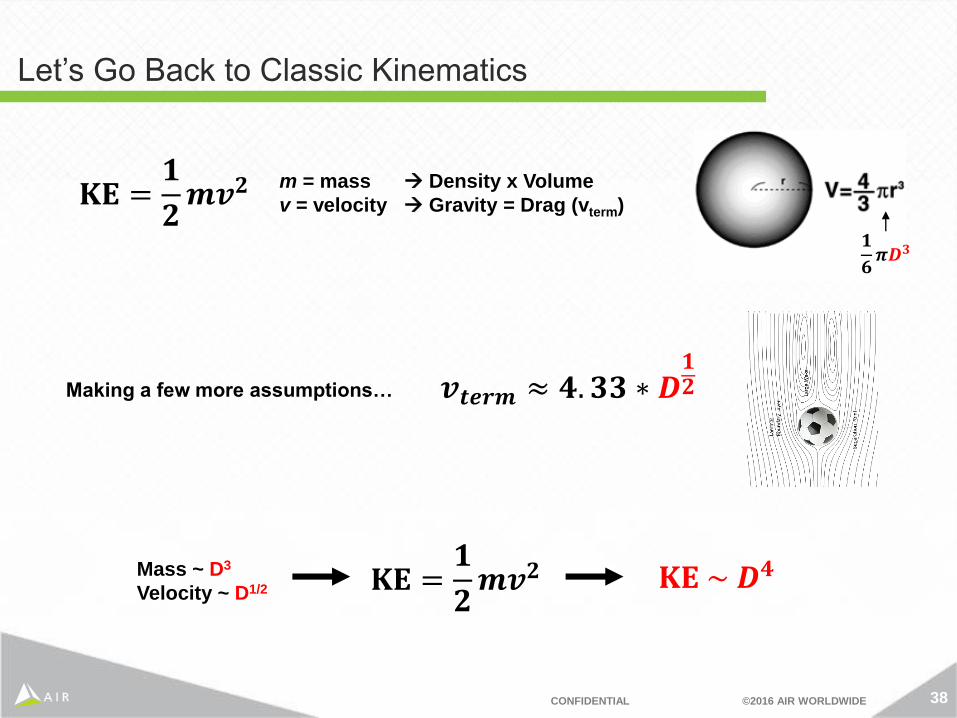
Let’s Go Back to Classic Kinematics
Making a few more assumptions… 𝒗𝒕𝒆𝒓𝒎 ≈ 𝟒. 𝟑𝟑 ∗ 𝑫𝟏𝟐
𝐊𝐄 ~ 𝑫𝟒Mass ~ D3
Velocity ~ D1/2 𝐊𝐄 =𝟏
𝟐𝒎𝒗𝟐
𝐊𝐄 =𝟏
𝟐𝒎𝒗𝟐
m = mass Density x Volume
v = velocity Gravity = Drag (vterm)
𝟏
𝟔𝝅𝑫𝟑
39CONFIDENTIAL ©2016 AIR WORLDWIDE
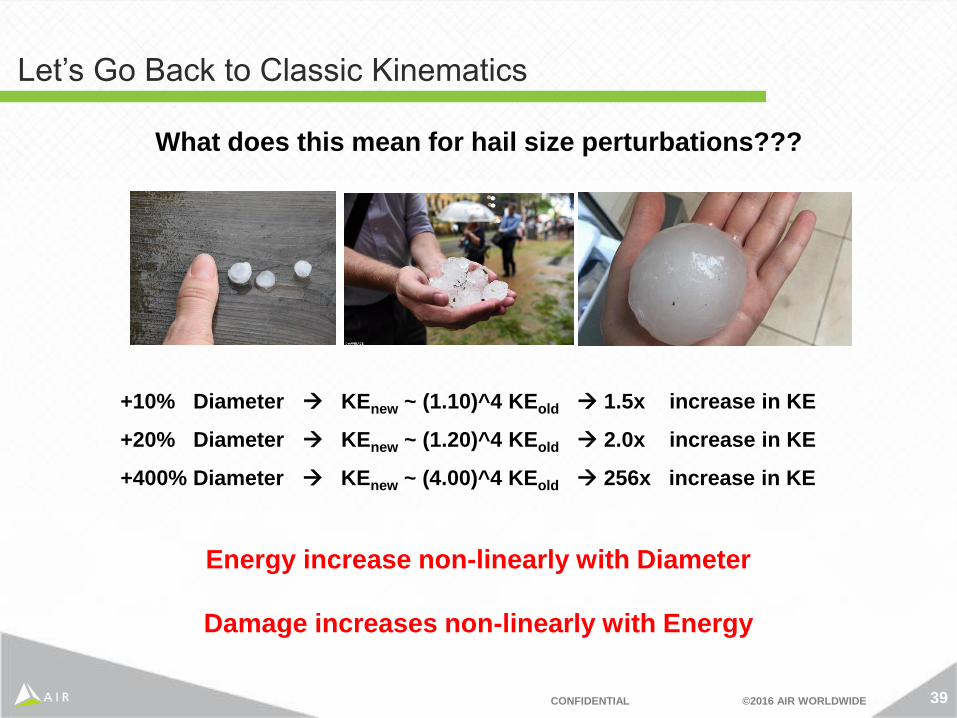
Let’s Go Back to Classic Kinematics
+10% Diameter KEnew ~ (1.10)^4 KEold 1.5x increase in KE
+20% Diameter KEnew ~ (1.20)^4 KEold 2.0x increase in KE
+400% Diameter KEnew ~ (4.00)^4 KEold 256x increase in KE
What does this mean for hail size perturbations???
Energy increase non-linearly with Diameter
Damage increases non-linearly with Energy
40CONFIDENTIAL ©2016 AIR WORLDWIDE
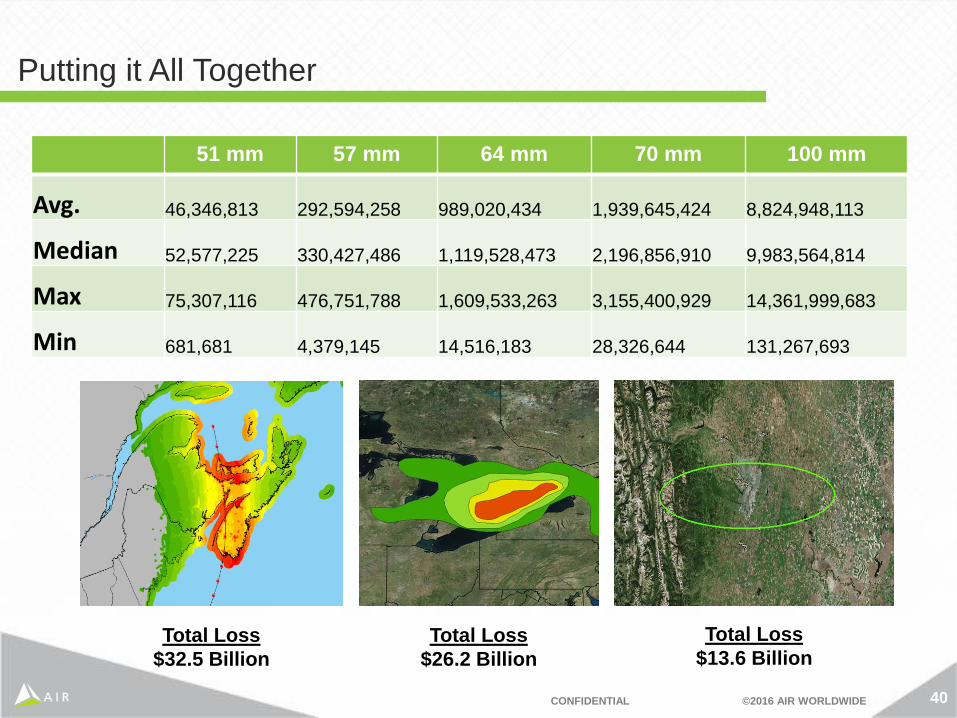
Putting it All Together
51 mm 57 mm 64 mm 70 mm 100 mm
Avg. 46,346,813 292,594,258 989,020,434 1,939,645,424 8,824,948,113
Median 52,577,225 330,427,486 1,119,528,473 2,196,856,910 9,983,564,814
Max 75,307,116 476,751,788 1,609,533,263 3,155,400,929 14,361,999,683
Min 681,681 4,379,145 14,516,183 28,326,644 131,267,693
Total Loss
$32.5 Billion
Total Loss
$26.2 Billion
Total Loss
$13.6 Billion
41CONFIDENTIAL ©2016 AIR WORLDWIDE
- Every generation has it’s “Scenario that won’t ever happen”, which inevitably happens
- Robust risk management demands the examination of these events, even if their probability is very low
- Proper evaluation of the meteorology and historical experience can assist in evaluating the feasibility of these extreme scenarios
- The sensitivity (hence uncertainty) of a given event can vary greatly depending on the peril and parameter of interest.
What this Means for Risk Management

42CONFIDENTIAL ©2016 AIR WORLDWIDE
Questions?
Eric Robinson, Senior Scientist, Manager
AIR Worldwide
@DrCATModel