icici prudential pms value portfolio · •contrarian investing: a contrarian investor enters the...
TRANSCRIPT

All data/information used in the preparation of this material is dated and may or may not be relevant any time after the issuance of this material. ICICI Prudential Asset Management Company Limited (the
Portfolio Manager/ the AMC) takes no responsibility of updating any data/information in this material from time to time. The recipient of this material is solely responsible for any action taken based on this
material. The information contained herein are strictly confidential and are meant solely for the benefit of the addressee and shall not be altered in any way, transmitted to, copied or distributed, in part or in
whole, to any other person or to the media or reproduced in any form, without prior written consent of the AMC. Further, the information contained herein should not be construed as forecast or promise.
Past performance of the Portfolio Manager may not be indicative of the performance in the future. Please refer to page 16 & 17 for risk factors and disclaimers
ICICI Prudential PMS Value Portfolio
“A series under Deep Value Portfolio”

Global Indices Performance – India surges ahead
• Indian markets rose by 7.8%
on the back of increased FII
flows to the tune of Rs. 33,116
Crs
• With China markets
experiencing a slowdown last
year, the economy is gradually
reviving owing to monetary
expansion policies and heavy
infrastructure investments
thus aiding growth
Germany - DAX Index; China - SSE Composite Index; France - CAC 40 Index; Japan - Nikkei; Eurozone - Euronext 100; Hong Kong - HangSeng; US - Dow Jones; Singapore - Strait Times; Russia - RTS Index; Indonesia - Jakarta Composite Index; U.K. - FTSE; South
Korea - Kospi; Brazil - Ibovespa Sao Paulo Index; Indonesia – Jakarta Composite Index; Switzerland – Swiss Market Index; Taiwan – Taiwan Stock Exchange Corporation; India – S&P BSE Sensex; Returns in % terms. Data Source: MFI; Returns are absolute returns for
the PRI variant of the index calculated between Feb 28, 2019 – March 29, 2019. Past performance may or may not be sustained in future
7.8
5.1
2.9 2.8 2.3 2.1
1.5 0.9 0.8
0.4 0.1 0.0 0.0
-0.2 -0.8
-2.5 -4
-2
0
2
4
6
8
10
India
Chin
a
UK
Taiw
an
Europe
Fran
ce
Hong K
ong
Sw
itzerla
nd
Russia
Indo
nesia
Germ
any
US
Sin
gapore
Brazil
Japan
South K
orea
Returns (
%)
Returns Performance - March 2019

Sectoral Indices Performance
All indices are of S&P BSE and carry the prefix of S&P BSE; Abbreviated CD - S&P BSE Consumer Durables; CG - S&P BSE Capital Goods; FMCG - S&P BSE Fast Moving Consumer Goods; HC - S&P BSE Health Care; Infra. - S&P BSE India Infrastructure; IT - S&P
BSE Information Technology, NBFC – Non-banking Finance Companies. Data Source: MFI; Returns are absolute returns for the PRI variant of the index calculated between Feb 28, 2019 – Mar 31, 2019; Past performance may or may not be sustained in future
NPA: Non Performing Assets. The Stock(s)/Sector(s) mentioned in this material do not constitute any recommendation of the same and portfolio may or may not have any future positions in these stock(s)/Sector(s).
• Majority sectors ended
on a positive note
• Banking outperformed
on the back of NPA
issues moderating and a
strong earnings outlook
15.7
13.7 12.8 12.6
11.4 11.3 10.9 10.9
8.4 8.1
5.5 4.7
4.1 3.4
0.2 0.1
0
2
4
6
8
10
12
14
16
18R
ealt
y
Ban
kex
In
fra
Fin
an
ce
CD
Po
wer
Energy
Oil &
Gas
Basic
Materia
ls
CG
Metal
HC
Tele
com
FM
CG IT
Au
to
Returns (
%)
Returns Performance - March 2019

RESERVE BANK OF INDIA
• India’s GDP growth estimates for FY 2018-19 revised
downwards to 7.0% from 7.2% earlier
• RBI cut repo rates by 25 bps to 6.0% to support
growth and meet inflation target of 4%
Global Growth Concerns
Uncertainty about growth weighed on the minds of central banks everywhere resulting in them adopting a cautious stance.
US FEDERAL RESERVE BANK
• The Fed lowered its GDP
growth forecast (2.1% to
2.3% earlier for 2019) &
inflation expectations
• Adopted a dovish stance of
not hiking rates further in
2019
EUROPEAN CENTRAL BANK
• Weakening economic data
points to a sizeable
moderation in pace of
economic expansion &
underlying inflation continues
to be muted
• Interest Rates to remain
unchanged throughout 2019
Source: RBI, European Central Bank, US Federal Reserve Monetary Policy Meet Minutes

Growth Numbers
Change in US Fed Stance and Opinion Poll Comfort led to record FPI flows (best since March-16). Going forward, FPI
flows could get volatile depending on stability of the new government and Global Central Bank Policies
Source: SEBI, BSE, CDSL, Morgan Stanley Research; Data as of March 31, 2019. FPI: Foreign Portfolio Investor.
21,143
-18,244
30,906
11,654
-28,921
33,981
-40,000
-30,000
-20,000
-10,000
0
10,000
20,000
30,000
40,000
Mar-16
Sep-16
Mar-17
Sep-17
Mar-18
Sep-18
Mar-19
FP
I F
low
s (
In I
NR
Crs.)
FPI Equity Flows (INR Crs)

What is Value Investing?
The Portfolio features as stated herein is only indicative in nature and is subject to change within the provisions of the disclosure document and client agreement without any prior notice to
investors. Please refer to the disclosure document & client agreement for details and risk factors.
• The most common definition for Value Investing is “Under valued companies currently out of
favour with potential to realize value in future”
• We define Value Investing as “Good business at reasonable / attractive price” and not mediocre
business at a bargain price
The core investment philosophy of value investing is based on the belief that
• Stocks cannot continue to quote at values that are significantly below their fair values over the
long term;
• At some point in time, the markets are likely to recognize the extent of under-valuation of these
companies.
The same could lead to a rerating/appreciation in the company ’s stock price.
We believe that Value Stocks are available at all point of time.
Value Investing

The Investments in ICICI Prudential PMS Value Portfolio are targeted at investments for a long term horizon in companies which have
potential for capital appreciation. The portfolio follows a bottom-up approach, and aims at capturing special situations and contrarian
calls.
A diversified Portfolio, which endeavors to generate capital gains over the long term, by investing in a diversified portfolio of
significantly undervalued stocks.
The core investment philosophy of value investing is based on the belief that stocks cannot continue to quote at values that are
significantly below their fair values over the long term. At some point in time, the markets are likely to recognize the extent of
undervaluation of these companies. The same could lead to a rerating/appreciation in the company’s stock price.
About the Portfolio
A focused portfolio of 20-25 ideas, biased towards Mid-Caps
Key Features
3 Years & Above
INR 25,00,000 (25 lacs)
S&P BSE Mid-Cap
Investment Horizon
Benchmark Index
Minimum Investment Amount
The Portfolio features as stated herein is only indicative in nature and is subject to change within the provisions of the disclosure document and client agreement without any prior notice to
investors. Please refer to the disclosure document & client agreement for details and risk factors.

Identifying Undervalued Securities
Finding Securities Considered To Be
Temporarily Undervalued
Determining
Economic
Value of the
Firm
Contrarian
Philosophy
Not
Following
the Herd
Analysing
reasons for
Stock selling
lower than its
Economic
Value
Comparison
with the
current
market price
1
2
3
4
5
The process of identification of undervalued securities mentioned above are only indicative. There may be other processes to identify such securities.

Understanding Value Investing
•SOTP (Sum of Parts Valuation): The sum-of-parts valuation is a process of valuing a company by
determining what its aggregate divisions would be worth if it was spun off or acquired by another company.
The valuation provides a range of values for a company's equity by aggregating the standalone value of each
of its business units and arriving at a single total enterprise value.
•Contrarian Investing: A contrarian investor enters the market when others are feeling negative about it and
the value is lower than its intrinsic value. When there is an overarching pessimistic sentiment on a stock, it
has the possibility of lowering the price so low, the downfalls and risks of the company's stock are
overblown. Figuring out which distressed stocks to buy and selling them once the company recovers, thus
boosting the stock value, is the major play for contrarian investors.
•Special Situation: A special situation refers to particular circumstances involving a security that would
compel investors to trade the security based on the special situation, rather than the underlying
fundamentals of the security or some other investment rationale. An investment made due to a special
situation is typically an attempt to profit from a change in valuation as a result of the special situation, and is
generally not a long term investment.

Investment Approach
Investment Process
Stock Picking Parameters Investment Decision
Characteristics Risk & Reward
Financial Strength
Business Durability
Management Behavior
Back your
convictions with
substantial
positions
Valuations
The investment process mentioned above are only indicative. There may be other processes for investment decision.

The Stock(s)/Sector(s) mentioned in this material do not constitute any recommendation of the same and the portfolios may or may not have any future positions in these Stock(s)/Sector(s).
Data as on 29th
Mar, 2019.
Current Positioning
Well diversified Portfolio across market cap.
Top 10 Holdings
Stocks % to Net Assets
NTPC Ltd 8.73
S. P. Apparels Ltd 5.23
Gujarat Pipavav Port Ltd 4.61
Amber Enterprises India Ltd 4.58
Bajaj Holdings and Investment Ltd 4.47
The Karnataka Bank Ltd 4.40
SJVN Ltd 3.62
Vardhman Textiles Ltd 3.62
Wonderla Holidays Limited 3.55
Vedanta Ltd 3.49
Market Capitalization Break-up
The data mentioned above is of a benchmark client and data of an individual client may vary significantly from the above.
Large
Cap,
29.3%
Mid Cap,
21.6%
Small
Cap,
49.1%
Top 10 holdings constitutes 46.28% of the portfolio.
Portfolio is invested in 35 stocks.
The Stock(s)/Sector(s) mentioned in this material do not constitute any recommendation of the same and the portfolios may or may not have any
future positions in these Stock(s)/Sector(s). Data as on 29th
Mar, 2019. Past performance may or may not be sustained in future.
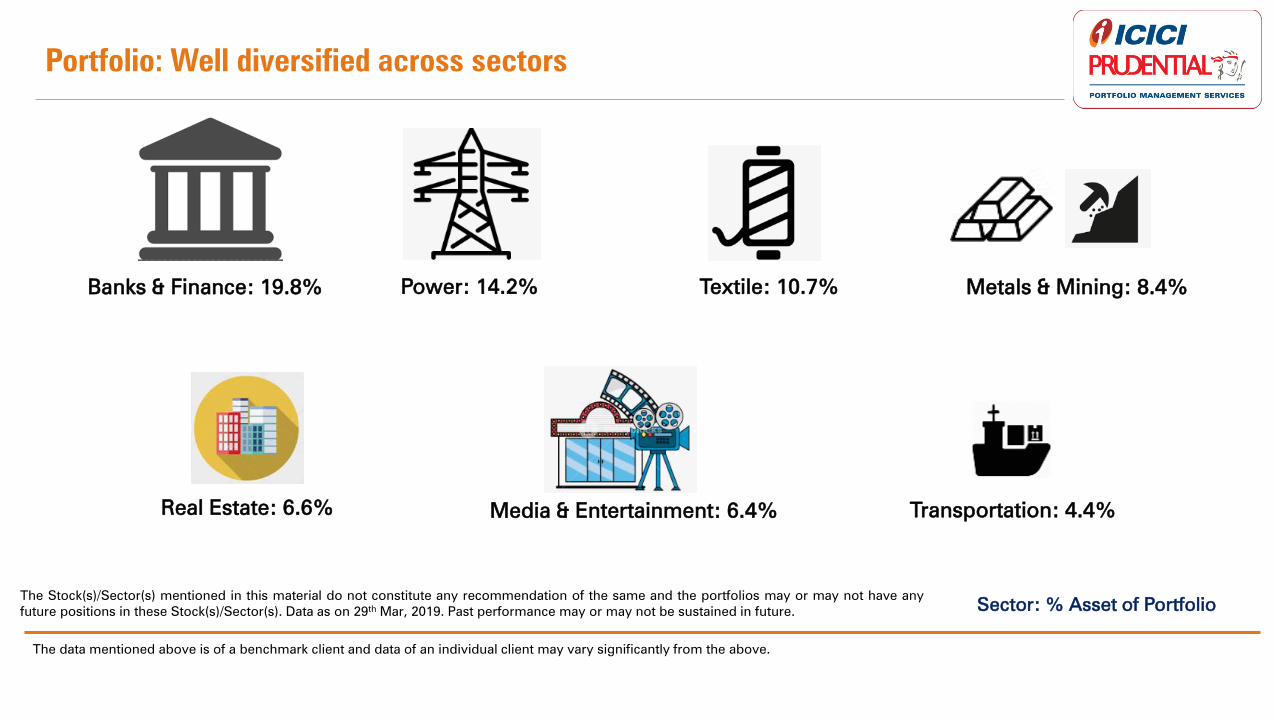
Portfolio: Well diversified across sectors
Sector: % Asset of Portfolio
Banks & Finance: 19.8% Metals & Mining: 8.4% Textile: 10.7%
Media & Entertainment: 6.4%
Power: 14.2%
Transportation: 4.4%
The data mentioned above is of a benchmark client and data of an individual client may vary significantly from the above.
Real Estate: 6.6%

PE: Price to Earning. PB: Price to book, P/S: Price to Sales, P/C: Price to Cash. The Stock(s)/Sector(s) mentioned in this material do not constitute any recommendation of the same and the portfolios may or
may not have any future positions in these Stock(s)/Sector(s). Data as on 29th
Mar, 2019. Past performance may or may not be sustained in future.
Portfolio Statistics
No of Stocks: 35
Top 5 Sectors: 57%
Top 10 holdings: 46%
Avg. PE Ratio: 14.18 Avg. PB Ratio: 1.47
Valuation Parameters
Avg. P/S Ratio: 1.54 Avg. P/C Ratio: 8.74
Top 10 Sector Exposure
The data mentioned above is of a benchmark client and data of an individual client may vary significantly from the above.
2.1%
2.8%
3.8%
4.4%
6.4%
6.6%
8.4%
10.7%
14.2%
19.8%
Telecom
Cement
Chemicals
Transportation
Media & Entertainment
Real Estate
Metals & Mining
Textiles
Power
Banks & Finance
Portfolio is invested around 80% in top 10
sectors. Portfolio is also holding 9.57% in cash
and equivalents.

-
1,00,00,000
2,00,00,000
3,00,00,000
4,00,00,000
5,00,00,000
6,00,00,000
7,00,00,000
8,00,00,000
9,00,00,000
10,00,00,000
11,00,00,000
12,00,00,000
ICICI Prudential PMS Value Portfolio S&P BSE Midcap
Value rebased to INR 10000000. Data as on 29th
Mar, 2019. Past performance may or may not be sustained in future. The return mentioned above is the return of the oldest client of the portfolio. Further,
the portfolio value is re-based as and when applicable.
Portfolio Performance
Rs.6,59,10,831
Rs.10,37,88,761
The portfolio performance mentioned above is of benchmark client and the performance of an individual clients may vary significantly from the above.

Data as on 29th
Mar, 2019. Past performance may or may not be sustained in future. Calendar year return in absolute terms. Return upto 1 year in Absolute terms and above 1 year are in CAGR terms.
Portfolio Performance
2018 2017 2016 2015 2014 2013 2012
ICICI Prudential PMS Value Portfolio -8.90 40.71 -3.48 2.98 88.98 11.24 39.20
S&P BSE Midcap -13.38 48.13 7.97 7.43 54.69 -5.73 38.52
Calendar Year Performance
1 Year 2 Year 3 Year 4 Year 5 Year
ICICI Prudential PMS Value Portfolio 3.01 9.55 14.26 7.75 18.33
S&P BSE Midcap -3.03 4.79 13.39 9.95 16.93
Portfolio Performance
Calendar year return in absolute terms.
The portfolio performance mentioned above is of benchmark client and the performance of an individual clients may vary significantly from the above.

An Irrational
Market
Sentiment
Risk Factors & Disclaimers
Investing in securities involves certain risks and considerations associated generally with making investments in securities. The value of the portfolio investments may be affected
generally by factors affecting financial markets, such as price and volume, volatility in interest rates, currency exchange rates, changes in regulatory and administrative policies of the
Government or any other appropriate authority (including tax laws) or other political and economic developments. Consequently, there can be no assurance that the objective of the
Portfolio would be achieved. The value of the portfolios may fluctuate and can go up or down. The Stock(s)/Sector(s) mentioned in this material do not constitute any
recommendation of the same and the portfolios may or may not have any future positions in these Stock(s)/Sector(s).
The composition of the portfolio is subject to changes within the provisions of the disclosure document. The benchmark of the portfolios can be changed from time to time in the
future. The inability of the Portfolio Manager to make intended securities purchases due to settlement problems could cause the portfolio to miss certain investment opportunities. By
the same rationale, the inability to sell securities held in the portfolio due to the absence of a well-developed and liquid secondary market for securities would result, at times, in
potential losses to the portfolio. Please note that past performance of the financial products, instruments and the portfolio does not necessarily indicate the future prospects and
performance thereof. Such past performance may or may not be sustained in future. Portfolio Manager’s investment decisions may not be always profitable, as actual market
movements may be at variance with anticipated trends. The investors are not being offered any guaranteed or assured returns. The AMC may be engaged in buying/selling of such
securities. Please refer to the Disclosure Document and Client Agreement for portfolio specific risk factors.
Individual returns of Clients for a particular portfolio type may vary significantly from the data on performance of the portfolios as may be depicted by the Portfolio Manager from
time to time. This is due to factors such as timing of entry and exit, timing of additional flows and redemptions, individual client mandates, specific portfolio construction
characteristics or structural parameters, which may have a bearing on individual portfolio performance. No claims may be made or entertained for any variances between the
performance depictions and individual portfolio performance. Neither ICICI Prudential Asset Management Company Ltd. (the AMC) nor its Directors, Employees or Sponsors shall be
in any way liable for any variations noticed in the returns of individual portfolios.
The Client shall not make any claim against the Portfolio Manager against any losses (notional or real) or against any loss of opportunity for gain under various PMS Products, on
account of or arising out of such circumstance/ change in market condition or for any other reason which may specifically affect a particular sector or security.

An Irrational
Market
Sentiment
Risk Factors & Disclaimers
The Portfolio Manager shall have the sole and absolute discretion to invest in respect of the Client’s investment in any type of security subject to the Agreement and as stated in the
Disclosure Document and make such changes in the investments and invest some or all of the Client’s investment amount in such manner and in such markets as it deems fit would
benefit the Client. The Portfolio Manager’s decision (taken in good faith) in deployment of the Clients’ account is absolute and final and can never be called in question or be open to
review at any time during the currency of the agreement or any time thereafter except on the ground of malafide, fraud, conflict of interest or gross negligence. This right of the
Portfolio Manager shall be exercised strictly in accordance with the relevant Acts, rules and regulations, guidelines and notifications in force from time to time.
By their nature, certain market risk disclosures are only estimates and could be materially different from what actually occurs in the future. As a result, actual future gains or losses
could materially differ from those that have been estimated. The recipient(s) alone shall be fully responsible/are liable for any decision taken on the basis of this material. All recipients
of this material should before dealing and/or transacting in any of the products referred to in this material make their own investigation, seek appropriate professional advice. The
investments discussed in this may not be suitable for all investors. Financial products and instruments are subject to market risks and yields may fluctuate depending on various
factors affecting capital/debt markets. There is no assurance or guarantee that the objectives of the portfolio will be achieved. Please note that past performance of the financial
products, instruments and the portfolio does not necessarily indicate the future prospects and performance thereof. Such past performance may or may not be sustained in future.
Portfolio Manager’s investment decisions may not be always profitable, as actual market movements may be at variance with anticipated trends. The investors are not being offered
any guaranteed or assured returns.
In the preparation of this material the AMC has used information that is publicly available, including information developed in-house. Some of the material used herein may have
been obtained from members/persons other than the AMC and/or its affiliates and which may have been made available to the AMC and/or to its affiliates. Information gathered and
material used herein is believed to be from reliable sources. The AMC however does not warrant the accuracy, reasonableness and/or completeness of any information. For data
reference to any third party in this material no such party will assume any liability for the same. We have included statements/opinions/recommendations in this material, which
contain words, or phrases such as “will”, “expect”, “should”, “believe” and also PE ratios, EPS and Earnings Growth for forthcoming years and similar expressions or variations of
such expressions, that are “forward looking statements”. Actual results may differ materially from those suggested by the forward looking statements due to risk or uncertainties
associated with our expectations with respect to, but not limited to, exposure to market risks, general economic and political conditions in India and other countries globally, the
monitory and interest policies of India, inflation, unanticipated turbulence in interest rates, foreign exchange rates, equity prices, the performance of the financial markets in India and
globally, changes in domestic and foreign laws, regulations and taxes and changes in competition in the industry.
All data/information used in the preparation of this material is dated and may or may not be relevant any time after the issuance of this material. The Portfolio Manager/ the AMC
takes no responsibility of updating any data/information in this material from time to time. The Portfolio Manager/ the AMC (including its affiliates), and any of its officers directors,
personnel and employees, shall not liable for any loss, damage of any nature, including but not limited to direct, indirect, punitive, exemplary, consequential, as also any loss of profit
in any way arising from the use of this material in any manner

Thank You