icici group: strategy and performance meet/132174_20090201.pdf · icici bank: strategic response to...
TRANSCRIPT

ICICI Group: Strategy and Performance
February 2009

2
Agenda
Market developments & our response
Financial performance
Long term opportunities & strategy

3
India: current economic scenarioSharp decrease in inflation from a peak of 12.9% to 5.6% with expectations of further decreaseAggressive monetary easing by RBI
CRR decreased by 400 bps, SLR decreased by 100 bpsRepo rate decreased by 350 bps, Reverse repo rate decreased by 200 bps
Two rounds of fiscal stimulus announced by the governmentHowever, risks remain due to slowdown in economic activity
Corporate profitability adversely impacted due to build up of inventory

4
System liquidity, credit and depositsComfortable systemic liquidity and decline in interest rates
Reduction in retail deposit & lending rates by banksWholesale deposit rates declined from 12.0% at end Sep to 8.0%-8.5% currently
Non-food credit growth moderated from 23% (YTD annualised) at end-Nov 2008 to 15% at mid-Jan 2009Deposit growth moderated from 21% (YTD annualised) at end-Nov 2008 to 17% at mid-Jan 2009
However, demand deposits declined by 18% (YTD annualised)

5
ICICI Bank: strategic response to market developments last year
Volatile liquidity conditions
Conscious moderation in credit growth ahead of cycle
Increased risks Tightened retail credit norms
over the last year; Active monitoring of corporate
portfolio
High wholesale deposit rates
Repayment of wholesale deposits
Slower revenue growth
Stringent cost control

6
Agenda
Market developments & our response
Financial performance
Long term opportunities & strategy

7
Fundamental consumption and investment drivers present an attractive opportunity for the
financial services sector

8
Opportunity spectrum for ICICI Group
Growing consuming classRural consumption on an uptrend; pay commission implementation to increase public sector incomeDecrease in inflation and interest rates to support consumption
Significant industrial and infrastructure requirements
Vast Indian diaspora spanning the globe Potential for remittances and NRI deposits
Low penetration of insurance and asset management

9
Our franchise
Life Insurance(JV with Prudential)General Insurance(JV with Lombard)Asset Management(JV with Prudential)
Private Equity(Wholly owned)
Investment Banking & Broking(Wholly owned)
Second largest bank in IndiaICICI Bank
Multi specialist financial services group: well positioned to capitalise on opportunities
74%
74%
51%
100%
100%

10
Retail banking: focus on liability franchise
Branches
Mar 04
469
CAGR 59%
Mar 05
562
Mar 06
614
Mar 07
755
Current
1,416
2010E
2,000+
E. Projected based on remaining branch licenses and 580 new branch licenses
Increase in branch network to drive next phase of deposit growth

11
Corporate & investment bankingDomestic wholesale banking
Build sustainable recurring revenue streams by increasing market share in transaction banking and non-fund businessParticipate in selected domestic exposures by leveraging strong relationships
Service the demand for trade and foreign currency financing from Indian corporates using international presence
Leverage syndication capabilities to achieve risk diversification and return optimization
Active monitoring of portfolio Assessing impact of changing market conditions

12
International retail banking
Non-resident Indians Technology & operating platform
NRI population of 20 mn
OpportunityInward remittance of over US$ 40 bn
Low cost technology platform
Large scale of operations in India
StrategyOffer remittance and India linked
wealth management
Build international retail deposit base
Performance20% market share in remittances into
India
Retail deposits in UK and Canada at
US$ 8.5 bn

13
Agenda
Market developments & our response
Financial performance
Long term opportunities & strategy

14
Q3-2009: Key highlights25% quarter-on-quarter increase in profit after tax to Rs. 12.72 billion in Q3-2009 from Rs. 10.14 billion in Q2-2009
Profit after tax of Rs. 12.30 billion in Q3-2008
Capitalised on opportunities in declining interest rate scenario: treasury gains of Rs. 9.76 billion in Q3-2009
19% year-on-year decrease in operating & direct marketing agency expenses despite substantial increase in branches
Net interest margin maintained at 2.4%
Strategy of conscious moderation in credit growthContraction in standalone loan book during the year to Rs. 2,125.21 billion at December 31, 2008
Net NPA ratio of 1.95% at December 31, 2008
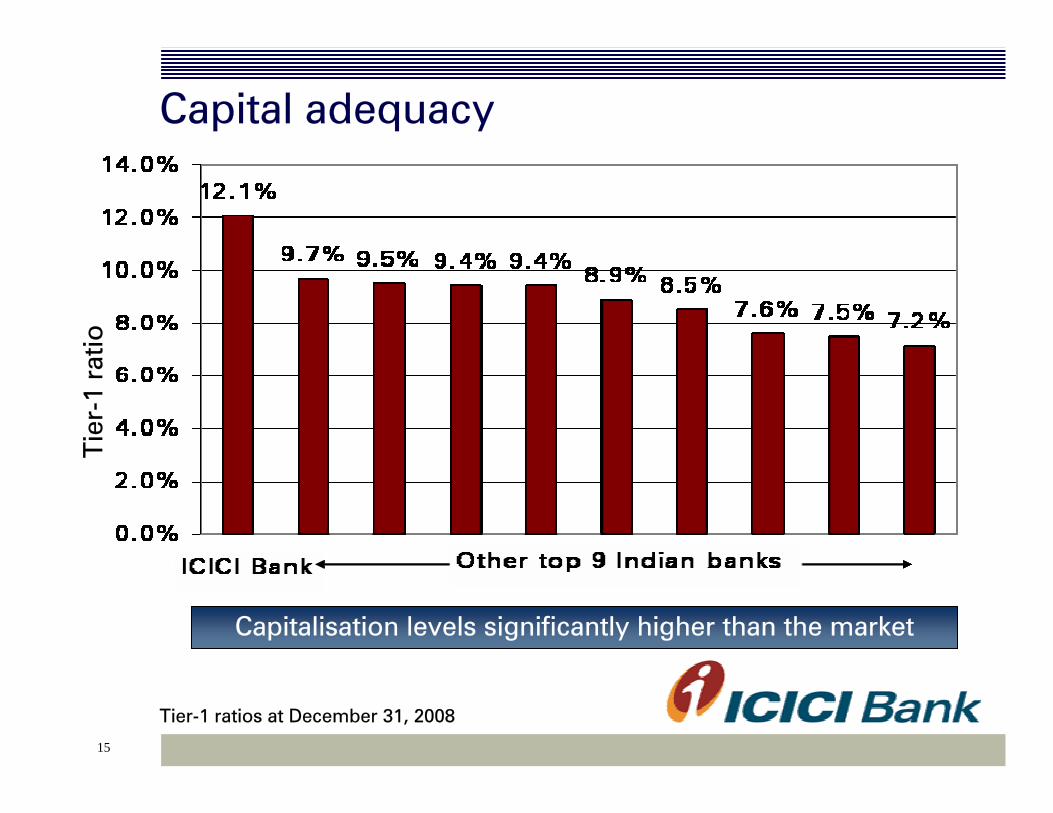
15
Capital adequacyT
ier-
1 ra
tio
Tier-1 ratios at December 31, 2008
Capitalisation levels significantly higher than the market

16
Looking ahead
Focus on rolling out branch network to enhance capability for retail deposit gathering & asset
origination
Actively monitor and manage existing portfolio for risks arising out of changing operating environment
Maintain high capitalisation levels to be prepared for next round of growth
Continue to look for opportunities to reduce costs

17
Certain statements in these slides are forward-looking statements. These statements are based on management's current expectations and are subject to uncertainty and changes in circumstances. Actual results may differ materially from those included in these statements due to a variety of factors. More information about these factors is contained in ICICI Bank's filings with the Securities and Exchange Commission.
All financial and other information in these slides, other than financial and other information for specific subsidiaries where specifically mentioned, is on an unconsolidated basis for ICICI Bank Limited only unless specifically stated to be on a consolidated basis for ICICI Bank Limited and its subsidiaries. Please also refer to the statement of audited unconsolidated, consolidated and segmental results required by Indian regulations that has been filed with the stock exchanges in India where ICICI Bank’s equity shares are listed and with the New York Stock Exchange and the US Securities Exchange Commission, and is available on our website www.icicibank.com.

18
Thank you

19
Annexure: Detailed financial results

20
Profit & loss statement
(64.8)%2.296.51246.1%9.762.828.15- Treasury income
4.1%121.58116.742.7%45.0543.87161.15Total income
56.70
1.36
11.84
46.84
10.99
46.99
64.49
52.25
9M-2008
27.71
0.54
1.03
15.77
1.92
13.47
25.15
19.90
Q3-2009
22.59
0.47
4.16
16.65
3.60
17.85
24.27
19.60
Q3-2008
22.7%
14.9%
(75.2)%
(5.3)%
(46.7)%
(24.5)%
3.6%
1.5%
Q3-o-Q3
growth
19.4%
16.2%
(59.8)%
1.5%
(52.7)%
10.3%
(8.1)%
19.2%
9M-o-9M
growth
4.7615.43DMA expenses
67.70
1.58
47.54
5.20
51.81
59.30
62.28
9M-2009
79.61Operating profit
1.82Lease depreciation
64.29Operating expenses
13.69- Others
66.27- Fee income
88.11Non-interest inc.
73.04NII
FY 2008
(Rs. in billion)

21
Profit & loss statement
3.4%
83.2%
17.7%
32.6%
22.7%
Q3-o-Q3
growth
30.08
7.05
37.13
19.57
56.70
9M-2008
12.72
4.91
17.63
10.08
27.71
Q3-2009
19.4%67.7022.5979.61 Operating profit
39.2%27.247.6029.05Provisions
12.30
2.68
14.98
Q3-2008
30.14
10.32
40.46
9M-2009
0.2%
46.4%
9.0%
9M-o-9M
growth
50.56Profit before tax
41.58Profit after tax
8.98Tax
FY 2008
(Rs. in billion)

22
Balance sheet: Assets
55.9%111.0299.9381.3471.19Of which: equity investment in subsidiaries
1.2%1,065.38971.481,114.541,053.12Investments
3,767.00
248.69
2,155.17
310.02
Dec 31, 2007
3,744.10
282.67
2,125.21
270.83
Dec 31, 2008
(0.6)%
13.7%
(1.4)%
(12.6)%
Y-o-Y growth
3,849.70
302.25
2,219.85
356.13
Sep 30, 2008
3,997.95
246.84
2,256.16
380.41
Mar 31, 2008
Total assets
Fixed & other assets
Advances
Cash & bank balances
(Rs. in billion)
Figures include impact of exchange rate movement

23
Composition of loan book: Dec 31, 2008
Total loan book: Rs. 2,125 bn Total retail loan book: Rs. 1,145 bn
1
1. Small ticket personal loans
2. Vehicle loans includes auto loans 13%, commercial business 13% and two wheelers 2%
3. Retail business includes builder loans and dealer funding

24
Balance sheet: Liabilities(Rs. in billion)
3,767.00
184.30
469.70
816.27
2,297.79
3.50
454.01
11.12
465.14
Dec 31, 2007
3,744.10
158.91
578.49
990.69
2,090.65
3.50
489.22
11.13
500.35
Dec 31, 2008
(0.6)%
(13.8)%
23.2%
21.4%
(9.0)%
0.0%
7.8%
-
7.6%
Y-o-Y growth
948.49863.99Total borrowings
3,997.95
221.45
514.86
2,444.31
3.50
453.57
11.13
464.70
Mar 31, 2008
3,849.70
177.25
592.68
2,234.02
3.50
475.32
11.13
486.45
Sep 30, 2008
Total liabilities
Other liabilities
- of which: overseas
Deposits
Preference capital
- Reserves
- Equity capital
Net worth
Figures include impact of exchange rate movement

25
Capital adequacy (Basel II)
3.0%
11.0%
14.0%
September 30, 2008
2.2%
11.8%
14.0%
March 31, 2008
3.5%
12.1%
15.6%
December 31, 2008
- Tier II
- Tier I
Total Capital
As per Reserve Bank of India’s revised Basel II guidelines

26
Key ratios
1.8
37.7
2.4
449.5
45.3
10.2
Q3-2009
2.2
50.9
2.2
418.4
38.6
11.4
9M-2008
1.8
43.6
2.4
449.5
35.9
8.3
9M-2009
418.4417.5 Book value (Rs.)
2.2
50.0
2.2
39.4
11.1
FY 2008
2.2
47.9
2.3
44.0
10.7
Q3-2008
Cost to average assets (incl. DMA expenses)
Cost to income (incl. DMA expenses)
Net interest margin
Weighted avg EPS (Rs.)
Return on average networth1
(Percent)
1. Based on quarterly average net worth
27
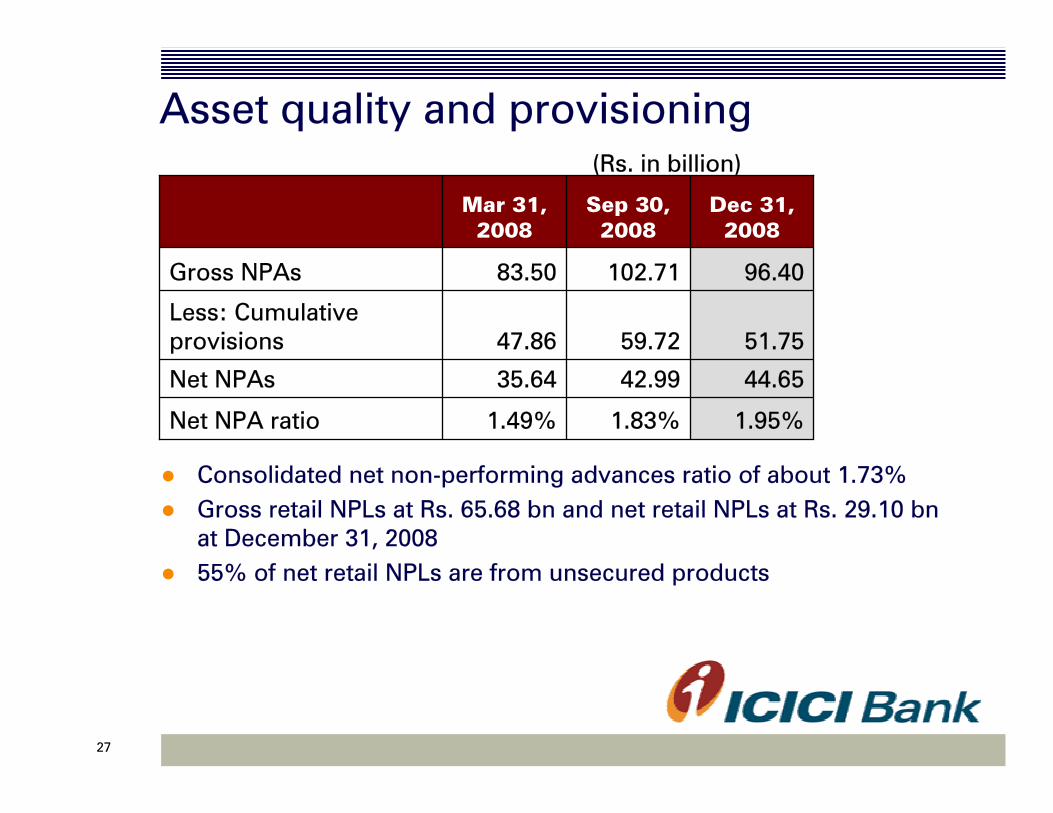
Asset quality and provisioning(Rs. in billion)
Consolidated net non-performing advances ratio of about 1.73%Gross retail NPLs at Rs. 65.68 bn and net retail NPLs at Rs. 29.10 bn at December 31, 200855% of net retail NPLs are from unsecured products
1.83%
42.99
59.72
102.71
Sep 30, 2008
1.49%
35.64
47.86
83.50
Mar 31, 2008
1.95%
44.65
51.75
96.40
Dec 31, 2008
Net NPA ratio
Net NPAs
Less: Cumulative provisions
Gross NPAs

28
Key subsidiaries

29
InsuranceMarket leadership in private sector with overall market share of 12.0%1
Total premium growth of 28% to Rs. 99.18 bnRenewal premium growth of 75%
Retail new business weighted received premium of Rs. 36.46 bn in 9M-2009New Business Profit (NBP) of Rs. 7.12 bn in 9M-2009 compared to Rs 7.48 bn in 9M-2008NBP margin at 18.9% in 9M-2009
Market leadership in private sector with overall market share of 12.0%1
Total premium growth of 28% to Rs. 99.18 bnRenewal premium growth of 75%
Retail new business weighted received premium of Rs. 36.46 bn in 9M-2009New Business Profit (NBP) of Rs. 7.12 bn in 9M-2009 compared to Rs 7.48 bn in 9M-2008NBP margin at 18.9% in 9M-2009
Life insurance
Continued leadership in private sector with overall market share of 12.2%2
Gross written premium3 of Rs. 27.22 bn in 9M-2009 compared to Rs. 26.14 bn in 9M-2008Achieved financial breakeven in 9M-2009 despite challenging market conditions post de-tariffing and event-related claims
Continued leadership in private sector with overall market share of 12.2%2
Gross written premium3 of Rs. 27.22 bn in 9M-2009 compared to Rs. 26.14 bn in 9M-2008Achieved financial breakeven in 9M-2009 despite challenging market conditions post de-tariffing and event-related claims
General insurance
1. For the period April - December 2008 on new business weighted received premium basis
2. For the period April – November 20083. Excluding TP motor pool remittances

30
ICICI Bank UKTotal assets of USD 7.6 billion at December 31, 2008
Total deposits of USD 4.1 billion at December 31, 2008
Proportion of term deposits at 54%Increase of about USD 530 million in retail term deposits during Q3-2009
Net profit of USD 1.4 million in 9M-2009
Net MTM impact of USD 71 million (post tax) in reserves in Q3-2009
Capital adequacy ratio at 18.6%

31
ICICI Bank UK asset profile1
1. Includes cash & advances to banksand certificates of deposit
100% of non-India investment portfolio (excl. Lehman Brothers bonds) rated investment grade; 90% rated A- or higher
Total assets:USD 7.6 billion

3232
ICICI Bank Canada Total assets of CAD 6.5 billion at December 31, 2008
Total deposits of CAD 5.4 billion at December 31, 2008
Proportion of term deposits at 89%Increase of about CAD 550 million in retail term deposits during Q3-2009
Net profit of CAD 32.9 million in 9M-2009
Capital adequacy ratio at 16.1%

33
ICICI Bank Canada asset profile
1. Includes cash & advances to banks, government securities and banker’s acceptances/depository notes
Total assets:CAD 6.5 billion
1

34
Other subsidiaries(Rs. billion)
0.890.51ICICI Housing Finance Company
0.75
0.52
1.29
1.08
9M-2008
0.30ICICI Prudential Asset Management Company
0.25ICICI Securities Ltd.
1.42
3.23
9M-2009Profit after tax
ICICI Venture
ICICI Securities PD
Consolidated profit after tax of Rs. 28.28 billion in 9M- 2009