icic 2016: patent information - looking beyond china
TRANSCRIPT

“Beyond China” -Who are the rising stars
in patent information?
Stephen Adams
Magister Ltd., GB
ICIC 2016, Heidelberg

Background
• Many information professionals still rely upon
commercial family databases for a proportion of
their patent-based searches
– FTO searches may be run in single-country
collections;
– patentability searches are usually more efficient in a
database with wider country coverage (+/- value
added indexing)
• Commercial database producers are under
pressure to select the right mix of countries in
their products.
© Magister Ltd, 2016 2

© Magister Ltd, 2016 3
“Re-active coverage”
• Historically, expansion of coverage in multi-
national databases has concentrated upon
including
– mature or growing industrialised economies (G8+)
– newly-identified, high-volume contributors to the
state of the art (CN)
– user demand (cf. MX vs. DE-U)
• There is no foolproof way of predicting where
the next avalanche of prior art will come
from…but…there may be useful clues.
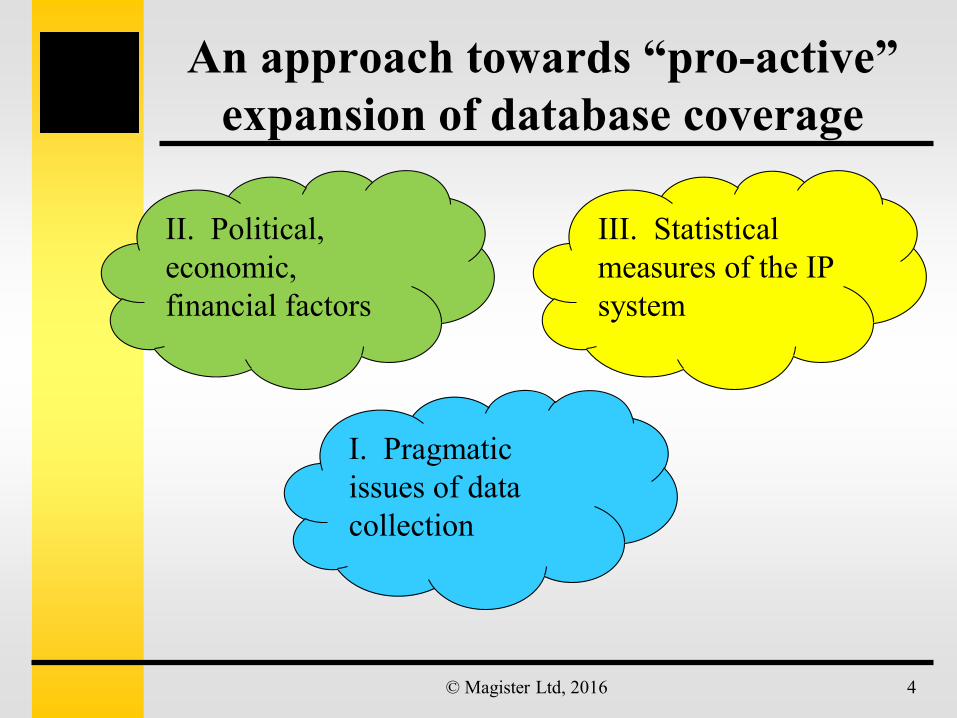
An approach towards “pro-active”
expansion of database coverage
© Magister Ltd, 2016 4
II. Political,
economic,
financial factors
I. Pragmatic
issues of data
collection
III. Statistical
measures of the IP
system
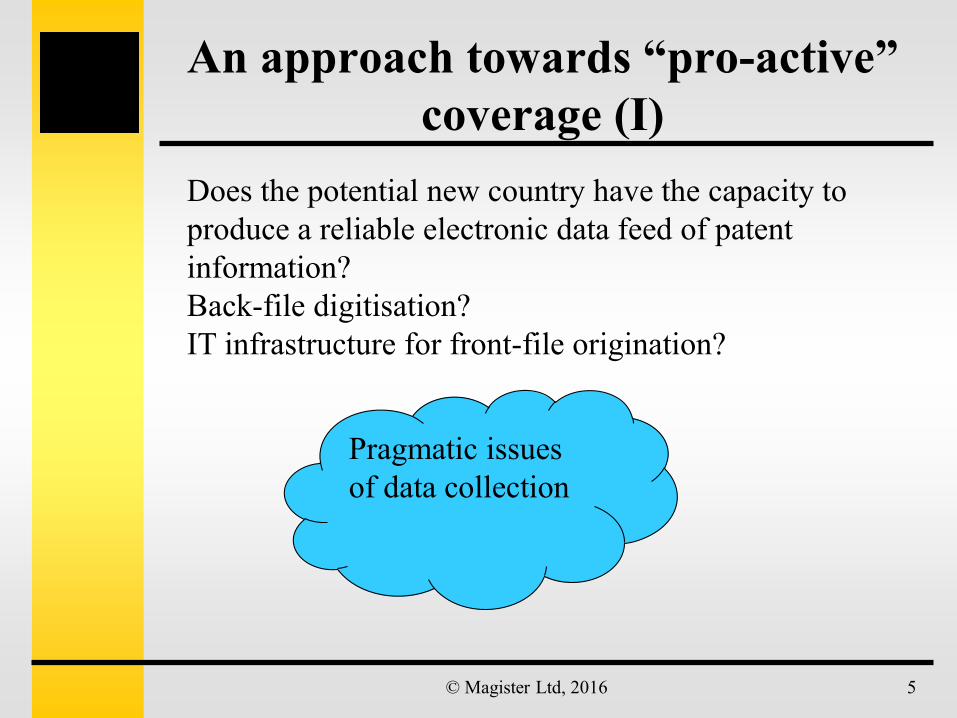
An approach towards “pro-active”
coverage (I)
© Magister Ltd, 2016 5
Does the potential new country have the capacity to
produce a reliable electronic data feed of patent
information?
Back-file digitisation?
IT infrastructure for front-file origination?
Pragmatic issues
of data collection
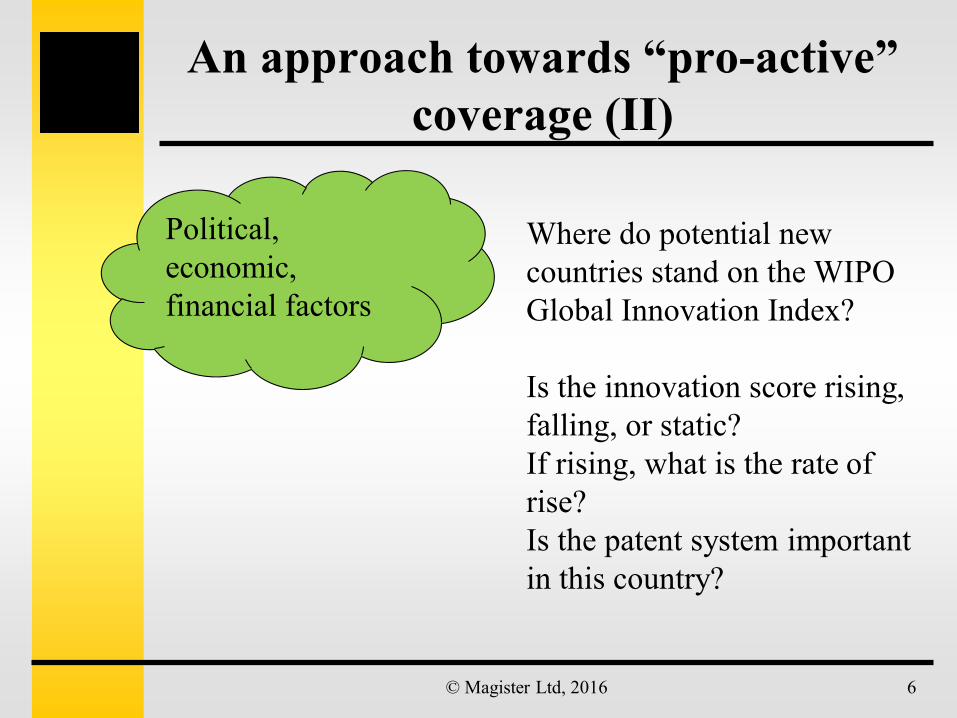
An approach towards “pro-active”
coverage (II)
© Magister Ltd, 2016 6
Political,
economic,
financial factors
Where do potential new
countries stand on the WIPO
Global Innovation Index?
Is the innovation score rising,
falling, or static?
If rising, what is the rate of
rise?
Is the patent system important
in this country?
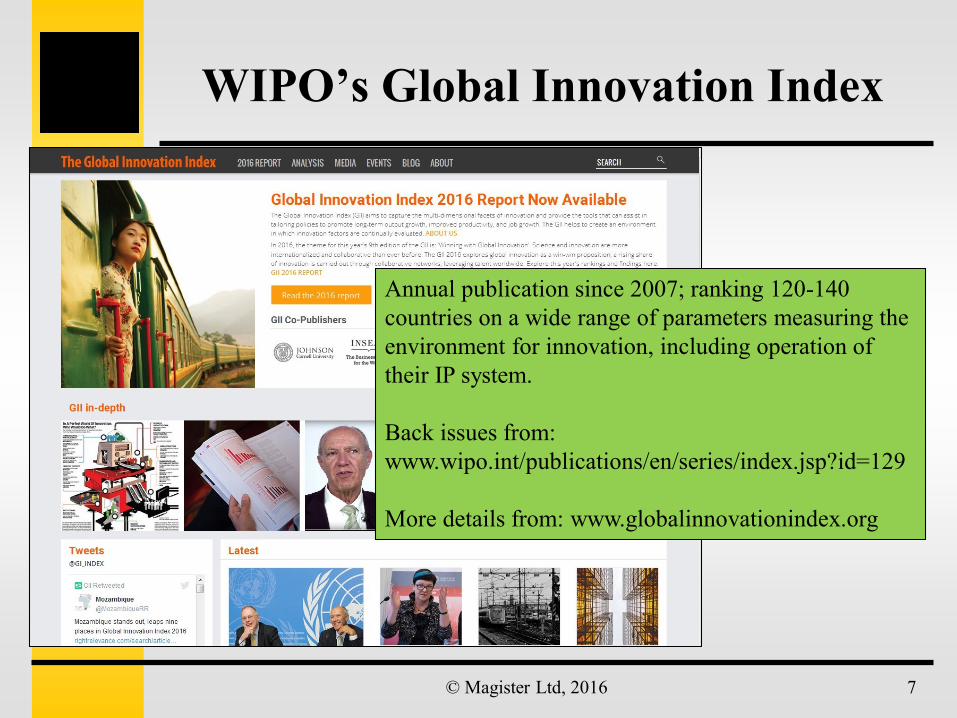
WIPO’s Global Innovation Index
© Magister Ltd, 2016 7
Annual publication since 2007; ranking 120-140
countries on a wide range of parameters measuring the
environment for innovation, including operation of
their IP system.
Back issues from:
www.wipo.int/publications/en/series/index.jsp?id=129
More details from: www.globalinnovationindex.org
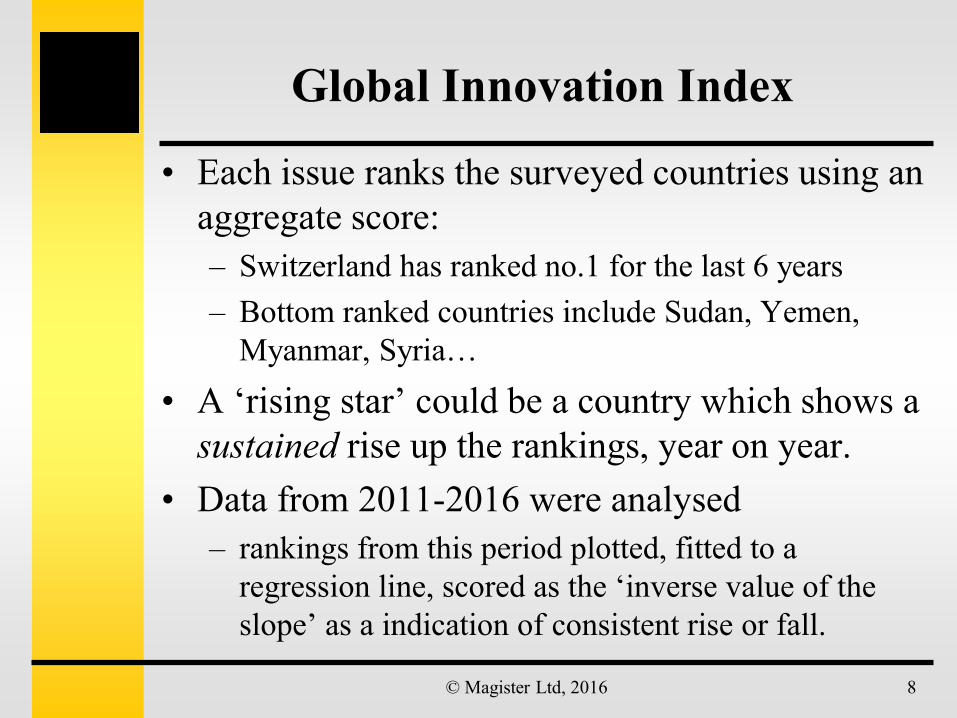
Global Innovation Index
• Each issue ranks the surveyed countries using an
aggregate score:
– Switzerland has ranked no.1 for the last 6 years
– Bottom ranked countries include Sudan, Yemen,
Myanmar, Syria…
• A ‘rising star’ could be a country which shows a
sustained rise up the rankings, year on year.
• Data from 2011-2016 were analysed
– rankings from this period plotted, fitted to a
regression line, scored as the ‘inverse value of the
slope’ as a indication of consistent rise or fall.
© Magister Ltd, 2016 8

Cumulating GII data – example for
Canada
© Magister Ltd, 2016 9
GII
ranking
2011 8
2012 12
2013 11
2014 12
2015 16
2016 15
Slope of regression line fitting score data = + 1.37
An increase in overall rank number over time represents
a deterioration in performance; the inverse value (-1.37)
is used as an index of sustained performance.

Cumulating GII data – example for
Kazakhstan
© Magister Ltd, 2016 10
GII
ranking
2011 84
2012 83
2013 84
2014 79
2015 82
2016 75
Slope of regression line fitting score data = – 1.51
A decrease in overall rank number over time represents an
improvement in performance; the inverse value (+ 1.51) is
used as an index of sustained performance.

Top 15 consistent improvers,
2011-2016
© Magister Ltd, 2016 11

Performance in the top 1/3 of the table
(ranked higher than 50 in at least one year)
• Some of the overall good performers are starting
from a very low base; they may not make an
impact for some while.
• All of the following are ‘mid-range’ countries:
© Magister Ltd, 2016 12
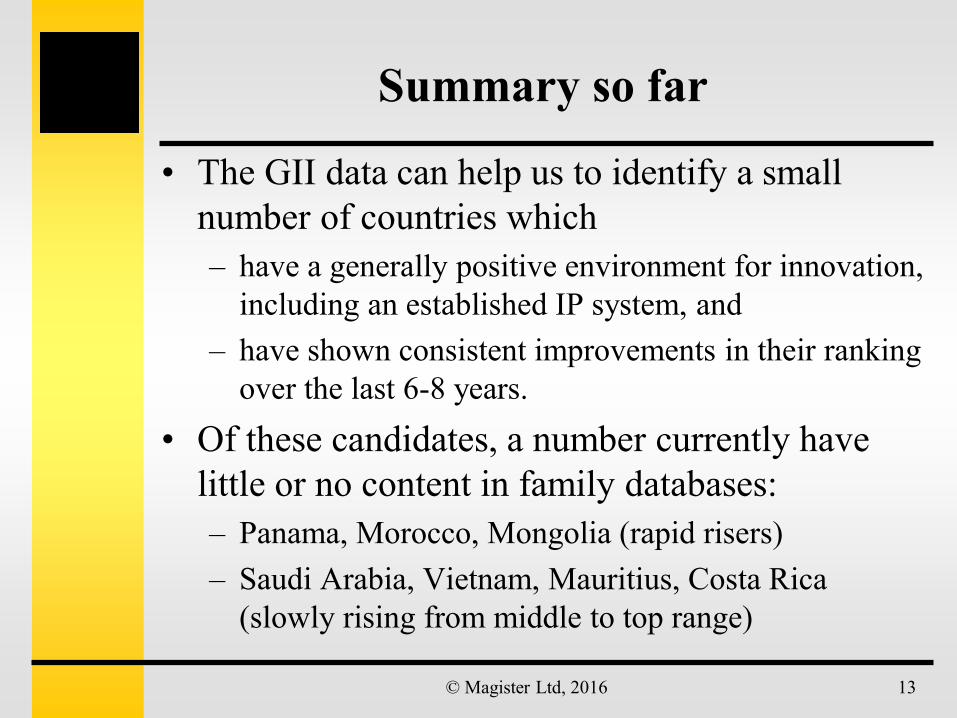
Summary so far
• The GII data can help us to identify a small
number of countries which
– have a generally positive environment for innovation,
including an established IP system, and
– have shown consistent improvements in their ranking
over the last 6-8 years.
• Of these candidates, a number currently have
little or no content in family databases:
– Panama, Morocco, Mongolia (rapid risers)
– Saudi Arabia, Vietnam, Mauritius, Costa Rica
(slowly rising from middle to top range)
© Magister Ltd, 2016 13

An approach towards “pro-active”
coverage (III)
© Magister Ltd, 2016 14
Statistical
measures of the IP
system
Grant statistics (% national, % non-national)
Volume of activity (absolute numbers; applications/1m population)
“Originality” (% new basics)
What is the state of the national IP
publication system?
Is past performance a clue to the
future?
© Magister Ltd, 2016 15
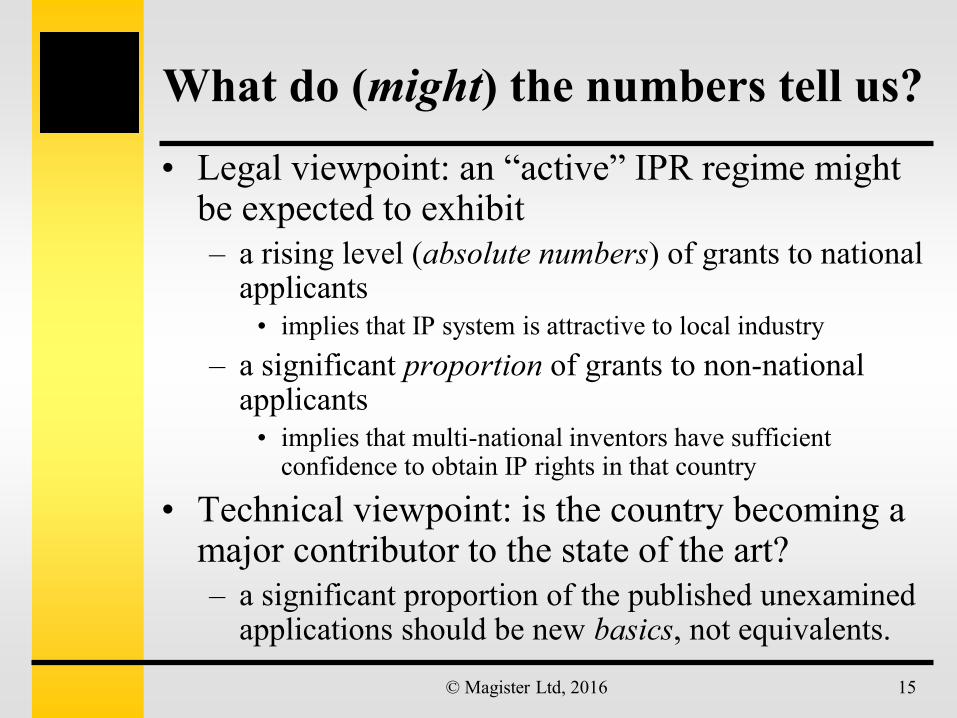
What do (might) the numbers tell us?
• Legal viewpoint: an “active” IPR regime might be expected to exhibit
– a rising level (absolute numbers) of grants to national applicants
• implies that IP system is attractive to local industry
– a significant proportion of grants to non-national applicants
• implies that multi-national inventors have sufficient confidence to obtain IP rights in that country
• Technical viewpoint: is the country becoming a major contributor to the state of the art?
– a significant proportion of the published unexamined applications should be new basics, not equivalents.
© Magister Ltd, 2016 16
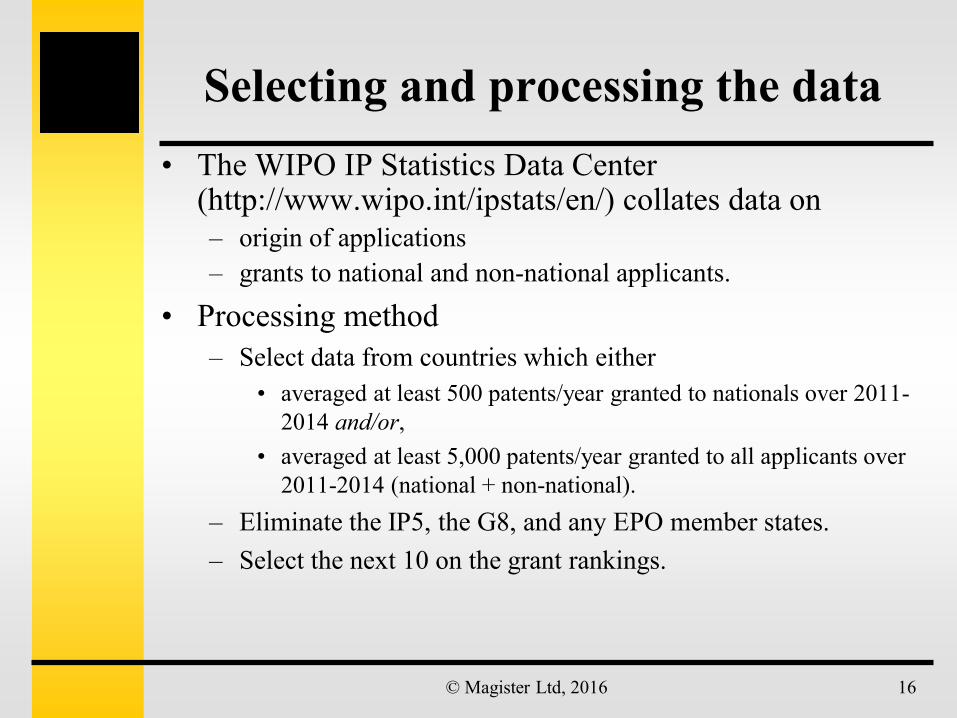
Selecting and processing the data
• The WIPO IP Statistics Data Center (http://www.wipo.int/ipstats/en/) collates data on
– origin of applications
– grants to national and non-national applicants.
• Processing method
– Select data from countries which either
• averaged at least 500 patents/year granted to nationals over 2011-
2014 and/or,
• averaged at least 5,000 patents/year granted to all applicants over
2011-2014 (national + non-national).
– Eliminate the IP5, the G8, and any EPO member states.
– Select the next 10 on the grant rankings.
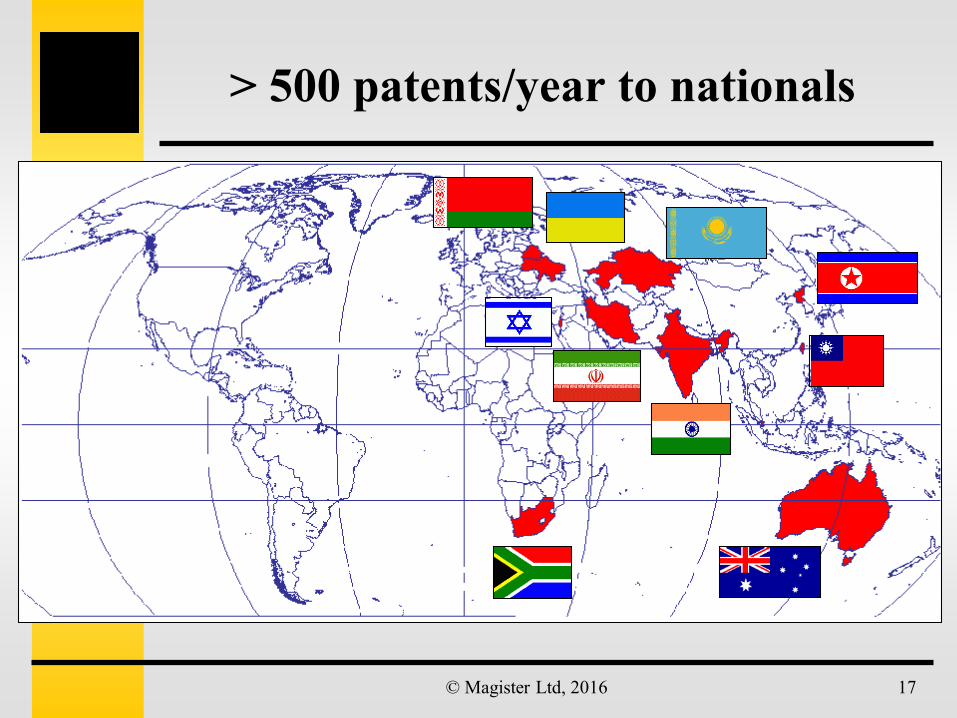
© Magister Ltd, 2016 17
> 500 patents/year to nationals
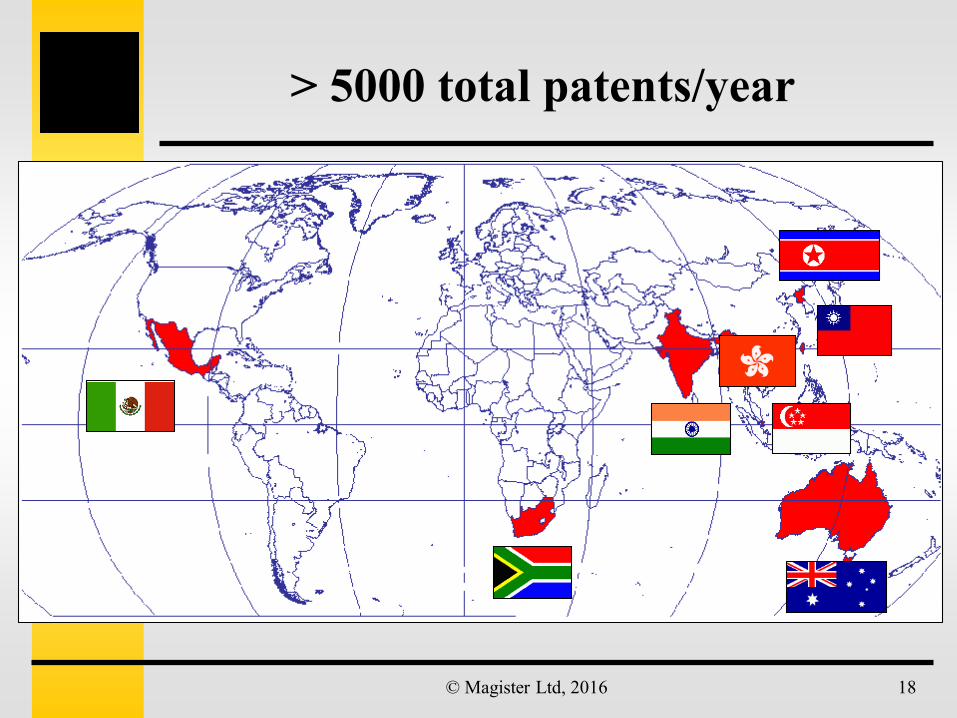
© Magister Ltd, 2016 18
> 5000 total patents/year

© Magister Ltd, 2016 19
The leading players so far…
13 countries• Americas:
– Mexico
• Africa:
– South Africa
• Europe:
– Belarus, Ukraine
• Middle East, Central/South Asia:
– Kazakhstan, India, Iran, Israel
• Australasia, East Asia:
– Australia, Hong Kong, North Korea, Singapore, Taiwan

But is this a good measure?
• Many countries in the 1990-2010 period
passed utility model (UM) laws
– possibly a local reaction to international
treaty obligations to pass TRIPS-compliant
patent legislation, not meeting the need of
local industry.
• Does the picture change if we consider
total invention-related IP (i.e. patents and
utility models together)?
© Magister Ltd, 2016 20

Incorporating UM into the mix
• Repeat the exercise
• Slightly modified criteria:
– Total grants selected from >1000, not >5000
– Grants to nationals selected from >500
– Retained any individual states which also
belong to a regional patent-granting system
such as the EPO
• smaller applicants may use a local UM system in
preference to a regional patent system
© Magister Ltd, 2016 21

© Magister Ltd, 2016 22
> 500 UM/year to nationals
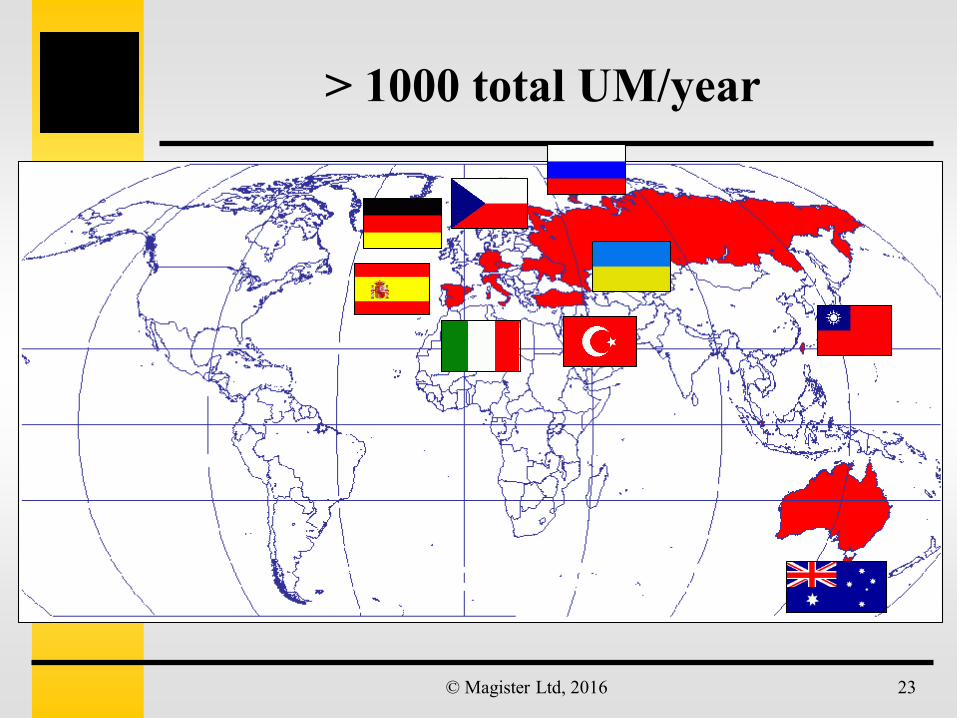
© Magister Ltd, 2016 23
> 1000 total UM/year

© Magister Ltd, 2016 24
The new leader board…
20 countries• Americas:
– Mexico
• Africa:
– South Africa
• Europe:
– Belarus, Czech Rep. (U), Germany (U), Italy (U), Russian
Fedn. (U), Spain (U), Ukraine
• Middle East, Central/South Asia:
– Kazakhstan, India, Iran, Israel, Turkey (U)
• Australasia, East Asia:
– Australia, Hong Kong, North Korea, Singapore, Taiwan,
Thailand (U)

© Magister Ltd, 2016 25
Focus on those with little/no prior
coverage…• Americas:
– Mexico
• Africa:
– South Africa
• Europe:
– BELARUS, CZECH REP. (U), Germany (U), ITALY (U),
Russian Fedn. (U), Spain (U), UKRAINE
• Middle East, Central/South Asia:
– KAZAKHSTAN, India, IRAN, Israel, Turkey (U)
• Australasia, East Asia:
– Australia, Hong Kong, NORTH KOREA, Singapore, Taiwan,
THAILAND (U)

Potential new content;
average publication rate, 2010-2014Country Patents
(nationals)
Patents
(total)
UMs
(nationals)
UMs
(total)
Grand
total
Ukraine 1787 3658 9626 9796 13454
North Korea 6322 6360 ND ND 6360
Iran 4285 4546 0 0 4546
Italy (U) 3113 3404 3404
Belarus 1291 1408 829 896 2304
Kazakhstan 1465 1689 78 134 1823
Czech Rep. (U) 1400 1458 1458
Thailand (U) 805 842 842
New patents: 17661 New UM: 16530
Grand total of new documents per year: 34191
© Magister Ltd, 2016 26
Mostly missing from current
family databases

Summary and conclusions
• Statistical data may provide a more
objective method, alongside other factors,
to identify ‘rising stars’
• These analyses have only considered the
patent-granting scenario;
– more research on the impact of published
unexamined applications (CC-A documents)
would be helpful
– no comment is possible on the quality of
disclosures (new basics vs. equivalents)
© Magister Ltd, 2016 27
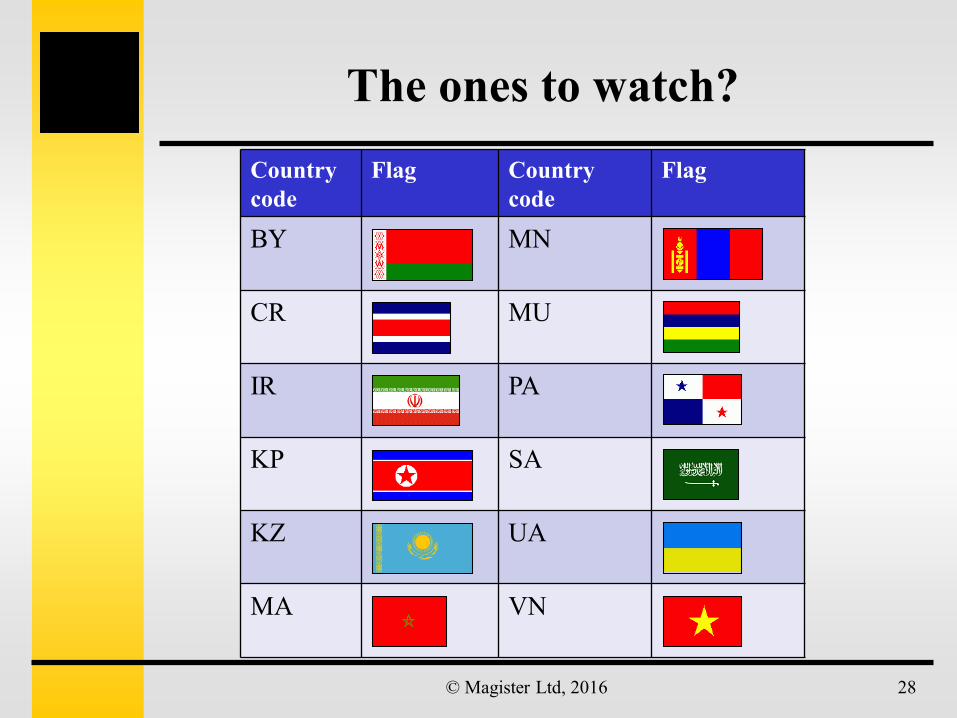
The ones to watch?
© Magister Ltd, 2016 28
Country
code
Flag Country
code
Flag
BY MN
CR MU
IR PA
KP SA
KZ UA
MA VN