ice-dammed lakes and rerouting ofthe drainage ofnorthern...
TRANSCRIPT
ARTICLE IN PRESS
*Correspondin
36-60.
E-mail addres
0277-3791/$ - see
doi:10.1016/j.qua
Quaternary Science Reviews 23 (2004) 1313–1332
Ice-dammed lakes and rerouting of the drainage of northernEurasia during the Last Glaciation
Jan Mangeruda,*, Martin Jakobssonb, Helena Alexandersonk, Valery Astakhovd,Garry K.C. Clarkee, Mona Henriksena, Christian Hjortc, Gerhard Krinnerf,
Juha-Pekka Lunkkag, Per M .ollerc, Andrew Murrayh, Olga Nikolskayai,Matti Saarnistoj, John Inge Svendsena
aDepartment of Earth Science, University of Bergen and Bjerknes, Centre for Climate Research, All!egt. 41, Bergen N-5007, Norwayb Chase Ocean Engineering Lab., Center for Coastal and Ocean Mapping, University of New Hampshire, Durham, NH 03824, USA
cDepartment of Geology, Quaternary Sciences, GeoBiosphere Science Centre, Lund University, S .olvegatan 12, Lund SE-22362, SwedendGeological Faculty, St. Petersburg State University, Universitetskaya 7/9, St. Petersburg 199034, Russia
e Earth & Ocean Sciences, University of British Columbia, 6339 Stores Road, Vancouver, BC V6T 1Z4 Canadaf LGGE/CNRS, 54 Rue Moliere, DU BP 96, Saint Martin d’Heres Cedex 38402, France
g Institute of Geosciences, Linnanmaa, P.O. Box 3000, FIN-90014 University of Oulu, Finlandh Nordic Laboratory for Luminescence Dating, Aarhus University, Ris^ National Laboratory, Roskilde DK-4000, Denmark
i Institute of remote sensing methods for Geology (NIIKAM), Birzhevoy proyezd 6, St. Petersburg 199034, RussiajGeological Survey of Finland, Betonimiehenkuja 4, Espoo 02150, Finland
k Department of Physical Geography and Quaternary Geology, Stockholm University, SE-10691 Stockholm, Sweden
Received 13 February 2003
Abstract
During the Quaternary period, ice sheets centred over the Barents and Kara seas expanded several times onto mainland Russia
and blocked northflowing rivers, such as the Yenissei, Ob, Pechora and Mezen. Large ice-dammed lakes with reversed outlets, e.g.
toward the Caspian Sea, formed south of these ice sheets. Some lakes are reconstructed from shorelines and lacustrine sediments,
others mainly from ice-sheet configuration. Ice-dammed lakes, considerably larger than any lake on Earth today, are reconstructed
for the periods 90–80 and 60–50 ka. The ages are based on numerous optically stimulated luminescence (OSL) dates. During the
global Last Glacial Maximum (LGM, about 20 ka) the Barents–Kara Ice Sheet was too small to block these eastern rivers, although
in contrast to the 90–80 and 60–50 ka maxima, the Scandinavian Ice Sheet grew large enough to divert rivers and meltwater across
the drainage divide from the Baltic Basin to the River Volga, and that way to the Caspian Sea. Climate modelling shows that the
lakes caused lower summer temperatures on the continent and on the lower parts of the ice sheet. The final drainage of the best
mapped lake is modelled, and it is concluded that it probably emptied within few months. We predict that this catastrophic outburst
had considerable impact on sea-ice formation in the Arctic Ocean and on the climate of a much larger area.
r 2003 Elsevier Ltd. All rights reserved.
1. Introduction
Ice sheets centred over the Barents and Kara seasmoved up-slope when they expanded onto mainlandRussia (including Siberia). Therefore the north-flowingrivers were diverted and ice-dammed lakes formed infront of the ice sheets. In a similar way the Scandinavian
g author. Tel.: +47-55-58-35-04; fax: +47-55-58-
s: [email protected] (J. Mangerud).
front matter r 2003 Elsevier Ltd. All rights reserved.
scirev.2003.12.009
Ice Sheet dammed lakes and diverted rivers in westernRussia. These concepts have been understood fordecades (Kvasov, 1979; Grosswald, 1980), but theimpact and timing of the blocking events have beenuncertain.
Rerouting of the north-flowing rivers must haveoccurred during all large Quaternary glaciations thataffected northern Russia. However, the glaciationpattern, and thus the diversion of rivers, certainlychanged from one glaciation to another. In this paperwe analyse the drainage history during the Last
ARTICLE IN PRESSJ. Mangerud et al. / Quaternary Science Reviews 23 (2004) 1313–13321314
Glaciation, named Zyryanka in Western Siberia, Valdaiin European Russia, and Weichsel in Western Europe.Our presentation is structured chronologically. We usethe western European chronostratigraphic terminology,i.e. the Weichselian, considered as nearly synchronouswith marine isotope stages (MIS) 5d-2, and subdividedinto the Early Weichselian (MIS 5d-5a), the MiddleWeichselian (MIS 4-3), and the Late Weichselian (MIS 2)(Mangerud, 1989). Rerouting of the drainage occurred infive areas, although with interplay between some of them(Fig. 1): (1) the Taimyr Peninsula, (2) the West SiberianPlain, (3) the Pechora Lowland, (4) the White Sea Basin,and (5) the area draining toward the Baltic Sea.
Our analysis of the drainage history is mainly basedon the results of the European Science Foundationproject ‘‘Quaternary Environment of the EurasianNorth’’ (QUEEN). We aim at an overview and forobservations will mainly refer to the relevant publica-tions. However, some previously unpublished observa-tions will be documented in more detail. This work is acompanion paper to the synthesis of the ice sheet history(Svendsen et al., 2004) and we will therefore also discusspotential drainage rerouting caused by glaciations forwhich the drainage history is not fully documented. Themain reconstructions are given in three maps (Figs. 2–4).
Fig. 1. Key map with nam
2. Methods
The ‘‘QUEEN-teams’’ investigating different areashave, to different degrees, employed field observations,photogeological studies, and dating programs; detailsare given in the cited papers. On the West SiberianPlain, only the Lower Ob area was investigated aspart of the QUEEN efforts; the rest of this huge regionhas been assessed only from data in previous Russianworks.
The chronology is mainly based on optical stimulatedluminescence (OSL) dates obtained at the NordicLuminescence Laboratory in Ris^, Denmark. All datesare performed with the SAR protocol (Murray andWintle, 2000), although some of the older ones alsoinclude measurements undertaken using the multiplealiquot SARA (Mejdahl and B^tter-Jensen, 1994) andadditive dose protocols. Until about 1999 the dose rateterm was measured using field gamma spectrometryand/or laboratory beta counting; thereafter the dose ratewas determined using laboratory gamma spectrometry(Murray et al., 1987). These improvements in technol-ogy provide improvements in calculated accuracy andprecision in the more recent dates (post 1999), andprobably make them more reliable. Nevertheless, some
es used in the text.
ARTICLE IN PRESS
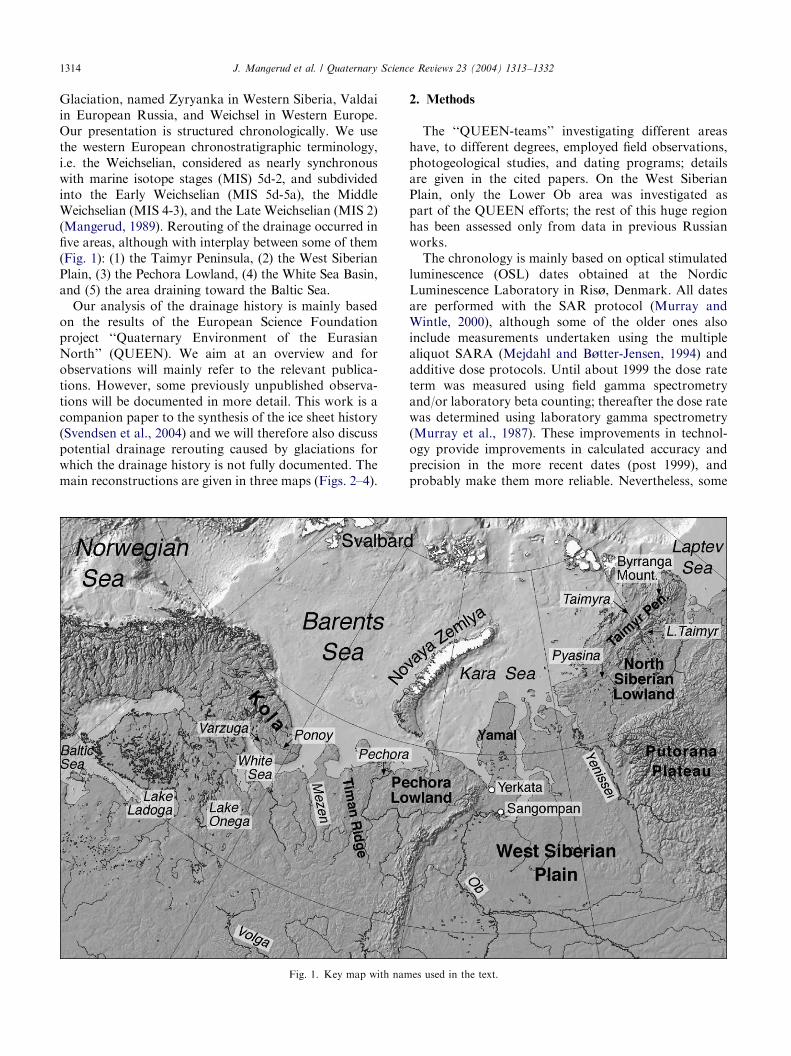
Fig. 2. Reconstruction of ice-dammed lakes and rerouting of rivers during the Early Weichselian, about 90–80 ka. Ice margins are taken from
Svendsen et al. (2004). In the hatched area the ice margin position is unknown, probably because it was overrun by the 60 ka ice advance. Stippled
line on Taimyr shows a retreat phase damming a lake. Blue arrows show outlets. The arrow in the Barents Sea shows the longest modelled outburst
route for Lake Komi, and the corresponding western ice margin. The shorter and more probable routes have the same starting point. See text for
discussion. Sea level is lowered 50m (Chappell et al., 1996) without considering any isostatic depression.
J. Mangerud et al. / Quaternary Science Reviews 23 (2004) 1313–1332 1315
assumptions remain, such as the stability of radionuclideactivities, and thus of dose rates.
The area and volume of all the larger reconstructedlakes are estimated in the same way as in Mangerud et al.(2001a), i.e. using the Global Land One-km BaseElevation (GLOBE) model (GLOBE-Task-Team, and-others, 1999), combined with the International Bathy-metric Chart of the Arctic Ocean (IBCAO) bathymetricgrid model (Jakobsson et al., 2000). We have used theice margins as shown on the maps (Figs. 2–4). These aretaken from Svendsen et al. (2004), except that in thePechora Lowland we have used the Harbei moraines for
90–80 ka and omitted the Laya-Adzva and Rogovayaridges because Lake Komi extended to the Harbeimoraines (Fig. 5).
We have filled up the lakes to assumed surface level,and calculated the areas and volumes using the present-day surface topography. For Lake Komi and the ice-dammed lakes on Taimyr, mapped shorelines are athigher altitudes closer to the ice-damming margin,indicating a glacioisostatic tilting. This informationhas been used for the areal and volume reconstructionsof Lake Komi and the lakes on Taimyr, whereas for allthe other lakes a horizontal lake surface have been used.
ARTICLE IN PRESS
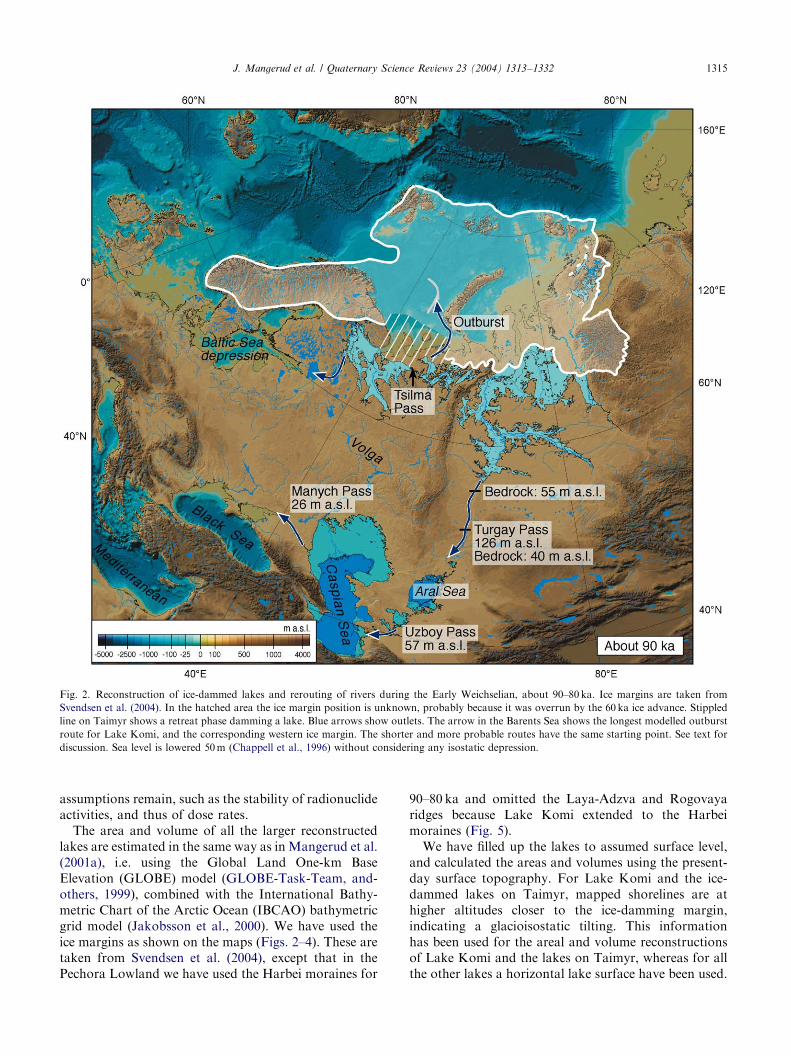
Fig. 3. Reconstruction of ice-dammed lakes and rerouting of rivers during the Middle Weichselian, about 60–50 ka. Ice margins are taken from
Svendsen et al. (2004). In the hatched area, position of ice margin is unknown. The lakes are to a large extent predictions based on the configuration
of the ice margin. Thus they represent visualisations of hypotheses that should be tested. Arrows show assumed outlet paths. Sea level is lowered 60m
(Chappell, 2002).
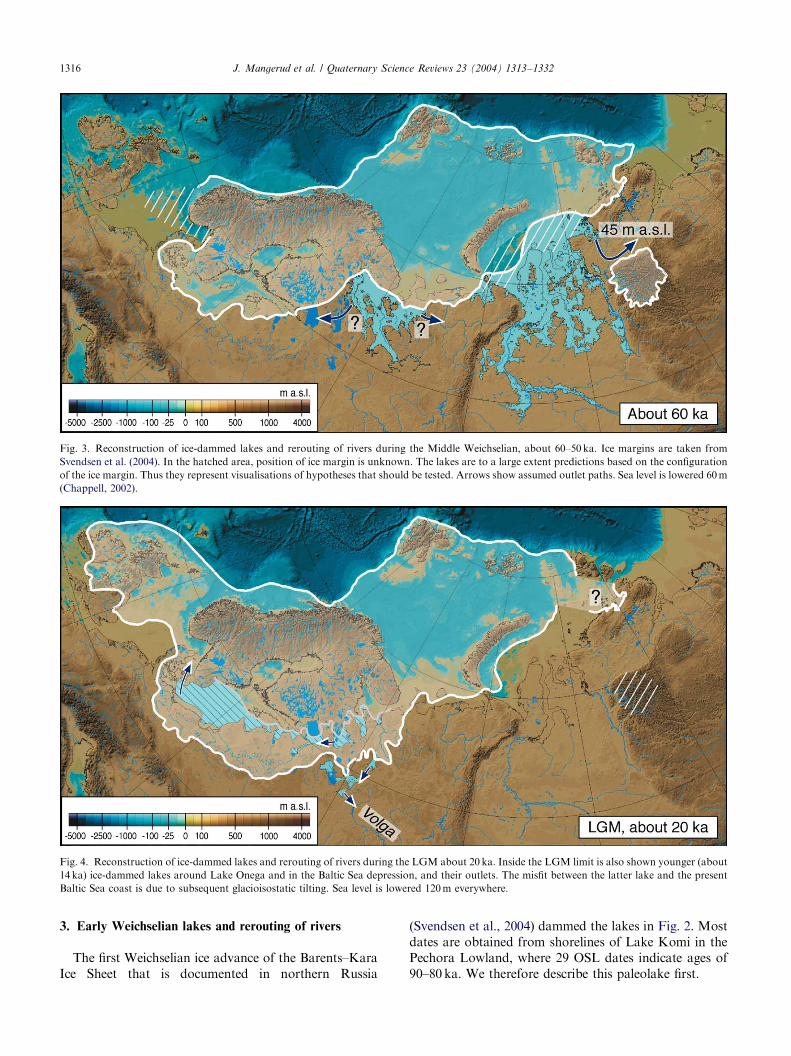
Fig. 4. Reconstruction of ice-dammed lakes and rerouting of rivers during the LGM about 20 ka. Inside the LGM limit is also shown younger (about
14 ka) ice-dammed lakes around Lake Onega and in the Baltic Sea depression, and their outlets. The misfit between the latter lake and the present
Baltic Sea coast is due to subsequent glacioisostatic tilting. Sea level is lowered 120m everywhere.
J. Mangerud et al. / Quaternary Science Reviews 23 (2004) 1313–13321316
3. Early Weichselian lakes and rerouting of rivers
The first Weichselian ice advance of the Barents–KaraIce Sheet that is documented in northern Russia
(Svendsen et al., 2004) dammed the lakes in Fig. 2. Mostdates are obtained from shorelines of Lake Komi in thePechora Lowland, where 29 OSL dates indicate ages of90–80 ka. We therefore describe this paleolake first.
ARTICLE IN PRESS
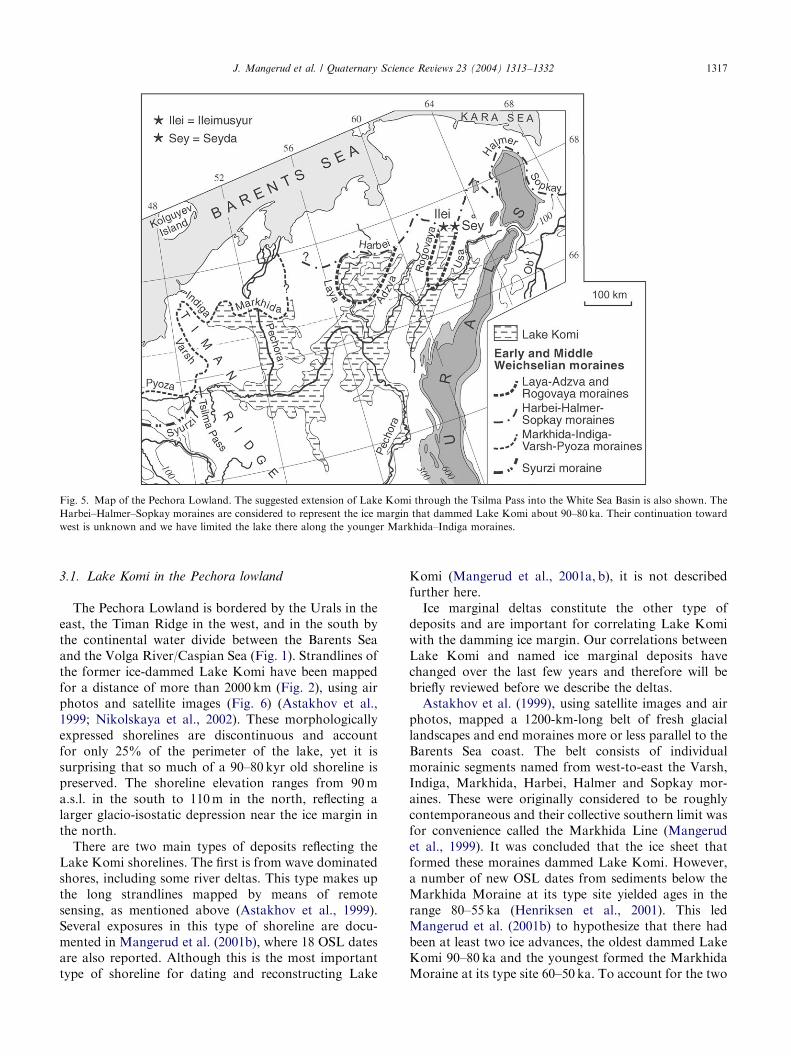
Fig. 5. Map of the Pechora Lowland. The suggested extension of Lake Komi through the Tsilma Pass into the White Sea Basin is also shown. The
Harbei–Halmer–Sopkay moraines are considered to represent the ice margin that dammed Lake Komi about 90–80 ka. Their continuation toward
west is unknown and we have limited the lake there along the younger Markhida–Indiga moraines.
J. Mangerud et al. / Quaternary Science Reviews 23 (2004) 1313–1332 1317
3.1. Lake Komi in the Pechora lowland
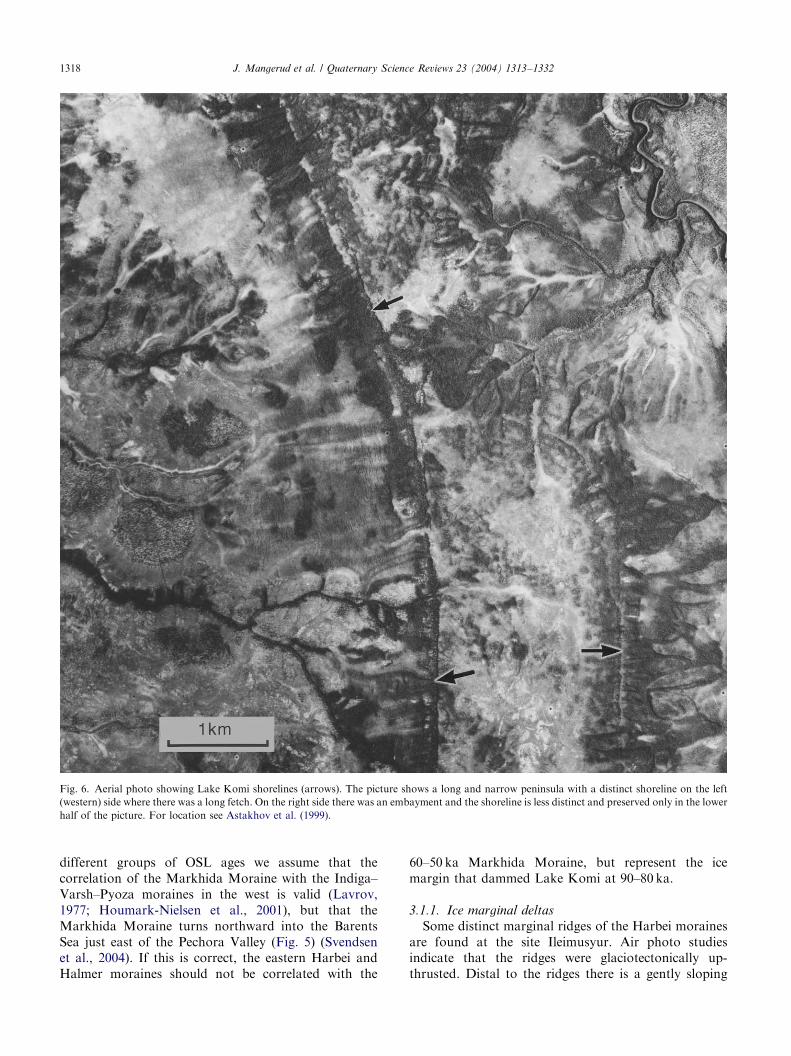
The Pechora Lowland is bordered by the Urals in theeast, the Timan Ridge in the west, and in the south bythe continental water divide between the Barents Seaand the Volga River/Caspian Sea (Fig. 1). Strandlines ofthe former ice-dammed Lake Komi have been mappedfor a distance of more than 2000 km (Fig. 2), using airphotos and satellite images (Fig. 6) (Astakhov et al.,1999; Nikolskaya et al., 2002). These morphologicallyexpressed shorelines are discontinuous and accountfor only 25% of the perimeter of the lake, yet it issurprising that so much of a 90–80 kyr old shoreline ispreserved. The shoreline elevation ranges from 90 ma.s.l. in the south to 110 m in the north, reflecting alarger glacio-isostatic depression near the ice margin inthe north.
There are two main types of deposits reflecting theLake Komi shorelines. The first is from wave dominatedshores, including some river deltas. This type makes upthe long strandlines mapped by means of remotesensing, as mentioned above (Astakhov et al., 1999).Several exposures in this type of shoreline are docu-mented in Mangerud et al. (2001b), where 18 OSL datesare also reported. Although this is the most importanttype of shoreline for dating and reconstructing Lake
Komi (Mangerud et al., 2001a, b), it is not describedfurther here.
Ice marginal deltas constitute the other type ofdeposits and are important for correlating Lake Komiwith the damming ice margin. Our correlations betweenLake Komi and named ice marginal deposits havechanged over the last few years and therefore will bebriefly reviewed before we describe the deltas.
Astakhov et al. (1999), using satellite images and airphotos, mapped a 1200-km-long belt of fresh glaciallandscapes and end moraines more or less parallel to theBarents Sea coast. The belt consists of individualmorainic segments named from west-to-east the Varsh,Indiga, Markhida, Harbei, Halmer and Sopkay mor-aines. These were originally considered to be roughlycontemporaneous and their collective southern limit wasfor convenience called the Markhida Line (Mangerudet al., 1999). It was concluded that the ice sheet thatformed these moraines dammed Lake Komi. However,a number of new OSL dates from sediments below theMarkhida Moraine at its type site yielded ages in therange 80–55 ka (Henriksen et al., 2001). This ledMangerud et al. (2001b) to hypothesize that there hadbeen at least two ice advances, the oldest dammed LakeKomi 90–80 ka and the youngest formed the MarkhidaMoraine at its type site 60–50 ka. To account for the two
ARTICLE IN PRESS
Fig. 6. Aerial photo showing Lake Komi shorelines (arrows). The picture shows a long and narrow peninsula with a distinct shoreline on the left
(western) side where there was a long fetch. On the right side there was an embayment and the shoreline is less distinct and preserved only in the lower
half of the picture. For location see Astakhov et al. (1999).
J. Mangerud et al. / Quaternary Science Reviews 23 (2004) 1313–13321318
different groups of OSL ages we assume that thecorrelation of the Markhida Moraine with the Indiga–Varsh–Pyoza moraines in the west is valid (Lavrov,1977; Houmark-Nielsen et al., 2001), but that theMarkhida Moraine turns northward into the BarentsSea just east of the Pechora Valley (Fig. 5) (Svendsenet al., 2004). If this is correct, the eastern Harbei andHalmer moraines should not be correlated with the
60–50 ka Markhida Moraine, but represent the icemargin that dammed Lake Komi at 90–80 ka.
3.1.1. Ice marginal deltas
Some distinct marginal ridges of the Harbei morainesare found at the site Ileimusyur. Air photo studiesindicate that the ridges were glaciotectonically up-thrusted. Distal to the ridges there is a gently sloping
ARTICLE IN PRESS
105
100
95
90
85
80
River1 km
Harbei morainesat Ileimusyur
150
100
m a.s.l.
107
107
115
110
105
100
95
90
114
claysilt
sandgravel
claysilt
sandgravel
75± 4 70± 3
79± 5
78± 6
129±10
124± 9
OSL
57± 4
97± 7
81± 5
89± 6
m a.s.l.
m a.s.l.
Seyda 2a
Ileimusyur
90± 7
OSLTopset
Topset
77 ± 675 ± 6
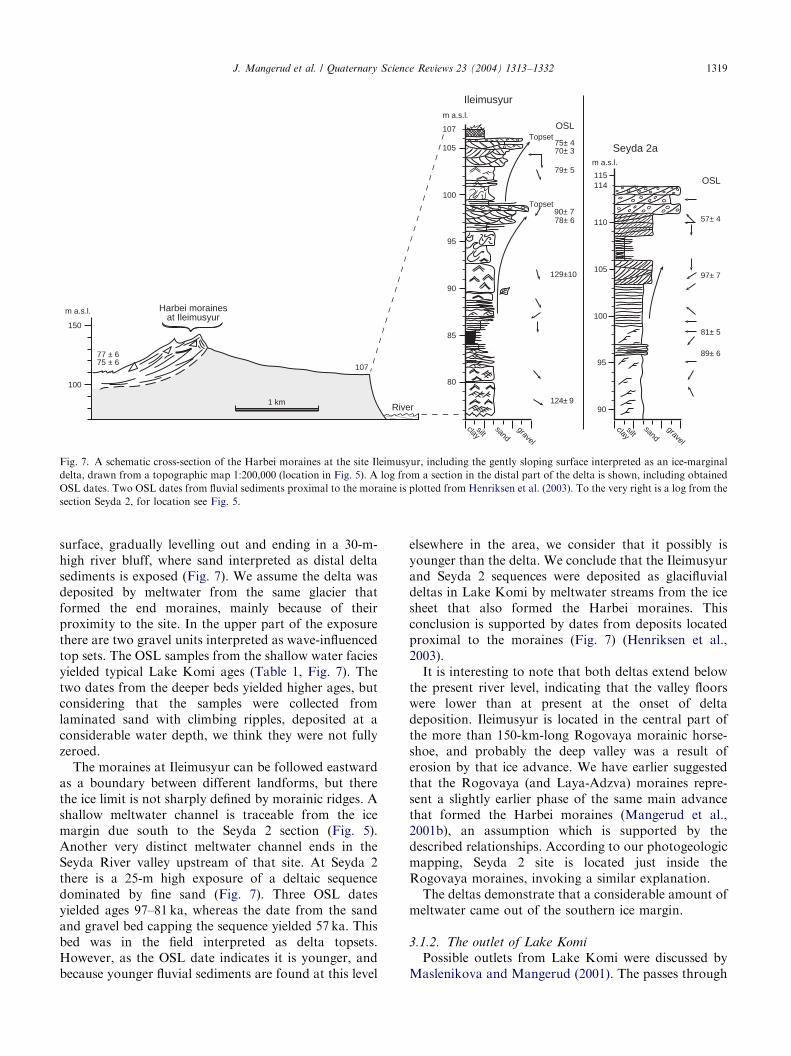
Fig. 7. A schematic cross-section of the Harbei moraines at the site Ileimusyur, including the gently sloping surface interpreted as an ice-marginal
delta, drawn from a topographic map 1:200,000 (location in Fig. 5). A log from a section in the distal part of the delta is shown, including obtained
OSL dates. Two OSL dates from fluvial sediments proximal to the moraine is plotted from Henriksen et al. (2003). To the very right is a log from the
section Seyda 2, for location see Fig. 5.
J. Mangerud et al. / Quaternary Science Reviews 23 (2004) 1313–1332 1319
surface, gradually levelling out and ending in a 30-m-high river bluff, where sand interpreted as distal deltasediments is exposed (Fig. 7). We assume the delta wasdeposited by meltwater from the same glacier thatformed the end moraines, mainly because of theirproximity to the site. In the upper part of the exposurethere are two gravel units interpreted as wave-influencedtop sets. The OSL samples from the shallow water faciesyielded typical Lake Komi ages (Table 1, Fig. 7). Thetwo dates from the deeper beds yielded higher ages, butconsidering that the samples were collected fromlaminated sand with climbing ripples, deposited at aconsiderable water depth, we think they were not fullyzeroed.
The moraines at Ileimusyur can be followed eastwardas a boundary between different landforms, but therethe ice limit is not sharply defined by morainic ridges. Ashallow meltwater channel is traceable from the icemargin due south to the Seyda 2 section (Fig. 5).Another very distinct meltwater channel ends in theSeyda River valley upstream of that site. At Seyda 2there is a 25-m high exposure of a deltaic sequencedominated by fine sand (Fig. 7). Three OSL datesyielded ages 97–81 ka, whereas the date from the sandand gravel bed capping the sequence yielded 57 ka. Thisbed was in the field interpreted as delta topsets.However, as the OSL date indicates it is younger, andbecause younger fluvial sediments are found at this level
elsewhere in the area, we consider that it possibly isyounger than the delta. We conclude that the Ileimusyurand Seyda 2 sequences were deposited as glacifluvialdeltas in Lake Komi by meltwater streams from the icesheet that also formed the Harbei moraines. Thisconclusion is supported by dates from deposits locatedproximal to the moraines (Fig. 7) (Henriksen et al.,2003).
It is interesting to note that both deltas extend belowthe present river level, indicating that the valley floorswere lower than at present at the onset of deltadeposition. Ileimusyur is located in the central part ofthe more than 150-km-long Rogovaya morainic horse-shoe, and probably the deep valley was a result oferosion by that ice advance. We have earlier suggestedthat the Rogovaya (and Laya-Adzva) moraines repre-sent a slightly earlier phase of the same main advancethat formed the Harbei moraines (Mangerud et al.,2001b), an assumption which is supported by thedescribed relationships. According to our photogeologicmapping, Seyda 2 site is located just inside theRogovaya moraines, invoking a similar explanation.
The deltas demonstrate that a considerable amount ofmeltwater came out of the southern ice margin.
3.1.2. The outlet of Lake Komi
Possible outlets from Lake Komi were discussed byMaslenikova and Mangerud (2001). The passes through
ARTICLE IN PRESS
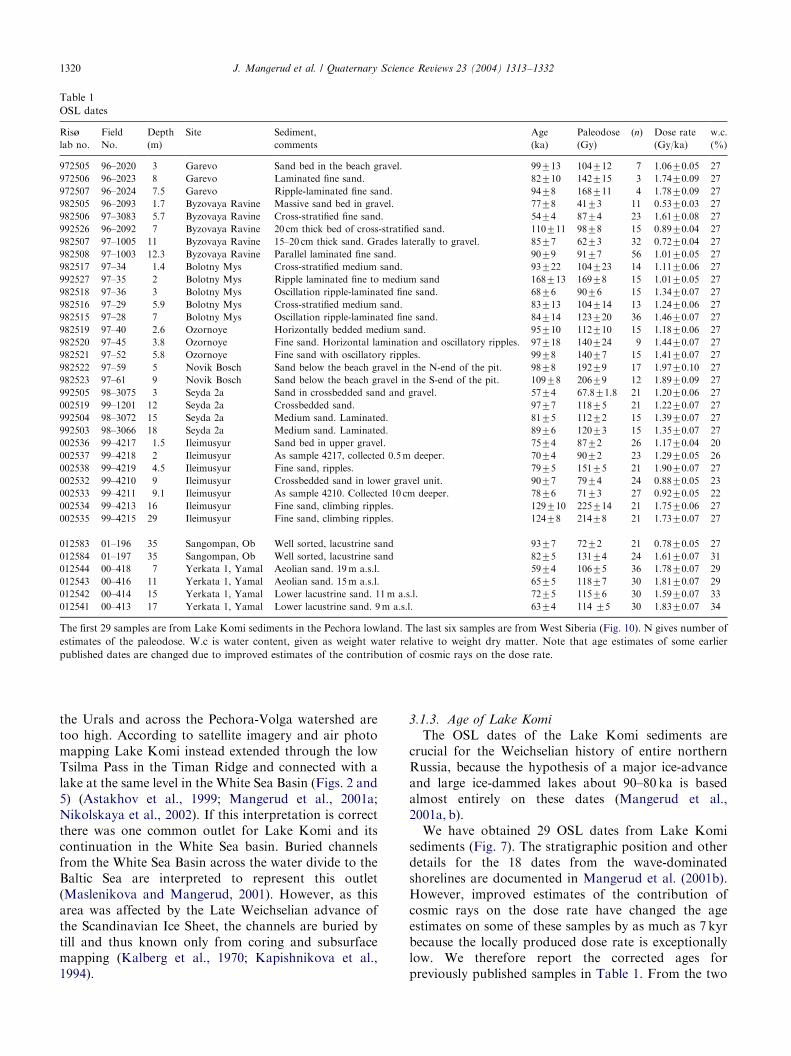
Table 1
OSL dates
Ris^
lab no.
Field
No.
Depth
(m)
Site Sediment,
comments
Age
(ka)
Paleodose
(Gy)
(n) Dose rate
(Gy/ka)
w.c.
(%)
972505 96–2020 3 Garevo Sand bed in the beach gravel. 99713 104712 7 1.0670.05 27
972506 96–2023 8 Garevo Laminated fine sand. 82710 142715 3 1.7470.09 27
972507 96–2024 7.5 Garevo Ripple-laminated fine sand. 9478 168711 4 1.7870.09 27
982505 96–2093 1.7 Byzovaya Ravine Massive sand bed in gravel. 7778 4173 11 0.5370.03 27
982506 97–3083 5.7 Byzovaya Ravine Cross-stratified fine sand. 5474 8774 23 1.6170.08 27
992526 96–2092 7 Byzovaya Ravine 20 cm thick bed of cross-stratified sand. 110711 9878 15 0.8970.04 27
982507 97–1005 11 Byzovaya Ravine 15–20 cm thick sand. Grades laterally to gravel. 8577 6273 32 0.7270.04 27
982508 97–1003 12.3 Byzovaya Ravine Parallel laminated fine sand. 9079 9177 56 1.0170.05 27
982517 97–34 1.4 Bolotny Mys Cross-stratified medium sand. 93722 104723 14 1.1170.06 27
992527 97–35 2 Bolotny Mys Ripple laminated fine to medium sand 168713 16978 15 1.0170.05 27
982518 97–36 3 Bolotny Mys Oscillation ripple-laminated fine sand. 6876 9076 15 1.3470.07 27
982516 97–29 5.9 Bolotny Mys Cross-stratified medium sand. 83713 104714 13 1.2470.06 27
982515 97–28 7 Bolotny Mys Oscillation ripple-laminated fine sand. 84714 123720 36 1.4670.07 27
982519 97–40 2.6 Ozornoye Horizontally bedded medium sand. 95710 112710 15 1.1870.06 27
982520 97–45 3.8 Ozornoye Fine sand. Horizontal lamination and oscillatory ripples. 97718 140724 9 1.4470.07 27
982521 97–52 5.8 Ozornoye Fine sand with oscillatory ripples. 9978 14077 15 1.4170.07 27
982522 97–59 5 Novik Bosch Sand below the beach gravel in the N-end of the pit. 9878 19279 17 1.9770.10 27
982523 97–61 9 Novik Bosch Sand below the beach gravel in the S-end of the pit. 10978 20679 12 1.8970.09 27
992505 98–3075 3 Seyda 2a Sand in crossbedded sand and gravel. 5774 67.871.8 21 1.2070.06 27
002519 99–1201 12 Seyda 2a Crossbedded sand. 9777 11875 21 1.2270.07 27
992504 98–3072 15 Seyda 2a Medium sand. Laminated. 8175 11272 15 1.3970.07 27
992503 98–3066 18 Seyda 2a Medium sand. Laminated. 8976 12073 15 1.3570.07 27
002536 99–4217 1.5 Ileimusyur Sand bed in upper gravel. 7574 8772 26 1.1770.04 20
002537 99–4218 2 Ileimusyur As sample 4217, collected 0.5m deeper. 7074 9072 23 1.2970.05 26
002538 99–4219 4.5 Ileimusyur Fine sand, ripples. 7975 15175 21 1.9070.07 27
002532 99–4210 9 Ileimusyur Crossbedded sand in lower gravel unit. 9077 7974 24 0.8870.05 23
002533 99–4211 9.1 Ileimusyur As sample 4210. Collected 10 cm deeper. 7876 7173 27 0.9270.05 22
002534 99–4213 16 Ileimusyur Fine sand, climbing ripples. 129710 225714 21 1.7570.06 27
002535 99–4215 29 Ileimusyur Fine sand, climbing ripples. 12478 21478 21 1.7370.07 27
012583 01–196 35 Sangompan, Ob Well sorted, lacustrine sand 9377 7272 21 0.7870.05 27
012584 01–197 35 Sangompan, Ob Well sorted, lacustrine sand 8275 13174 24 1.6170.07 31
012544 00–418 7 Yerkata 1, Yamal Aeolian sand. 19 m a.s.l. 5974 10675 36 1.7870.07 29
012543 00–416 11 Yerkata 1, Yamal Aeolian sand. 15 m a.s.l. 6575 11877 30 1.8170.07 29
012542 00–414 15 Yerkata 1, Yamal Lower lacustrine sand. 11 m a.s.l. 7275 11576 30 1.5970.07 33
012541 00–413 17 Yerkata 1, Yamal Lower lacustrine sand. 9 m a.s.l. 6374 114 75 30 1.8370.07 34
The first 29 samples are from Lake Komi sediments in the Pechora lowland. The last six samples are from West Siberia (Fig. 10). N gives number of
estimates of the paleodose. W.c is water content, given as weight water relative to weight dry matter. Note that age estimates of some earlier
published dates are changed due to improved estimates of the contribution of cosmic rays on the dose rate.
J. Mangerud et al. / Quaternary Science Reviews 23 (2004) 1313–13321320
the Urals and across the Pechora-Volga watershed aretoo high. According to satellite imagery and air photomapping Lake Komi instead extended through the lowTsilma Pass in the Timan Ridge and connected with alake at the same level in the White Sea Basin (Figs. 2 and5) (Astakhov et al., 1999; Mangerud et al., 2001a;Nikolskaya et al., 2002). If this interpretation is correctthere was one common outlet for Lake Komi and itscontinuation in the White Sea basin. Buried channelsfrom the White Sea Basin across the water divide to theBaltic Sea are interpreted to represent this outlet(Maslenikova and Mangerud, 2001). However, as thisarea was affected by the Late Weichselian advance ofthe Scandinavian Ice Sheet, the channels are buried bytill and thus known only from coring and subsurfacemapping (Kalberg et al., 1970; Kapishnikova et al.,1994).
3.1.3. Age of Lake Komi
The OSL dates of the Lake Komi sediments arecrucial for the Weichselian history of entire northernRussia, because the hypothesis of a major ice-advanceand large ice-dammed lakes about 90–80 ka is basedalmost entirely on these dates (Mangerud et al.,2001a, b).
We have obtained 29 OSL dates from Lake Komisediments (Fig. 7). The stratigraphic position and otherdetails for the 18 dates from the wave-dominatedshorelines are documented in Mangerud et al. (2001b).However, improved estimates of the contribution ofcosmic rays on the dose rate have changed the ageestimates on some of these samples by as much as 7 kyrbecause the locally produced dose rate is exceptionallylow. We therefore report the corrected ages forpreviously published samples in Table 1. From the two
ARTICLE IN PRESS
100 ka
80 ka
128 Il122 Il
109 N
168 Bol
110 By68 Bol
54 By
260
240
220
200
180
160
140
120
100
80
60
40
20
00.0 0.2 0.4 0.6 0.8 1.0 1.2 1.4 1.6 1.8 2.0 2.2
Present dose rate, Gy/kyr
Pal
eodo
se, G
y
280
50 100 150Age groups (ka)
0
1
2
3
4
5
Sam
ples
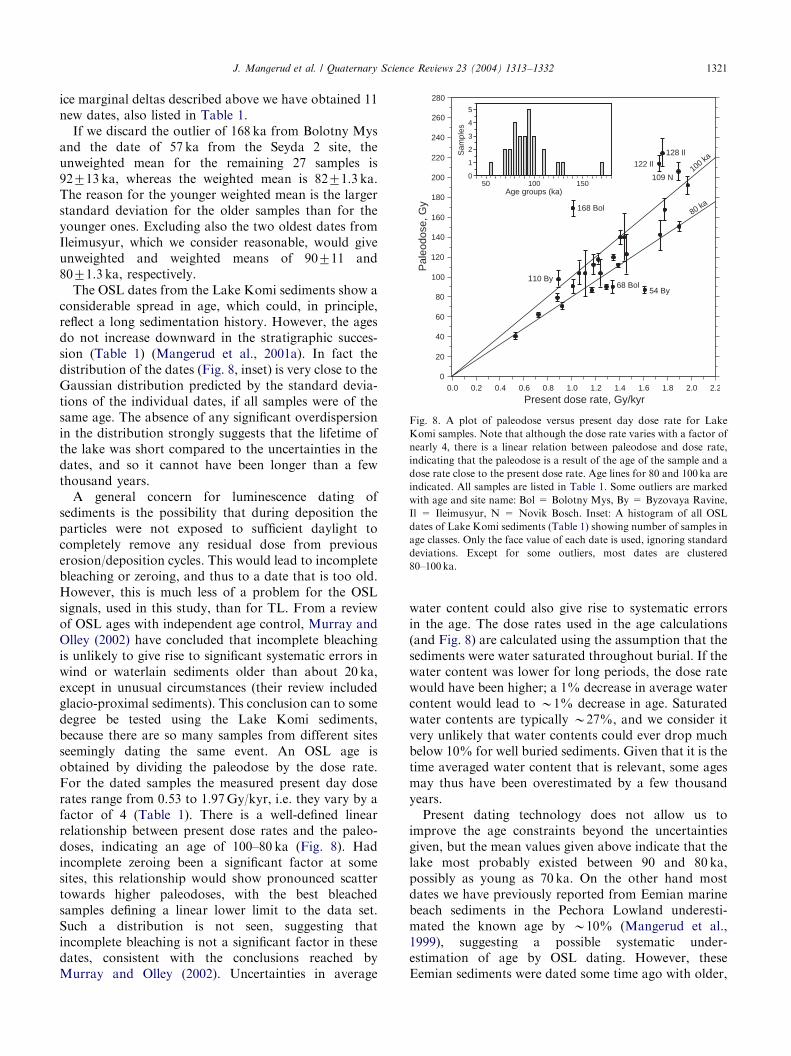
Fig. 8. A plot of paleodose versus present day dose rate for Lake
Komi samples. Note that although the dose rate varies with a factor of
nearly 4, there is a linear relation between paleodose and dose rate,
indicating that the paleodose is a result of the age of the sample and a
dose rate close to the present dose rate. Age lines for 80 and 100ka are
indicated. All samples are listed in Table 1. Some outliers are marked
with age and site name: Bol = Bolotny Mys, By = Byzovaya Ravine,
Il = Ileimusyur, N = Novik Bosch. Inset: A histogram of all OSL
dates of Lake Komi sediments (Table 1) showing number of samples in
age classes. Only the face value of each date is used, ignoring standard
deviations. Except for some outliers, most dates are clustered
80–100 ka.
J. Mangerud et al. / Quaternary Science Reviews 23 (2004) 1313–1332 1321
ice marginal deltas described above we have obtained 11new dates, also listed in Table 1.
If we discard the outlier of 168 ka from Bolotny Mysand the date of 57 ka from the Seyda 2 site, theunweighted mean for the remaining 27 samples is92713 ka, whereas the weighted mean is 8271.3 ka.The reason for the younger weighted mean is the largerstandard deviation for the older samples than for theyounger ones. Excluding also the two oldest dates fromIleimusyur, which we consider reasonable, would giveunweighted and weighted means of 90711 and8071.3 ka, respectively.
The OSL dates from the Lake Komi sediments show aconsiderable spread in age, which could, in principle,reflect a long sedimentation history. However, the agesdo not increase downward in the stratigraphic succes-sion (Table 1) (Mangerud et al., 2001a). In fact thedistribution of the dates (Fig. 8, inset) is very close to theGaussian distribution predicted by the standard devia-tions of the individual dates, if all samples were of thesame age. The absence of any significant overdispersionin the distribution strongly suggests that the lifetime ofthe lake was short compared to the uncertainties in thedates, and so it cannot have been longer than a fewthousand years.
A general concern for luminescence dating ofsediments is the possibility that during deposition theparticles were not exposed to sufficient daylight tocompletely remove any residual dose from previouserosion/deposition cycles. This would lead to incompletebleaching or zeroing, and thus to a date that is too old.However, this is much less of a problem for the OSLsignals, used in this study, than for TL. From a reviewof OSL ages with independent age control, Murray andOlley (2002) have concluded that incomplete bleachingis unlikely to give rise to significant systematic errors inwind or waterlain sediments older than about 20 ka,except in unusual circumstances (their review includedglacio-proximal sediments). This conclusion can to somedegree be tested using the Lake Komi sediments,because there are so many samples from different sitesseemingly dating the same event. An OSL age isobtained by dividing the paleodose by the dose rate.For the dated samples the measured present day doserates range from 0.53 to 1.97 Gy/kyr, i.e. they vary by afactor of 4 (Table 1). There is a well-defined linearrelationship between present dose rates and the paleo-doses, indicating an age of 100–80 ka (Fig. 8). Hadincomplete zeroing been a significant factor at somesites, this relationship would show pronounced scattertowards higher paleodoses, with the best bleachedsamples defining a linear lower limit to the data set.Such a distribution is not seen, suggesting thatincomplete bleaching is not a significant factor in thesedates, consistent with the conclusions reached byMurray and Olley (2002). Uncertainties in average
water content could also give rise to systematic errorsin the age. The dose rates used in the age calculations(and Fig. 8) are calculated using the assumption that thesediments were water saturated throughout burial. If thewater content was lower for long periods, the dose ratewould have been higher; a 1% decrease in average watercontent would lead to B1% decrease in age. Saturatedwater contents are typically B27%, and we consider itvery unlikely that water contents could ever drop muchbelow 10% for well buried sediments. Given that it is thetime averaged water content that is relevant, some agesmay thus have been overestimated by a few thousandyears.
Present dating technology does not allow us toimprove the age constraints beyond the uncertaintiesgiven, but the mean values given above indicate that thelake most probably existed between 90 and 80 ka,possibly as young as 70 ka. On the other hand mostdates we have previously reported from Eemian marinebeach sediments in the Pechora Lowland underesti-mated the known age by B10% (Mangerud et al.,1999), suggesting a possible systematic under-estimation of age by OSL dating. However, theseEemian sediments were dated some time ago with older,
ARTICLE IN PRESSJ. Mangerud et al. / Quaternary Science Reviews 23 (2004) 1313–13321322
less well-developed techniques; we are now in theprocess of dating a number of recently collected Eemianbeach samples using the techniques used in this paper, asa test of the accuracy of the present method.
3.2. The White Sea Basin
The reconstruction of a large ice-dammed lake in theWhite Sea Basin at 90–80 ka is controversial. The‘‘QUEEN-team’’ that worked along the major riverseast of the White Sea maintains that no large lakeexisted at that time (Houmark-Nielsen et al., 2001; Lys(aet al., 2001; Kjær et al., 2002). They describe glacilacus-trine sediments below till along Pyoza, an easterntributary to Mezen River (Fig. 1), OSL-dated to 110–90 ka, which they consider could have been deposited ina lake dammed by the ice sheet which dammed LakeKomi (Houmark-Nielsen et al., 2001). However, theyconclude the lake was restricted to the upper part of thePyoza River valley.
On the other hand, as mentioned above, the‘‘QUEEN-team’’ that worked in the Pechora Basin usedair photoes to map Lake Komi shorelines through theTsilma Pass in the Timan Ridge (Figs. 2 and 5)(Astakhov et al., 1999; Nikolskaya et al., 2002). Theimplication is that a lake existed at the same level in theWhite Sea Basin. On the west side of the Timan Ridgethe shorelines and sediments were probably destroyedby an ice advance that reached the Syurzi moraines, asdiscussed below (Fig. 5).
Although the Scandinavian Ice Sheet intruded intothe eastern White Sea during the Late Weichselian anderoded most of the underlying pre-Late Weichseliansediments, there are a number of sites where Eemian andEarly to Middle Weichselian sediments are preserved onthe Kola Peninsula. This is particularly the case alongthe coast of the White Sea where Eemian marine mudwith in situ shells, traditionally related to the BorealTransgression, serves as a stratigraphical marker hor-izon (Ikonen and Ekman, 2001, and references therein).
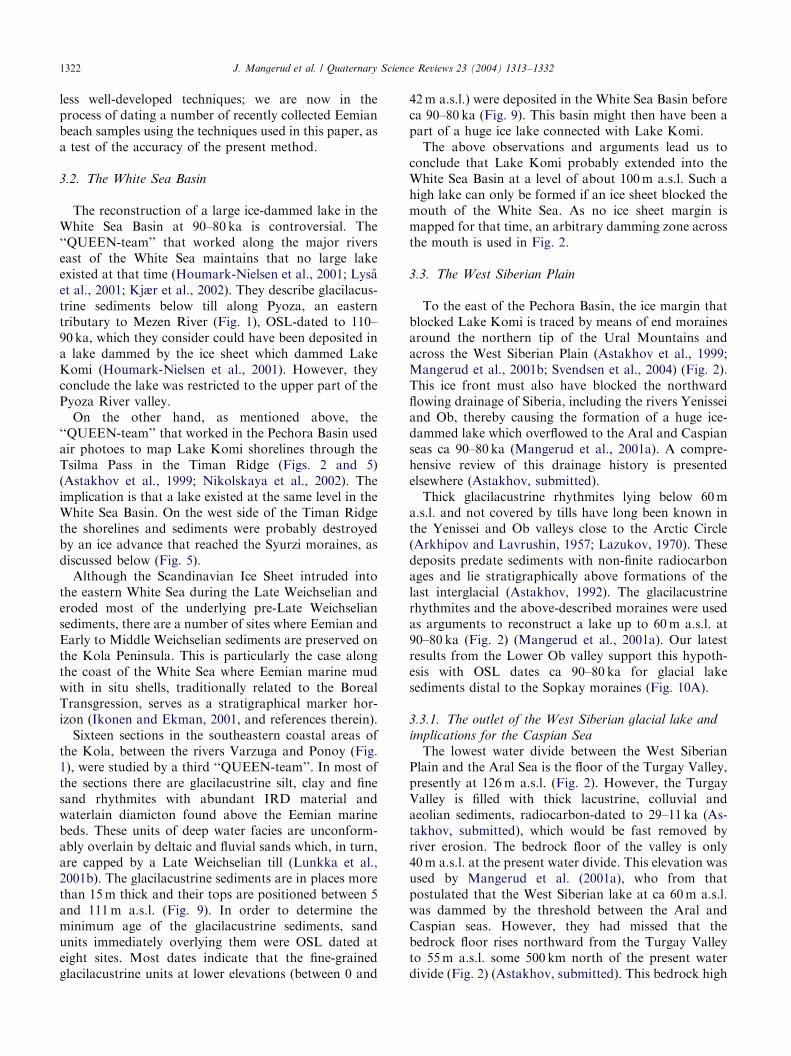
Sixteen sections in the southeastern coastal areas ofthe Kola, between the rivers Varzuga and Ponoy (Fig.1), were studied by a third ‘‘QUEEN-team’’. In most ofthe sections there are glacilacustrine silt, clay and finesand rhythmites with abundant IRD material andwaterlain diamicton found above the Eemian marinebeds. These units of deep water facies are unconform-ably overlain by deltaic and fluvial sands which, in turn,are capped by a Late Weichselian till (Lunkka et al.,2001b). The glacilacustrine sediments are in places morethan 15 m thick and their tops are positioned between 5and 111 m a.s.l. (Fig. 9). In order to determine theminimum age of the glacilacustrine sediments, sandunits immediately overlying them were OSL dated ateight sites. Most dates indicate that the fine-grainedglacilacustrine units at lower elevations (between 0 and
42 m a.s.l.) were deposited in the White Sea Basin beforeca 90–80 ka (Fig. 9). This basin might then have been apart of a huge ice lake connected with Lake Komi.
The above observations and arguments lead us toconclude that Lake Komi probably extended into theWhite Sea Basin at a level of about 100 m a.s.l. Such ahigh lake can only be formed if an ice sheet blocked themouth of the White Sea. As no ice sheet margin ismapped for that time, an arbitrary damming zone acrossthe mouth is used in Fig. 2.
3.3. The West Siberian Plain
To the east of the Pechora Basin, the ice margin thatblocked Lake Komi is traced by means of end morainesaround the northern tip of the Ural Mountains andacross the West Siberian Plain (Astakhov et al., 1999;Mangerud et al., 2001b; Svendsen et al., 2004) (Fig. 2).This ice front must also have blocked the northwardflowing drainage of Siberia, including the rivers Yenisseiand Ob, thereby causing the formation of a huge ice-dammed lake which overflowed to the Aral and Caspianseas ca 90–80 ka (Mangerud et al., 2001a). A compre-hensive review of this drainage history is presentedelsewhere (Astakhov, submitted).
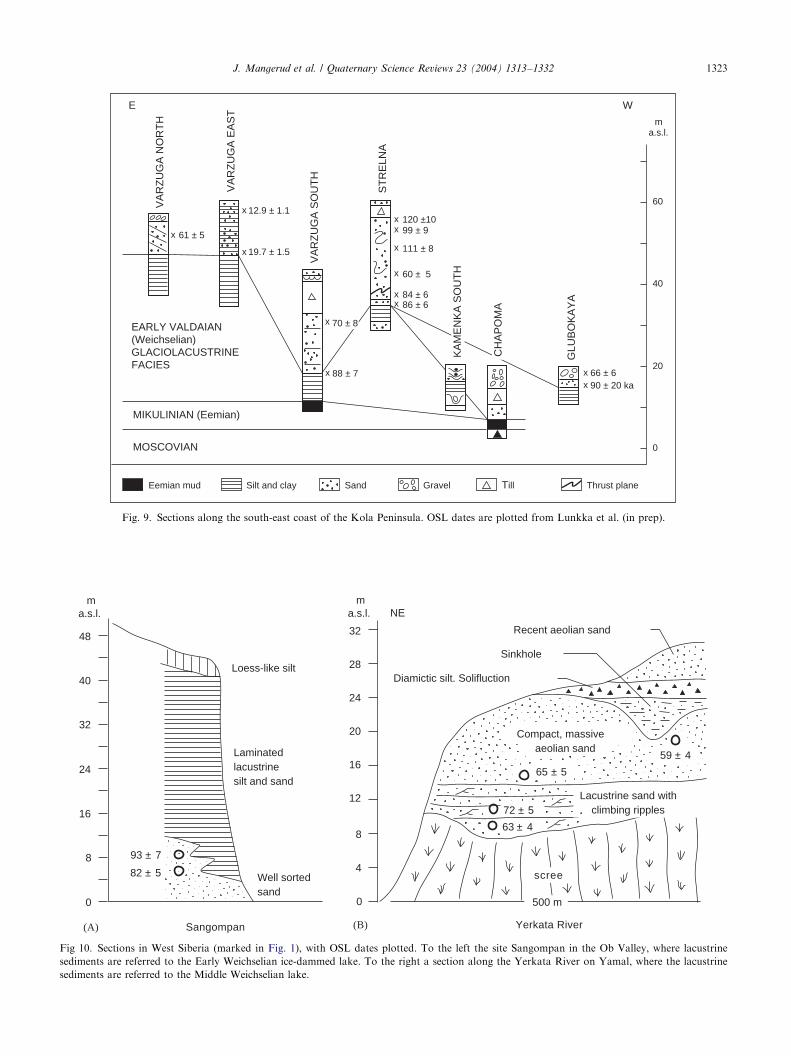
Thick glacilacustrine rhythmites lying below 60 ma.s.l. and not covered by tills have long been known inthe Yenissei and Ob valleys close to the Arctic Circle(Arkhipov and Lavrushin, 1957; Lazukov, 1970). Thesedeposits predate sediments with non-finite radiocarbonages and lie stratigraphically above formations of thelast interglacial (Astakhov, 1992). The glacilacustrinerhythmites and the above-described moraines were usedas arguments to reconstruct a lake up to 60 m a.s.l. at90–80 ka (Fig. 2) (Mangerud et al., 2001a). Our latestresults from the Lower Ob valley support this hypoth-esis with OSL dates ca 90–80 ka for glacial lakesediments distal to the Sopkay moraines (Fig. 10A).
3.3.1. The outlet of the West Siberian glacial lake and
implications for the Caspian Sea
The lowest water divide between the West SiberianPlain and the Aral Sea is the floor of the Turgay Valley,presently at 126 m a.s.l. (Fig. 2). However, the TurgayValley is filled with thick lacustrine, colluvial andaeolian sediments, radiocarbon-dated to 29–11 ka (As-takhov, submitted), which would be fast removed byriver erosion. The bedrock floor of the valley is only40 m a.s.l. at the present water divide. This elevation wasused by Mangerud et al. (2001a), who from thatpostulated that the West Siberian lake at ca 60 m a.s.l.was dammed by the threshold between the Aral andCaspian seas. However, they had missed that thebedrock floor rises northward from the Turgay Valleyto 55 m a.s.l. some 500 km north of the present waterdivide (Fig. 2) (Astakhov, submitted). This bedrock high
ARTICLE IN PRESS
61 ± 5
12.9 ± 1.1
19.7 ± 1.5
x
x
x
88 ± 7
x
x
60 ± 5 x
84 ± 6 xx
120 ±10 x99 ± 9 x
111 ± 8x
86 ± 6
66 ± 6 xx 90 ± 20 ka
EARLY VALDAIAN (Weichselian)GLACIOLACUSTRINEFACIES
70 ± 8
MIKULINIAN (Eemian)
MOSCOVIAN
60
40
20
0
Eemian mud Silt and clay Sand Gravel Till Thrust plane
ma.s.l.
VA
RZ
UG
A N
OR
TH
VA
RZ
UG
A E
AS
T
VA
RZ
UG
A S
OU
TH
ST
RE
LNA
KA
ME
NK
A S
OU
TH
CH
AP
OM
A
GLU
BO
KA
YA
E W
Fig. 9. Sections along the south-east coast of the Kola Peninsula. OSL dates are plotted from Lunkka et al. (in prep).
Compact, massiveaeolian sand
ma.s.l.
48
32
24
16
8
0
40
(A) Sangompan (B) Yerkata River
93 ± 7
82 ± 5
Loess-like silt
Laminatedlacustrinesilt and sand
Well sortedsand
72 ± 5
63 ± 4
500 m
65 ± 5
59 ± 4
scree
Recent aeolian sand
Diamictic silt. Solifluction
Sinkhole
Lacustrine sand withclimbing ripples
32
28
24
20
16
12
8
4
0
ma.s.l. NE
Fig 10. Sections in West Siberia (marked in Fig. 1), with OSL dates plotted. To the left the site Sangompan in the Ob Valley, where lacustrine
sediments are referred to the Early Weichselian ice-dammed lake. To the right a section along the Yerkata River on Yamal, where the lacustrine
sediments are referred to the Middle Weichselian lake.
J. Mangerud et al. / Quaternary Science Reviews 23 (2004) 1313–1332 1323
ARTICLE IN PRESSJ. Mangerud et al. / Quaternary Science Reviews 23 (2004) 1313–13321324
probably acted as the dam for the West Siberian glaciallake. From there the water spilled over to the Aral Seabasin and subsequently to the Caspian Sea along thetoday dry Uzboy channel (Fig. 2).
An overflow from the ice-dammed lake must haveinfluenced the level of the Caspian Sea, as discussed byMangerud et al. (2001a). Its present level is �28 m, andthe altitude of the Manych Pass to the Black Sea is+26 m a.s.l. This latter level does, however, relate to theoverflow during the Late Weichselian (Leonov et al.,2002), whereas elevations and ages of older overflowsare still poorly known (Zubakov, 1992; Mangerud et al.,2001a).
3.4. Taimyr
The Late Pleistocene glacial maximum on the TaimyrPeninsula occurred in the Early Weichselian. TheBarents–Kara Ice Sheet then penetrated 200–250 kmsouth of the Byrranga Mountains, to reach the centralparts of the North Siberian Lowland (Kind and Leonov,1982; Hjort et al., 2004; Svendsen et al., 2004).
When the ice front had retreated to the north ofthe Byrranga Mountains a glacial lake, dammed by theice-front, filled the valleys of the Lower TaimyraRiver and its tributaries. In the beginning the seamight have briefly inundated these valleys, enteringthrough the Byrrangas from the south. The ice frontreached a new grounding-line at the North Taimyrice-marginal zone (NTZ) (Kind and Leonov, 1982;Isayeva, 1984; Alexanderson et al., 2001, 2002).The shoreline was then at 140–120 m a.s.l., as docu-mented by wave cut terraces and deltas along the endmoraines. This lake has been OSL-dated by two samplesfrom an ice-contact fluvial deposit, to ca 80 ka(Alexanderson et al., 2001; Svendsen et al., 2004).Glaciolacustrine sediments, often varved, are widelydistributed distally to the deltas, indicating a fresh-waterregime during the main part of this event (Alexandersonet al., 2001, 2002).
The north-directed normal drainage was reversed andthe water from the glacial lake drained southwardthrough the Byrranga Mountains into the Lake Taimyrbasin (Alexanderson et al., 2001). Its onward route fromthere is not yet known, but probably it flowed across thethreshold between the Lake Taimyr basin and theLaptev Sea, presently between 60 and 70 m a.s.l. Theheight difference between the mapped shoreline and thisthreshold is probably at least partly an effect ofglacioisostatic recovery.
Glacilacustrine sediments aged 80–70 ka are foundalong the present Kara Sea coast north of the TaimyraRiver mouth (Funder et al., 1999). This is ca 100 km up-ice from the NTZ and these deposits probably derivefrom glacial damming during the further retreat of theice front.
4. Middle Weichselian Lakes and rerouting of rivers
4.1. The White Sea Basin
The southernmost Weichselian ice limit in the WhiteSea Basin is probably the Syurzi moraines (Fig. 5)(Lavrov, 1975, 1977; Lavrov et al., 1991; Svendsen et al.,2004). The configuration of these moraines indicatesthey were deposited by ice flow upslope from NW, i.e.by the Barents Ice Sheet (Chebotareva, 1977; Lavrov,1977; Nikolskaya et al., 2002), and not by a local Timanice cap as suggested by Demidov et al. (2004). This icesheet dammed lakes as high as 145 m a.s.l. in the upperMezen Valley (Lavrov, 1975; Demidov et al., 2004).When the ice margin retreated from the Syurzi morainestoward north, there was probably a large ice-dammedlake in front of it. According to the stratigraphy givenby Houmark-Nielsen et al. (2001) and Kjær et al. (2002)this must have happened in the early Middle Weichse-lian. Therefore, the strandlines observable on air photoswest of the Timan Ridge at approximately the sameelevation as Lake Komi (Astakhov, 1999) should beyounger than Lake Komi, in contrast to the correlationof Mangerud et al. (2001a). Their age probablycorresponds to the age of glacilacustrine sedimentsalong the Pyoza River, OSL-dated to 70–60 kaif some outliers are excluded (Houmark-Nielsen et al.,2001).
The Varsh–Pyoza moraines (Fig. 5), correlated withthe Markhida Moraine in the Pechora Lowland(Lavrov, 1977; Astakhov et al., 1999; Houmark-Nielsenet al., 2001; Nikolskaya et al., 2002), are located to thenorth of, and are younger than, the Syurzi moraines.Farther west the Pyoza moraines are obliterated by theLate Weichselian advance of the Scandinavian IceSheet, but probably the Barents–Kara Ice Sheet at thattime blocked the White Sea entrance (Demidov et al.,2004).
Along the southern coast of the Kola Peninsula twosites are known where delta foresets and distal foresetsands of Middle Weichselian age are preserved (Lunkkaet al., 2001b). At the Ust Pyalka site climbing ripple andcross-bedded cosets of sand, overlying glacilacustrinesilt at around 110 m a.s.l., were OSL dated to 55 ka. Inaddition, in the Varzuga area delta foreset beds at 50–60 m a.s.l. yielded an age of 60 ka, whereas more distalforeset beds were dated to 68 ka (Fig. 9). There are alsoother sand units that have yielded Middle Weichselianages, but their stratigraphical position remainsunclear due to deformation by Late Weichselian iceadvances.
The ice-sheet reconstructions and OSL dates ofglacilacustrine sediments imply that a glacial lakeexisted in the White Sea Basin at least once during theMiddle Weichselian. In the Tsilma Pass (Fig. 5) there isa narrow channel cut into the wider strait formed by the
ARTICLE IN PRESSJ. Mangerud et al. / Quaternary Science Reviews 23 (2004) 1313–1332 1325
Lake Komi shorelines. This channel was formed by anoverflow from west towards east (Nikolskaya et al.,2002) and is the most probable candidate for the outletof the Middle Weichselian lake.
4.2. The Pechora Lowland
The ice sheet that formed the Markhida Moraineacross the Pechora River Valley probably dammed anarrow lake that filled the valley south of the moraine.The only candidate so far for the sediment from this lakeis the black clay on the Sula River at 30–55 a.s.l. whichoverlie terrestrial sand with OSL ages of 74–53 kaobtained by older techniques (Mangerud et al., 1999).A flat sandy depression that could have acted as anoutflow channel is identified east of the PechoraValley (Nikolskaya et al., 2002). The highest thresholdof this depression is 60–70 m a.s.l., and an overflowwould have been directed to the eastern PechoraSea and farther to the Kara Sea. A lake of this elevationwould be restricted to the lower part of the PechoraValley.
4.3. The Kara Sea and the West Siberian Plain
If the reconstructed ice-sheet configuration is correct(Fig. 3), it would imply an ice-dammed lake in thesouthern part of the Kara Sea, penetrating into the low-lying parts of the plain. The only potential outlet leadseastward across the North Siberian Lowland to theLaptev Sea (Fig. 3), but the location of an overflowchannel is unknown to us. According to the GLOBEdigital terrain model the lowest water divide is between40 and 50 m a.s.l. As a hypothesis to test in the future,we have constructed a lake at 45 m a.s.l. (Fig. 3).Sediments that we believe were deposited in this lake arefound in a section along the Yerkata River on southernYamal. Here lacustrine sand is OSL dated to 72–63 ka,an age supported by OSL dates at 65–59 ka from theoverlying aeolian sand (Fig. 10B).
4.4. Taimyr
During the Middle Weichselian the Barents–Kara IceSheet again reached the NTZ and cut off the normalnorthward drainage of the Taimyra River. Glacial lakeswere dammed in the lower reaches of that river and itstributaries. As during the preceding stage, the waterdrained southward into the Lake Taimyr basin. Ice-front deltas and more distal shorelines document a lakelevel not higher than 80 m a.s.l. It is dated to ca 60 ka by7 OSL dates (Alexanderson et al., 2001, 2002; Svendsenet al., 2004). In the map (Fig. 3) this lake is connectedwith the above-discussed reservoir of West Siberia at45 m a.s.l.
5. Late Weichselian Lakes and rerouting of rivers
5.1. Taimyr
No ice-dammed lakes have been documented alongthe Last Glacial Maximum (LGM) ice margin on theTaimyr Peninsula. However, such lakes might haveexisted in the lowest parts of the river valleys. Thereconstructed ice sheet (Fig. 4) must have reversed thedrainage pattern, again leading to an outflow southwardthrough the Taimyra River Valley into the Lake Taimyrbasin. This is probably reflected by an increase in bothwater level and rate of lacustrine sedimentation in theLake Taimyr basin around 19 ka (M .oller et al., 1999;Niessen et al., 1999). The further course of the spillwayis not documented, but the 25 m a.s.l. threshold to thePyasina River basin is a likely candidate for an outlet tothe west.
5.2. Did the Barents–Kara Ice Sheet dam any major lake?
The extent of the Barents–Kara Ice Sheet is notconfidently mapped in the eastern part of the Kara Sea.We find it most probable that the extent of the LGM icewas limited and therefore allowed rivers to freelydischarge into the Arctic Ocean along the easternmargin (Stein et al., 2002; Svendsen et al., 2004). Analternative hypothesis visualises a narrow ice damacross the northern Kara Sea that extended onto theTaimyr Peninsula (Fig. 4) (Alexanderson et al., 2001,2002; Polyak et al., 2002). The latter would imply atleast a temporary blockade of the drainage with an ice-dammed lake formed in the Kara Sea south of the dam.Sediments supporting this hypothesis are possibly foundon the floor of the Kara Sea (Polyak et al., 2002).
No lacustrine sediments of LGM age are reportedfrom sites above present sea level along the shores of theKara or Pechora seas. Instead, thick coarse silts withsyngenetic ice wedges of LGM age are described downto sea level on the Yamal Peninsula (Vasil’chuk et al.,1984, 2000). These ‘‘Yedoma-type’’ sediments are mostlikely ice-rich aeolian silt (Astakhov, 1992). Further-more in central West Siberia only loess-like siltschanging laterally into thaw-lake sediments are recog-nised in Late Weichselian sediments below 40 m a.s.l.(Astakhov, 1992). On the Barents Sea coast of thePechora Lowland aeolian sand, OSL-dated to about21 ka, occur down to present-day sea level (Mangerudet al., 1999, 2002). Bottom silts of the Yenissei Estuaryyielded a wide range of AMS dates from 20 ka to thepresent (Kuptsov and Lisitsyn, 2001).
5.3. The eastern flank of the Scandinavian Ice Sheet
The palaeohydrology during the Late Weichselianwas dramatically different from that of the Early and

ARTICLE IN PRESSJ. Mangerud et al. / Quaternary Science Reviews 23 (2004) 1313–13321326
Middle Weichselian in northern Russia-Siberia. TheBarents–Kara Ice Sheet did not at this time block thenorthbound Russian rivers (Fig. 4). However, theScandinavian Ice Sheet attained its greatest extentduring the Late Weichselian at ca 18–17 ka (OSL datesand thus calendar yrs), and glacial lakes extended some500 km along the ice margin (Fig. 4). These lakes, ofwhich the highest shorelines today are at 130 m a.s.l.,drained to Volga and eventually into the Caspian Sea(Kvasov, 1979; Lunkka et al., 2001a). A main transgres-sion and overflow of the Caspian Sea is dated to about19–17 ka (16–14 ka 14C-years) (Leonov et al., 2002).
When the Scandinavian Ice Sheet started to retreatfrom its Late Weichselian maximum position at ca 17–15 ka, a new series of short-lived glacial lakes wasformed along its margin. The palaeohydrology wasconvincingly worked out by Kvasov (1979), but timingof the events was uncertain. Based on the position of theice margin during the Vepsian and Luga stages, it issuggested that the meltwater first drained through thesouthern Peribaltic area toward central Poland and via‘‘Urstromt.aler’’ to the Elbe River. At about 16–15 ka(this and younger ages partly based on varve chronol-ogy) the ice margin had retreated so far that the waterdrained into the southern part of the Baltic Basin. Whenthe ice retreated from the Luga moraines at ca 14.2 ka aninitial Baltic Ice Lake was formed in the southern part ofthe basin, shown in Fig. 4. An ice-dammed lake knownas the Privalday Lake, which occupied extensive areassouth of Lake Ladoga and Gulf of Finland, drained tothis Baltic Ice Lake across southern Estonia and centralLatvia (Fig. 4).
An ice lake in the Onega basin existed between 14.4and 12.9 ka (Saarnisto and Saarinen, 2001). It wasmainly fed by meltwater from the east where the VodlaRiver drained extensive ice-dammed lakes. The outlet ofthe Onega glacial lake was across the Onega–Ladogaisthmus into the Baltic (Fig. 4). This lake phaseterminated when the ice lake emptied to the White Seabasin, following the retreat of the ice margin in thenorth. The current outlet of Lake Onega, River Svir,towards Lake Ladoga and the Baltic, originated more
Table 2
Some properties of the paleolakes
Ice dammed lakes Lake level (m a.s.l.)
Lake Komi in the Pechora Lowland, 90–80 ka 110–90
White Sea Basin, 90–80 ka 100
West Siberian Plain, 90–80 ka 60
Taimyr, 80 ka 140
Total 90–80 ka
West Siberian Plain, 60–50 ka 45
Taimyr, 60 ka 80
Lake level is given relative to present day sea level. The numbers for the 90–8
Siberian lake at 60–50 is calculated here, and the numbers for the Taimyr la
postulate a lake at 60–50 ka of the same magnitude as at 90–80 ka.
than 10.5 ka (Saarnisto et al., 1995). During the entireLate Weichselian the Onega basin remained above sealevel and thus no sea connection existed between theWhite Sea and the Baltic basins (Saarnisto et al., 1995),contrary to interpretations of some earlier workers(Sauramo, 1958).
5.4. Areas and volumes of the lakes
The areas and volumes of the main paleolakesdiscussed above are given in Table 2. The numbers arecalculated for the outermost ice-front position accordingto the maps (Figs. 2 and 3). During ice-marginwithdrawal, the areas and volumes of the lakes probablyincreased considerably as the lake followed the retreat-ing ice margin. Therefore, estimating an impact of thewater outburst, the volumes in Table 2 should rather betaken as minimal.
5.5. Modelling the outburst of the ice-dammed lakes
We have modelled the outburst of Lake Komibecause we consider it the best mapped and dated ofthe ice-dammed lakes discussed in this paper. However,we consider that the results can be qualitatively appliedalso for the other lakes. Estimates of the magnitude ofthe final outburst flood from Lake Komi have beenobtained by applying the physically based outburstflood model described by Clarke (2003). The modelassumes that the flood is released through a subglacialtunnel in a similar manner to modern outbursts such asthose from the Gr!ımsv .otn reservoir in Iceland (Bj-.ornsson, 2002) and is a reworking of the Spring andHutter (1981) generalisation of Nye’s (1976) theory. Themodel simulates the spatio-temporal evolution of waterpressure, water velocity, water temperature and cross-sectional area of a semi-circular drainage conduit fed byan upstream reservoir. Many of the model inputscorrespond to well-known physical properties of iceand water (Clarke, 2003). The main sources ofuncertainty in the model are lake geometry, subglacialflood routing, lake level relative to sea level at the time
Area (� 1000 km2) Volume (� 1000km3) Average depth (m)
76 2.4 32
218 15 69
610 15 24
45 2 45
34.2
881 32 36
17 0.4 25
0ka lakes are from Mangerud et al. (2001a). The numbers for the West
kes are from Alexanderson et al. (2001). For the White Sea Basin we
ARTICLE IN PRESSJ. Mangerud et al. / Quaternary Science Reviews 23 (2004) 1313–1332 1327
of the flood, water temperature in the lake and hydraulicroughness of the drainage channel.
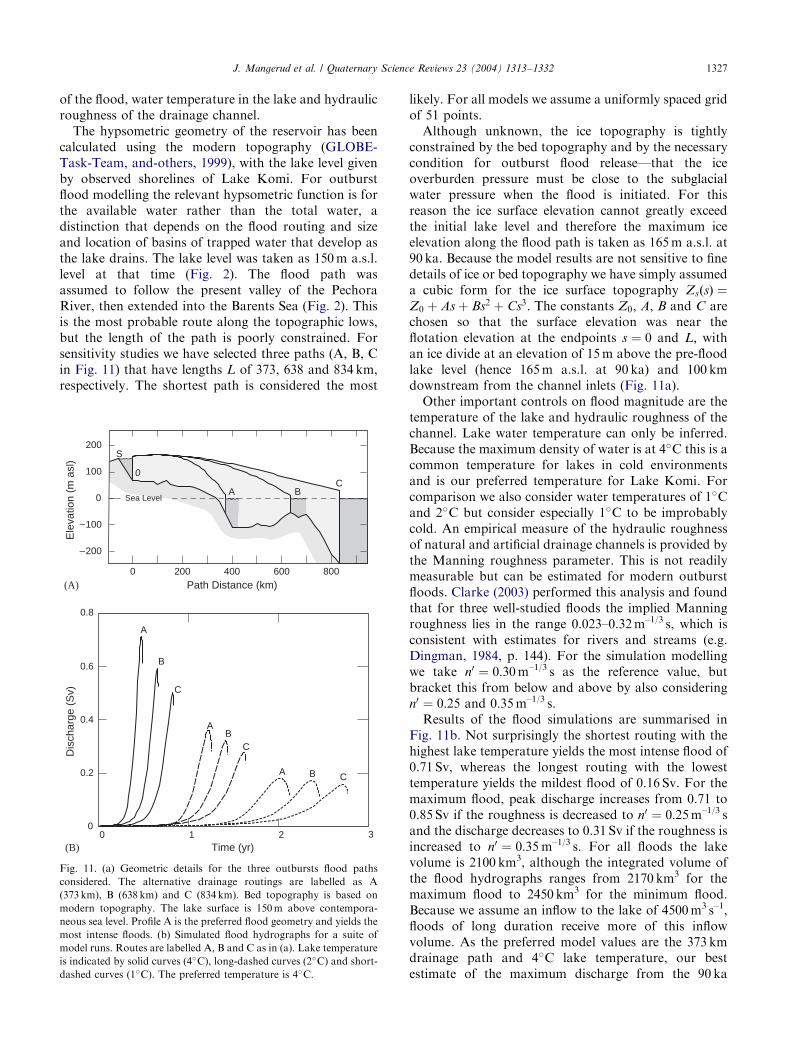
The hypsometric geometry of the reservoir has beencalculated using the modern topography (GLOBE-Task-Team, and-others, 1999), with the lake level givenby observed shorelines of Lake Komi. For outburstflood modelling the relevant hypsometric function is forthe available water rather than the total water, adistinction that depends on the flood routing and sizeand location of basins of trapped water that develop asthe lake drains. The lake level was taken as 150 m a.s.l.level at that time (Fig. 2). The flood path wasassumed to follow the present valley of the PechoraRiver, then extended into the Barents Sea (Fig. 2). Thisis the most probable route along the topographic lows,but the length of the path is poorly constrained. Forsensitivity studies we have selected three paths (A, B, Cin Fig. 11) that have lengths L of 373, 638 and 834 km,respectively. The shortest path is considered the most
Sea LevelA
0
S
BC
200
100
0
100
200–
–
Ele
vatio
n (m
asl
)D
isch
arge
(S
v)
Time (yr)(B)
Path Distance (km)(A)0 200 400 600 800
0 1 2 3
0.6
0.4
0.2
0
0.8
A
B
C
AB
C
A B C
Fig. 11. (a) Geometric details for the three outbursts flood paths
considered. The alternative drainage routings are labelled as A
(373 km), B (638 km) and C (834 km). Bed topography is based on
modern topography. The lake surface is 150m above contempora-
neous sea level. Profile A is the preferred flood geometry and yields the
most intense floods. (b) Simulated flood hydrographs for a suite of
model runs. Routes are labelled A, B and C as in (a). Lake temperature
is indicated by solid curves (4�C), long-dashed curves (2�C) and short-
dashed curves (1�C). The preferred temperature is 4�C.
likely. For all models we assume a uniformly spaced gridof 51 points.
Although unknown, the ice topography is tightlyconstrained by the bed topography and by the necessarycondition for outburst flood release—that the iceoverburden pressure must be close to the subglacialwater pressure when the flood is initiated. For thisreason the ice surface elevation cannot greatly exceedthe initial lake level and therefore the maximum iceelevation along the flood path is taken as 165 m a.s.l. at90 ka. Because the model results are not sensitive to finedetails of ice or bed topography we have simply assumeda cubic form for the ice surface topography ZsðsÞ ¼Z0 þ As þ Bs2 þ Cs3: The constants Z0; A; B and C arechosen so that the surface elevation was near theflotation elevation at the endpoints s ¼ 0 and L; withan ice divide at an elevation of 15 m above the pre-floodlake level (hence 165 m a.s.l. at 90 ka) and 100 kmdownstream from the channel inlets (Fig. 11a).
Other important controls on flood magnitude are thetemperature of the lake and hydraulic roughness of thechannel. Lake water temperature can only be inferred.Because the maximum density of water is at 4�C this is acommon temperature for lakes in cold environmentsand is our preferred temperature for Lake Komi. Forcomparison we also consider water temperatures of 1�Cand 2�C but consider especially 1�C to be improbablycold. An empirical measure of the hydraulic roughnessof natural and artificial drainage channels is provided bythe Manning roughness parameter. This is not readilymeasurable but can be estimated for modern outburstfloods. Clarke (2003) performed this analysis and foundthat for three well-studied floods the implied Manningroughness lies in the range 0.023–0.32 m–1/3 s, which isconsistent with estimates for rivers and streams (e.g.Dingman, 1984, p. 144). For the simulation modellingwe take n0 ¼ 0:30 m–1/3 s as the reference value, butbracket this from below and above by also consideringn0 ¼ 0:25 and 0:35 m–1/3 s.
Results of the flood simulations are summarised inFig. 11b. Not surprisingly the shortest routing with thehighest lake temperature yields the most intense flood of0.71 Sv, whereas the longest routing with the lowesttemperature yields the mildest flood of 0.16 Sv. For themaximum flood, peak discharge increases from 0.71 to0.85 Sv if the roughness is decreased to n0 ¼ 0:25 m–1/3 sand the discharge decreases to 0.31 Sv if the roughness isincreased to n0 ¼ 0:35 m–1/3 s. For all floods the lakevolume is 2100 km3, although the integrated volume ofthe flood hydrographs ranges from 2170 km3 for themaximum flood to 2450 km3 for the minimum flood.Because we assume an inflow to the lake of 4500 m3 s–1,floods of long duration receive more of this inflowvolume. As the preferred model values are the 373 kmdrainage path and 4�C lake temperature, our bestestimate of the maximum discharge from the 90 ka
ARTICLE IN PRESSJ. Mangerud et al. / Quaternary Science Reviews 23 (2004) 1313–13321328
outburst from Lake Komi is in the range 0.3–0.85 Svwith a duration of 2–3 months, depending on whichvalue of Manning roughness is selected. Without betterknowledge of their geometry and filling level, it would bepremature to perform comparable simulations for theother ice-dammed lakes discussed in this paper. Assum-ing that the lake temperature and hydraulic roughnessare the same for all the floods, the major influences onflood magnitude are the reservoir volume and theaverage slope of the flood routing. The lakes in theWhite Sea Basin and West Siberian Plain have estimatedvolumes that are six-fold that of Lake Komi (Table 2)and it seems probable that the flood magnitudes wouldcorrespondingly exceed that for Lake Komi and theflood durations would be comparable.
6. Discussion
6.1. Uncertainties in the reconstruction of the lakes
The concept of blocking the northbound Russianrivers by ice sheets is simple and has been known fordecades. Yet, as pointed out above, our factual knowl-edge from geological records is often limited. Reasonsfor this include the facts that the lakes extended overenormously large and remote areas, and that untilrecently dating of sediments older than the limit of the14C method was almost impossible.
The history of the lakes on Taimyr is reasonably wellestablished. However, the only well-mapped ice-dammed reservoir in the large lowlands is Lake Komiin the Pechora Lowland, OSL-dated to 90–80 ka. Wehave postulated a contemporaneous and much largerlake on the West Siberian Plain as an implication of theice sheet reconstruction. This hypothesis has still to betested, because the glaciolacustrine sediments in thatarea are yet not comprehensively dated (Fig. 10A). Thepostulated contemporaneous lake in the White Sea basinis better supported by OSL dates, but its actual existenceis disputed (Houmark-Nielsen et al., 2001) and furtherfield studies and dating efforts are necessary to decidewhich alternative is correct. Nevertheless, we believethat the largest ice-dammed lakes existed during theEarly Weichselian, about 90–80 ka (Table 2 and Fig. 2).
Unfortunately, except for Taimyr, geological recordsof the Middle Weichselian proglacial system are evenless known than for the Early Weichselian. However, ifthe ice-sheet reconstruction for 60–50 ka is approxi-mately correct, there should have been a major lake inthe White Sea basin. A few OSL dated and someundated lake sediments support this interpretation.There were probably also a small lake in the PechoraValley and a large lake over parts of the present sea-floor of the Kara Sea and the lower parts of the WestSiberian Plain. However, such lakes are not documented
by shorelines, and so far only a few dates are availablefrom West Siberia (Fig. 10).
For the Late Weichselian we are confident that nosizeable lakes existed above present sea level along thecoasts of the Kara and Pechora seas, and only a smalland short-lived proglacial lake, if any, could haveformed on the Kara Sea shelf.
The main picture is clear for the Scandinavian IceSheet. The east- and northbound drainage was onlyblocked during the Late Weichselian glacial maximum(LGM). At that time proglacial water was forced acrossthe continental watershed into the Volga River andfarther to the Caspian Sea.
6.2. Drainage to the Caspian and Black Seas
We have identified only two periods when drainagewas diverted toward the Caspian and Black Seas.Interestingly, it was two different drainage areas thatwere affected alternately.
The first time the drainage of the West Siberian Plain,including the Yenissei and Ob rivers, was forced towardsthe Aral, Caspian and Black Seas by the advancingBarents–Kara Ice Sheet (Fig. 2). We consider thedamming and rerouting certain, but the dating isimprecise. However, we correlate this event with theexistence of Lake Komi in the Pechora Lowland, OSL-dated to 90–80 ka, an age supported by two dates fromWest Siberia (Fig. 10A).
The second time the drainage was re-routed south-ward was during the LGM, about 18–17 ka. This timethe Scandinavian Ice Sheet blocked the drainage towardthe Baltic Sea and meltwater from a considerable sectorof the ice sheet flowed over the watershed to the VolgaRiver. This possibly caused the Caspian Sea to overflowalong the Manych Pass at 26 m a.s.l. to the Black Sea.According to Leonov et al. (2002) the last overflowfrom the Caspian Sea lasted from 19 to 13 ka (16–11 ka14C-years) and was interrupted by a regression at17–16 ka.
6.3. Impact of lake outbursts to the Arctic Ocean
We have described above our modelling of theoutburst from Lake Komi, which indicates that itoccurred over a few months. We assume the other lakesalso drained over a comparable period of time althoughthe water would follow different pathways. The out-bursts of lakes in the White Sea Basin and in thePechora Lowland would end in the Barents Sea.Whether the fresh water from there would flow towardthe Arctic Ocean or directly west into the NorwegianSea would depend on the glacier configuration andpattern of ocean circulation at that time. However, theice sheet on the Barents Sea was certainly almost gonewhen the outburst occurred. The large lake on the West
ARTICLE IN PRESSJ. Mangerud et al. / Quaternary Science Reviews 23 (2004) 1313–1332 1329
Siberian Plain and the lakes on Taimyr would bedrained to the Kara Sea and further into the ArcticOcean Basin. In summary, we expect that most of thewater would end up in the Arctic Ocean, and follow theTransarctic Drift through the Fram Strait to theNorwegian Sea every time an ice-dammed lake wasdrained.
Considering that water volumes of these lakes areequal to that of 20–50 years of the present-day runoff,and a much longer period of the dry glacial climate, weexpect that several of the outbursts had significantimpact on sea-ice formation and other environmentalparameters (Mangerud et al., 2001a). Before speculatingon these possible impacts we would like to point out thatif diagnostic parameters for the outburst of theindividual lakes could be found in marine cores, itwould provide important stratigraphic markers for land-sea correlations. Candidate signals from outbursts fromthe discussed ice-dammed lakes are now found in theArctic Ocean (Svendsen et al., 2004).
The combined final outburst volume from lakesAgassiz and Ojibway, Canada, which has been sug-
84˚N
- 4.0-1.0
-0.5
80˚N
76˚N
72˚N
68˚N
64˚N
60˚N
56˚N
0˚E 20˚E 40˚E 6
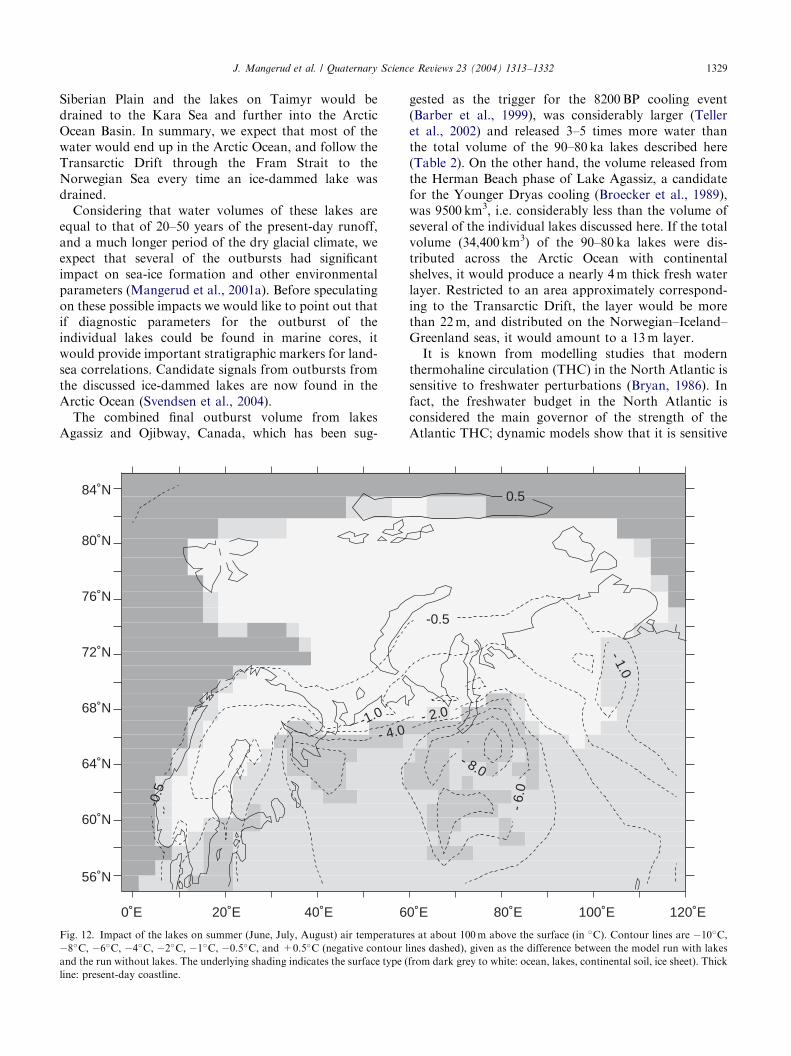
Fig. 12. Impact of the lakes on summer (June, July, August) air temperatur
�8�C, �6�C, �4�C, �2�C, �1�C, �0.5�C, and +0.5�C (negative contour l
and the run without lakes. The underlying shading indicates the surface type (
line: present-day coastline.
gested as the trigger for the 8200 BP cooling event(Barber et al., 1999), was considerably larger (Telleret al., 2002) and released 3–5 times more water thanthe total volume of the 90–80 ka lakes described here(Table 2). On the other hand, the volume released fromthe Herman Beach phase of Lake Agassiz, a candidatefor the Younger Dryas cooling (Broecker et al., 1989),was 9500 km3, i.e. considerably less than the volume ofseveral of the individual lakes discussed here. If the totalvolume (34,400 km3) of the 90–80 ka lakes were dis-tributed across the Arctic Ocean with continentalshelves, it would produce a nearly 4m thick fresh waterlayer. Restricted to an area approximately correspond-ing to the Transarctic Drift, the layer would be morethan 22 m, and distributed on the Norwegian–Iceland–Greenland seas, it would amount to a 13 m layer.
It is known from modelling studies that modernthermohaline circulation (THC) in the North Atlantic issensitive to freshwater perturbations (Bryan, 1986). Infact, the freshwater budget in the North Atlantic isconsidered the main governor of the strength of theAtlantic THC; dynamic models show that it is sensitive
-0.5
0.5
- 2.0
- 1.0
- 8.0
- 6.
0
0˚E 80˚E 100˚E 120˚E
es at about 100m above the surface (in �C). Contour lines are �10�C,
ines dashed), given as the difference between the model run with lakes
from dark grey to white: ocean, lakes, continental soil, ice sheet). Thick
ARTICLE IN PRESSJ. Mangerud et al. / Quaternary Science Reviews 23 (2004) 1313–13321330
to even small changes on the order of 0.1 Sv (Stockerand Wright, 1991). The THC could completely collapsedue to an increased freshwater input (Schmittner andClement, 2002) and it has been suggested that this tookplace during large glacier melt-water events. From theabove and from our modelling results indicating thatLake Komi alone would provide in the range of 0.3–0.85 Sv, it is tenable to suggest that outbursts of the icedammed lakes in northern Russia could have triggeredcold events during Early and Middle Weichseliandeglaciations that may have been comparable toYounger Dryas. One can also speculate that the freshwater pulse at 50–60 ka in the Norwegian Sea (Hebbelnet al., 1998) was a result of the outburst of the 50–60 kalakes described here.
6.4. Climatic impacts of the lakes on the continent and ice
sheet
In addition to the resultant feedback to continentsfrom lake outbursts, which changed ocean circulation,the actual presence of large lakes on continents willinfluence the regional climate (Bonan, 1995; Lofgren,1997). Concerning the climatic impact of ice-dammedlakes, Hostetler et al. (2000) showed that Lake Agassizcooled the climate near the southern limit of theLaurentide Ice Sheet 11,000 years ago, leading toreduced precipitation rates over the ice sheet. Krinneret al. (2004) quantified the climatic impact of the EarlyWeichselian ice-dammed lakes described in this paper.They used the polar version of the LMDZ3 (Lab. deM!et!eorologie Dynamique, CNRS, Paris) stretched-gridgeneral circulation model (Krinner et al., 1997) whichincludes a thermal lake module (Krinner, 2004). Twosimulations of the Early Weichselian climate, one withand one without ice-dammed Russian lakes, werecarried out.
The results show that the ice-dammed lakes, becauseof the cool climate near the ice sheet and because theyare fed by fairly large amounts of meltwater from thesouthern margin of the ice sheet, remain cool in summer.In particular, the lakes are significantly cooler than thenormal continental soil, with which they are replaced inthe control simulation. As a consequence, the lakes exerta cooling effect aloft. The cooling is strongest over thelakes themselves, but it extends onto the adjacentcontinent including the ablation zone of the ice sheet(Fig. 12). Compared to a situation without ice-dammedlakes, summer melt on the southern ice sheet margin istherefore strongly reduced, and the ice sheet massbalance is increased. This means that there was apositive feedback loop involving the ice sheet and theproglacial lakes: ice sheet growth allowed the existenceof the lakes, which in turn favoured further growth ofthe ice sheet. A similar amplifying effect must haveexisted during the ice sheet retreat. Therefore the lakes
play an important role in the dynamics of the Eurasianclimate during this period. Other climatic effects of thelakes include a slight modification of the seasonal cycleof precipitation on the ice sheet.
Acknowledgements
Jane Ellingsen and Eva Bj^rseth helped with thefigures. The work in the Pechora Lowland and western-most Siberia was funded by the Research Council ofNorway (the PECHORA project) and organised byNIIKAM, St. Petersburg. The work on Taimyr Penin-sula was funded by the Swedish Natural ScienceResearch Council, the Royal Swedish Academy ofSciences and the Swedish Board for Nature Conser-vancy; the logistics were also supported by the SwedishPolar Research Secretariat. All field groups were alsosupported by the EC Environment and ClimateResearch Programme (Eurasian Ice Sheets, Contractno. ENV4-CT97-0563). The contribution by MartinJakobsson was supported by NOAA GrantNA97OG0241. The outburst flood modelling is acontribution of the Climate System History andDynamics Program, jointly sponsored by the NaturalSciences and Engineering Research Council of Canada(NSERC) and the Meteorological Service of Canada.All projects were co-ordinated by the EuropeanScience Foundation research program QuaternaryEnvironments of the Eurasian North (QUEEN).We appreciated the comments from the journalsreviewers Rein Vaikm.ae and James T. Teller; especiallyTeller had many comments that improved the manu-script. We sincerely thank the people and institutionsmentioned.
References
Alexanderson, H., Hjort, C., M .oller, P., Antonov, O., Pavlov, M.,
2001. The North Taymyr ice-marginal zone, Arctic Siberia—a
preliminary overview and dating. Global and Planetary Change 31,
427–445.
Alexanderson, H., Adrielsson, L., Hjort, C., M .oller, P., Antonov, O.,
Eriksson, S., Pavlov, M., 2002. The depositional history of the
North Taymyr ice-marginal zone, Siberia—a landsystem approach.
Journal of Quaternary Science 17, 361–382.
Arkhipov, S., Lavrushin, Y., 1957. To the question of the Yenissei
discharge during the maximum and Zyryanka glaciations. Izvestia,
USSR Academy of Sciences, Geology 6, 91–101 (In Russian).
Astakhov, V., 1992. The last glaciation in West Siberia. Sveriges
Geologiska Unders .okning Ser. Ca 81, 21–30.
Astakhov, V., Late Pleistocene proglacial drainage, ice sheets in West
Siberia. Boreas, submitted for publication.
Astakhov, V.I., Svendsen, J.I., Matiouchkov, A., Mangerud, J.,
Maslenikova, O., Tveranger, J., 1999. Marginal formations of the
last Kara and Barents ice sheets in northern European Russia.
Boreas 28, 23–45.
ARTICLE IN PRESSJ. Mangerud et al. / Quaternary Science Reviews 23 (2004) 1313–1332 1331
Barber, D., Dyke, A., Hillaire-Marcel, C., Jennings, A., Andrews, J.,
Kerwin, M.W., Bilodeau, G., McNeely, R., Southon, J., More-
head, M.D., Gagnon, J.-M., 1999. Forcing of the cold event of
8200 years ago by catastrophic drainage of Laurentide lakes.
Nature 400, 344–348.
Bj .ornsson, H., 2002. Subglacial lakes and j .okulhlaups in Iceland.
Global and Planetary Change 35, 255–271.
Bonan, G., 1995. Sensitivity of a GCM to inclusion of inland water
surfaces. Journal of Climate 8, 2691–2704.
Broecker, W.S., Kennett, J.T., Flower, B.P., Teller, J.T., Trumbore, S.,
Bonani, G., Wolfli, W., 1989. Routing of meltwater from the
Laurentide Ice Sheet during the Younger Dryas cold episode.
Nature 341, 318–320.
Bryan, F., 1986. High-latitude salinity effects and interhemispheric
thermohaline circulations. Nature 323, 301–304.
Chappell, J., 2002. Sea level changes forced ice breakouts in the Last
Glacial cycle: new results from coral terraces. Quaternary Science
Reviews 21, 1229–1240.
Chappell, J., Omura, A., Esat, T., McCulloch, M., Pandolfi, J.Y.O.,
Pillans, B., 1996. Reconciliation of late Quaternary sea levels
derived from coral terraces at Huon Peninsula with deep sea
oxygen isotope records. Earth and Planetary Science Letters 141,
227–236.
Chebotareva, N.S., 1977. Struktura i dinamika poslednego ledniko-
vogo pokrova Evropy (In Russian, English Summary. Structure
and Dynamics of the Last Ice Sheet of Europe). Nauka, Moscow.
Clarke, G., 2003. Hydraulics of subglacial outburst floods: new
insights from the Spring–Hutter formulation. Journal of Glaciol-
ogy 49, 299–313.
Demidov, I., Houmark-Nielsen, M., Kjær, K.H., Larsen, E., Lys(a, A.,
Funder, S., Lunkka, J., Saarnisto, M., 2004. Valdaian Glacial
Maxima in the Arkhangelsk District of Northwestern Russia. In:
Ehlers, J., Gibbard, P. (Eds.), Quaternary Glaciations—Extent and
Chronology. Vol. 1. Elsevier, Europe, Amsterdam, in press.
Dingman, S., 1984. Fluvial Hydrology. W. H. Freeman and Company,
New York.
Funder, S., Riazanova, M., Rydlevski, A., Siedenkrantz, M., 1999.
Late Quaternary events in northern Siberia—preliminary results of
field work on coastal Taymyr. In: Quaternary Environments of the
Eurasian North (QUEEN), Third Workshop. Abstract Volume, 8.
Øystese, Bergen, Norway.
GLOBE-Task-Team, and-others, 1999. In: Hastings, D.A., Dunbar,
P.K., Elphingstone, G.M., Bootz, M., Murakami, H., Maruyama,
H., Masaharu, H., Holland, P., Payne, J., Bryant, N.A., Logan,
T.L., Muller, J.-P., Schreier, G., MacDonald, J.S. (Eds.), The
Global Land One-kilometer Base Elevation (GLOBE) Digital
Elevation Model, Version1.0, CD-ROM. National Oceanic and
Atmospheric Administration, National Geophysical Data Center,
Boulder, CO. Digital data base on the World Wide Web
(URL:http://www.ngdc.noaa.gov/seg/topo/globe.shtml) and CD-
ROMS.
Grosswald, M.G., 1980. Late Weichselian Ice Sheets of Northern
Eurasia. Quaternary Research 13, 1–32.
Hebbeln, D., Henrich, R., Baumann, K.-H., 1998. Paleoceanography
of the last interglacial/glacial cycle in the Polar North Atlantic.
Quaternary Science Reviews 17, 125–153.
Henriksen, M., Mangerud, J., Maslenikova, O., Matiouchkov, A.,
Tveranger, J., 2001. Weichselian stratigraphy and glacitectonic
deformation along the lower Pechora River, Arctic Russia. Global
and Planetary Change 31, 295–317.
Henriksen, M., Mangerud, J., Matiouchkov, A., Paus, A., Svendsen,
J., 2003. Lake stratigraphy implies an 80,000 year delayed melting
of buried dead ice in northern Russia. Journal of Quaternary
Science 18, 663–679.
Hjort, C., M .oller, P., Alexanderson, H., 2004. Weichselian glaciation
of the Taymyr Peninsula, Siberia. In: Ehlers, J., Gibbard, P. (Eds.),
Quaternary Glaciations—Extent and Chronology. Vol. 1. Elsevier,
Europe, Amsterdam, in press.
Hostetler, S.W., Bartlein, P.J., Clark, P.U., Small, E.E.,
Solomon, A.M., 2000. Simulated influences of Lake Agassiz on
the climate of central North America 11,000 years ago. Nature 405,
334–337.
Houmark-Nielsen, M., Demidov, I., Funder, S., Gr^sfjeld, K.,
Kjær, K.H., Larsen, E., Lavrova, N., Lys(a, A., Nielsen, J.K.,
2001. Early and Middle Valdaian glaciations, ice dammmed
lakes and periglacial interstadials in northwest Russia: new
evidence from Pyoza River area. Global and Planetary Change
31, 215–237.
Ikonen, L., Ekman, I., 2001. Biostratigraphy of the Mikulino
interglacial sediments in NW Russia: the Petrozavodsk site and a
literature review. Annales Academiae Scientarium Fennicae A III,
Geologica-Geographica 161, 1–88.
Isayeva, L.L., 1984. Late Pleistocene glaciation of North-Central
Siberia. In: Velichko, A.A. (Ed.), Late Quaternary Environments
of the Soviet Union. University of Minnesota Press, Minneapolis,
pp. 21–30.
Jakobsson, M., Cherkis, N.Z., Woodward, J., Macnab, R., Coakley,
B., 2000. New grid of Arctic bathymetry aids scientists and
mapmakers. EOS, Transactions, American Geophysical Union 81,
89–96.
Kalberg, E., Ivanov, S., Vartanova, I., Lyamin, B., 1970. Geological
mapping report of scale1:200,000 and 1:50,000 (Quadrangle P-37-
XV). (In Russian). Stored in: Russian Geological Survey, Arch-
angelsk.
Kapishnikova, O., Sidorov, A., Somov, N., 1994. Geological mapping
report of scale 1:50,000 (Quadrangles P-37-66-67-A,B, 68-A) and
1:200,000 (Quadrangles P-37-54-V,G, 55-V,G, 56-V, 66, 67-A,B,
68-A). (In Russian). Stored in: Russian Geological Survey,
Archangelsk.
Kind, N.V., Leonov, B.N., 1982. The Anthropogene of Taimyr (In
Russian: Antropogen Taimyra). Nauka, Moscow.
Kjær, K.H., Demidov, I., Larsen, E., Murray, A., Nielsen, J.K., 2002.
Mezen bay—a key area for understanding Weichselian Glaciations
in northern Russia. Journal of Quaternary Science 18, 73–93.
Krinner, G., 2003. Impact to flakes, wetlands on boreal climate.
Journal of Geophysical Research 4520, doi:10.1029/2002JD002597.
Krinner, G., Genthon, C., Li, Z.-X., Le Van, P., 1997. Studies of the
Antarctic climate with a stretched-grid general circulation model.
Journal of Geophysical research 102, 13731–13745.
Krinner, G., Mangerud, J., Jakobsson, J., Crucifix, M., Ritz, C.,
Svendsen, J.I., 2004. Enhanced ice sheet growth in Eurasia owing
to adjacent ice dammed lakes. Nature 427, 429–432.
Kuptsov, V., Lisitsyn, A., 2001. Holocene sedimentation in the
Yenissei mouth and on the adjacent shelf. Doklady Academii
Nauk 381, 545–549 (in Russian).
Kvasov, D.D., 1979. The Late-Quaternary history of large lakes and
inland seas of eastern Europe. Annales Academiae Scientiarum
Fennicae AIII 127, 1–71.
Lavrov, A.S., Potapenko, L.M., Zaitsev, A.P., Korolkova, Z.G.,
Meshalkin, K.A., Nikiforova, L.D., 1991. Map of the Quaternary
deposits, scale 1:1 000 000. Sheet Q-38,39 (Mezen), VSEGEI,
Leningrad.
Lavrov, A.S., 1975. Late Pleistocene impounded lakes in the north-east
of the Russian Plain. In: IV All-Union symposium on the history of
lakes, 119–127. Leningrad (In Russian. English translation by A
Zamoruyev, V. Astakhov 1994. Department of Geology, Uni-
versity of Bergen).
Lavrov, A.S., 1977. Kola-Mezen, Barents Sea-Pechora, Novaya
Zemlya-Kolva ice streams. In: Chebotareva, N.S. (Ed.), The
Structure and Dynamics of the Last Ice Sheet of Europe (Struktura
i dinamika poslednego lednikovogo pokrova Evropy). Nauka,
Moscow, pp. 83–100 (In Russian, English summary).
ARTICLE IN PRESSJ. Mangerud et al. / Quaternary Science Reviews 23 (2004) 1313–13321332
Lazukov, G., 1970. The Anthropogene of the Northern Half of West
Siberia, Stratigraphy (In Russian: Antropogen Severnoi Poloviny
Zapadnoi Sibiri, Stratigrafia). Moscow University, Moscow.
Leonov, Yu.G., Lavrushin, Yu.A., Antipov, M.P., Spiridonova,
Ye.A., Kuzmin, Ya.V., Jull, E.J.T., Burr, S., Jelinowska, A.,
Chalie, F., 2002. New age data on sediments of the transgressive
phase of the Early Khvalyn transgression of the Caspian Sea.
Doklady Earth Sciences ISSN 1028-334X, 386, 748–751. Trans-
lated from Doklady Akademii Nauk, 2002, 386, 229–233.
Lofgren, B., 1997. Simulated effects of idealized Laurentian Great
Lakes on regional and large-scale climate. Journal of Climate 10,
2847–2858.
Lunkka, J.P., Saarnisto, M., Demidov, I., 2001a. The Last Glaciation
on the Kola Peninsula, Russia. In: EUG XI Strasbourg France
8th–12th April 2001. Abstracts p. 219.
Lunkka, J.P., Saarnisto, M., Gey, V., Demidov, I., Kiselova, V.,
2001b. Extent and age of the Last Glacial Maximum in the
southeastern sector of the Scandinavian Ice Sheet. Global and
Planetary Change 31, 407–425.
Lys(a, A., Demidov, I., Houmark-Nielsen, M., Larsen, E., 2001. Late
Pleistocene stratigraphy and sedimentary environment of the
Arkangelsk area, northwest Russia. Global and Planetary Change
31, 179–199.
Mangerud, J., 1989. Correlation of the Eemian and the Weichselian
with deep sea oxygen isotope stratigraphy. Quaternary Interna-
tional 3/4, 1–4.
Mangerud, J., Svendsen, J.I., Astakhov, V.I., 1999. Age and extent of
the Barents and Kara ice sheets in Northern Russia. Boreas 28,
46–80.
Mangerud, J., Astakhov, V., Svendsen, J.I., 2002. The extent of the
Barents–Kara Ice Sheet during the Last Glacial Maximum.
Quaternary Science Reviews 21, 111–119.
Mangerud, J., Astakhov, V.I., Jacobsson, M., Svendsen, J.I., 2001a.
Huge Ice-Age lakes in Russia. Journal of Quaternary Science 16,
773–777.
Mangerud, J., Astakhov, V.I., Murray, A., Svendsen, J.I., 2001b. The
chronology of a large ice-dammed lake and the Barents–Kara Ice
Sheet advances, Northern Russia. Global and Planetary Change
31, 319–334.
Maslenikova, O., Mangerud, J., 2001. Where was the outlet of the ice-
dammed Lake Komi, northern European Russia. Global and
Planetary Change 31, 335–343.
Mejdahl, V., B^tter-Jensen, L., 1994. Luminescence dating of
archaeological materials using a new technique based on
single aliquot measurements. Quaternary Science Reviews 13,
551–554.
M .oller, P., Bolshiyanov, D.Y., Bergsten, H., 1999. Weichselian
geology and palaeoenvironmental history of the central Taymyr
Peninsula, Siberia, indicating no glaciation during the last global
glacial maximum. Boreas 28, 92–114.
Murray, A., Olley, J., 2002. Precision and accuracy in the optically
stimulated luminescence dating of sedimentary quartz. Geochro-
nometria 21, 1–16.
Murray, A.S., Wintle, A.G., 2000. Luminescence dating of quartz
using an improved single-aliquot regenerative-dose protocol.
Radiation Measurements 32, 57–73.
Murray, A.S., Marten, R., Johnston, P., Martin, A.J., 1987. Analysis
for naturally occurring radionuclides at environmental concentra-
tions by gamma spectrometry. Journal of Radioanalytical and
Nuclear Chemistry 115, 263–288.
Niessen, F., Ebel, T., Kopsch, C., Fedorov, G.B., 1999. High-
resolution Seismic stratigraphy of Lake Sediments on the Taymyr
Peninsula, Central Siberia. In: Kassens, H., Bauch, H.A.,
Dmitrenko, I.A., Eicken, H., Hubberten, H.W., Melles, M.,
Thiede, J., Timokhov, L.A. (Eds.), Land–Ocean Systems in
the Siberian Arctic: Dynamics and History. Springer, Berlin,
pp. 437–456.
Nikolskaya, O., Astakhov, V., Mangerud, J., Matiouchkov, A.,
Svendsen, J., 2002. Geomorphological Map of the Pechora Basin
and Adjacent Areas. Institute of Remote Sensing Methods for
Geology (NIIKAM), St. Petersburg, Russia.
Nye, J., 1976. Water flow in glaciers: j .okulhlaups, tunnels and veins.
Journal of Glaciology 17, 181–207.
Polyak, L., Gataullin, V., Gainanov, V., Gladysh, V., Goremykin, Y.,
2002. Kara Sea expedition yields insight into extent of LGM ice
sheet. EOS 83, 525–529.
Saarnisto, M., Saarinen, T., 2001. Deglaciation chronology of the
Scandinavian Ice Sheet from the Lake Onega basin to the
Salpausselk.a end moraines. Global and Planetary Change 31,
387–406.
Saarnisto, M., Gr .onlund, T., Ekman, I., 1995. Lateglacial of Lake
Onega—contribution to the history of the eastern Baltic basin.
Quaternary International 27, 111–120.
Sauramo, M., 1958. Die Geschichte der Ostsee. Annales Academiae
Scientiarum Fennicae A III, 1–522.
Schmittner, A., Clement, A., 2002. Sensitivity of the thermohaline
circulation to tropical and high-latitude freshwater forcing
during the last glacial–interglacial cycle. Paleoceanography 17,
7.1.7.14.
Spring, U., Hutter, K., 1981. Numerical studies of j .okulhlaups. Cold
Regions Science and Technology 4, 227–244.
Stein, R., Niessen, F., Dittmers, K., Levitan, M., Schoster, F.,
Simstich, J., Steinke, T., Stepanets, O., 2002. Siberian river run-
off and Late Quaternary glaciation in the southern Kara
Sea, Arctic Ocean: preliminary results. Polar Research 21,
315–322.
Stocker, T., Wright, D., 1991. Rapid transitions if the ocean’s deep
circulation induced by changes in surface water fluxes. Nature 351,
729–732.
Svendsen, J., Alexanderson, H., Astakhov, V., Demidov, I., Dowdes-
well, J., Funder, S., Gataullin, V., Henriksen, M., Hjort, C.,
Houmark-Nielsen, M., Hubberten, H., Ing !olfson, O., Jakobsson,
M., Kjær, K., Larsen, E., Lokrantz, H., Lunkka, J., Lys(a, A.,
Mangerud, J., Matiouchkov, A., Murray, A., M .oller, P., Niessen,
F., Nikolskaya, O., Polyak, P., Saarnisto, M., Siegert, C., Siegert,
M., Spielhagen, R., Stein, R., Late Quaternary ice sheet history of
Northern Eurasia. Quaternary Science Reviews, this issue
(doi:10.1016/j.quascirev.2003.12.008).
Svendsen, J.I., Gataullin, V., Mangerud, J., Polyak, L., The glacial
history of the Barents, Kara sea region. In: Ehlers, J., Gibbard, P.
(Eds.), Quaternary Glaciations—Extent and Chronology. Vol. 1,
Europe, Elsevier, Amsterdam, in press.
Teller, J.T., Leverington, D.W., Mann, J.D., 2002. Freshwater
outbursts to the oceans from glacial Lake Agassiz and their role
in climate change during the last deglaciation. Quaternary Science
Reviews 21, 879–887.
Vasil’chuk, Y.K., Serova, A.K., Trofimov, V.T., 1984. New data on
the sedimentary environments of the Karginsky Formation in the
north of West Siberia. Bull. Komissii po izucheniyu chetvertichno-
go perioda. Academy Sciences, USSR. Nauka, Moscow 53, 28–35
(In Russian).
Vasil’chuk, Y.K., van der Plicht, J., Vasil’chuk, A.K., Jungner, H.,
Sonninen, E., 2000. First radiocarbon datings of Late Pleistocene
syngenetic ice wedges. Doklady, Russian Academy of Sciences 371,
114–117 (In Russian).
Zubakov, V., 1992. The Caspian transgression as an indicator of the
interglacial–glacial transgression. In: Kukla, G.W.E (Ed.), Start of
a Glacial. Springer, Berlin, pp. 253–271.