ice core drilling recrystallization in ice · terrestrial glaciology - 2-ice core...
TRANSCRIPT

Terrestrial glaciology - 2
- Ice core drilling- Recrystallization in ice
- The central ice divide is an ideal location for deep core drilling. No horizontal movement, layers deposited at drilling site.
- Outside the ice divide, layers at depth originate upstream! Layers near the bed often folded and distorted by ice flow over hilly bedrock.
Thorsteinn ThorsteinssonLecture # 251/17/05

Greenland deep ice core drilling 1960-2004:
Camp Century 1961-1966 1390 mDye 3 (GISP1) 1979-1981 2037 mGRIP 1989-1992 3028 mGISP2 1989-1993 3056 mNGRIP 1996-2004 3091 m
The Greenland ice cores provide the bestavailable data on climate variations in the Northern Hemisphere during the last 125,000 years!
Extensive data on aerosol deposition,volcanic history and physical propertiesof polar ice!
*
*
* Dome C
Vostok
Dome F
Kohnen
*Byrd
South Pole
Taylor Dome
Siple Dome
Siple Station
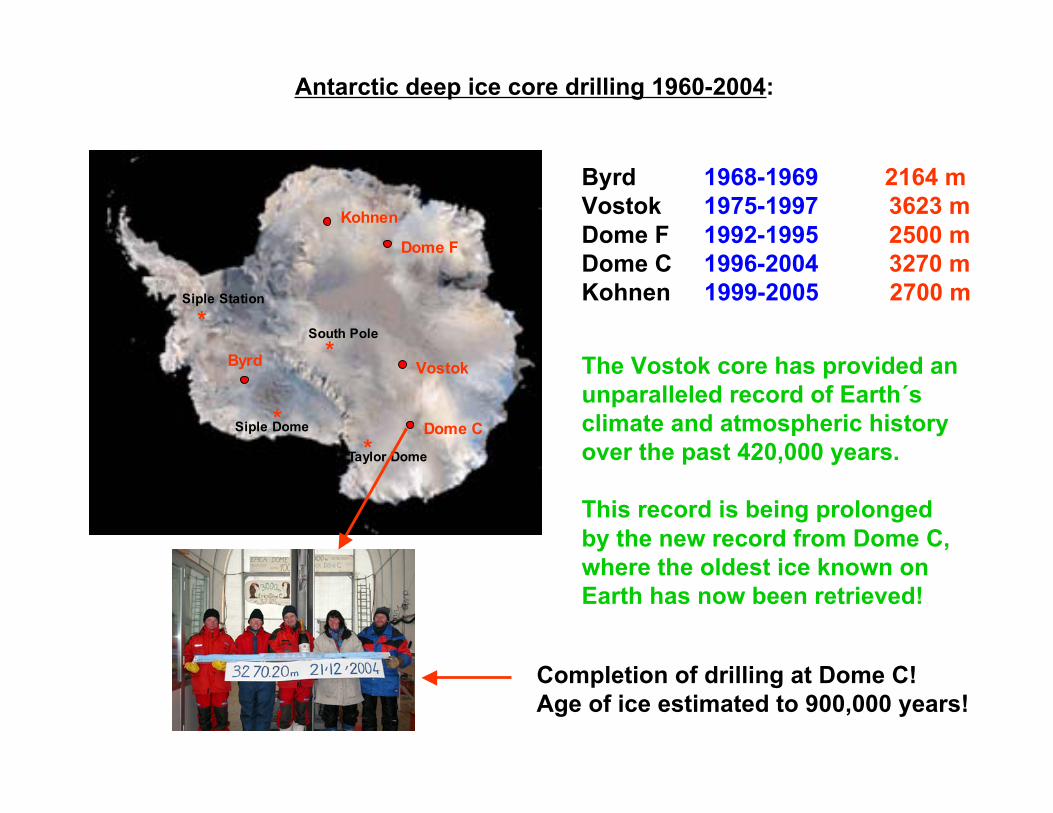
Antarctic deep ice core drilling 1960-2004:
Byrd 1968-1969 2164 mVostok 1975-1997 3623 mDome F 1992-1995 2500 mDome C 1996-2004 3270 mKohnen 1999-2005 2700 m
The Vostok core has provided anunparalleled record of Earth´sclimate and atmospheric historyover the past 420,000 years.
This record is being prolongedby the new record from Dome C,where the oldest ice known on Earth has now been retrieved!
Completion of drilling at Dome C!Age of ice estimated to 900,000 years!

Ice core drilling sites around the world:
Courtesy of Ohio State Universityice core drilling group
Shallow (50-300 m) or intermediate length (300-800 m) ice cores fromice caps around the world:
South America Svalbard (Spitzbergen) IcelandTibet Severnaya Zemlya PatagoniaEuropean Alps Rocky Mountains Kamtchatka

Ice core drilling: Site selection
Start with general reconnaissance of potential drill site.
The aim is to retrieve an undisturbed record going as far back in time as possible.
Important criteria:
- High ice thickness - Low annual accumulation - Flat bedrock - No melting at surface (distorts some parameters)
- For Greenland, this means altitude >2800 m - Ice below melting point at the bed (old ice removed if melting occurs)

Reconnaissance: Radar measurements of ice thickness
Example from Central Greenland, GRIP and GISP2 sites
Summit - airborne radar survey of ice thickness and bedrock topographyFrom Hodge et al. (1990)

Reconnaissance: Determination of annual accumulation (λ)
Expressed in water equivalent thickness(w.eq.) of snow layer (or gcm-2yr-1).
10 cm/yr < λ < 50 cm/yr on most of ice sheet.
Low accumulation area in the NE-part.
GRIP: 23 cm/yearNGRIP: 19 cm/year
Shallow core drilling (100-150 m) during the North Greenland Traverse 1993-1995
GRIP
NGRIP

Reconnaissance: GPS measurements of ice velocities
10 km
1 m/yr
Typical ice flow velocities in the NGRIP area: 1-2 m/yr
Ice movement along ridge in a NNW direction
Away from ridge: Ice movement to W and NE

An ice core drilling station: NGRIP
Housing for 30 people over 5 summers A runway that can receiveHerkules transport planes
A trench beneath the surfacewhere drilling and part of the scientific analysis of the ice cores takes place
Ice cores on a logging table Celebrating a milestone in the drilling at NGRIP

Shallow ice core drill built at the Alfred Wegener Institute in Germany
Drill head
Antitorque Motor Hatches Core barrel
Dry hole: Chips transported upward on spiral, fall through hatches and are collected in upper part of barrel. Core length in each run: ~ 1 m.
1 m
Ice core drills:

Deep drills:
- Similar basic design as in shallow drills, but more sophisticated.
- Must operate in borehole liquid.
- Built-in pump aids chips transport.
- Motor and electronics in sealed pressure chamber.
- Drill length 10 m. Core length in each run: ~ 3-4 m.
Schematic of an initial version of the NGRIP/EPICA deep drill

Ice sheet surface
Bedrock
Top firn layer (70-100 m)is permeable!
Fiberglas casing
Impermeable glacial ice
Drill hole filled with liquidwith density 0.92 g/cm3
to prevent closure!
Hole liquids:
- D60 diesel mixed with F141
- n-butyl acetate
GRIP drilling progress:
1989: Startup
1990: 770 m
1991: 2320 m
1992: 3028 m (bedrock)
Deep holes must be liquid-filled:
Hole inclination:
< 2° above 2 km2-4° below 2 km
100-1500 m: Air bubbles present in the ice
700-1500 m: Air bubblesdisappear and clathrates form
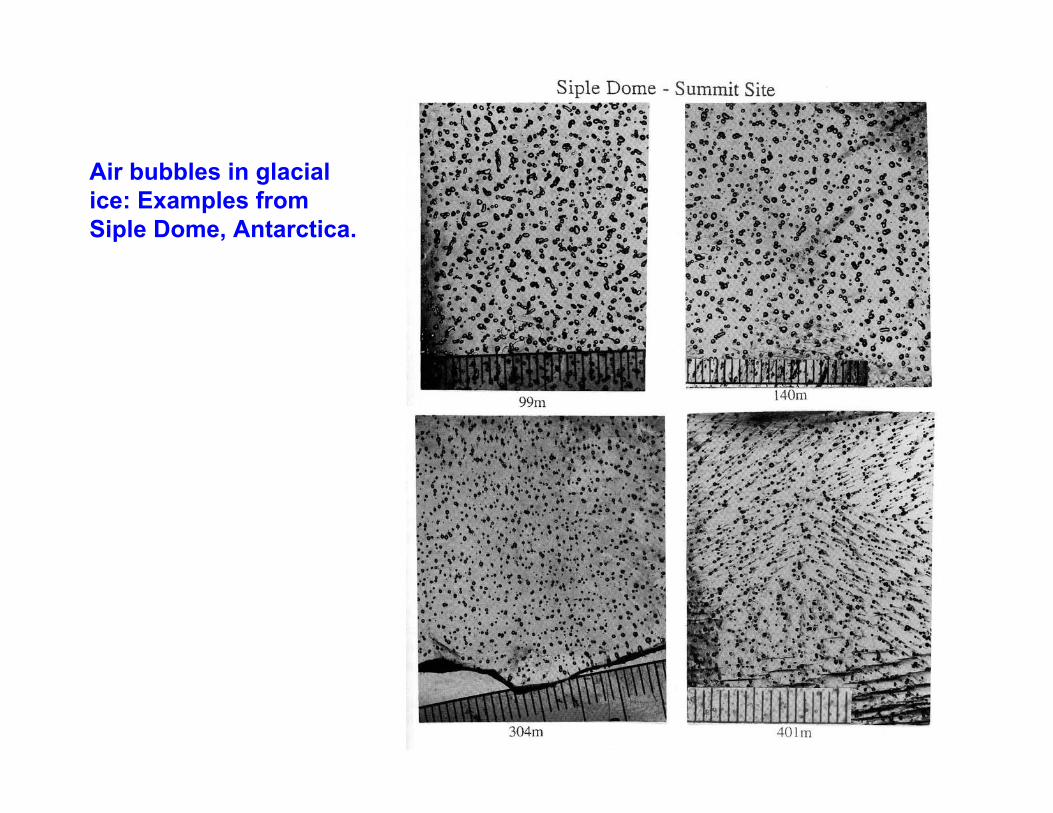
Air bubbles in glacialice: Examples fromSiple Dome, Antarctica.

Vostok ice core:
Air bubbles at 250 m depth
2500 m depth:
Clathrates

Possible scenario for thetransformation of an airbubble to a clathrate
Clathratecrystal
5 mm
20 cm
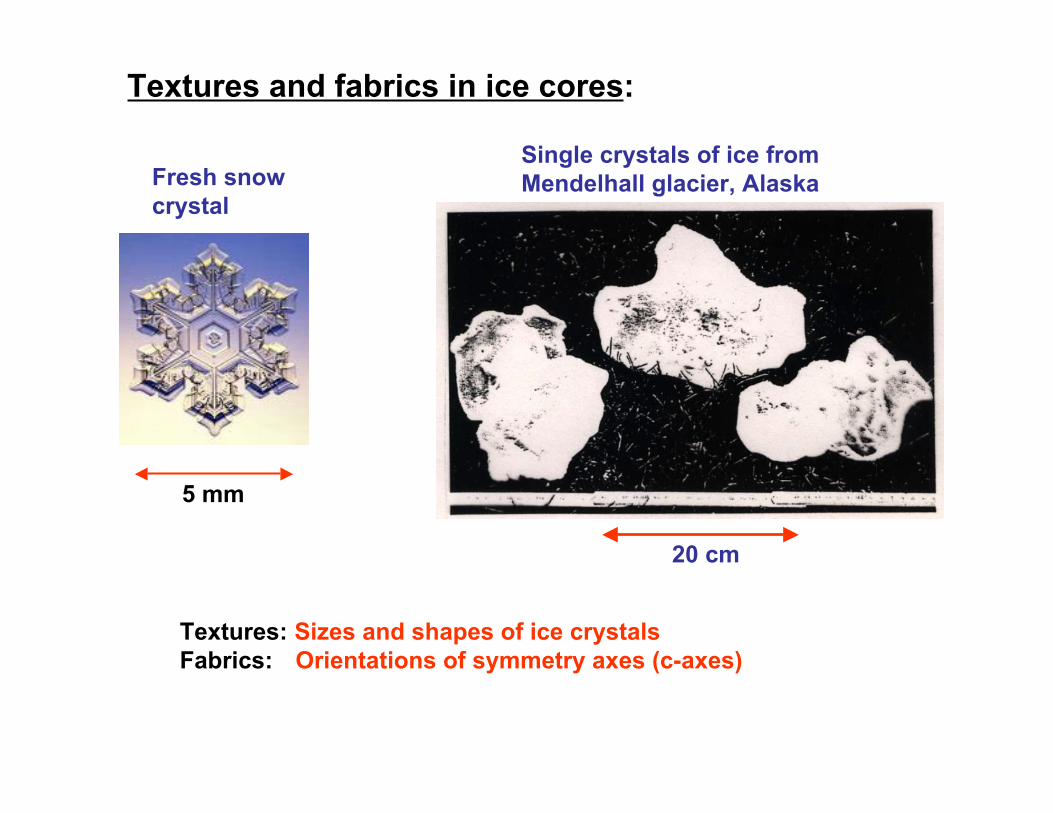
Fresh snowcrystal
Single crystals of ice from Mendelhall glacier, Alaska
Textures: Sizes and shapes of ice crystalsFabrics: Orientations of symmetry axes (c-axes)
Textures and fabrics in ice cores:

Ice crystals with different c-axis orientations display different interference colours when viewed between crossed polarizers.
Mean crystal size determined by:
- counting the number of crystals in a transect across the thin section - image analysis techniques
5 cm
0.5 mm thin section
Glass plate
Polarizer
Polarizer
Light source
cm

500 years old ice at 130 m depth.
Average diameter: 2 mm
100,000 years old ice at2850 m depth.
Average diameter: > 2 cm
5 cm 5 cm
What causes the differencein crystal size ?
Let´s look at recrystallizationprocesses operating in polar ice.

Crystal size variations in the GRIP ice core, Central GreenlandSee explanations on following slides

Normal grain growth in the uppermost 700 m:
Simple analogy to a single grain (crystal) of ice embedded within the averaged environment of other grains:
A bubble of material 1 is blown into a medium of material 2, with ρ1 ∼ ρ2. To increase the volume of the bubble by dV wemust apply the work
W = PdV
The only resistance to the expansion of the bubble is theincreased surface area being formed and the associatedsurface energy γdA . At equilibrium:
PdV = γdA⇒ P(4πr2dr) = γ8πrdr⇒ P = γ dA/dV = γ (8πrdr)/(4πr2dr)⇒ P = 2γ/r
Thus, at equilibrium, a pressure difference is set up across theboundary between the bubble and the liquid enclosing it:
ΔP = 2γ/r (γ = surface tension [J/m2])
This pressure difference causes the liquid to rise in the capillary.

Normal grain growth in the uppermost 700 m (cont´d):
In a similar way, a pressure difference is set up across acurved boundary between two grains in a polycrystallinematerial like ice.
Pressure will normally be directed from the smaller grain to the larger grain (from the concave side of the boundary),causing molecules to jump across the boundary to the larger grain.
The boundary thus moves towards the center of the smallergrain, as indicated by the small, black arrows.
Ideally, grains with fewer than 6 edges will shrink, those withmore than 6 edges will grow. Grains with 6 edges and straightboundaries will be in equilibrium.
Note: Only grains with <6 edges and concave boundaries areanalogous to the bubble in the liquid (previous slide).
This leads to an increase in the average grain size (normal grain growth)!
Driving force: Minimization of surface energy.
Shrinks!
In equilibrium
Grows!
2-D view of ice crystals in a thin section. Figures indicate the number of edges of each grain.
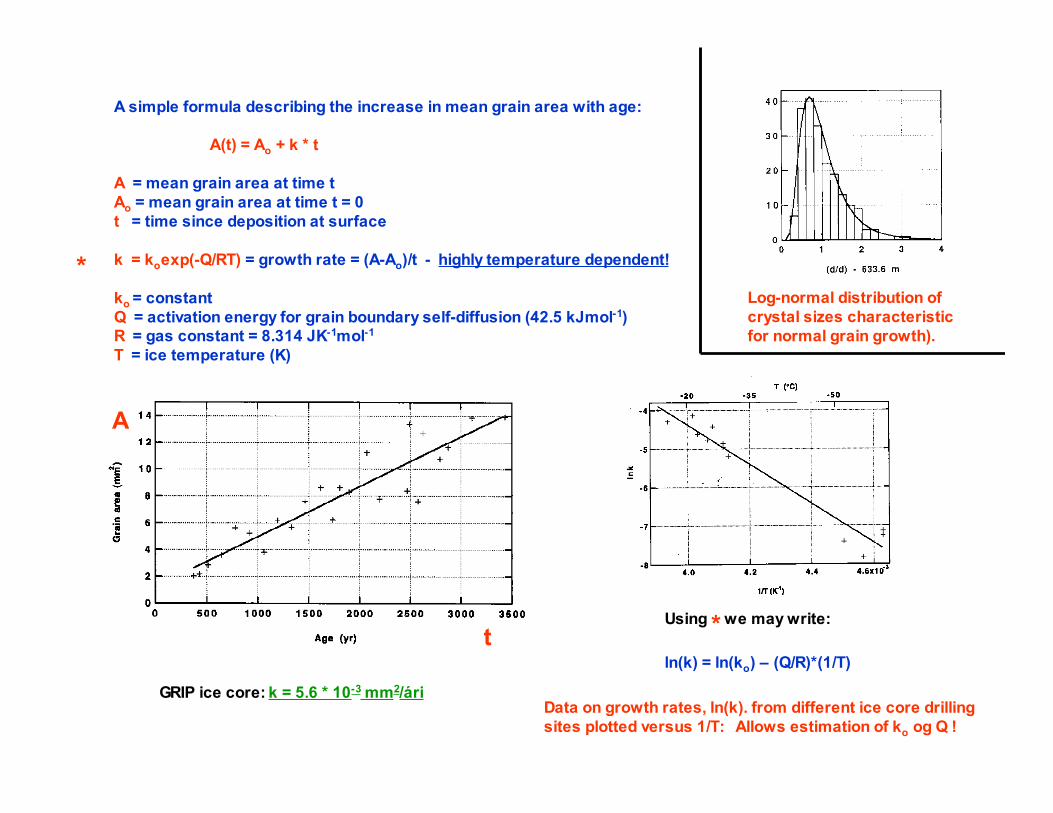
A simple formula describing the increase in mean grain area with age:
A(t) = Ao + k * t
A = mean grain area at time tAo = mean grain area at time t = 0t = time since deposition at surface
k = koexp(-Q/RT) = growth rate = (A-Ao)/t - highly temperature dependent!
ko = constantQ = activation energy for grain boundary self-diffusion (42.5 kJmol-1)R = gas constant = 8.314 JK-1mol-1T = ice temperature (K)
GRIP ice core: k = 5.6 * 10-3 mm2/ári
A
tln(k) = ln(ko) – (Q/R)*(1/T)
*
Data on growth rates, ln(k). from different ice core drilling sites plotted versus 1/T: Allows estimation of ko og Q !
Using * we may write:
Log-normal distribution of crystal sizes characteristic for normal grain growth).
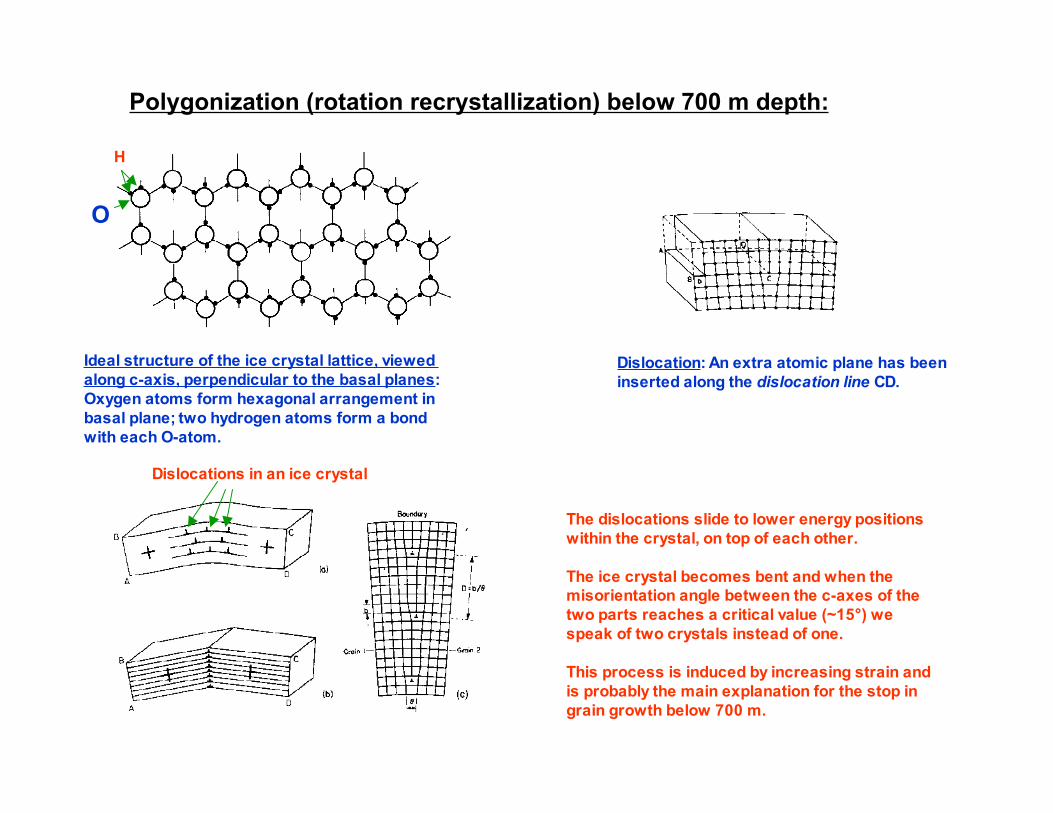
Polygonization (rotation recrystallization) below 700 m depth:
Ideal structure of the ice crystal lattice, viewed along c-axis, perpendicular to the basal planes:Oxygen atoms form hexagonal arrangement in basal plane; two hydrogen atoms form a bond with each O-atom.
O
H
Dislocation: An extra atomic plane has beeninserted along the dislocation line CD.
The dislocations slide to lower energy positions within the crystal, on top of each other.
The ice crystal becomes bent and when the misorientation angle between the c-axes of thetwo parts reaches a critical value (~15°) wespeak of two crystals instead of one.
This process is induced by increasing strain andis probably the main explanation for the stop in grain growth below 700 m.
Dislocations in an ice crystal

Lowest ~200 m of the ice sheet: Migration recrystallization
Nucleation and growth of large crystals at temperatures close to the melting point.Grain boundaries migrate rapidly, large interlocking crystals with irregularshapes are formed.
This recrystallization process is not well understood. The main driving force is believed to be the difference in stored strain energy between adjacent grains, in highly strained ice near the bed.
0.1 mm
Migration recrystallization on a small scale in NaCl:
The large grain boundary is mov ing to the left and a heav ilystrained (polygonized) grain structure is being consumed bya new, strain free grain. This grain, in turn, is becoming poly-gonized on the right. (From Guillopé and Poirer, 1979).
At 2800 m depth, annuallayers have thinned to 2% of their thickness at surface.
Migrating grain boundary

Crystallographic structure of ice Ih
Deformation of ice crystals
C-axis rotation
Fabric evolution and rheology of polar ice sheets

Each oxygen atom issurrounded by fourneighbouring oxygenatoms in a tetrahedralarrangement
Basalplanes
Hexagonal unit cell
c-axis = symmetry axis
a-axes - in basal plane
Ice crystal structure:

Basal plane – plane of closest packing of atoms, perpendicular to c-axis
Prismatic planes – vertical planes of the hexagonal cell
Pyramidal planes – at angle φ to c-axis
Ice crystal lattice viewedfrom the side
Basal glide – a dislocation moves through the lattice and positions ofbasal planes are shifted. Main deformation mechanism in ice!
a) Undisturbed
b) Dislocation shifts A to join B’
c) Top basal plane in a) has been sheared to the right relative to the lower basal plane
Crystallographic planes and basal glide:

Illustrating basal glide (basal slip)
No preferred slip direction withinbasal plane, crystal will deform inthe direction of the applied stress.
If stress τ is applied to an ice crystal,the deformation rate is stronglydependent on the direction of stressrelative to the basal planes.Deforms ~60 times) faster in “easy”glide position.
c-axis
A creep curve for a single crystal of ice.
The rate of deformation in a specifieddirection (strain rate) increases up to~20% strain, then reaches a steady value.
Explanation: Dislocation multiplication.Dislocation density in balance with appliedstress once stationary strain rate is reached.
Deforming single crystals of ice:

Deforming a polycrystalline ice sample Resulting creep curve
c-axes of individualcrystals randomlyoriented
Explaining the creep curve for polycrystalline ice:
1. Initial elastic deformation
2. Primary creep: Favourably oriented grains deform but load is gradually transferred to grains in “hard glide” positions, whereby the strain rate decreases.
3. Secondary creep: A temporary minimum in the creep rate, resulting from a balance between hardening in parts of the sample and recrystallization softening elsewhere.
4. Tertiary creep: A stage of accelerating creep, attributed to recrystallization in the sample, which produces grains more favourably oriented for deformation (c-axis at ~45° to axis of compression).
Deforming polycrystalline ice:

In a polycrystalline ice sample, the c-axis of a crystal confinedby its neighbours will rotate towards the axis of vertical compression!
In a samples subjected to tension, c-axes will rotate away fromthe axis of tension!
The rotation of c-axes on long timescales in ice sheets is observed in deep ice cores!
C-axis rotation under applied stress:

Uniaxial extension:At ice divide!
Uniaxial compression:At ice sheet summit!
Pure shear:Upper part of ice sheet outsideice divide
Simple shear:Lowest 10-15% of ice sheet, outsideice divide
Stress systems in ice sheets:

1. Prepare 0.5 mm thin section
2. Measure c-axisorientations
3. Plot c-axis orientations in horizontal plane, using a Schmidt net.
4. Interpret fabric diagrams
Random fabric Preferred fabric
Measuring c-axis fabrics on ice cores:
Equal area projection
Universal stage (now in museum!)

Random fabric: Near ice-sheet surface
Single maximum fabric:Develops at GRIP and Dome C
Vertical girdle fabric:Develops at NGRIP and Vostok
Strong single maximum fabric: In lowest 10-15% of ice sheet inlocations where simple shearis active
Observed indeformation tests,where strain ratesare much higherthan in natural icemasses!
Fabric evolution in ice sheets:

2840 m
806 m
148 m
1434 m
1860 m
2232 m
Fabric evolution in the GRIP and NGRIP ice cores, Greenland:
2250 m
1050 m
1750 m
250 m
2800 m
GRIP NGRIP
Single maximumdevelops at icesheet dome!Fabric evolutiondominated byvertical compression!
Vertical girdledevelops atice divide!Tension acrossdivide dominatesfabric development!