icc trade register report - international … risks in trade finance 1 reference information in this...
TRANSCRIPT

GUIDING INTERNATIONAL BANKING PRACTICE
DRIVING CHANGE IN TRADE FINANCE
ICC BANKING COMMISSION
2016 ICC TRADE REGISTER REPORTGLOBAL RISKS IN TRADE FINANCE
Market Trends
Regulatory Updates
Analysis of Short-Term Trade Finance Products
Analysis of Medium to Long-Term Trade Finance Products
What this means for Investors


1GLOBAL RISKS IN TRADE FINANCE
RE
FE
RE
NC
E IN
FO
RM
AT
ION
IN THIS REPORT
About the International Chamber Of Commerce (ICC) 2
Acknowledgments 3
Introducing Our New Partners 4
Foreword from the Chair of the of the ICC Banking Commission 6
Foreword from the Chair of the ICC Trade Register 8
Executive Summary 10
THE FULL REPORT
Introduction to the ICC Trade Register 12
Trade Finance: State of the Market 15
Analysis of Short-Term Trade Finance 21
Analysis of Medium-to-Long Term Trade Finance 51
What does this mean for Investors? 60
Looking Ahead: Evolution of the Trade Register 64
Conclusions 66
APPENDIX
Appendix A: Approach to Analysis 68
Appendix B: Data Collection and Filtering 74
Appendix C: Detailed Analysis Tables 78
Appendix D: List of Acronyms 84
AP
PE
ND
IXT
HE
FU
LL
RE
PO
RT
RE
FE
RE
NC
E IN
FO
RM
AT
ION
2 2016 ICC TRADE REGISTER REPORT | ABOUT THE INTERNATIONAL CHAMBER OF COMMERCE (ICC)
Chair, ICC Trade Register Project
Alexander R. Malaket, Deputy Head of the Executive Committee, ICC Banking Commission,
President, OPUS Advisory Services International Inc.
Technical Advisors, ICC Trade Register Project
Henri d’Ambrières, Senior Technical Advisor, MLT Trade Register, HDA Conseil
Hugo Verschoren, Senior Technical Advisor, Short-Term Trade Register, ING
Krishnan Ramadurai, Senior Technical Advisor, Basel Methodology and Capital Optimisation, HSBC
Project Management, ICC Banking Commission
David Bischof, Senior Policy Manager, ICC Banking Commission
Doina Buruiana, Project Manager, ICC Banking Commission
Boston Consulting Group
Sukand Ramachandran, Partner and Managing Director
Jarryd Porter, Project Leader
Ravi Hanspal, Consultant
Global Credit Data
Philip Winckle, Executive Director
Robert Korako, Methodology and Membership Executive
Design
www.wearezephyr.com
Printed in December 2016
Copyright © 2016
International Chamber of Commerce
ICC Publication No. 881E
ISBN: 978-92-842-0435-9
All rights reserved. ICC holds all copyright and other intellectual property
rights in this collective work. No part of this work may be reproduced,
copied, distributed, transmitted, translated or adapted in any form or by any
means – graphic, electronic or mechanical, and including without limitation,
photocopying, scanning, recording, taping, or by use of computer, the
internet or information retrieval systems – without written permission of ICC
through ICC Services, Publications Department.
Visit the ICC Banking Commission website:
www.iccwbo.org/about-icc/policy-commissions/banking
ABOUT THE INTERNATIONAL CHAMBER OF COMMERCE (ICC)
ICC is the world business organisation, whose mission it is to promote open trade and investment and to help business meet the challenges and opportunities of an increasingly integrated world economy.
With interests spanning every sector of private enterprise, ICC’s global network comprises over 6 million companies, chambers of commerce and business associations in more than 130 countries. ICC members work through national committees in their countries to address business concerns and convey ICC views to their respective governments.
ICC conveys international business views and priorities through active engagement with the United Nations, the World Trade Organization, the G20 and other intergovernmental forums. Close to 3,000 experts drawn from ICC member companies contribute their knowledge and experience into crafting the ICC stance on specific business issues.
For more information please visit: www.iccwbo.org

3GLOBAL RISKS IN TRADE FINANCE
RE
FE
RE
NC
E IN
FO
RM
AT
ION
This International Chamber of Commerce (ICC) Trade Register Report would not have been possible without the pathfinding work done during the global financial crisis of 2007–09 by the World Trade Organization (WTO), the Asian Development Bank (ADB), the ICC Banking Commission, and various partners and policy makers. We would like to acknowledge Steven Beck of the ADB and former WTO Director General Pascal Lamy for providing the initial impetus (and the ADB for the all-important seed funding) to create a consolidated Trade Finance database hosted by ICC.
The ICC Banking Commission is delighted to welcome two new partners, The Boston Consulting Group (BCG) and Global Credit Data (GCD), to the Project this year to position it for long-term evolution, value-addition and relevance.
BCG has been active in various trade and Trade Finance-related engagements, and is working to further develop its trade-related expertise and value propositions. Amsterdam-based GCD is a not-for-profit initiative to help banks to measure their credit risk across Europe, Africa, North America, Asia and Australia.
As always, the ICC Banking Commission extends special thanks our Member Banks. Their continued financial support, investment of time and resources, and uncommon focus on the “bigger picture” enables us to collect increasingly robust and meaningful data and produce this Report on an annual basis.
The findings of this report are based on an underlying data set and/or financial and resource contributions by 25 Member Banks:
ACKNOWLEDGEMENTS
Finally, the ICC Banking Commission would like to thank the Project leadership: Alexander R. Malaket, Chair, ICC Trade Register Project; David Bischof, Project Manager; Doina Buruiana of ICC; our team of Senior Technical Advisors, Henri d’Ambrières of HDA Conseil in France, Hugo Verschoren of ING Bank in Belgium and Krishnan Ramadurai of HSBC in the UK; the ICC Secretariat; Sukand Ramachandran, Jarryd Porter and Ravi Hanspal of BCG; and Philip Winkle and Robert Korako of GCD – the whole team has been instrumental in the design and execution of the 2016 Trade Register Project.
Note: The Trade Register data set is contributed by 25 banks and the scope of submitted data varies by participant.
Not all banks have submitted data across all years and across all product groups. Please refer to the main document
for additional detail. For confidentiality reasons, the specific scope of each bank’s contribution is not disclosed.
AKA Bank ANZBank of America Merrill Lynch Bank of ChinaBarclaysBMO Financial Group BNP ParibasCommerzbankCrédit Agricole CIB Deutsche Bank HSBCINGItau
J.P. Morgan Chase KfW IPEX-BankMizuho Rand Merchant BankRBS Santander Société GénéraleStandard BankStandard Chartered Bank Sumitomo Mitsui Banking Corp UniCreditWells Fargo

4 2016 ICC TRADE REGISTER REPORT | INTRODUCING OUR NEw PARTNERS
The ICC Banking Commission’s ambition since the creation of the ICC Trade Register in 2009 was always to continue to develop and improve the Trade Register as an important source of quality, trusted data and robust analytics aimed at supporting advocacy efforts and enhancing market understanding of the nature of Trade Finance among industry stakeholders. For 2016 and onwards, the ICC Banking Commission engaged in a strategic partnership with The Boston Consulting Group (BCG) and Global Credit Data (GCD) with an aim to leverage each other’s strengths and expertise in order to successfully continue ICC’s mission and ambition with the Trade Register Project.
GCD’s objectives, as set out in its Articles of Association, included providing its members with credit data collection, analysis and research, contributing to a better understanding of credit risk and promoting quality standardisation and transparency of data to improve credit risk management. ICC therefore seeks to leverage the data-collection and analysis competencies of GCD in order to remain focused on core strategic and advocacy activities.
Global Credit Data (GCD) is a non-profit association owned by 52 Member Banks with the simple mission to help banks better understand and model their credit risks through data pooling and benchmarking activities. GCD started collecting data in 2005, which Member Banks have exclusive access to, with the goal of helping banks develop Basel II compliant LGD and EAD models. This database has been used by Member Banks to successfully support their
IRB Advanced accreditation applications and now totals over 120,000 non-retail defaulted loan facilities from around the world. In 2009 GCD introduced a PD database which now covers more than 10 years of data and helps banks to calibrate and benchmark their Probability of Default (PD) masterscales in use for Basel II and III Advanced and Foundation models. The robustness and capacity of GCD’s data collection and management infrastructure places GCD databases as the global standard for credit risk data pooling.
Members not only benefit from exclusive rights and access to credit databases and analytics, but also from knowledge and research facilitation possible via the unique industry association. Through a variety of forums such as workshops, webinars and surveys, GCD is an active industry participant facilitating the discussion in key strategic areas including Loss Given Default (LGD) modelling, stress testing, Comprehensive Capital Analysis and Review (CCAR)/ International Financial Reporting Standards 9 (IFRS9) modelling. The highlights of these interactions are the North American and European GCD General Meetings held each year. The value of GCD membership extends beyond the data itself, to a deep network of highly experienced credit risk professionals.
GCD Members are ‘owners’ of the association, and data, and have a prominent role in steering strategic direction. This ensures GCD activities are member-centric driving the ‘by Banks for Banks’ credo.
INTRODUCING OUR NEW PARTNERS
5GLOBAL RISKS IN TRADE FINANCE
RE
FE
RE
NC
E IN
FO
RM
AT
ION
BCG has been key in the development of the 2016 Trade Register by contributing a strategic perspective to the initiative. ICC is engaging with BCG to tap into its expertise to position the Trade Register Project for long-term evolution, value-addition and relevance.
The Boston Consulting Group (BCG) is a global management consulting firm and the world’s leading advisor on business strategy. BCG partners with clients from the private, public, and not-for-profit sectors in all regions to identify their highest-value opportunities, address their most critical challenges, and transform their enterprises.
BCG’s expertise in the Financial Institutions sector spans all major topic areas to serve global, regional and local banks with detailed insight, knowledge and analysis across markets. Trade Finance is an established and growing topic area for BCG’s Corporate and Transaction Banking practices. BCG has supported clients in more than 20 recent Trade Finance-related projects globally to drive solutions to a broad set of industry questions and challenges, including market entry and growth, pricing, cost reduction, operations, and digital change and transformation.
BCG continues to support the broader Trade Finance community through thought leadership on topical issues in the field, including a recent publication on the Digital Revolution in Trade Finance. By partnering with the ICC Trade Register Project, BCG hopes to bring additional strategic insight, commercial and technical industry perspectives to the table, to ensure maximal value for the reader base as a whole.
Founded in 1963, BCG is a private company with 85 offices in 48 countries. For more information, please visit bcg.com.
BCG Regional Contacts in Trade Finance
Europe & Middle EastSukand RamachandranPartner and Managing Director London
Stefan DabSenior Partner and Managing Director Brussels
Jarryd PorterProject Leader London
Ravi HanspalConsultant London
AmericasPieter van den BergPartner and Managing Director New York
Asia-PacificTjun TangSenior Partner and Managing Director Hong Kong

The regulatory landscape around banking and financial services continues to evolve, and while it evolves it continues to play a central role in the strategic decisions and management of financial institutions, and their specific lines of business.
The regulatory landscape around banking and financial services continues to evolve, and while it evolves it continues to play a central role in the strategic decisions and management of financial institutions, and their specific lines of business.
Trade financing, an important element of traditional banking, is no exception. Capital adequacy and compliance requirements and expectations are reshaping Trade Finance; sometimes for the better and at other times with unintentional negative consequences for the financing of international trade and for trade-based development and inclusion.
The ICC Banking Commission is fundamentally supportive of the need to ensure a stable and secure global financial system. We want to work with regulatory authorities, from the Basel Committee on Banking Supervision to regional and national regulatory bodies, to deliver progress on this shared objective.
It remains critically important for dialogue between industry stakeholders and regulatory authorities to be open, candid and supported by data. These characteristics will support constructive outcomes, informed and effective regulation, and appropriate industry measures that respect regulatory expectations.
While certain aspects of the post-crisis regulatory environment remain in development, we see broad agreement that regulatory treatment of Trade Finance should be more risk-aligned. This allows for a balance between appropriately tight regulation and the conduct of legitimate business. This principle applies in compliance, as much as it does on the capital adequacy side. As a result, the ICC Trade Register Project exists to be the authoritative source of credit-related risk and default data on Trade Finance today.
As the ICC Banking Commission and the Project Team continue to evolve and advance the project, both in methodology and in wider coverage, it is imperative for them to continue to articulate the value and importance of the Trade Register and related advocacy, as the Basel Committee considers the latest revisions to global capital adequacy frameworks. The Project will continue to advance its approach, from data collection to analysis, while at the same time extending scope of product coverage and eventually, scope of the data collected, to move beyond pure credit data points.
FOREWORD FROM THE CHAIR OF THE ICC BANKING COMMISSION
Daniel SchmandChair, ICC Banking Commission
2016 ICC TRADE REGISTER REPORT | FOREwORD FROM THE CHAIR OF THE ICC BANkING COMMISSION6

RE
FE
RE
NC
E IN
FO
RM
AT
ION
7GLOBAL RISKS IN TRADE FINANCE
This year’s Trade Register Report reinforces findings that go back to 2009 on the low – even negligible – credit-related default and loss characteristics of Trade Finance. It includes a particular focus on the investor side of the market – an area of significant importance in assuring adequate levels of Trade Financing in the global financial system. It also features a strategic discussion on the importance of the data and analysis provided in the Report.
New partnerships with The Boston Consulting Group and Global Credit Data, put in place following extensive discussions and negotiations, have already proven very valuable and have had a clear positive impact on Project execution and on the production of this year’s Report.
As always, we welcome feedback and comments from interested parties. We will also be looking to increase the number of participating banks (and potentially other institutions), and the size of the data set(s) collected, in the coming year.
I take this opportunity to extend my thanks and appreciation to the Project Team, to the Member Banks, and to the numerous contributors whose insights and observations greatly enrich the quality of the 2016 edition of this flagship ICC publication.

2016 ICC TRADE REGISTER REPORT | FOREwORD FROM THE CHAIR OF THE ICC TRADE REGISTER8
The ICC Trade Register was first initiated in 2009 by the Asian Development Bank to underpin a data-based objective dialogue between Trade Finance practitioners and regulatory authorities around the world.
The consistency, quality and robustness of the data, and the clarity of the Report, have improved each year. The low to negligible credit-related default and loss rates in Trade Finance continue to be reflected in and substantiated by the data – $9.1 trillion in Short- and Medium to Long-Term Trade Finance exposure in 2015.
The urgency of the data collection and advocacy efforts related to the ICC Trade Register Project was clear as the Basel Accords evolved and trade industry executives engaged more actively and effectively with regulatory authorities. More recently, industry leaders – including those of banks contributing to the Trade Register – have openly debated the rationale for continuing investment of funds, resources, time and effort in the Project.
Furthermore, there is a moral hazard inherent in the ICC Trade Register; the banks that fund the Project and the teams that invest considerable time and effort to contribute data incur a cost that has benefitted the industry as a whole. We have paid close attention to these two points to maximise the value generated from the Report as a whole, and particularly to give back to the generous Member B0ank contributors.
As reflected in last year’s Report, we have succeeded in putting forward persuasive advocacy messages to the Basel Committee and to other regulatory bodies. Current developments in the area of capital adequacy and bank regulation suggest that the Basel Committee is looking to reconsider certain aspects of current capital regulation. If so, effective, fact-based and data-supported advocacy around the characteristics of Trade Financing becomes urgent once again.
The Trade Register Project has been restructured, with new partners to position for long-term evolution, value and relevance. We opted to keep the scope and nature of the data collection static for the 2016 edition as we worked to put the mechanisms of the new partnerships in place and continue to sharpen the core advocacy messages of the Project.
The ICC Banking Commission is delighted to welcome The Boston Consulting Group (BCG) to the Project. BCG has agreed to contribute to the evolution of the Trade Register Project in several respects, including by articulating the wider strategic context around Trade Financing and Trade Finance-related capital regulation. Additionally, BCG has extensive data analytics expertise to help produce the Trade Register Report.
FOREWORD FROM THE CHAIR OF THE ICC TRADE REGISTER
Alexander R. MalaketDeputy Head of the Executive Committee, ICC Banking CommissionChair, ICC Trade Register Project

9GLOBAL RISKS IN TRADE FINANCE
RE
FE
RE
NC
E IN
FO
RM
AT
ION
We are also delighted to be collaborating with Amsterdam-based Global Credit Data (GCD). This partnership follows months of dialogue, analyses and effort by both teams to devise a path to collaboration. GCD can complement its comprehensive credit data with Trade Finance-related data points, while providing the Banking Commission with access to a mature, proven data collection and analysis methodology which we expect will raise the quality and robustness of the Trade Register Report.
Our intention over the year ahead is to stabilise these new partnerships while expanding the scope of the Report in close consultation with our Member Banks. We are also developing a value-added element to the Project which will be available to Member Banks and will offset, at least partially, the moral hazard referenced earlier. The value-adding component will be conceptualised and developed with Member Banks, and may include the provision of personalised benchmarks and the access to data portals to use Trade Register data in internal modelling.
We will also work with Member Banks to explore how to make the Trade Register data more robust, so that it can enable banks to use industry-wide observations for their own internal risk modelling. This is a consistent request, particularly from non-
member financial institutions, and another element of the evolving value of the Project and the Trade Register Report.
The fundamental characteristics of Trade Finance remain at the core of the ICC Trade Register. It also addresses the widely acknowledged reality that balance sheet constraints are impeding the ability of banks to address market needs for Trade Financing. This effect is felt particularly in developing and emerging markets, and by Small and Medium-Sized Enterprises that are engaging in international markets.
The Trade Register Report is a flagship publication of the ICC Banking Commission. It is relevant and important to the business of Trade Finance and Supply Chain Finance, and is central to advocacy efforts, dialogue and deliberations with regulatory authorities around the world. It remains the only authoritative publication of its kind in the world today, and is poised now to evolve to even greater relevance and value.

10 2016 ICC TRADE REGISTER REPORT
International trade is central to the world economy and economic development, and a critical engine of growth across industries and markets. Indeed, pre-crisis trade had been increasing at twice the rate of GDP growth1 as existing corridors grew and new ones opened with the industrialisation of developing economies. Trade Finance underpins much of this trade, and provides importers and exporters with the financing and risk mitigation that allows them to transact with distant and often unfamiliar counterparties.
In order to manage Trade Finance as a product effectively, banks do not only need to understand the full risk profile (e.g. country, currency, counterparty, delivery, and credit risk) of their business, but also the regulatory and strategic implications. The ICC Trade Register aims to support banks achieve this by providing an objective, transparent view of the credit-related risks and characteristics of Trade Finance using a rich, data-driven approach. Detailed analysis and commentary also help build understanding of the global issues around Trade Finance and contribute to relevant informed policy and regulatory decisions. Several methodological enhancements have been made to the report this year to improve scope and accuracy, as part of the Trade Register’s evolution.
The 2016 report corroborates findings from previous years that Trade Finance products present banks with short average maturities, and little credit risk, with low default rates and loss rates. While this low credit risk profile is set to remain, Trade Finance is facing a number of changes to which banks must respond:
• Global trade is slowing, heavily affected by commodities and developing economies
• Banks are showing a reduced risk appetite, limiting supply and refocusing on their core
• Corporates are shifting towards Open Account, fuelled – in part – by Digital
• Regulatory compliance, while critical and well-intentioned, is a growing challenge to banks
• Margins are falling, driving the need for operational efficiencies
As banks respond to these, it is crucial they understand the credit, operational and
reputational risk implications of any strategic response to these challenges, on top of the commercial impacts.
For Short-Term Trade Finance specifically, the 2016 Trade Register reveals a slight uptick in defaults observed from 2013-2015 across products and geographic regions, resulting from a combination of one-off events and potentially more systematic factors. Nevertheless, these products continue to have a favourable risk profile versus comparable asset classes, such as corporate and small and medium-sized enterprise (SME) lending.
Similarly, for Medium to Long-Term Trade Finance, the 2016 Trade Register shows an increase in defaults across all regions except ex- Commonwealth of Independent States (ex-CIS) countries and the Middle East. Nevertheless, the vast majority of this effect is driven by two countries, Singapore and Spain, as a result of non-systemic, obligor-specific events. A marginal rise in Loss Given Default, and therefore Expected Loss was also evident in 2015. Despite these trends, however, the level of risk for Medium to Long-Term Trade Finance remains low, especially given Export Credit Agency backing.
The results of the 2016 Trade Register provide the basis for strong advocacy for favourable treatment of Trade Finance as an asset class by the Basel Accords. This would further increase the attractiveness of Trade Finance to banks, and in turn, provide benefit for global trade and market access. In parallel, there is also the case for Trade Finance to be increasingly recognised as an investible asset class from institutional investors, which may provide further funding and support for the industry.
Going forward, there are a number of avenues the ICC is exploring alongside its partners in order to drive additional value from the Trade Register, particularly for the Member Banks who have provided generous, continued support to the Project over past years. These include, but are not limited to, broadening the scope of products and risk categories assessed as part of the exercise, as well as developing a data-sharing provision so that Member Banks can utilise the Trade Register data for their own internal modelling.
EXECUTIVE SUMMARY
1. ICC Annual Global Survey 2016
11
TH
E F
UL
L R
EP
OR
T
GLOBAL RISKS IN TRADE FINANCE
THE FULL REPORT
Introduction to the ICC Trade Register
Context of the Report
Report Scope and Limitations
Overview of Methodology
Changes to Methodology in 2016
Trade Finance: State of the Market
Market Trends in Trade Finance
Regulatory Environment
Analysis of Short-Term Trade Finance
Overview of Findings
Observed Average Maturity
Trends in Default Rates
Import L/Cs
Export L/Cs
Loans for Import/Export
Performance Guarantees
Trends in Loss Given Default & Expected Loss
Feature: Default & Loss Experience in Emerging Markets
Analysis of Medium to Long-Term Trade Finance
Overview of Findings
Risk Characteristics of MLT Trade Finance Products
Observed Average Maturity
Default Rate Analysis
Loss Given Default & Expected Loss Analysis
Observed Recovery Rates
Loss Given Default
Expected Loss
Case Study: Medium to Long-Term Trade Finance in Iran
What does this mean for Investors?
Feature: Investor’s Perspective
Looking Ahead: Evolution of the Trade Register
Conclusions

12 2016 ICC TRADE REGISTER REPORT | INTRODUCTION TO THE ICC TRADE REGISTER
INTRODUCTION TO THE ICC TRADE REGISTER
Context of the Report
The ICC Trade Register Report presents a global view of the credit risk profiles of the Trade and Export Finance transactions. The Trade Register demonstrates the low-risk nature of the transactions that enable global trade and the trillions of dollars in economic value that flow from these commercial activities.
The ICC Banking Commission has prepared this Report in collaboration with The Boston Consulting Group (BCG) and Global Credit Data (GCD).
The Report draws on data from 25 Member Trade and Export Finance Banks – a representative set of Short- and Medium to Long-Term (MLT) Trade and Export Finance transactions globally that amount to more than 17 million transactions in total and an exposure in excess of US$9.1 trillion.
The data was then analysed by BCG, GCD, Member Bank specialists, and the ICC Banking Commission Project Team and Senior Technical Advisors. The methodology used is consistent with the approach used in past years, and, over time, the Trade Register Project has evolved to reflect the Basel framework.
While the Report format has varied, the objectives of the Trade Register Project stay the same, with the ambition to:
• Provide an objective, transparent view of the credit-related risk profile and characteristics of Short- and Medium to Long-Term Trade and Export Finance using rich, data-driven approach with the intention of contributing to relevant informed policy and regulatory decisions
• Progress the understanding of Trade and Export Finance, its importance to global trade and its highly effective global risk mitigation capability to a broad range of parties
• Promote understanding of the international regulations affecting bank capital requirements for Trade and Export Finance, and their history and objectives, in order to create a uniform global view of this industry as part of the ICC Banking Commission’s commitment to effective and collaborative advocacy
This year’s report continues the findings from past years – that Trade and Export Finance continues to present a low risk.
Report Scope and Limitations
Gathering representative data across a multitude of banks internationally is complex, and the Trade Register and this Report focus on the products and risks listed below. Starting in 2017, the scope of data collection will be extended across more products and to areas beyond credit-related data.
The Short-term product scope includes:
• Import Letters of Credit (referred to as Import L/Cs in this report)
• Confirmed Export Letters of Credit (referred to as Export L/Cs in this report)
• Loans for Import / Export
• Performance Guarantees and Standby Letters of Credit (referred to as Performance Guarantees in this report)
The scope of Medium to Long-Term Trade Finance products is limited to products for which an Organisation for Economic Co-operation and Development (OECD) Export Credit Agency (ECA) has provided a state-backed guarantee or insurance to the Trade Finance Bank. The Project Team intends to explore the extension of data collection to non-OECD Export Credit Agency-backed Medium to Long-Term Trade Finance.
The risk scope is currently restricted to credit risk.

13
TH
E F
UL
L R
EP
OR
T
GLOBAL RISKS IN TRADE FINANCE
The ICC Trade Register Project has continued to evolve over recent years, for example a growth in the Project’s geographic reach, number and diversity of contributors, volume and quality of data, and alignment of analytical methods to the Basel Approach.
Nevertheless, readers should be aware of the following characteristics and limitations:
• Data quality and completeness: Data collection process and the data set are highly complex. As such, we take great care to validate and review the data, and to apply consistent definitions across banks.
• Comparability of results: The ability to compare results between years is affected by improvements to the methodology and new participants to the Trade Register. In some case, the underlying data sample may differ between analyses.
• Inclusion of ‘technical defaults’: In line with Basel methodology, defaults are counted wherever an obligor is in default. As a result, the Trade Register reports values based on technical defaults, rather than only cash defaults which may overstate the default rate.
• Potential double-counting of defaults: In the current methodology, if a customer defaults across one country, product or transaction, it is assumed that they default across all countries (where they have business), products and transactions. This means that (i) summing the defaults in each country will slightly overstate the true global total number of defaults but that (ii) obligor and transaction default rates will be correct as both the numerator of defaults and denominator of all transactions and obligors are proportionally increased.
The appendix contains more detail on the products and risk types in scope, and considerations around data availability and comparability of results.
Overview of Methodology
An important methodological imperative for the Trade Register to-date has been to align the analysis and calculations to a Basel-compliant view, as the Basel regulations provide a uniform methodology with which to assess and manage credit-related risk.
There has been a multi-year effort, which is still ongoing, to align the data structure of the Trade Register, the methodology on a more detailed level and the calculations for the analytical results to a Basel-compliant view. Specific explanations on methodology and calculations are mentioned in the relevant sections prior to results and a full discussion on MLT calculations is shown in Appendix D. In recent years significant improvements were made in data collection and methodology that allowed greater alignment to the Basel approach, in particular:
• Probability of Default (PD) is reported at an obligor level and is able to be compared with default rates at both transaction level and obligor level
• Loss Given Default (LGD) figures are calculated per product group based on transactional data
• There is increased insight into Exposure at Default (EAD), albeit there remains further work to be done in order to derive robust results for all products
Reported Expected Loss figures produced are consistent with the underlying Basel methodology for the calculation of Expected Loss (EL) across various asset classes (i.e. Sovereign / Bank / Corporates). When making comparisons with other Basel compliant data, care should be taken in comparing the different weighting methods of obligor, transaction and volume. While exposure volume weighted data gives a good insight into the effects of defaults and losses on the banking industry, the normal default rates and LGD rates used and reported by banks are based on obligor or transaction weightings. In this latter case equal weight is given to small and large borrowers and transactions, meaning that obligor and transaction weighted data is more representative of smaller borrowers and transactions.
14 2016 ICC TRADE REGISTER REPORT | INTRODUCTION TO THE ICC TRADE REGISTER
Changes to Methodology in 2016
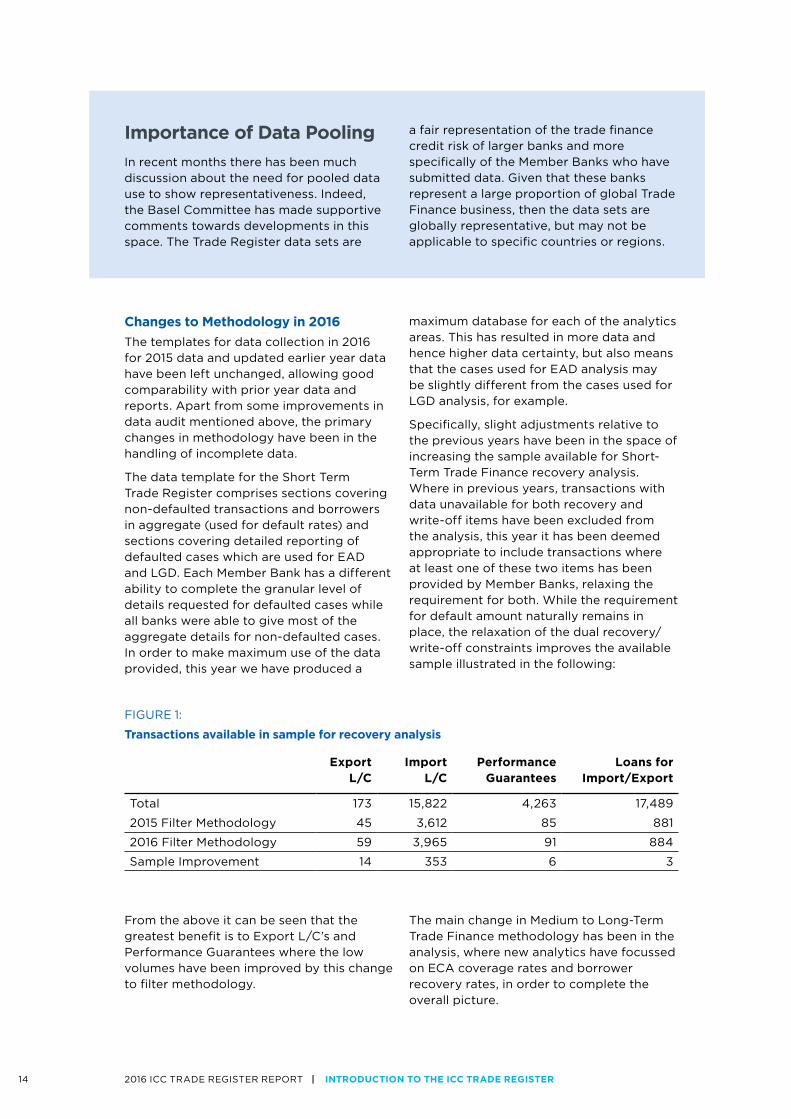
The templates for data collection in 2016 for 2015 data and updated earlier year data have been left unchanged, allowing good comparability with prior year data and reports. Apart from some improvements in data audit mentioned above, the primary changes in methodology have been in the handling of incomplete data.
The data template for the Short Term Trade Register comprises sections covering non-defaulted transactions and borrowers in aggregate (used for default rates) and sections covering detailed reporting of defaulted cases which are used for EAD and LGD. Each Member Bank has a different ability to complete the granular level of details requested for defaulted cases while all banks were able to give most of the aggregate details for non-defaulted cases. In order to make maximum use of the data provided, this year we have produced a
maximum database for each of the analytics areas. This has resulted in more data and hence higher data certainty, but also means that the cases used for EAD analysis may be slightly different from the cases used for LGD analysis, for example.
Specifically, slight adjustments relative to the previous years have been in the space of increasing the sample available for Short-Term Trade Finance recovery analysis. Where in previous years, transactions with data unavailable for both recovery and write-off items have been excluded from the analysis, this year it has been deemed appropriate to include transactions where at least one of these two items has been provided by Member Banks, relaxing the requirement for both. While the requirement for default amount naturally remains in place, the relaxation of the dual recovery/write-off constraints improves the available sample illustrated in the following:
FIGURE 1:
Transactions available in sample for recovery analysis
Export L/C
Import L/C
Performance Guarantees
Loans for Import/Export
Total 173 15,822 4,263 17,489
2015 Filter Methodology 45 3,612 85 881
2016 Filter Methodology 59 3,965 91 884
Sample Improvement 14 353 6 3
From the above it can be seen that the greatest benefit is to Export L/C’s and Performance Guarantees where the low volumes have been improved by this change to filter methodology.
The main change in Medium to Long-Term Trade Finance methodology has been in the analysis, where new analytics have focussed on ECA coverage rates and borrower recovery rates, in order to complete the overall picture.
Importance of Data Pooling
In recent months there has been much discussion about the need for pooled data use to show representativeness. Indeed, the Basel Committee has made supportive comments towards developments in this space. The Trade Register data sets are
a fair representation of the trade finance credit risk of larger banks and more specifically of the Member Banks who have submitted data. Given that these banks represent a large proportion of global Trade Finance business, then the data sets are globally representative, but may not be applicable to specific countries or regions.

15
TH
E F
UL
L R
EP
OR
T
GLOBAL RISKS IN TRADE FINANCE
TRADE FINANCE: STATE OF THE MARKET
Market Trends in Trade Finance
BCG perspectives using 2016 ICC Annual Global Survey on Trade Finance and Bank interviews.
Global trade is slowing, driven by commodities and developing economies From 1990 to 2008, international trade grew at approximately two times the rate of global GDP. In more recent years, this trend has slowed. With an estimated growth rate of only 1.7%, 2016 is likely to be the fifth consecutive year in which global trade growth lags global GDP growth. The lag is mainly in dollar-linked commodities, which fell in price by 50% in the first half of 2016 (e.g. 65% decline in energy and 30% decline in metals). In addition, the global trade mix is changing; developing economies now account for 42% of global trade (up from closer to 30% in 2000 according to UN estimates), and trade between developing and advanced economies is now greater than trade between advanced economies. The slowdown in trade is also subject to greater uncertainty through geopolitical risk. For example, the potential implications of Brexit and elections in the US, France and Germany on trade volumes and trade deals remain unknown.
Africa hardest hit but facing a positive outlook with Trade deals in pipelineThe effects of the fall in commodities prices have been felt most strongly in Africa, where 80% of exports are unprocessed commodities. Banks have suffered from a sharp decline in documentary trade business (SWIFT volumes declined by 15% for imports and 13% for exports by number of transactions) and from a squeeze on liquidity. The Continental Free Trade Agreement (CFTA), set for implementation in 2017, will create a single market across all African nations and could potentially reverse this slowdown.
Banks are showing a reduced risk appetite, limiting supply and refocusing on their coreDeclining Trade Finance volumes are not the result of reduced demand alone. The ICC Annual Global Survey found that 58% of Trade Finance proposals from small and medium-sized enterprises (SMEs) declined in 2015
(compared to 53% in 2014), suggesting that banks are increasingly cautious and restricting supply, especially down the credit risk curve. The Asian Development Bank (ADB) estimates that the gap between the demand for Trade Finance and the quantity supplied is $1.6 trillion. More broadly, several larger banks appear to be refocusing on their core home markets which is leading to consolidation.
Corporates are shifting towards Open Account, fuelled in part by DigitalIn parallel, greater certainty in cross-border trading and digital technologies are shifting volumes away from traditional “documentary” Trade Finance products into cheaper “open account” transactions. SWIFT Trade Finance traffic fell by 5% in 2015, after a 1.8% fall in 2014, and MT700 traffic is at its lowest level since 2008. Many of the bankers interviewed by BCG for this report expect that more secure and established trading relationships will continue to move away from documentary trade to other working capital financing solutions, such as supply chain financing, overdrafts and cross-border factoring (the latter of which is up by 22% on 2014).
This means documentary trade may become relatively more skewed towards higher risk trading partners without the credit profiles for open account transactions or the infrastructure for digital transactions. While average risk profiles may rise across portfolios of documentary Trade Finance, Open Account Trade is increasingly being used across non-developed corridors as well.
Regulatory compliance, while necessary, is a growing challenge for banks While Trade Finance volumes decline, complying with sanctions, trade embargoes and anti-money laundering (AML) regulations is becoming more challenging and expensive for banks with unintended consequences. While of critical importance and well-intentioned, requirements are higher than ever and policed more strictly. 90% of ICC Annual Global Survey respondents said that Financial crime compliance has been an impediment to business, up from 81% last year, and 65% consider the lack of cross-market regulatory harmonisation a major impediment.

16 2016 ICC TRADE REGISTER REPORT | TRADE FINANCE: STATE OF THE MARkET
FEATURE:
Trade Finance Product Advocacy in the Context of Capital Regulation
Today, it is clear to banks, corporates, regulatory authorities and policymakers alike, that timely and affordable access to Trade Financing is essential to the conduct of international commerce.
It is equally clear, and has been illustrated by the World Trade Organisation (WTO), the ICC, the ADB, International Finance Corporation (IFC), the African Development Bank and others, that access to Trade Finance is important to developing and emerging markets, particularly as they pursue growth and prosperity by accessing global supply chains. As start-up firms target international markets much earlier in their lifecycles, the SME segment – which the Organisation for Economic Co-operation and Development (OECD) recognizes as critical to the economic health of emerging, developing and frontier markets – is increasingly in need of adequate levels of Trade Financing.
Developing markets and SMEs are the two groups most keenly affected by shortages in Trade Finance. They also happen to be the constituencies most in need of these crucial financing instruments. While observers
note that global liquidity has shown signs of normalization, closer examination on the ground reveals that liquidity is concentrated at the top end of geographic and corporate markets. This occurs for a variety of reasons. Financial inclusion, and access to Trade Financing specifically, requires a nuanced combination of market dynamics, effective and targeted policy initiatives and appropriately balanced regulatory oversight.
We need to consider regulatory treatment and capital adequacy requirements linked to Trade Finance in this wider context – with a clear focus on the development and economic impact of regulatory requirements, and with an eye to risk-aligned treatment of Trade Finance products by regulatory authorities at the Basel Committee on Banking Supervision, and at regional and national levels of regulatory authority.
Margins are falling, driving the need for operational efficienciesSurvey respondents reported margin compression from declining demand and prices for low risk transactions, the increasing cost of compliance, and operational risk management. 31% see a need for higher fees and many are working to reduce operational costs by adopting new technology. Digital solutions such as Artificial Intelligence are promising operational solutions, using self-learning to automate repetitive tasks such as document checking and data entry and reduce manual effort required. Beyond cost efficiencies, digital tools can drive down operational risks caused by human error and which can affect the bottom line. As a result, a strong digital agenda is critical for trade banks.
Regulatory Environment
The Trade Register provides an evidence-based contribution to regulatory development One of the aims of the Trade Register is to contribute to the achievement of evidence-based, balanced and risk-aligned regulatory treatment of Trade Finance activity.
2016 regulatory update focuses on two most important regulatory themes under review by BaselKey regulations that affect Trade Finance include the Basel Accords on capital adequacy, liquidity and leverage as well as regulations relating to Anti-Money Laundering (AML) / Know Your Customer (KYC) / Know Your Customer’s Customer (KYCC) and Sanctions. These regulations

17
TH
E F
UL
L R
EP
OR
T
GLOBAL RISKS IN TRADE FINANCE
While the Banking Commission appreciates that there is limited sympathy in the market for cost-related impacts of regulation – including capital cost – the commercial and economic realities are that:
• Bank balance sheets today are generally constrained
• There is significant competition across the industry and within individual Institutions for allocation of limited bank capital
• Hard-dollar and capital costs factor into strategic, long-term decisions about allocation of capital and the returns associated with various financial services lines of business, including Trade Finance
At the same time, the explicit and implicit pressures to reduce overall risk exposures in support of prudential regulatory objectives, coupled with a systemic sensitivity around reputational risk, further reduce the willingness of certain banks to engage in cross-border business, particularly in markets that are perceived to be relatively higher-risk.
While we appreciate that it is difficult for authorities to treat a large number of financial sector products or lines of business with different regulations, the unique characteristics of Trade Finance have been thoroughly and objectively demonstrated in
the research, analytics and advocacy work conducted over the last several years.
Those unique characteristics can be observed at the level of economic value creation (certainly in terms of scope and global reach) described above, and in the extremely favourable default and risk profile of the business overall, demonstrated for the last seven years through the ICC Trade Register.
In the end, the intention of advocates for Trade Finance is to propose and arrive at a risk-aligned regulatory treatment of Trade Finance, with the understanding that risk models, data collection and analytics and overall advocacy efforts can and should improve year-over-year.
The unintended and restrictive consequences of necessary regulatory frameworks must be avoided, while ensuring the continued health and sustainability of trade flows. This is crucial to preserve the engagement of banks in the business of trade, and thus access to adequate (and increasing) levels of Trade and Supply Chain Finance – particularly for underserved SMEs and players in developing or emerging markets.
Source: Extract from ICC submission to consultation on “Reducing variation in the credit risk-weighted assets - constraints on the use of internal model approaches” – June 2016
are explained in detail in the 2013 Report, and regulation updates were summarised in the 2014 and 2015 Reports. As a result, this Report provides a brief overview of the Basel requirements and focuses on two of the most important regulatory themes under review by Basel (and the related ICC advocacy):
(i) “Revisions to the Standardised Approach to credit risk”;
(ii) “Reducing variation in the credit risk-weighted assets – constraints on the use of internal model approaches”
Overview of Basel II/III
The Basel accords are a set of internationally agreed capital standards that aim to assess the amount of capital banks need to hold
to remain solvent. For credit risk, banks should hold capital against on-balance sheet exposures (e.g. term loans) and off-balance sheet exposures (e.g. revolving facilities and contingent products such as L/Cs and Performance Guarantees).
Standardised approach or Internal Ratings based modelling used to calculate RWAFor banks or portfolios which are not complex and not well diversified, the Basel accord prescribes a standardised approach to determining capital requirements. Under this approach capital requirements are based on broad customer/product categories with risk weights being assigned by regulators and do not reflect banks’ own assessments of the risk. For banks or portfolios that meet minimum data submission thresholds (and

18 2016 ICC TRADE REGISTER REPORT | TRADE FINANCE: STATE OF THE MARkET
with more advanced risk measurement and management capabilities), the Basel accord allows banks to use an Internal Ratings-Based (IRB) approach to determine the capital requirements. This includes both the Foundation IRB (F-IRB) and Advanced IRB (A-IRB) approaches. The Probability of Default, Loss Given Default, Exposure at Default, Maturity and a regulatory determined parameter are then combined in a prescribed formula to determine the Risk Weighted Asset (RWA) of each exposure, which in turn generates a minimum capital requirement for each exposure. These are aggregated to calculate the total capital that needs to be held by a bank.
Basel rules overhauled in response to 2007-08 financial crisisIn response to the financial crisis which began in 2007–08, the Basel II rules were overhauled into Basel III with new requirements primarily centred on:
• Liquidity risk: Basel III introduced two new measures to help address liquidity, one of the causes of bank failures during the crisis. The Liquidity Coverage Ratio was introduced to enhance the level of liquid assets banks hold, while the Net Stable Funding Ratio was announced to better align the maturities of assets and liabilities across bank portfolios, and reduce overall mismatches and thereby reduce risk.
• Leverage: As a backstop to banks holding low levels of capital due to low RWAs, a leverage ratio requiring banks to hold capital equal to 3% of the exposure (whether off- or on-balance sheet) was incorporated.
• Capital requirements: The quality and amount of capital needed to be held by banks was also enhanced to require the use of more loss-absorbing capital. At the same time, many regulators increased the minimum amount of capital required as a proportion of the banks’ RWAs.
Impact of ICC Trade Register: Helping shape capital regulation since 2010
Capital rule changes in 2011 informed using data from original Trade Register ReportsFollowing concerns raised at the G20 meeting in 2010 about the potential impacts of Basel III on the financing of international trade, regulators met with the World Bank, the World Trade Organization and the ICC to discuss the characteristics of Trade Finance. Data from the Trade Register was used to help inform the discussions, after which updates were made to the proposed capital rules for Trade Finance in October 2011:
• Waved one-year maturity floor: Under Basel II, a maturity floor of one year was set for the calculation of RWAs under the Advanced Internal Ratings Based approach. A one-year maturity floor would require banks to hold capital longer than the average tenor of a Short-Term Trade Finance transaction, determined through the Trade Register data to be approximately 125 days for issued and confirmed L/Cs. The Basel Committee decided to waive the one-year maturity floor for both issued and confirmed Trade Finance instruments with a maturity of less than a year, and gave national regulators the discretion to waive the floor for other Trade Finance instruments. It is estimated that this would reduce the capital charge on a Trade Finance facility to a BBB rated obligor from 2.9% to 2.6%. A number of regulators, including those in the EU, the US and Hong Kong, have subsequently extended the waiver to cover all Trade Finance transactions.
• Waived sovereign floor: Basel II stipulated that claims on an unrated bank could not receive a risk weight below that applied to claims on its sovereign of incorporation (i.e. the country in which the bank is based). This requirement was waived for Trade Finance instruments.

19
TH
E F
UL
L R
EP
OR
T
GLOBAL RISKS IN TRADE FINANCE
Further capital rule changes since 2011Since 2011, there have been further capital rule changes. Given that the ICC Trade Register data is useful to convey the low-risk nature of Trade Finance, and helps promote this view in the written consultations on proposed changes in regulation.
Adjustments to regulations for Trade Finance exposures since 2011 were:
• Reduced Credit Conversion Factor (CCF) for the Leverage Ratio: The initial definition of the Leverage Ratio in Basel III set a uniform 100% CCF for all off-balance sheet exposures. In January 2014, the Basel Committee decided that short-term trade Letters of Credit and Guarantees would receive the risk based CCF of 20% and 50% respectively (based on Standardised CCFs). This was in line with industry thinking that Trade merited a different treatment due to the transaction specific short-term nature of trade products and its low default rates, as seen in the Trade Register. To take 100% of the nominal exposure for trade products would be punitive as the leverage ratio is more of a backstop to the capital calculations.
• Reduced Credit Conversion Factor (CCF) for the Exposure at Default calculation for Performance Guarantees: The Capital Requirements Regulations (CCR) within the European Union (EU) CCFs for Performance Guarantees were brought down from 50% to 20%. This was again in line with industry views, studies and data collected by the Trade Register.
• Changed inflow assumptions in Europe: The liquidity coverage ratio (LCR) in Basel III requires banks to assume that in any given month 50% of all inflows will be drawn down. However, for Trade Finance facilities the Capital Requirements Regulation (CRR) of EU allows banks to assume zero draw down of inflows.
Current Basel Committee Consultations
Two important regulatory themes affecting Trade Finance currently under review by BaselSince 2014, the Basel Committee has been in ongoing consultation (including undertaking Quantitative Impact Studies (QIS)) on two key topics affecting Trade Finance:
(i) “Revisions to the Standardised Approach to credit risk” (first consultation paper December 2014 and second consultation paper December 2015)
(ii) “Reducing variation in the credit risk-weighted assets – constraints on the use of internal model approaches”
A summary of the objectives of these two proposals, as communicated by the Bank for International Settlements, are to:
• Reduce mechanistic reliance on external credit ratings
• Increase risk sensitivity
• Reduce national discretions
• Strengthen the link between the Standardised Approach and Internal Ratings-Based approach to RWA calculations
• Reduce excessive variability in the capital requirements for credit risk (i.e. to achieve less variability between Banks)
• Provide better clarity on the application of the standards
Specific proposals under consideration (including updates following last year’s report) that affect Trade Finance include:
• Supplement external ratings for Banks and Corporates with internal Due Diligence
• Use standardised risk weights for unrated exposures and for jurisdictions that do not allow the use of external ratings
• Introduce Credit Conversion Factors for unconditionally cancellable commitments (UCC)
• Change CCF for off-balance sheet items
• Implement differentiated risk weights to Multilateral Development Banks (MDBs)
• Limit the use of the IRB approach to certain portfolios (e.g. select large corporates)

20 2016 ICC TRADE REGISTER REPORT | TRADE FINANCE: STATE OF THE MARkET
ICC has put forward recommendations to ensure appropriate treatment of Trade FinanceData from the ICC Trade Register has been used to support the ICC’s submissions on these topics in March 2015 and June 2016. A summary of the key recommendations for Trade Finance put forward by ICC includes:
• Differentiated treatment for claims on banks less than 90 days old and rolled over
• Differentiated treatment for Trade Finance exposures to corporate counterparties
• CCF for Commitments be revised to 20% or 50% based on exposure/product
• Application of 0% CCF for certain types of Trade Finance commitments
• Recalibration of CCF from 50% to 20% for certain types of Trade-related Guarantee exposures
• Continued use of external ratings for emerging market MDBs when they are not highly rated or qualifying MDBs
• Greater clarity and guidance around the application of CCF to off-balance sheet items.
• Improved consistency in the application of CCF to Letters of Credit
• Specific guidance relative to appropriate/best practices in the reporting of CCF, specifically around aggregation of sub-limits covering multiple products and the risk weighting assigned in the context of such structures
• Specific or lower risk weights for commodity Trade Finance when supported by strong structures and liquid collateral
• Clarify the use of insurance contracts issued by ECAs and other insurance companies when they satisfy the eligibility requirements set out under the collateral mitigation framework
• Banks should be able to continue to use their internal IRB models with suitable caveats being built into LGD and EAD estimates
• Data pooling should be used as a means for determining conservative values for PD, LGD and EAD risk parameters
• Where risk modelling standards set are not met, F-IRB parameters for unsecured exposures should be considered
• Two-tiered CCF values should be utilised in line with product characteristics
• Reconfirm that the maturity floor waiver (MFW) for Trade exposures given in 2011 is still relevant for both F-IRB and A-IRB approaches
• Use of CCF as a proxy to determine not only the on-balance sheet values of Trade products like letters of credit (L/C) and guarantees but also the undrawn balances which is essentially the difference between current exposures and limits.
• Clarify the use of insurance policy as a valid risk mitigation tool
Submissions aimed to ensure risk characteristics of Trade Finance properly consideredIn addition to this summary, the Trade Register project submitted a more complete response on an item by item basis. The ICC’s submissions to both consultations seek to ensure that the Basel Committee fully appreciates the importance of avoiding unintended adverse impact on trade activity resulting from regulatory changes that are not aligned with the risk characteristics of Trade Finance. Further, submissions have aimed to ensure that the industry does not collectively take a step back in its efforts to achieve a balance between regulation and access to adequate levels of Trade Finance, particularly for SMEs and developing markets.
Ongoing consultations reinforce the importance of the Trade Register ProjectIt is not currently known what role these recommendations will play in the final version of the regulation. However, the Trade Register may again prove to be invaluable in informing further analysis and advocacy in this area, and continuing consultations by the Basel Committee reinforce the ongoing relevance and importance of the work of the ICC Banking Commission and our partners and Member Banks in the context of the Trade Register Project.

21
TH
E F
UL
L R
EP
OR
T
GLOBAL RISKS IN TRADE FINANCE
Overview of Findings
The ICC Trade Register filtered data set now details $8.5 trillion of exposures and 17 million transactions across Short-Term Trade Finance products: Import L/Cs, Export L/Cs, Loans for Import/Export and Performance Guarantees. This enables detailed analysis of the credit risk characteristics of these products.
This year’s analysis corroborates previous findings: namely, Short-Term Trade Finance products present banks with low levels of credit risk. Default rate or probability of default (PD) is low across all products and regions.
The Default rate (weighted by exposure) is 0.08% for Import L/Cs, 0.04% for Export L/Cs, 0.21% for Loans for Import/Export and 0.19% for Performance Guarantees. 2015 data reveals a slight upward trend in default rates from 2013 onwards, varying by product and region.
ANALYSIS OF SHORT-TERM TRADE FINANCE
FIGURE 2:
Total Exposures and Default Rate by Exposure by Product, 2008-2015
Product Total Exposures ($)
Defaulting Exposures ($)
Default Rate by Exposures (%)
Import L/C 2,019,406,161 1,604,158 0.08%
Export L/C 1,201,351,862 461,315 0.04%
Performance Guarantees 1,370,502,873 2,618,945 0.19%
Loans for Import / Export 3,919,215,354 8,072,880 0.21%
FIGURE 3:
Total Obligors and Default Rate by Obligor by Product, 2008-2015
Product Total Obligors
Obligor Defaults
Default Rate by Obligors (%)
Import L/C 153,967 541 0.35%
Export L/C 116,646 55 0.05%
Performance Guarantees 240,458 1,152 0.48%
Loans for Import / Export 203,811 1,623 0.80%
FIGURE 4:
Total Transactions and Default Rate by Transaction by Product, 2008-2015
Product Total Transactions
Transaction Defaults
Default Rate by Transactions (%)
Import L/C 4,213,240 3,976 0.09%
Export L/C 2,098,540 198 0.01%
Performance Guarantees 2,081,377 4,010 0.19%
Loans for Import / Export 8,692,811 20,519 0.24%

22 2016 ICC TRADE REGISTER REPORT | ANALySIS OF SHORT-TERM TRADE FINANCE
FIGURE 5:
Overview of Default Rate, LGD and Expected Loss by Product, 2008-2015
For the period of 2008-2015, Loss Given Default (LGD) rates are 27% for Import L/Cs, 40% for Export L/Cs, 35% for Loans for Import/Export and 65% or 5.5% (when reflecting the low ‘claim rate’ and negligible losses) for Performance Guarantees. Time to recovery is unusually short for Trade Finance exposures: 0.2 to 0.5 years, compared to over 1 year for other asset classes shown in Figure 6 (with the exception of commodities finance).
The PDs and LGDs above translate into low Expected Losses (EL) across all products: 0.02% for Import and Export L/Cs, 0.07% for Loans for Import/Export and 0.01% for Performance Guarantees over 2008-2015. Only exposures to other banks and financial institutions have lower loss rates.
Average effective maturities are short across products, albeit slightly higher for Performance Guarantees. These short maturities of Trade Finance products mean they have low risk weights in the Basel regulatory capital framework.
Product Default Rate by Exposures
Exposure at Default
Loss at Default
Expected Loss
Import L/C 0.08% 100% 27% 0.02%
Export L/C 0.04% 100% 40% 0.02%
Loans for Import / Export 0.21% 100% 35% 0.07%
Perf. Guarantees Applying CCF to EAD 0.19% 8.5% 65% 0.01%
Perf. Guarantees Applying CCF to LGD 0.19% 100% 5.5% 0.01%
Benchmarking Trade Finance Characteristics against other Asset Classes
As a new addition to the 2016 Trade Register, characteristics of Short-Term Trade Finance products are benchmarked against comparable Asset Classes to help reflect the low risk nature of Trade Finance throughout the report.
Trade Finance is shown to have typically lower default rates and expected losses than other Asset Classes, but similar or marginally higher rates of loss given default. Time to recovery is consistently lower for Trade Finance products.
The comparisons above bring together data from different databases in an attempt to make a very high level comparison of observed loss statistics by product
types and borrower types. There are differences in submitting banks, data pools, methodologies and filtering which urge caution in the use of both the comparative and absolute levels of default and LGD and the resultant EL. Please see Appendix A (Benchmarking: Comparison of Trade Finance to other Asset Classes) for further details.

23
TH
E F
UL
L R
EP
OR
T
GLOBAL RISKS IN TRADE FINANCE
Import L/C
Export L/C
Loans for Import / Export
Perf. Guarantees1
Product / Asset Class
Default Rate by Exposures LGD
Expected Loss
Time to Recovery (Years)
0.08%
0.04%
0.21%
0.19%
0.50%
0.20%
0.10%
0.20%
Trade Finance Other products
27%
40%
35%
65%
28%
28%
33%
25%
2%
2%
7%
1%
14%
6%
3%
5%
0.5
0.3
0.4
0.2
1.2
1.2
2.3
0.7
FIGURE 6:
Comparison of Trade Finance to other Asset Classes
Note: Based on 2008-2015 data for Trade Finance, and 2000-2015 data for other products.
1. LGD of 65% if applying 8.5% ‘claim rate’ to EAD; 5.5% if applying to LGD (see explanation within this pack). Regions and Countries reflect those of Obligor
Source: GCD, ICC Trade Register 2016
Small / Medium Enterprise
Large Corporate
Banks & FIs
Commodities Finance
Observed Average Maturity
In general, the longer the maturity of a bank’s credit exposures, the riskier they are. Over a longer period of time, more can go wrong, and the bank may find itself unable to reduce its exposure to a failing borrower. By definition, Short-Term Trade Finance products have short contractual maturities and are often issued on a transaction basis (i.e. they are not revolving facilities). This reduces the risk to banks, because they can respond deteriorating credit quality
in a Trade Finance customer by ceasing to underwrite its trade business.
The Trade Register showed average contractual maturity for Short-Term Trade Finance products to be 122 days for Import L/Cs, 133 days for Export L/Cs, 160 days for Loans for Import / Export and 582 days for Performance Guarantees over 2008-2015. The variation of maturities even within products is significant, driven by banks apparently writing very different types of business.
FIGURE 7:
Average Maturity by Short Term Product, 2008-2015
Weighted average maturity
Short-Term Trade Finance product Average maturity
Minimum maturity
Maximum maturity
Import L/C 122.2 51.2 213.4
Export L/C 133.8 55.2 758.2
Loans for Import / Export 160.0 52.1 442.9
Performance Guarantees 582.4 2.9 1,153.2

24 2016 ICC TRADE REGISTER REPORT | ANALySIS OF SHORT-TERM TRADE FINANCE
FIGURE 8:
Default Rate Trends across Products, 2013-2015
By Exposures By # Obligors By # Transactions
Import L/C
0.04%0.13% 0.11%
0.60% 0.60%1.5%
1.5%
1.5%
1.5%
0.60% 0.60%
0.60% 0.60%
0.60% 0.60%
0.30% 0.30%0.9%
0.9%
0.9%
0.9%
0.30% 0.30%
0.30% 0.30%
0.30% 0.30%
0.45% 0.45%1.2%
1.2%
1.2%
1.2%
0.45% 0.45%
0.45% 0.45%
0.45% 0.45%
0.15% 0.15%0.6%
0.6%
0.6%
0.6%
0.3%
0.3%
0.3%
0.3%
0.15% 0.15%
0.15% 0.15%
0.15% 0.15%
0% 0%0%
0%
0%
0%
0% 0%
0% 0%
0% 0%
Loans for Import / Export
Performance Guarantees
Export L/C
2013 2014 2015 2013 2014 2015 2013 2014 2015
0.01%
0.17%
0.20%
0.01%
0.23%
0.13%
0.11%
0.36%
0.42%
0.28%0.43% 0.51%
0.06%
0.61%
0.42%
0.03%
1.10%
0.61%
0.08%
0.98%
0.64%
0.09% 0.10% 0.14%
0.01%
0.22%
0.23%
0.01%
0.36%
0.23%
0.03%
0.29%
0.28%
FIGURE 9:
‘Like-for-Like’ (excluding new banks) Default Rate Trends, 2013-2015
By Exposures By # Obligors By # Transactions
Import L/C
Loans for Import / Export
Performance Guarantees
Export L/C
0.04%0.14% 0.11%
0.01%
0.17%
0.21%
0.02%
0.27%
0.14%
0.12%
0.46%
0.42%
0.29%0.45% 0.53%
0.06%
0.62%
0.43%
0.03%
1.10%
0.54%
0.09%
0.93%
0.58v
0.09% 0.10% 0.14%
0.01%
0.22%
0.24%
0.01%
0.32%
0.17%
0.03%
0.24%
0.21%
2013 2014 2015 2013 2014 2015 2013 2014 2015

25
TH
E F
UL
L R
EP
OR
T
GLOBAL RISKS IN TRADE FINANCE
FIGURE 10:
Import LC Default Rates by Region (weighted), 2013-2015
By Exposures By # Obligors By # Transactions
Africa APAC Central & South America
Europe Middle East
North America
Other
Note: Regions and Countries reflect those of Obligor Source: ICC Trade Register 2016
The one product category which stands out with structurally longer maturity is Performance Guarantees. Performance Guarantees are often used for long-term projects or long-term contractual obligations, such as infrastructure projects. This may suggest that Performance Guarantees should not be counted as a Short-Term Trade Finance product. However, in terms of their structure, their use by clients and the way banks manage their risk, Performance Guarantees closely resemble the uncontroversial examples of Short-Term Trade Finance products and are included in the Trade Register.
Trends in Default Rates
Default rates observed in the ICC database have been rising marginally across products and regions since 2013, albeit from a very low level.
To test whether new banks have potentially clouded the data sample, the analysis was re-run to remove any bank that did not submit data for three consecutive years from 2013–2015. This had little effect on the figures, with the upward trend remaining clear. In fact, the increased sample reflected improvement in some areas, such as the default rate for Loans for Imports / Exports.
Deeper analyses by product and geography suggest this trend is driven by a mix of one-off events, such as the default of a large importer, and more systemic factors. Political and economic uncertainty in many regions, combined with falling commodities prices, makes an increased default rate in Trade Finance unsurprising.
The changing profile of Trade Finance customers may also be a factor. Demand for documentary Trade Finance is declining among well-established importers and exporters in developed economies. Trade Finance is also skewing further towards smaller counterparties and developing economies, potentially worsening the average risk profile of customers.
Import L/CsDefault rates for Import L/Cs appear to be rising across regions, moving from 0.04% (weighted by exposure) in 2013 to 0.11% in 2015. Increases are similarly marked when considering the percentage of obligors in default (0.28% to 0.51%) and the percentage of transactions in default (0.09% to 0.14%). Regional analysis shows that the upward trend in defaults is attributable primarily to North America, Europe and Asia Pacific.
0%
0.15%
0.30%
0.45%
0.60%
0.75%
2013 2014 2015 2013 2014 2015 2013 2014 2015
0%
0.15%
0.30%
0.45%
0.60%
0.75%
0%
0.15%
0.30%
0.45%
0.60%
0.75%

26 2016 ICC TRADE REGISTER REPORT | ANALySIS OF SHORT-TERM TRADE FINANCE
FIGURE 11:
Import L/C Default Rates by Region (absolute), 2013-2015
Africa APAC Central & South America
Europe Middle East
North America
Other
Average Default Rate by Exposure
Average Default Rate by # Obligors
Average Default Rate by # Transactions
2013 2014 2015
0.00%
0.15%
0.30%
0.45%
0.60%
0.75%
2013 2014 2015
0.0%
0.5%
1.0%
1.5%
2.0%
2.5%
2013 2014 2015
0.0%
0.2%
0.4%
0.6%
0.8%

27
TH
E F
UL
L R
EP
OR
T
GLOBAL RISKS IN TRADE FINANCE
Note: Regions and Countries reflect those of ObligorSource: ICC Trade Register 2016
Total Exposures
Total Obligors
Total Transactions
0
$0.2B
$0.4B
$0.6B
$0.8B
$1.0B
0
$100B
$200B
$300B
$400B
$500B
$600B
$700B
$800B
2013 2014 2015 2013 2014 2015
Defaulting Total
0
100
200
300
0
20,000
40,000
60,000
2013 2014 2015 2013 2014 2015
Defaulting Total
0
500
1,000
1,500
0
500,000
1,000,000
1,500,000
2013 2014 2015 2013 2014 2015
Defaulting Total
%%

28 2016 ICC TRADE REGISTER REPORT | ANALySIS OF SHORT-TERM TRADE FINANCE
FIGURE 12:
Import L/C Default Rates in Canada (absolute), 2013-2015
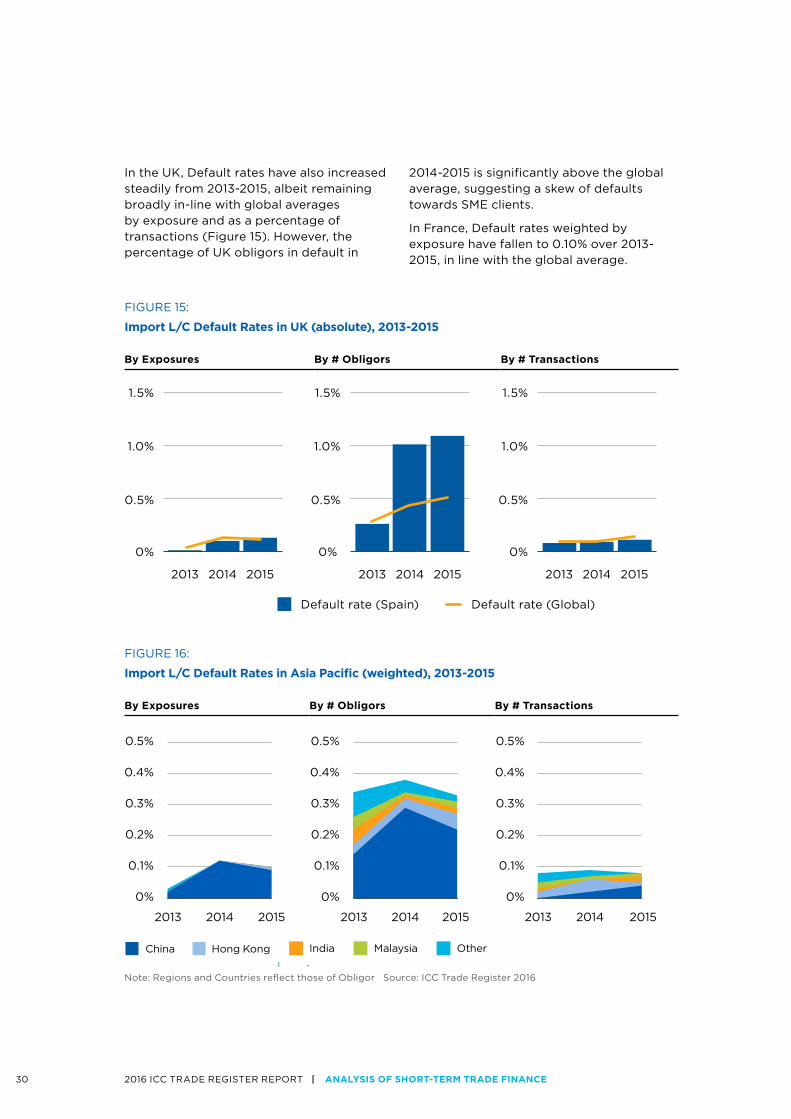
In absolute terms, while default rates rose sharply in North America and Europe in 2015, rises in Asia Pacific are much more modest and rates remain below global average.
North America saw a spike in default rates weighted by exposure (up to 0.28%), as a percentage of obligors (0.76%) and as a percentage of transactions (0.8%) from 2013-2015. This was driven by both the US and Canada, although different patterns emerge between the two countries.
The rise in US defaults in 2015 is due to eight defaulting obligors out of a total of 1,400. While these defaulting obligors, on average, had fewer transactions (six per obligor), the average value per defaulting transaction is approximately 2.5x non-defaulting transactions. This is further skewed by the fact that the majority of this rise in defaults was concentrated at a single bank with obligors defaulting on particularly high-value transactions.
In Canada, default rates also rose sharply over 2013–2015, with absolute default rates in 2015 of 0.80% by exposure (significantly higher than the US), and 2.10% at an obligor level (Figure 12). By number of transactions, the 2015 default rate is even higher at 3.5%.
The driver behind these high default rates was the failure of a single large importer. Because of the small number of defaults in any given country, a single large defaulting obligor can distort exposure-weighted and per-transaction default rates.
0% 0% 0%
2013 20132013
Default rate (Canada) Default rate (Global)
2014 20142014 2015 20152015
1.0% 1.0% 1.0%
2.0% 2.0% 2.0%
4.0% 4.0% 4.0%
3.0% 3.0% 3.0%
By Exposures % By # Obligors % By # Transactions %

29
TH
E F
UL
L R
EP
OR
T
GLOBAL RISKS IN TRADE FINANCE
FIGURE 13:
Import L/C Default Rates in Europe by Country (weighted), 2013-2015
Since 2013, Europe has shown a similar sharp rise in defaults weighted by exposure, obligors and transactions. Given that default rates are higher by obligors and transactions, and lower by total exposures, the data suggests smaller obligors are defaulting. This is unsurprising given that small businesses are usually less financially stable and present a higher risk than large businesses.
At a country level, Spain, France and the UK account for most of the increase. Spain’s default rate (weighted by exposure) was abnormally high in 2014 at 4.97% and 2015 at 8.90%, compared to global averages of 0.13% and 0.11%. Spain’s default rate in 2014 was driven by the failure of a single, large obligor, but the results for 2015 are more preoccupying. Of 36 Import L/C transactions with obligors in Spain, seven defaulted to a combined value of $22M.
Other Europe
France Greece Spain Ukraine United Kingdom
Note: Regions and Countries reflect those of Obligor Source: ICC Trade Register 2016
2014 2015
FIGURE 14:
Import L/C Default Rates in Spain (absolute), 2013-2015
0% 0% 0%
2013 20132013 20142014 20152015
5.0% 5.0% 5.0%
10.0% 10.0% 10.0%
15.0% 15.0% 15.0%
25.0% 25.0% 25.0%
20.0% 20.0% 20.0%
By Exposures By # Obligors By # Transactions
By Exposures % By # Obligors % By # Transactions %
0%
0.5%
1.0%
1.5%
2.0%
2.5%
2013 2014 2015 2013 2014 2015 2013 2014 2015
0%
0.5%
1.0%
1.5%
2.0%
2.5%
0%
0.5%
1.0%
1.5%
2.0%
2.5%
30 2016 ICC TRADE REGISTER REPORT | ANALySIS OF SHORT-TERM TRADE FINANCE
0.5%
1.5%
1.0%
0.5%
1.5%
1.0%
FIGURE 15:
Import L/C Default Rates in UK (absolute), 2013-2015
In the UK, Default rates have also increased steadily from 2013-2015, albeit remaining broadly in-line with global averages by exposure and as a percentage of transactions (Figure 15). However, the percentage of UK obligors in default in
2014-2015 is significantly above the global average, suggesting a skew of defaults towards SME clients.
In France, Default rates weighted by exposure have fallen to 0.10% over 2013-2015, in line with the global average.
By Exposures By # Obligors By # Transactions
0% 0% 0%
2013 20132013 2014 20142014 2015 20152015
0.5%
1.5%
1.0%
FIGURE 16:
Import L/C Default Rates in Asia Pacific (weighted), 2013-2015
China Hong Kong India Malaysia Other
Note: Regions and Countries reflect those of Obligor Source: ICC Trade Register 2016
By Exposures By # Obligors By # Transactions
Default rate (Spain) Default rate (Global)
0%
0.1%
0.2%
0.3%
0.4%
0.5%
2013 2014 2015 2013 2014 2015 2013 2014 2015
0%
0.1%
0.2%
0.3%
0.4%
0.5%
0%
0.1%
0.2%
0.3%
0.4%
0.5%

31
TH
E F
UL
L R
EP
OR
T
GLOBAL RISKS IN TRADE FINANCE
Asia Pacific has seen a steady rise in the default rate from 2013-2015, yet the rise is significantly smaller than in other regions and consistently below global averages. The default rate by exposure has climbed from 0.06% to 0.31% over three years. While this may be the effect of one-off events within a
small data set, the economic slowdown and an ongoing shift away from documentary trade for the most-established (and lowest risk) relationships could also be driving a real increase in defaults. As a percentage of obligors, the 2015 default rate is almost equal to 2013 rate after a modest peak in 2014.
FIGURE 17:
Import L/C Default Rates in China (absolute), 2013-2015
While the Asia Pacific default rate has been consistently below the global average, China has been an exception over recent years (Figure 17). In 2015, the Import L/C default rate in China increased 0.20% weighted by
exposure and 0.80% as a percentage of obligors. The economic slowdown in China may be contributing to a deterioration of the credit environment for Trade Finance products.
By Exposures By # Obligors By # Transactions
0% 0% 0%
2013 20132013 2014 20142014 2015 20152015
0.5% 0.5% 0.5%
1.0% 1.0% 1.0%
FIGURE 18:
Import L/C Default Rates in Hong Kong, 2013-2015
0% 0% 0%
2013 20132013 2014 20142014 2015 20152015
0.5% 0.5% 0.5%
1.5% 1.5% 1.5%
1.0% 1.0% 1.0%
By Exposures By # Obligors By # Transactions

32 2016 ICC TRADE REGISTER REPORT | ANALySIS OF SHORT-TERM TRADE FINANCE
FIGURE 19:
Export /LC Default Rates Weighted by Region, 2013-2015
Unlike China, Hong Kong (Figure 18) has seen a limited rise in default rates and remains well below the global average. Similarly, default rates in India continue to be lower than the global average and have not increased materially over the past three years.
Export L/CsDefault rates for Export L/Cs remained low in 2015, even by comparison with other Trade Finance products. However, the Trade Register has observed a material jump in recent years, from 0.01% (weighted by exposure) in 2013 to 0.11% in 2015, with more modest rises in defaults as a percentage of obligors and transactions.
Note: Regions and Countries reflect those of Obligor Source: ICC Trade Register 2016
Africa APAC Central & South America
Europe Middle East
North America
Other
By Exposures By # Obligors By # Transactions
Continued overleaf
0%
0.05%
0.10%
0.15%
2013 2014 2015 2013 2014 2015 2013 2014 2015
0%
0.05%
0.10%
0.15%
0%
0.05%
0.10%
0.15%

33
TH
E F
UL
L R
EP
OR
T
GLOBAL RISKS IN TRADE FINANCE

34 2016 ICC TRADE REGISTER REPORT | ANALySIS OF SHORT-TERM TRADE FINANCE
Africa APAC Central & South America
Europe Middle East
North America
Other
Average Default Rate by Exposure
Average Default Rate by # Obligors
Average Default Rate by # Transactions
2013 2014 2015
0%
0.1%
0.2%
0.9%
1.0%
2013 2014 2015
0%
0.2%
0.4%
0.6%
0.8%
1.0%
2013 2014 2015
0%
0.2%
0.4%
0.6%
0.8%
1.0%
FIGURE 20:
Export L/C Default Rates by Region (Absolute), 2013-2015
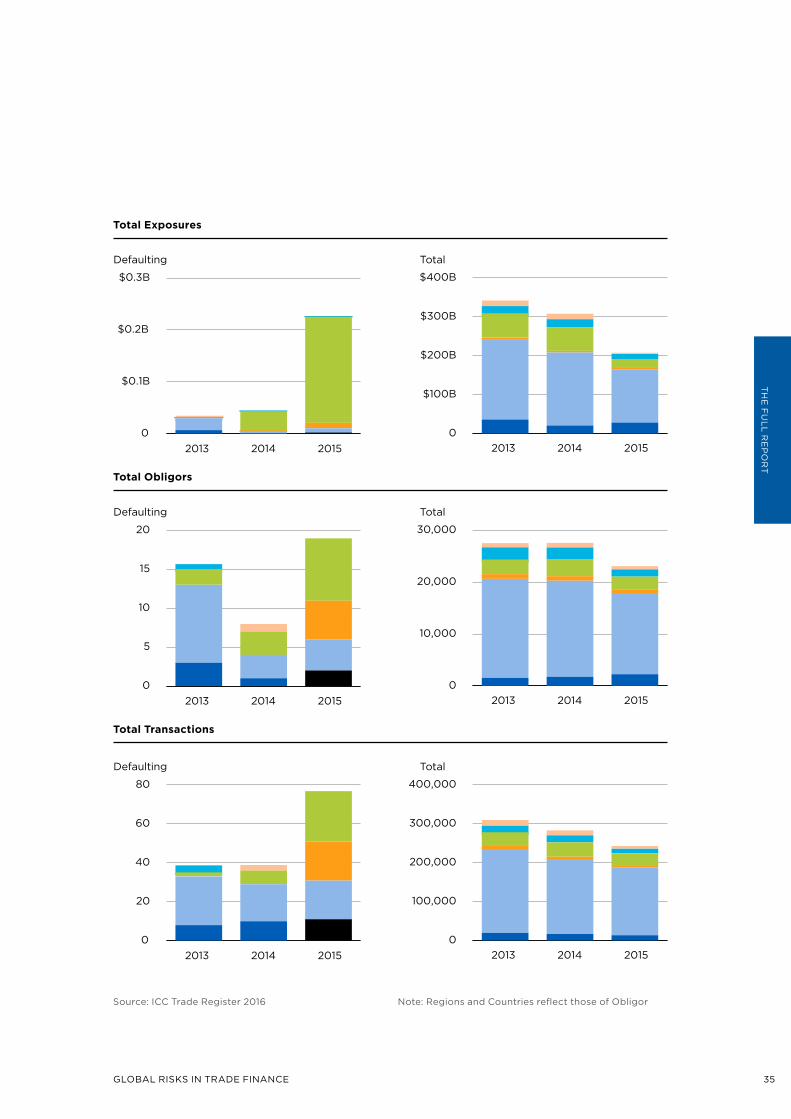
35
TH
E F
UL
L R
EP
OR
T
GLOBAL RISKS IN TRADE FINANCE
Note: Regions and Countries reflect those of ObligorSource: ICC Trade Register 2016
Total Exposures
Total Obligors
Total Transactions
0
$0.1B
$0.2B
$0.3B
0
$100B
$200B
$300B
$400B
2013 2014 2015 2013 2014 2015
Defaulting Total
0
5
10
15
20
0
10,000
20,000
30,000
2013 2014 2015 2013 2014 2015
Defaulting Total
0
20
40
60
80
0
100,000
200,000
300,000
400,000
2013 2014 2015 2013 2014 2015
Defaulting Total

36 2016 ICC TRADE REGISTER REPORT | ANALySIS OF SHORT-TERM TRADE FINANCE
FIGURE 21:
Overview of transaction driving Export L/C default rate in France
Most of the rise in Export L/Cs comes from Europe and, to a lesser extent, Asia Pacific. However, caution is required when interpreting regional data. The region in the Trade Register is for the bank’s direct customer for a given product. For an Import L/C, this is the same as the country of risk. For an Export L/C, the risk arises in the country on the other side of the transaction – the importer’s country. A default on an Export L/C negotiated in France, for example, actually occurs in the country importing from France.
The large rise in the default rate of Export L/Cs is unexpected given that the exposures are to banks in the importing country rather than the importing business itself, assuming no discrepancies in documentation. While there may be some real economic drivers of this trend, the effect of one-off events within a small data set is more likely. Again, a multi-year analysis gives a more reliable
picture of the real level of risk from these products.
The spike in defaults in 2015 came from Export L/Cs negotiated by banks in France and Argentina. Following up with the Member Banks involved confirmed that one-off events were to blame. In France, for example, the default rate (weighted by exposure) climbed from 0.10% in 2014 to 5.20% in 2015.
This was the result of a single incident involving a single bank. The importer was in Greece, and a Greek counterparty bank was classified classified as in default – as per Basel definition of defaults (which is obligor based). The French bank marked all Export L/Cs involving the Greek counterparty bank as in default, despite not necessarily being overdue (Figure 21). The Greek bank ultimately honoured all payments due and no losses were incurred.
1. Importer (A) expresses interest in purchasing goods from Exporter (D)
2. As part of the terms of the contract of sale, Exporter (D) requests Importer (A) to open an L/C in favour of Exporter
3. Importer (A) uses their Bank (B) to open an Import L/C
4. Import L/C opened by Importer Bank (B) and made available to Exporter (D)
5. Exporter (D) asks Exporter Bank (C) to confirm L/C, taking a risk on the Importer Bank (B). Flow of goods could now commence.
6. Importer Bank (B) in Greece is deemed by Bank (C) as at risk of default and “unlikely to pay”
7. Exporter Bank (C) marks all transactions with Importer Bank (B) as ‘in default’, regardless whether overdue. Transactions now seen as in default
8. Importer Bank (B) is able to make payment, hence no losses are realised
Importer: Greece Actual country of risk
Importer: France Country mentioned in Trade Register
IMPORTERGreece
EXPORTERFrance
GOODS
PAYMENT
A D
EXPORTER BANKFrance
IMPORTER BANKGreece
Bank in Country of Risk
B C

37
TH
E F
UL
L R
EP
OR
T
GLOBAL RISKS IN TRADE FINANCE
Similarly, in Argentina the default rate (by exposure) climbed to 4.50% in 2015 from close to zero in 2014, driven by a single bank experiencing a number of large technical defaults, without incurring any actual losses.
When France and Argentina are removed from the data set, default rates for Export L/Cs in Europe, Central & South America, and global default rates, move back in line with previous years in which Export L/Cs are the lowest risk Trade Finance product.
The distortion in observed default rates caused by isolated incidents in just two countries reinforces the need for creating the largest possible database. These incidents also exemplify the importance of considering not only default rates when assessing risk but also the loss rate (the “loss given default”). In both cases, while there was a technical default, no losses were suffered by the banks writing the Export L/Cs.
FIGURE 22:
Loan for Import/Export Default Rates by Region, 2013-2015
Loans for Import/Export
A slight upward trend in defaults can be seen in Loans for Import/Export up from 0.17% in 2013 to 0.36% in 2015 (weighted by exposure). This trend is coming primarily from Asia Pacific. The picture is different when looking at defaults as a percentage of obligors and transactions. On these views,
default rates appear to have peaked in 2014 and fallen in 2015. Nevertheless, they are still higher than in 2013. The fact that exposure-weighted defaults have grown faster than defaults as a percentage of transactions indicates a number of high-value defaults in 2015.
Note: Regions and Countries reflect those of Obligor Source: ICC Trade Register 2016
Africa APAC Central & South America
Europe Middle East
North America
Other
By Exposures By # Obligors By # Transactions
0%
0.5%
1.0%
1.5%
2013 2014 2015 2013 2014 2015 2013 2014 2015
0%
0.5%
1.0%
1.5%
0%
0.5%
1.0%
1.5%

38 2016 ICC TRADE REGISTER REPORT | ANALySIS OF SHORT-TERM TRADE FINANCE
Africa APAC Central & South America
Europe Middle East
North America
Other
Average Default Rate by Exposure
Average Default Rate by # Obligors
Average Default Rate by # Transactions
2013 2014 2015
0%
1.0%
2.0%
3.0%
4.0%
5.0%
2013 2014 2015
0%
1.0%
2.0%
3.0%
4.0%
5.0%
2013 2014 2015
0%
1.0%
2.0%
3.0%
4.0%
5.0%
FIGURE 23:
Loan for Import/Export Default Rates by Region (absolute), 2013-2015

39
TH
E F
UL
L R
EP
OR
T
GLOBAL RISKS IN TRADE FINANCE
Note: Regions and Countries reflect those of ObligorSource: ICC Trade Register 2016
Total Exposures
Total Obligors
Total Transactions
0
$1B
$2B
$3B
0
$500B
$1,000B
$1,500B
2013 2014 2015 2013 2014 2015
Defaulting Total
0
200
400
600
800
0
20,000
40,000
60,000
2013 2014 2015 2013 2014 2015
Defaulting Total
0
2,500
5,000
7,500
10,000
0
1,000
2,000
3,000
2013 2014 2015 2013 2014 2015
Defaulting Total

40 2016 ICC TRADE REGISTER REPORT | ANALySIS OF SHORT-TERM TRADE FINANCE
Observing absolute default rates reveals that, despite the climb from 2013-2015, Asia Pacific remains broadly in line with the global average. By contrast, the Middle East spiked sharply in 2015 at 0.80% (weighted by exposure), with most of this coming from an ongoing climb in the default rate in the UAE. Central and South America also spiked in 2015. While the 2014 peak was driven by large defaults in Mexico, the 2015 peak is driven by defaults in Brazil.
A sharp rise in the default rate by number of obligors was also seen in North America, far outstripping the default rate by exposure. This seems to be driven predominantly by 40 obligors in the Cayman Islands.
Within Asia Pacific, China is the main source of the rise in default rates, followed by Hong Kong. In China, the trend looks different when default rates are measured as a percentage of obligors and transactions, suggesting a rise in the average value of defaulting transactions. In Hong Kong, by contrast, the relatively high default rate as a percentage of transactions suggests a skew towards defaults of lower-value transactions.
Even taking the unusually high 2015 figures for Loan for Import/Export, the default rates are c. 0.14 percentage points lower than for SME lending more broadly (and c. 0.30 percentage points lower than SME lending when comparing against 2008-2015 figures).
FIGURE 24:
Performance Guarantee Default Rates by Region (weighted), 2013-2015
Performance Guarantees
Performance Guarantees typically have the highest default rates among Short-Term Trade Finance products. In 2015, they were 0.42% (weighted by exposure), higher than any other product considered. As with the other products, the default rates for Performance Guarantees show a clear
upward trend from 2013-2015. Given that the default rate as a percentage of transactions is significantly lower than as a percentage of obligors or when weighted by exposures, defaulting transactions seem to be skewed to smaller obligors.
Note: Regions and Countries reflect those of Obligor Source: ICC Trade Register 2016
Africa APAC Central & South America
Europe Middle East
North America
Other
By Exposures By # Obligors By # Transactions
Continued overleaf
0%
0.1%
0.2%
0.3%
0.4%
0.5%
0.6%
0.7%
0.8%
2013 2014 2015 2013 2014 2015 2013 2014 2015
0%
0.1%
0.2%
0.3%
0.4%
0.5%
0.6%
0.7%
0.8%
0%
0.1%
0.2%
0.3%
0.4%
0.5%
0.6%
0.7%
0.8%

41
TH
E F
UL
L R
EP
OR
T
GLOBAL RISKS IN TRADE FINANCE

42 2016 ICC TRADE REGISTER REPORT | ANALySIS OF SHORT-TERM TRADE FINANCE
Africa APAC Central & South America
Europe Middle East
North America
Other
Average Default Rate by Exposure
Average Default Rate by # Obligors
Average Default Rate by # Transactions
2013 2014 2015
0%
0.5%
1.0%
1.5%
2.0%
2.5%
2013 2014 2015
0%
0.5%
1.0%
1.5%
2.0%
2.5%
2013 2014 2015
0%
0.5%
1.0%
1.5%
2.0%
2.5%
FIGURE 25:
Performance Guarantee Default Rates by Region (absolute), 2013-2015

43
TH
E F
UL
L R
EP
OR
T
GLOBAL RISKS IN TRADE FINANCE
Note: Regions and Countries reflect those of ObligorSource: ICC Trade Register 2016
Total Exposures
Total Obligors
Total Transactions
0
500
1,000
1,500
0
100000
200000
300000
400000
2013 2014 2015 2013 2014 2015
Defaulting Total
0
100
200
300
400
0
20,000
40,000
60,000
80,000
2013 2014 2015 2013 2014 2015
Defaulting Total
0
500
1000
1500
0
200
400
600
2013 2014 2015 2013 2014 2015
Defaulting Total

44 2016 ICC TRADE REGISTER REPORT | ANALySIS OF SHORT-TERM TRADE FINANCE
The rise in default rates is occurring primarily in Europe, Asia Pacific and Central and South America, and in the last of these reached 0.25% in 2015 (by exposure). This spike is driven by Brazil and, to a
lesser extent, Mexico. The trend may be attributable to economic uncertainty in these economies and failed infrastructure projects.
FIGURE 26:
Performance Guarantee Default Rates in Europe by Country (weighted), 2013-2015
While less pronounced than in Central and South America, European default rates appear to be trending c. 0.14 and c. 0.32 percentage points above the global average in 2013 and 2015 respectively, with the main contributors being Spain, France and the UK. In Spain, the spike is attributable to the default of a few large obligors, while in the UK it comes from a larger number of small defaults.
Trends in Loss Given Default & Expected Loss
As noted above, Short-Term Trade Finance products have materially lower Expected Loss (EL) than comparable asset classes. This has been corroborated, once again, by the Trade Register’s results (Figure 27).
By Exposures By # Obligors By # Transactions
Note: Regions and Countries reflect those of Obligor Source: ICC Trade Register 2016
Africa APAC Central & South America
Europe Middle East
North America
Other
0%
0.2%
0.4%
0.6%
0.8%
1.0%
1.2%
1.4%
1.6%
2013 2014 2015 2013 2014 2015 2013 2014 2015
0%
0.2%
0.4%
0.6%
0.8%
1.0%
1.2%
1.4%
1.6%
0%
0.2%
0.4%
0.6%
0.8%
1.0%
1.2%
1.4%
1.6%

45
TH
E F
UL
L R
EP
OR
T
GLOBAL RISKS IN TRADE FINANCE
FIGURE 27:
Expected Loss of Trade Finance and other Asset Classes, 2008-2015
Import and Export L/Cs and Performance Guarantees have the lowest ELs of 0.01-0.02%. The EL for loans is 0.07% on account of their higher default rates. The marginal rise in default rate across regions flows through to the EL calculation, driving an increase on the figures reported in last year’s Trade Register.
The contribution of PD, EAD and LGD to the low EL for Short-Term Trade Finance products is shown in Figure 28. The LGD calculation is broken down in Figure 29.
Two alternative methods are used to calculate EAD and LGD for Performance Guarantees in this year’s Trade Register, outlined in detail in the ‘Approach to Analysis’ section of the appendix (see 12.1). Applying the methodology from previous years, the Performance Guarantee claim rate is applied to the EAD, resulting in a higher LGD. Using the alternative methodology, the claim rate is applied to the LGD, resulting in a higher EAD and correspondingly lower LGD. Both methodologies are shown in this section (see Figure 28-29.).
Product/Asset Class Expected Loss %
Import LC
Export LC
Loans for Import / Export
Performance Guarantees
Small / Medium Enterprise
Large Corporate
Banks & FIs
Commodities Finance 0.05%
Trade Finance Other products
0.02%
0.02%
0.07%
0.01%
0.14%
0.06%
0.03%

46 2016 ICC TRADE REGISTER REPORT | ANALySIS OF SHORT-TERM TRADE FINANCE
FIGURE 28:
Expected Loss for Short-Term Trade Finance Products
FIGURE 29:
LGD Calculation for Short-Term Trade Finance Products
Import L/C
Import L/C
Loans for Import / Export
Loans for Import / Export
Export L/C
Export L/C
Performance Guarantees(Applying CCF to EAD)
Performance Guarantees(Applying CCF to EAD)
Performance Guarantees(Applying CCF to LGD)
Performance Guarantees(Applying CCF to LGD)
Product Default Rate
Cost of recovery
Time to recovery
Discount rate
Loss given default
Product Default Rate
Exposure at default
Loss given default
Expected loss
2%0.54 year
27%
9%
0.2%
0.2%
0.08%
27%
2%0.31 year
40%
9%
0.04%
40%
2%0.4 year
35%
9% 35%
2%0.19 year
37.5% 9%
0.1%8.5%
2%0.19 year
5.5%
37.5% 9%
0.1%
5.5%
40%
40%
40%
65%
100%
100%
100%0.21% 0.7%
0.19% 100%
0.19%
x 8.5% claim rate
65%

47
TH
E F
UL
L R
EP
OR
T
GLOBAL RISKS IN TRADE FINANCE
FIGURE 30:
Average weighted recovery rates for Short Term Trade Finance, 2008-2015
LGD is consistently low and varies materially by product, predominantly driven by the recovery rate. A time-series view of the data in Figure 30 shows strong recovery rates across Import L/Cs, Export L/Cs and Loans for Import/Export over recent years, with a less consistent picture for Performance Guarantees.
Recovery rates for Performance Guarantees depend on the specific methodology chosen, yet regardless show a clear decline in recovery rates after 2012. However, deeper analysis reveals that this is skewed by major losses by a regional bank in South Africa in 2013 and by a global bank in Ukraine in 2015. However, once adjusted for these, recovery rates for Performance Guarantees come into line with other products.
The distribution of recovery rates by product also provides a positive picture. For Import and Export L/Cs, recovery rates are predominantly in the 80%+ range, with the majority of cases resulting in 100% recovery. Recoveries are more mixed for Loans
for Import/Export and for Performance Guarantees. Nevertheless, the low default rates for these products mean that their Expected Losses are still lower than for comparable Asset Classes.
Import L/C Export L/C
Loans for Import/Export
Performance guarantees
0% 0%
0%
20
08
20
08
20
09
20
09
20
102
010
20
112
011
20
122
012
20
132
013
20
142
014
20
152
015
0%
100% 100%
100% 100%
80%Av. 79%
Av. 64%
Av. 69%
Av. 38%
80%
80% 80%
60% 60%
60% 60%
40% 40%
40% 40%
20% 20%
20% 20%
20
08
20
08
20
09
20
09
20
102
010
20
112
011
20
122
012
20
132
013
20
142
014
20
152
015

48 2016 ICC TRADE REGISTER REPORT | ANALySIS OF SHORT-TERM TRADE FINANCE
FIGURE 31:
Distribution of Recovery Rates across Short-Term Trade Finance Products, 2008-2015
FIGURE 32:
Average Time to Recovery between Trade Finance and other Asset Classes, 2008-2015
Time to recovery is also required to calculate the discounting component of Loss Given Default. Observed recovery
times from the Trade Register are shown and compared to other Asset Classes in Figure 32.
The comparison shows that Trade Finance products have materially shorter recovery times than other Asset Classes. While some caution is needed given the comparability of data between the Trade Register and other Asset Class benchmarks, one explanation could be important differences in the workout
process: in Trade Finance, banks take ownership of underlying goods and can often sell them swiftly, depending on commodity type. From the banks’ perspectives, this reduces the discount factor required on the potential loss and reduces the length of time the exposure is drawn on the balance sheet.
Product/Asset Class Time to recovery, years
Import LC
Export LC
Loans for Import / Export
Performance Guarantees
Small / Medium Enterprise
Large Corporate
Banks & FIs
Commodities Finance 0.70
Trade Finance Other products
0.54
0.31
0.40
0.19
1.20
1.20
2.30
Import L/C Export L/C
Loans for Import/Export
Performance guarantees
0% 0%
0%
0%
0%
0–2
0%
0–2
0%
20
–4
0%
20
–4
0%
40
–6
0%
40
–6
0%
60
–8
0%
60
–8
0%
80
–10
0%
80
–10
0%
100
%
100
%
>10
0%
>10
0%
0%
100% 100%
100% 100%
80% 80%
80% 80%
60% 60%
60% 60%
40% 40%
40% 40%
20% 20%
20% 20%

49
TH
E F
UL
L R
EP
OR
T
GLOBAL RISKS IN TRADE FINANCE
FEATURE:
Default & Loss Experience in Emerging Markets
Alisa DiCaprio, Research Fellow, Asian Development Bank
In 2016, the Asian Development Bank (ADB) estimated a global Trade Finance gap of $1.6 trillion dollars. This unmet demand is not evenly distributed. The 337 financial institutions that evaluate applications for Trade Finance report that rejection rates are 56% for small- and medium-sized enterprises and 44% for firms in Asia Pacific, in sharp contrast to 9% for multinational corporations. This raises questions, given that Trade Finance is one of the safest forms of finance and less than half of 1% of transactions go into default.
Trade Finance is not well understood outside its small community of practitioners. But as statistics around it have improved in the past decade, its role as an enabler of trade has become irrefutable. The ADB has played a pivotal role in advancing this process, first by conceiving of and providing seed funding for the Trade Register Project in 2009, and more recently through the annual ADB Trade Finance Gap, Growth & Jobs survey, which seeks to quantify global unmet demand for Trade Finance and its impact on growth and jobs.
The ICC’s efforts to produce data on Trade Finance are part of a larger global effort to understand the role of Trade Finance in the development of supply chains in high-risk emerging markets. Risk mitigation and finance for merchandise trade enables a wider set of participants to access global cross-border commerce. Data from the ICC Trade Register consistently illustrates the low risk of Trade Finance from a credit perspective. Negligible default rates exist in Short-, Medium- and Long-Term Trade Finance. This outcome is evident globally in every Trade Register Report since first publication.
Negligible default and loss rates, coupled with the high impact of Trade Finance on trade activity, create economic value and have a direct positive impact on growth, jobs and – ultimately – poverty reduction. This suggests that Trade Finance can be better used to create more value globally – from OECD economies to the most challenging of frontier markets.
Trade Finance enables trade and export opportunities. It plays a critical role in emerging economies, where the sophistication of the financial sector may lag behind the speed of trade development. In countries where Trade Finance functions well, firms that would otherwise be considered too risky can link into expanding global value chains. But survey evidence, combined with data from the ICC Trade Register, suggests a disconnect between Trade Finance availability and the level of risk in markets where Trade Finance is most critical for trade facilitation. Trade Finance is often insufficient and prohibitively expensive, despite its low risk even when deployed in high-risk environments.
In all cases, default rates indicate low credit-related risk in Trade Finance (Figure 33). However, bank-reported rejection rates indicate that certain markets are perceived as high risk. In Asia Pacific, the difference is striking. Transaction default rates are below 0.3%, and financial depth (which reflects the size of the financial sector in the economy) is above the world average. However, firms in the Asia Pacific face the highest rejection rates for Trade Finance.

50 2016 ICC TRADE REGISTER REPORT | ANALySIS OF SHORT-TERM TRADE FINANCE
Gathering data around Trade Finance is critical in today’s economic environment. Recognised gaps in the provision of Trade Finance mean solutions can only be targeted bluntly due to lack of data. For example, without the default and loss data collected and analysed through the ICC Trade Register, high rejection rates in emerging markets might be attributed to very risky clients with a history of defaults.
Incorporating Trade Register data with the ADB survey data proves three important points.
First, Trade Finance is not responding properly to market signals. Today’s weak trade environment and the redirection of Trade Finance towards Open Account have resulted in lower demand for traditional forms of Trade Finance. Yet, unmet demand in emerging economies and among SMEs remains constant. This is, in part, a reflection of the disconnect between Trade Finance and its credit-related risk characteristics.
Second, the risk of default is not correlated with financial sector depth. Financial depth is the percentage of credit relative to GDP.
This shows how developed the financial sector is, and whether it can support the needs of exporters. Higher depth is correlated closely to income, and the world average is 125%.2 Economies like the US and Singapore have rates around 130%, and China’s is 142%. Comparing depth to default rates shows that the instrument is safe even when the market is not, and that Trade Finance should be expanded in emerging economies where trade is growing quickly.
Finally, more granularity is critical in these types of statistics. Broad conclusions from the data are valuable, but they do not differentiate by country or trade intensity. This level of analysis is critical.
Increasing interest in the linkages between Trade Finance and trade-driven development comes at a time of global demand for fact-based advocacy. The ICC Trade Register is an authoritative source of data, and the ADB’s work across a range of initiatives advances the discipline of fact-based analysis and advocacy. We hope the ICC will continue to do both in partnership with leading institutions.
2. For more information see http://www.worldbank.org/en/publication/gfdr/background/financial-depth
Sources: Transaction default rate from ICC Trade Register 2015, rejection rates from ADB 2015.Trade Finance gap survey, Financial depth from World Bank 2016.
Note: Financial depth is defined as domestic private credit to the real sector by deposit money banks as a percentage of local currency GDP. World average is 125%. 2014 Transaction Default Rate figures have been used to ensure comparable analyses.
Transaction Default Rate (2007-2014)
Rejection Rate on Trade Finance
Transactions (2014)
Financial Depth (2014)
Sub-Saharan Africa 0.39% 19% 46%
MENA 2.43% 48%
Asia Pacific 0.29% 29% 130%
Central and South America 0.50% 51%
United States 0.0% 8% 195%
CIS 1.28% 17% 55%
Europe 0.38% 12% 100%
FIGURE 33:
Trade Finance Default Rate, Rejection Rate, and Financial Depth by Region / Country

51
TH
E F
UL
L R
EP
OR
T
GLOBAL RISKS IN TRADE FINANCE
ANALYSIS OF MEDIUM TO LONG-TERM TRADE FINANCE
Overview of Findings
The ICC Trade Register filtered data set includes the details of $613 billion of Medium to Long-Term (MLT) Trade Finance exposures across 37,000 transactions. While significantly smaller than Short-Term Trade Finance, this data set enables increasingly insightful and accurate credit risk analysis.
The 2016 Trade Register corroborates the findings from previous reports that MLT Trade Finance presents a low risk for banks. This low risk is driven by a combination of the low Probability of Default and Loss Given Default, which drive favorable Expected Loss rates. The Loss Given Default of MLT Trade Finance transactions included in the Trade Register is particularly low, as transaction are covered by OECD-backed Export Credit Agencies (ECAs) at typically ~95% of their value, which limits the sum a bank may need to pay out directly.
From 2007-2015, the average Default Rate of MLT Trade Finance is 0.44%, with a Loss Given Default (LGD) of 5.3% (weighted by exposure). This, in turn, drives an Expected Loss (EL) of 0.024%.
While these figures are low compared to other Asset Classes, they are marginally higher than figures reported from 2007-2014 due to increases in both Default Rate and LGD. The rise in LGD is due in part to a reduction in the observed ECA coverage for defaulting MLT Trade Finance transactions in 2015. If we only include cases where the ECA workout has been completed, LGD falls to 4.0% and EL falls to 0.018% – more closely in line with the 2015 Trade Register findings.
Risk Characteristics of MLT Trade Finance Products
The MLT products within the scope of the ICC Trade Register are Export Credits with the backing of an OECD member-based ECA which represent the full faith and credit of their respective governments. Although these in-scope MLT transactions have different product characteristics from the transactions included in the Short-Term
Trade Register, the risk profile of the MLT products is also low based on the data collected and the analysis performed.
MLT Trade Finance is low risk largely because transactions are covered by ECAs. As a result, losses are limited unless the ECA itself defaults, which is unlikely as the in-scope ECAs are sponsored by high-income OECD governments and have investment-grade ratings. For example, if an obligor defaults on a loan with 95% coverage from an ECA, the bank can expect recoveries of up to 95% from the ECA, covering:
• The outstanding principal at the point of default
• Interest contractually due but unpaid
• Direct costs associated with recovering from the customer (including for example legal fees)
The percentage level of cover provided by ECAs can vary. The overall average transaction weighted coverage rate 2007-2015 has been 94%, with marginally lower than average coverage in Africa (93%) and Asia Pacific (94%). For Sovereign obligors, the rate of cover considered is that of the political risk as these obligors do not present a commercial risk. For other obligors, comprehensive cover is considered, which reflects the portion of a transaction covered both for political and commercial risks.
The bank can also benefit from recoveries from the obligor, if the obligor complies late with its obligations. Where recoveries are made from the obligor, they are shared between the bank and the ECAs in proportion to their uncovered and covered portions as the ECA is subrogated in the rights of the bank after indemnification.

52 2016 ICC TRADE REGISTER REPORT | ANALySIS OF MEDIUM TO LONG-TERM TRADE FINANCE
FIGURE 34:
Average ECA insurance coverage rate by Asset Category & Region
Observed Average Maturity
By definition, MLT products have a significantly longer maturity than Short-Term products; 46% of transactions across all asset categories have an original maturity of 10–15 years or 57% above 10 years. Comparing across asset categories, Corporates and FIs have a relatively more even distribution of maturities up to 15 years, albeit FI transactions have a larger share above 15 years. The majority of
Sovereign and Specialized business occurs in the 10–15 year range.
A trend that can be observed from this analysis is that the exposure-weighted average is higher than the average for all products and is approximately 1 year more for the average. This implies that larger transactions have, on average, longer maturities than smaller transactions, explained by the fact that ECAs grant cover with shorter durations for small deals.
FIGURE 35:
Average maturity by asset category, 2007–2015
Asset Class#5yrs
or less#5-
10yrs#10-15yrs
#15yrs or more
Unweighted average
tenor
Exposure weighted
average tenor
Corporate 13% 37% 44% 6% 10.1 11.7
FI 22% 37% 23% 18% 10.2 12.1
Sovereign 3% 24% 53% 20% 12.7 16.4
Specialized 2% 20% 69% 9% 12.0 13.5
Total 11% 32% 46% 11% 10.9 11.4
Asset Category Region
Africa
Europe (ex-C
IS)APAC
Middle East
Central &
South Americ
a
North A
merica
Europe
Corporate
6%
Covered Uncovered
94%Av.
7%4% 5% 5%5% 6% 5%6% 5% 4%
94% 93%96% 95% 95%95% 94% 95%94% 95% 96%
Fi
Sovereign
Specialized
Note: Represents political risk coverage for Sovereign assets and comprehensive coverage for all others

53
TH
E F
UL
L R
EP
OR
T
GLOBAL RISKS IN TRADE FINANCE
FIGURE 36:
2007-2015 Asset Class defaults by Obligor, Transaction and Exposure (vs. 2007-2014 defaults)
Defaults by Obligor
Defaults by Transaction
Defaults by Exposure
Asset Category 2007-15 2007-14 2007-15 2007-14 2007-15 2007-14
Corporate 0.96% 0.89% 0.79% 0.68% 0.45% 0.39%
FI 1.41% 1.42% 1.43% 1.43% 1.24% 1.28%
Sovereign 0.26% 0.28% 0.14% 0.15% 0.07% 0.08%
Specialized 0.56% 0.48% 0.55% 0.49% 0.42% 0.23%
Total 0.90% 0.88% 0.76% 0.71% 0.44% 0.37%
Default Rate Analysis
The introduction of 2015 transactions into the data pool has caused a slight increase in average default rate across the default categories, although these results are not material. Specifically, 2007-2015 defaults show:
• Defaults by Exposure of 0.44% (up from 0.37% last year)
• Defaults by Obligor of 0.90% (up from 0.88% last year)
• Defaults by Transaction of 0.76% (up from 0.71% last year)
Defaults in FI and Sovereign have come down slightly, whereas defaults in Corporate and Specialized asset classes have increased. Specifically, 2007-2015 asset category defaults by obligor show:
• Defaults by Corporate of 0.96% (up from 0.89% last year)
• Defaults by FI of 1.41% (down from 1.42% last year)
• Defaults by Sovereign of 0.26% (down from 0.28% last year)
• Defaults by Specialized of 0.56% (up from 0.48% last year)
Defaults in ex-Commonwealth of Independent States (CIS) countries (including Armenia, Belarus, Kazakhstan, Kyrgyzstan, Moldova, Russia, Tajikistan, Turkmenistan, Ukraine and Uzbekistan), and the Middle East, came down slightly, whereas all other regions saw a slight increase in defaults. The largest regional changes in default rates by exposure (2007-2015 vs. 2007-2014) are:
• Defaults in Asia Pacific 0.34% (up from 0.15% last year)
• Defaults in Europe 0.37% (up from 0.23% last year)
• Defaults in Africa 0.27% (up from 0.22% last year)
• Defaults in Middle East 1.10% (down from 1.19% last year)

54 2016 ICC TRADE REGISTER REPORT | ANALySIS OF MEDIUM TO LONG-TERM TRADE FINANCE
FIGURE 38:
MLT Trade Finance Default Rates by Exposure (Weighted) for Top 6 Defaulting Countries, 2007-2015
Singapore Russia Spain Ukraine Iran Other
2007 2008 2009 2010 2011 2012 2013 2014 2015
0.0%
0.5%
1.0%
1.5%
The highest overall default rates are observed in the Middle East due to the sanctions introduced in Iran (Figure 37). Additionally, significantly higher default rates in the ex-CIS region are driven by defaults in Ukraine and Kazakhstan. It is important to note that these variations in default rates are due to idiosyncratic shocks. However, it is fair to say that idiosyncratic shocks – such as sanctions and political conflicts – are concentrated in only a few regions of the world, and ECA-backed trade
transactions frequently involve higher-risk markets, including those exhibiting idiosyncratic characteristics.
Additionally, in 2015, Singapore and Spain contribute more than half of the weighted defaults by exposure, yet neither country had contributed any defaults in recent years. Indeed, these defaults were driven by obligor-specific difficulties, including a well-known case in Spain, rather than any systemic event.
Defaults by Obligor
Defaults by Transaction
Defaults by Exposure
Region 2007–15 2007–14 2007–15 2007–14 2007–15 2007–14
Africa 0.67% 0.41% 0.56% 0.39% 0.27% 0.22%
APAC 0.53% 0.44% 0.34% 0.29% 0.34% 0.15%
Central and South America 0.85% 0.84% 0.49% 0.50% 0.17% 0.16%
Europe 0.57% 0.54% 0.58% 0.36% 0.37% 0.23%
ex-CIS 1.28% 1.27% 1.30% 1.28% 1.08% 1.10%
Middle East 2.64% 2.84% 2.29% 2.43% 1.10% 1.19%
North America 0.07% 0.00% 0.07% 0.00% 0.04% 0.00%
Total 0.90% 0.88% 0.76% 0.71% 0.44% 0.37%
FIGURE 37:
2007-2015 Regional defaults by Obligor, Transaction and Exposure (vs. 2007-2014 defaults)

55
TH
E F
UL
L R
EP
OR
T
GLOBAL RISKS IN TRADE FINANCE
Observed Recovery RatesThe 2016 Trade Register shows 97.1% total recovery for MLT products from 2007-2015. This reflects a slight decrease compared to 97.5% total recovery in 2007–2014. This decrease is driven by transactions reported in 2015 having an unusually low average coverage rate of only 75%, compared to 85-95% in prior years. Despite this decrease, the total observed recovery rate remains
over 95% for 2007–2015 because ECA recovery amounts include coverage for principal, interest and costs.
Figure 39 shows the overall level of recoveries from the ECA and the customer before and after customer recoveries are attributed to the ECA. This information shows good recoveries from some defaulted customers. In subsequent tables, recoveries are post-attribution.
FIGURE 39:
MLT Observed Recovery, 2007–2015 $m, Pre- and Post-attribution of customer recoveries for ECA Completed/Accelerated and Partial Completed Cases
ExposureECA
RecoveryCustomer Recovery
Total Recoveries
Pre-attribution of Customer Recoveries 1,335 1,089 207 97.1%
Observed Recovery Rate 1,335 1,285 11 97.1%
Loss Given DefaultLoss Given Default (LGD) is calculated using the same approach as last year, based upon a discounting and recovery cost approach. This includes a transaction level discounting calculation and a standard 1.0% of exposure recovery cost.
This year’s report shows a 2007-15 LGD of 5.3% for ECA completed/accelerated and partially completed cases (vs. 4.9% in 2007–2014). The increase is driven by the unexpectedly lower coverage rate of cases reported/observed in 2016 (75% coverage rate in 2016 vs 85–95% in prior years).
As expected, the 2007–2015 LGD for fully completed cases is lower (4.0%) when the sample is restricted to cases where the ECA workout process is complete and the obligor recovery is flagged as complete. However, this filter reduces the data to a relatively small number of reported cases (from 208 partially completed cases to 75 fully completed transactions).

56 2016 ICC TRADE REGISTER REPORT | ANALySIS OF MEDIUM TO LONG-TERM TRADE FINANCE
FIGURE 41:
Estimated EL for MLT Trade Finance products using exposure weighted default rate, 2007–2015
FIGURE 40:
Recoveries and estimated LGD for partially completed and fully completed cases 2007-2015
Exposure Weighted Customer
Default Rate
Exposure at Default
(EAD)
Loss Given Default
(LGD)Expected Loss (EL)
ECA completed/accelerated and partial completed cases 0.45% 100% 5.3% 0.024%
ECA completed and customer completed cases 0.45% 100% 4.0% 0.018%
ECA Recoveries
Customer Recoveries
Total Recoveries Loss Rate
Dis-counting Costs LGD
ECA completed/accelerated and partial completed cases 96.2% 0.8% 97.1% 2.9% 1.3% 1.0% 5.3%
ECA completed and customer completed cases 97.5% 1.9% 99.4% 0.6% 2.4% 1.0% 4.0%
Expected LossThe Expected Loss (EL) for completed/accelerated and partially completed ECA cases in 2007-2015 is 0.024% (vs. 0.018% 2007-2014). The increase is driven by the
higher average default rate this year and by the higher LGD noted earlier. The EL for fully completed cases is 0.018%, consistent with last year’s headline result.

57
TH
E F
UL
L R
EP
OR
T
GLOBAL RISKS IN TRADE FINANCE
CASE STUDY:
MEDIUM TO LONG-TERM TRADE FINANCE IN IRANHenri d’Ambrières, Senior Technical Advisor, MLT Trade Register, HDA Conseil
Export credits are long-term activities that last ‘multiple years. Even in complicated situations, a full recovery, after a partial indemnification by an Export Credit Agency, remains possible.
Fifteen years ago, Iran was one of the top destinations for exporters, commercial banks active in export finance and their Export Credit Agencies (ECAs). For the Berne Union, Iran ranked among the top 10 countries for Medium to Long-Term business (new commitments and portfolio) for many years.
Since 1996 the D’Amato law and subsequent legislations had prevented US citizens from undertaking Iranian activities, first in the Oil & Gas sector and then in most sectors. As a consequence, US exporters and commercial banks, and USEXIM were not active in Iran. In 2006, the UN adopted the first sanctions against Iran in relation to its nuclear program before more stringent sanctions were gradually imposed:
• Some were adopted in the US, such as the prevention of using US Dollars for any payment in relation to Iran. For this reason, commercial loans and export credits signed in US Dollars were amended to introduce alternative payment currencies such as the Euro.
• Some were supported by the international community, such as the prohibition to deal with some listed Iranian banks or manage money transfers in relation with Iran.
The first objective of the financial sanctions was to limit sales of Iranian crude oil and other goods and reduce the financial capacity of the Iranians to import foreign products. This was achieved by gradually preventing banks established in Europe or Japan to manage financial flows in relation to Iran. This was expedited by a disconnection of Iranian banks from SWIFT. One unintended consequence was that Iranian debtors found it more and more difficult to find legitimate channels for their loan repayments even if they had sufficient financial resources. For a certain period, some conduits used unusual currencies (e.g. Turkish lira, Emirati Dirham) or unusual financial places (e.g. Middle East, the former CIS or Asia) to reimburse loans in Euros to banks domiciled in Europe or in Japan. Compliance teams found these transfers tedious, and they gradually disappeared around 2010.

58 2016 ICC TRADE REGISTER REPORT | MEDIUM TO LONG-TERM TRADE FINANCE IN IRAN
Japanese and European banks with export credits covered by ECAs had to declare their loans in default. From 2011 for the first time their ECAs were approached for indemnifications. This was unusual as, according to the standard terms and conditions of many ECAs, losses could be caused by:
• Commercial events – when the borrower is not paying its instalments, it becomes insolvent or a settlement prevents him from paying
• Political events – when the government of the borrower’s country declares a moratorium on its debt, prevents the repayment of loans signed by domestic entities or suspends financial transfers to foreign entities. The consequence of war, revolution or natural disaster outside of the country of the ECA are also included in the covered political risks.
Some, but not all, of the ECAs consider a political decision made by the government of the policy-issuing ECA as a potential cause of loss. Yet most banks had evidence that the Iranian debtors were trying to settle their instalments but because of national or international sanctions, beneficiary banks were prevented from accepting these funds to have their loans reimbursed.
The lending banks considered their requests for indemnifications as fair and justified given the origin of the defaults was a political decision outside of their control, imposed unilaterally and after the export credit policy was issued. ECAs accepted that the cause of loss was a political act and they indemnified banks that were prevented from receiving the payments for instalments due.
Prior to the imposition of sanctions, CESCE’s experience with Iran was a long and satisfactory one. Regardless of the circumstances, Iranian counterparties had traditionally exhibited a very high willingness to honour their commitments. As sanctions were imposed, CESCE’s cover policy was adapted to allow for cover of those transactions still permitted, until activity ceased completely.
Arrears and then defaults started to appear, as was the case with other ECAs. In CESCE’s case a default caused by international sanctions is expressly contemplated as one of the covered causes of loss, so there was never any discussion as to whether we had to settle claims, and these were settled as they occurred. For the last few years claims payments and recoveries have co-existed. From the time the sanctions were lifted, payments have been effected and most of our debt has been cancelled. As we recovered, so did the banks, as recoveries are shared in proportion to cover percentages.
CESCE, the Spanish ECA

59
TH
E F
UL
L R
EP
OR
T
GLOBAL RISKS IN TRADE FINANCE
Three lessons can be learned from these events:
1 Banks were fully indemnified for the portion covered by ECAs when they presented their claims for these Iranian defaults. This confirms the strength and the effectiveness of the commitments of the ECAs.
2 Iranian debtors are now making good on overdue instalments for their full amounts. All recoveries are split among the ECAs and the banks according to covered/uncovered portions. This confirms the capacity of banks to recover, over time, a part of the uncovered portion of their defaulted export credits.
3 The position of the ECAs vis-à-vis sanctions was clarified. ECAs that did not recognize sanctions revised their general terms and conditions, and now accept the impact of international or national sanctions, imposed after the cover of a loan, as a cause of loss.
Between 2012 and 2015, the ICC Trade Register shows Iran as a top source of defaults for banks. Most export credits were extended to large Iranian public banks, acting on behalf of their importing customers. Defaults appeared as defaults of financial institutions, most of them guaranteed by the Minister of Finance or the Iranian Central Bank. Consequently, Iran had the highest number of claims reported by members of the MLT Committee of the Berne Union, with ECAs paying indemnities for $2.6 billion between 2012 and 2015 (representing one quarter of total claims reported during that period of $10.4 billion). This did not prevent several ECAs from recovering some indemnified amounts (approx. $470 million over the same period).
In early 2016, international sanctions were lifted by the UN. Financial channels are gradually being re-opened, which allows for the payment of past due and current instalments. In addition, most ECAs confirmed their willingness to offer cover for new projects in Iran, with the repayments of indemnified amounts being a condition precedent for new commitments in most cases. In several cases, the Iranian authorities or the ECAs themselves announced that a settlement agreement had been signed and that payments were being made. For these reasons, large amounts will probably be recovered by ECAs and commercial banks during 2016.

60 2016 ICC TRADE REGISTER REPORT | wHAT DOES THIS MEAN FOR INvESTORS?
The original objectives and continuing relevance of the ICC Trade Register Project have been brought into focus with the latest round of potential revisions to the Basel Accords. The exact implications will become clearer after the Basel Committee completes its consultation process, which was underway while this Report was being written.
What is clear at the time of writing is that the links between Trade Finance (both traditional and Supply Chain Finance) and cross-border commerce continue to be better understood and appreciated across business, policy, political and academic circles. While there is still room to further educate senior bank executives around the value and importance of Trade Finance, signs of improvement are clear.
Against this backdrop, we are increasingly realizing that there is a significant global shortfall in Trade Finance in the market. Businesses of all sizes indicate that they could make use of more Trade Finance to support their international ambitions.
These findings are driven by analysis by the Asian Development Bank (ADB), the International Finance Corporation (IFC) and others. The latest estimate by ADB suggests that the “Trade Finance gap” may be as high as $1.6 trillion in 2015, with most of this unmet demand concentrated in Asia. A significant portion of that lack of capacity is adversely affecting small- and medium-sized enterprises (SMEs).
SMEs are recognized as critically important drivers of national and regional economies, which makes the lack of Trade Finance capacity in Asia – where many global supply chains are anchored – a priority for stakeholders who enable and benefit from international commerce.
Practitioners and informed analysts and observers of the market understand that banks and traditional providers of Trade Finance will be unable to address the unmet demand. The combined results of balance sheet and capital constraints, post-crisis limits on risk tolerance (particularly cross-border and emerging markets risk),
lower margins, shifting profitability, and reputational risk are Trade Financing considerations. Capital and compliance considerations also make it increasingly difficult for Trade Finance executives to convince their senior leaders of the value of their business within the wider financial institution.
Capacity constraints, consolidation and risk aversion will continue to complicate and delay the ability of traditional providers to create net new Trade and Supply Chain Finance capacity.
While interesting propositions and business models are being developed in fast-growing Supply Chain Finance activity, and FinTech firms may have a transformational impact, these developments will not address the global gap in Trade Financing.
New capacity will need to come from outside the banking environment – most likely large pools of capital managed by pension funds, insurance companies, hedge funds, private equity, sovereign wealth funds and other similar entities.
Some of these sources of capital are closely regulated and monitored, and target the preservation of invested capital with modest returns. Others are significantly more speculative and risk-tolerant. While Trade Finance activity can encompass the risk/return spectrum, on average a typical portfolio behaves similar to a fixed income security – a source of modest annuity-like returns, underpinned by safety and security of invested capital.
Globally, large pools of capital are looking for attractive investment options to meet a range of objectives. Trade Finance can be a compelling option, and in turn address the global Trade Finance gap. The benefits to both parties are compelling, as is the opportunity to drive economic recovery, growth and international development from new partnerships between trade financiers and investment managers.
Fundamental issues will need to be addressed for this opportunity to come to fruition globally and to transform global trade.
WHAT DOES THIS MEAN FOR INVESTORS?

61
TH
E F
UL
L R
EP
OR
T
GLOBAL RISKS IN TRADE FINANCE
First, trade financiers must continue to articulate and advocate for the importance and value of their Trade Finance (and Supply Chain Finance) business. Partnerships with the World Trade Organization, the multilateral development banks, the UN system and others must be nurtured and developed as part of this process, and complemented with dialogue, awareness-raising and engagement with the investor community.
We can draw on lessons from trade financiers: clarity of expression, transparency about the nature and characteristics of the business, and ongoing engagement to keep Trade Finance “top of mind” among investment managers as an attractive asset class.
Additionally, trade financiers must discuss the business of Trade Finance in the language of investment banking to help investment managers make clear, informed and accurate assessments of Trade Finance-based
investment options. Consistent language will provide fair and appropriate comparisons with other investment options under consideration.
Investment managers need to be open to discussion about alternative investment options, and engage actively with trade financiers to learn about, assess and invest in Trade Finance-based assets.
The ICC Trade Register can provide investors with a view of the credit-related characteristics and quality of the business and investible assets brought to the market. The analysis in the 2016 edition of the Trade Register Report continues to underpin positive conclusions about the credit-related default and loss experience in Trade Finance. It will facilitate informed, constructive dialogue between the investor community, the Trade Finance community, regulatory authorities and others.
FEATURE:
Investor’s Perspective
Robert Kowit, Senior Vice President and Product Specialist, Federated Investors, Inc.
Federated Investors, Inc. is an asset management firm headquartered in the US. Federated’s advisory subsidiaries have $367.2 billion of assets under management as of June 30, 2016.
Federated’s international fixed income team was familiar with Project and Trade Finance and believed Trade Finance assets could provide a significant source of alpha for Federated’s international bond funds and strategies. Trade Finance assets offered a short-term floating rate asset with limited exposure to rate duration or credit duration while generating competitive yield. There appeared to be low or negative correlation with most financial assets.
Federated’s Project and Trade Finance team liked the fact that deals are originated by banks to be held and money is made from earned spread.
Financial assets, including leveraged loans, are based on the “originate-to-distribute” model. Banks earn money from distribution fees and retain little, if any, co-investment.
Federated’s project and Trade Finance team found no transmission mechanism between Trade Finance and financial assets during periods of market turmoil.
In 2006, Federated’s advisory subsidiaries started buying individual deals for Federated’s international bond funds, after a positive experience with the asset class during the financial crisis and interest from domestic portfolio managers.

62 2016 ICC TRADE REGISTER REPORT | wHAT DOES THIS MEAN FOR INvESTORS?
Federated created a pooled vehicle that allowed its own managers to allocate federated fund assets to a diversified portfolio of Project and Trade Finance assets.
In 2012, Federated started to offer a Project and Trade Finance strategy to qualified institutional investors as a stand-alone asset class.
If Trade Finance is so attractive, why are there not more financial investors?
External estimates suggest over $110 trillion of investible assets exist worldwide in insurance, pensions, endowments, sovereign wealth funds, hedge funds, foundations, mutual funds, and Private Wealth Management (PWM).
Project and Trade Finance can provide an interesting opportunity to investors who want to generate yield without taking on excessive rate and credit risk.
But Project and Trade Finance remains essentially invisible to these investors. The structure, mechanics, and difficulty accessing a consistent flow of deals makes investing in Project and Trade Finance difficult. In the past, Trade Finance deals also faced other challenges:
• Very few custodians could settle or safe-keep the deals
• Very few back office operations were equipped to deal with the documents and accounting requirements
• Major originators of deals were unaccustomed to dealing with a financial investor
• Anti-Money Laundering and Know-You-Customer vetting was difficult. Bank compliance is geared to other banks, not to financial investors
• Very difficult to access the consistent volume of flow of deals to maintain an aggressively diversified portfolio
• No information on Bloomberg terminals
Positioning Trade Finance as a financial asset
Project and Trade Finance provide the opportunity for an extremely powerful diversification tool for any mix of floating rate assets. They are best positioned on the continuum of floating rate assets.
Straight floating rate notes are at one end of the spectrum, with leveraged loans at the other. A portfolio of structured pre-export deals provides an opportunity to deliver a return much higher than floating rate notes, with a slightly lower yield than leveraged loans but a fraction of the volatility.
Considerations on Asset Distribution
Trade Finance features a fair amount of asset distribution activity, but it is primarily directed at other banks. Financial investors are covered by a separate sales force that often resides in a different profit center and with a different compensation scheme. Financial sales people are protective of their client relationships. They generally have limited knowledge of Trade Finance and the mechanics of transactions, and attempts to cross-sell have had limited success. As a result, engaging a salesforce will require significant education of the client base to create consistent demand for trade assets.
Differentiating Trade Finance from leveraged loans
A Trade Finance loan is a specific transaction with specific assets pledged, as opposed to a loan to general corporate enterprise value. The collateral is remote from general corporate assets in the event of corporate default.
A senior secured leveraged loan means that, in the event of default, the investor will be standing closer to the front of the line for corporate assets but is still exposed to the liquidation value of those assets.

63
TH
E F
UL
L R
EP
OR
T
GLOBAL RISKS IN TRADE FINANCE
How to attract Institutional Investors
Very few institutional investors are familiar with the mechanics or vocabulary of Trade Finance. They all have a well-articulated investment process and specific requirements for risk management.
The first step in attracting more financial investors to Trade Finance is the construction of a format that maps the risk management (credit, market, liquidity and operational risk) and investment needs of the investor to the basic elements of the market.
Our investment process depends on aggressive diversification over these several different dimensions of risk. We have specific concentration limits to specific obligors and to each element of risk. The learning curve was steep, with excellent help along the way.
The Trade Finance industry has many opportunities to accelerate this process and attract investors, including developing the Trade Register:
Value of the ICC Trade Register As mentioned above, the ICC Register can fill a critical need in seeking financial investment, but it must do so in the language of such financial investors. The ICC Register is constructed as a tool to convince regulators that the asset class is safer than general corporate loans, but is not necessarily easy to read or use by financial investors unfamiliar with specific Trade Finance terminology and properties.
Nevertheless, the report does indeed contain most of the information needed to inform and comfort institutional investors. Consequently, there may be value in the Trade Register introducing dedicated commentary to inform such groups in future reports, as part of the project’s evolution.
Role of the Bloomberg terminal The first place a potential investor looks for information is on Bloomberg. That makes the ubiquitous Bloomberg terminal the top tool to help investors shift to Trade Finance. If Trade Finance is not on Bloomberg, it is invisible. Bloomberg has tutorials on virtually all asset classes and conducts training session on almost all aspects of finance and investing. It provides details of the major forms of risk mitigation, such as political risk insurance, production insurance, and collateral management, and describes collection accounts in detail. In short, Bloomberg would be the most immediate and efficient medium to educate and inform the vast potential investor base.
Other tools and initiativesSeveral other initiatives could also accelerate financial investment into Trade Finance:
• A group to interact with the major global custodians to increase the number who can settle and safekeep trade deals
• A web resource that notifies investors of upcoming deals to keep interested parties in loop
• Working with major organizers to sponsor conferences on Trade Finance as a financial asset class for institutional investors to garner interest and publicity, and bring the Trade Finance and institutional investor committees together.
Trade Finance is an attractive asset class for institutional investors, with scope for high yields and low volatility. A limitation is education: potential investors need to be actively introduced to the concept of investing in Trade Finance, and supported with tools and infrastructure to research, manage and execute deals. The content of the ICC Trade Register is a valuable starting point – it provides transparency into the risks of Trade Finance investment – but broader industry support is likely needed.

64 2016 ICC TRADE REGISTER REPORT | LOOkING AHEAD: EvOLUTION OF THE TRADE REGISTER
The core purpose of the ICC Trade Register is to provide a database of the risk-aligned capital treatment of Trade Finance, and certain traditional products and structures of Trade Financing.
Several refinements to the capital treatment of Trade Finance are directly attributable to the Trade Register Report, the underlying data, and the related advocacy work. The Trade Register Project have made this advocacy work, which the ICC Banking Commission undertakes with a number of industry bodies, international institutions and stakeholder groups, much stronger and more robust.
In the first several years, the Trade Register Reports were about developing and refining approaches to data definition, collection and analysis. More recently, the Reports have focused on clarifying the low-risk nature of Trade Finance and on articulating the strengths, constraints and limitations of the Project.
The scope of the Project’s data collection and analysis is limited to certain products, and to the credit-related default and loss experience around these products. The impact of “product substitution” may result in the Trade Finance-related losses being understated if, for example, they are covered through an operating line of credit or other bank facility – a situation that applies beyond Trade Finance as well.
Despite this, the ICC Trade Register remains the only authoritative source of data and analysis on Trade Finance. Continuing efforts are enhancing the quality and the robustness of the Project, including data collection and filtering, analytics and related advocacy.
Having put into place some credible new partnerships, we will consider how to extend the Project to benefit participating banks and institutions, the wider Trade Financing industry and, ultimately, to benefit the global system of international commerce.
To position and prepare for the evolution of the ICC Trade Register and the Trade Register Report, the Project Team developed an internal paper in 2014 based
on analysis and dialogue with Member Banks. This paper, adopted by Member Banks and by both the Advisory Board and the Executive Committee of the ICC Banking Commission, coupled with more recent deliberations with our new partners, support the need to take the Project to the next level of scope, evolution and impact.
At this stage, we do not have definitive intentions and objectives, as they must be fully articulated and validated with Member Banks. The observations which follow are high-level and illustrative only, with specific objectives, priorities and next steps to be determined with executive sponsors, Member Banks, project team members, and the Banking Commission team, including our three Senior Technical Advisors. Additionally, the planning process will benefit greatly from the perspectives and insights of our new project partners – The Boston Consulting Group and Global Credit Data.
Institution and Product Coverage
The Trade Register should extend its product coverage beyond a selected set of traditional Trade Finance products to encompass fast-growing and increasingly core supply chain finance techniques and structures. Additionally, non-bank sources of Trade Finance – such as multilateral institutions, Export Credit Agency (ECA)-related credit experience, and data linked to Islamic Trade Finance – could significantly enrich the Trade Register, the annual Trade Register Report and the advocacy effort which flows from the data and related analytics.
Risk Coverage
The Trade Register could usefully extend to other areas of risk, such as Operational Risk, Fraud Risk and risk related to regulatory non-compliance. The exact form of such an expansion, the availability (or accessibility) of related data, and the core advocacy objectives that would flow require further deliberation with member institutions and Project contributors and partners.
LOOKING AHEAD: EVOLUTION OF THE TRADE REGISTER

65
TH
E F
UL
L R
EP
OR
T
GLOBAL RISKS IN TRADE FINANCE
Data Scope Extension
The ICC Trade Register could extend its scope to the collection and analysis of non-risk data, such as operational metrics, cost and revenue data and other categories of data that could help industry stakeholders and interested parties to better understand and advocate for the business of Trade Financing and supply chain finance. Potential extensions can only be proposed and pursued with the full buy-in and support of Member Banks whose data, investment of time, money and resources enable the execution of the Project.
Enhanced Analysis and Benchmarking
For several years the Project Team has intended to develop a database of credit and default-related data points, with analytics, reporting and benchmarking functionality. The data was meant to be partly available publicly and partly available to Member Banks contributing data to the project.
Several challenges have combined to obstruct progress – the lack of willingness of some Member Banks to entertain the notion of a benchmarking tool, sensitivities around absolute data anonymity, and the absence of certain types of data in Member Bank submissions. Discussions on the design, functionality and feasibility of deploying such a database and analytical tool will be re-launched in early 2017.
Usability of the Trade Register Data and Report
The ICC Banking Commission understands, from discussion with prospective members, that one perceived high-value use of the data and report is in facilitating internal bank dialogue on risk models and risk modelling practices. Additionally, there are views amongst our Member Banks supporting the use of the Trade Register and its underlying data in conversations with investor communities, the banks’ internal risk and asset distribution teams, and other interested groups and regulatory authorities.
The potential to extend the use of the Trade Register and its underlying data, and to develop advocacy campaigns beyond those aimed at the Basel Committee, are considerations in the process of mapping a way forward for the Trade Register Project, the annual Report and the information, education and advocacy efforts which flow from the Project.
While the core and historical proposition of the Trade Register remains fundamentally relevant to the market, the lessons from what was initially a very focused initiative can be used to extend its scope and value. The foundation of the initiative is now solid, as is the core messaging around risk-aligned capital treatment of Trade Finance, to consider options and priorities for evolving the ICC Trade Register in a highly collaborative process with Member Banks and interested groups from around the world.

66 2016 ICC TRADE REGISTER REPORT | CONCLUSIONS2016 ICC TRADE REGISTER REPORT
Trade Finance plays a critical role in enabling and supporting global trade flows by providing both financing and risk mitigation for trading partners across borders. In addition, Trade Finance is also a major corporate banking product, and important source of revenue for many global, regional and local banks. Given the significance and inherent complexity of Trade Finance, it is key for both banks and regulators to have an up-to-date, accurate and detailed understanding of the product’s risk profile alongside any implications.
The ICC Trade Register exists to provide an objective, transparent view of the credit-related risk profile and characteristics of Short- and Medium to Long-Term Trade and Export Finance using a rich, data-driven approach, while also contributing to relevant informed policy and regulatory decisions within the industry. In parallel, the report aims to broaden awareness and understanding of risk and regulation surrounding Trade Finance among banks, corporates, regulators and investors, as part of the ICC Banking Commission’s commitment to effective and collaborative advocacy.
The 2016 Report corroborates findings from previous years that Trade Finance presents banks with low average maturities and little credit risk, with low default rates, loss given default (LGD) and expected loss (EL) rates.
For Short-Term Trade Finance, the Trade Register reported a marginal increase in risk across products and regions from 2013-2015. This is driven predominantly by higher default rates and – to a lesser extent – a small reduction in recovery rate. The rise in defaults appear to be caused by a mixture of one-off events (e.g. a large importer defaulting), systemic trends, and more idiosyncratic drivers, including technical defaults, varying on a case-by-case basis and by region. Despite this trend, however, Short-Term Trade Finance remains low-risk when compared to other asset classes, including corporate and SME lending.
A slight increase in risk was also observed for Medium to Long-Term Trade Finance, driven by marginal increases in Default Rate and Loss Given Default. The former was observed across regions, but highly skewed towards two markets – Spain and Singapore – where
there had been a number of large defaults with obligor-specific and non-systemic reasons. The increase in Loss Given Default was largely on account of an unusual observed reduction in average ECA coverage for defaulting transactions in 2015. Nevertheless, when isolating only the cases where ECA workout has been complete, both Loss Given Default and Expected Loss return close to levels reported last year.
As with previous reports, the ICC will continue to leverage the results of the Trade Register to put forward recommendations to ensure appropriate treatment of Trade Finance by regulators, in particular the Basel Committee on Banking Supervision. It is believed that a more risk-aligned treatment of Trade Finance by the Basel Accords has the potential to increase the attractiveness of Trade Finance for banks from a regulatory capital efficiency perspective, as seen by the waiving of the sovereign floor in Basel III.
Looking forward, the ICC plans to improve the Trade Register across several dimensions. Most crucially, the ICC is working to increase alignment of the Trade Register with Basel methodology; this requires greater data granularity, volume and accuracy. While the Trade Register now details $9.1 trillion of exposures and 17 million transactions across both Short-Term and Medium to Long-Term Trade Finance products, the scarce nature of defaults in Trade Finance results in limited sample sizes, particularly when assessing trends at a country level. For this reason, the ICC hopes to continue increasing the number of Member Banks and submissions.
Other potential enhancements include the expansion of data scope to cover other aspects of risk (e.g. operational and fraud risk), and new products (e.g. Supply Chain Finance). Finally, in order to drive more value for participating Member Banks, the potential introduction of benchmarking and data-pooling / sharing capabilities are also being reviewed.
Nevertheless, even before these enhancements, the Trade Register stands as the only authoritative source of credit risk and default data in Trade Finance across multiple institutions, and thus continues to hold its weight in industry discussions
CONCLUSIONS

67GLOBAL RISKS IN TRADE FINANCE
AP
PE
ND
IX
APPENDIX
Appendix A: Approach to Analysis
Short-Term Trade Finance
Default Rate
Exposure at Default
Loss Given Default and Expected Loss
Medium to Long-Term Trade Finance
Observed average maturity
Default rate
Loss Given Default
Expected Loss (EL)
Appendix B: Data Collection and Filtering
Data Availability
Quality and Quantity of Submitted Data
Data Quality Checks and Filtering Process
Appendix C: Detailed Analysis Tables
Short-Term Trade Finance
Default Rate Analysis
Loss Given Default and Expected Loss Analysis
Medium to Long-Term Trade Finance
Default Rate Analysis: By Asset Category
Default Rate Analysis: By Region
Appendix D: List of Acronyms

68 2016 ICC TRADE REGISTER REPORT | APPENDIx A: APPROACH TO ANALySIS
Short-Term Trade Finance
Default Rate
Banks may treat default as a product-specific phenomenon, meaning that a customer can be in default on one product but not another. Under Basel II, however, banks are supposed to take an “obligor default perspective”, meaning that if a customer defaults on any product, then all the customer’s products held with the bank should be deemed in default. For example, if an Import L/C customer defaults on a loan, then its L/C is also deemed to be in default even if the customer has met all its obligations under the L/C. The ICC Trade Register uses this definition of default.
Banks were asked for information on how many customers had a Trade Finance product when they entered Basel default. Using this obligor default perspective gives a higher default rate, but a lower loss given default (LGD), than a transaction-specific perspective would. The default of a customer with business in several countries is counted as a default in all countries they have business in. This means summing the defaults in each country will slightly overstate the true global total.
Exposure at Default
Exposure at Default (EAD) measures a bank’s exposure to a counterparty at the time of default. It is defined as the gross exposure, including an estimate of undrawn or unutilised facilities. L/C and Performance Guarantee exposures are contingent on an act that must be performed before the exposure is created. For example, trade documentation must be presented and accepted to trigger a valid claim under an L/C.
Once the contingent event has occurred, the bank will attempt to pay the required balance from their customer’s account. If the customer’s account has insufficient funds to cover the balance, the bank will pay the remaining balance from its own funds. The contingent liability has then been converted into an (on-balance sheet) exposure for the bank.
In many cases, the amount requested for payment of the default is lower than the limit on a facility over the course of a transaction’s lifecycle. This occurs where a reduction in volumes reduces the total exposure level, as in the case of a partial shipment under an L/C. A total exposure often comes by way of multiple transactions. For example, a customer may have a limit and thus contingent exposure of $900,000, but typically makes shipments of up to $300,000 each, meaning that the EAD might be considerably less than the whole $900,000.
EAD plays a major role in Expected Loss (EL) calculations. However, there is an ongoing debate about whether the potential events described above should be taken into account in the EAD or LGD component of the calculation by means of Credit Conversion Factors (CCFs).
It is difficult to determine accurate EAD figures across banks. Efforts to gather this information on a consistent basis across the sample are at an early stage. One obstacle is that many jurisdictions require exposures for defaulted obligors to be consolidated under one account, which eliminates the granular information required for the calculations. To deliver this data, banks would need to track transactions through their life cycle, which some banks could do only manually and others not at all. Many banks collect data on performing and non-performing credits in separate systems of books, which creates yet another obstacle for analysing exposures pre- and post-default.
Given these data limitations, a CCF of 100% has been used to estimate an Exposure at Default figure for Import L/Cs, Export L/Cs and Loans for Import/Export. The Project intends to continue building the database over the coming years to enable the calculation of a robust CCF for these products.
The CCF is particularly important for Performance Guarantees. These instruments exist primarily to protect against unforeseen outcomes, such as non-performance or performance below the standards agreed, and only a small ‘claim rate’ is
APPENDIX A: APPROACH TO ANALYSIS

69GLOBAL RISKS IN TRADE FINANCE
AP
PE
ND
IX
Credit Conversion Factors (CCFs)
The Credit Conversion Factor (CCF) estimates the likelihood of an undrawn trade facility being drawn down and is a key input in the calculation of Exposure at Default (EAD). CCFs are applicable to both funded and unfunded trade products. Additionally, CCFs are used as a proxy to estimate the on-balance sheet exposure of contingent liabilities (e.g. L/Cs and performance guarantees). In practical terms:
• For an Import L/C, the CCF is an estimate of the likelihood of an L/C becoming an on-balance sheet liability; when the Import L/C does become an on-balance sheet liability it becomes a Bill Receivable for a Sight L/C and a Deferred Payment Bill for a User’s L/C.
• For a Performance Guarantee, the CCF could be used to reflect the likelihood of a claim being made and being paid out against the Performance Guarantee
As noted in previous ICC Trade Registers, the definition of CCF in the Basel framework is open to interpretation and has led to different interpretations by regulators and institutions. This presents a key challenge, as: a) the CCF is a critical factor in calculating risk capital and leverage exposure for a bank; and b) in the case of default, the CCF is a key driver in the loss calculation through EAD.
The following areas of ambiguity make a statistically sound analysis of the CCF, which is one of the aims of the Trade Register, challenging for now:
• As EAD is recorded on facility level, aggregating across undrawn proportions of, for example, overdraft lines, guarantees, documentary credit, isolating the EAD data of a specific Trade Finance product is difficult for most banks
• The lifecycle of a documentary trade transaction, and the document processing and checking steps and their results, have a significant impact on whether a claim does indeed exist on the level of the Trade Finance product when the obligor defaults or not. For example, if documents were rejected as not compliant before a default, a claim on the Trade Finance product could not be constituted
• There are different interpretations to estimating EAD in Trade Finance:
— One view is that if a successful claim is never made against a product, and no money is ever paid by the bank, then this should be reflected in a lower EAD throughout the transaction life cycle
— The other perspective is that if a customer defaults, there is outstanding exposure for the bank and therefore EAD should equal 100%. Other factors should be reflected in the LGD itself.
— Both these approaches result in the same expected loss.
For a precise CCF calculation, it is critical to receive transaction / product level data which allows reconciliation of the transaction life cycle of a Trade Finance product. The ICC Trade Register Project is looking at collecting this data in the future. Given the practical challenges in reporting data consistently on product level and across the full life cycle (including the pre-default and post-default periods), only very few banks have been able to provide data in the required format. As a result, the Trade Register uses assumed CCFs across products.

70 2016 ICC TRADE REGISTER REPORT | APPENDIx A: APPROACH TO ANALySIS
expected. As with L/Cs, the Trade Register has been collecting data since 2013 to better determine CCFs for Performance Guarantees. While data points remain few, sufficient observations were available to calculate a claim rate (and therefore assumed CCF) of 8%, with observations from individual banks in the range of 0% to 27%. The 8% figure does not mean that in all cases the customer defaulted on its obligations to the bank. In many cases, the transaction is settled from the customer’s account, but current data does not allow us to estimate how much is paid from the client’s versus the bank’s account.
As per the ongoing debate, this 8% claim rate can be applied to either EAD or LGD calculations. Technically speaking, in the case of a claim, the true EAD is likely to be the outstanding exposure value of the
Performance Guarantee (presumably higher than 8% of the limit), and therefore the Trade Register’s existing methodology of applying the ‘claim rate’ to EAD is incorrect. The more correct alternative would be to apply this 8% to LGD, and assume EAD to be 100% as done so for L/Cs and Loans for Import/Export. Of the Member Bank representatives surveyed, 75% preferred this approach.
Both methodologies derive the same EL result, and therefore there is limited impact on shifting approach to latter. Nevertheless, for consistency, both methodologies are used in this report, as shown below (Figure 42).
The following CCFs have been used to reflect EAD for Short-Term Trade Finance products in this study:
FIGURE 42:
Assumed CCFs by Short-Term Trade Finance Product
100%
0%
40%
20%
60%
80%
Import L/Cs Export L/Cs Loans for Import / Export
Performance Guarantees
(Based on 8.5% observed ‘Claim Rate’)
100 100 100
8.5
Loss Given Default and Expected Loss
Loss Given Default (LGD) measures the loss incurred by a bank in relation to the overall exposure of the bank at the time an obligor defaults. Under Basel rules, this should be the net present value of recoveries discounted at an appropriate discount rate and should include direct and indirect costs associated with recovering the bank’s money.
Basel requires that “the definition of loss used in estimating LGD is economic loss. When measuring economic loss, all relevant factors should be taken into account. This must include material discount effects and material direct and indirect costs associated with collecting on the exposure”.

71GLOBAL RISKS IN TRADE FINANCE
AP
PE
ND
IX
As a result, LGD is made up of three key components:
• Observed recovery rates, as a percentage of the Exposure at Default (EAD)
• Direct and indirect costs incurred in the recovery process, which are deducted from the recoveries
• Discounting of any post-default cash flows using an appropriate discount rate.
Calculating Expected Losses (EL) requires transaction-level data from banks, which limits the data points available for analysis. As a result, EL cannot be broken down by region and country, as was done for Default rates. For recovery rates in particular, acquiring sufficient data points to estimate recovery rates accurately continues to be a challenge for the Trade Register, and large one-off events can skew overall patterns.
Benchmarking: Comparison of Trade Finance to other Asset Classes
The benchmarks / comparisons between Trade Finance and other Asset Classes used in this Report bring together data from different databases in an attempt to make a very high level comparison of observed loss statistics by product and borrower types.
Please bear the following caveats in mind when using this data:
1. Both the ICC Trade Register data for Trade Finance and the Global Credit Data (GCD) data for other Asset Classes (or “Other Products”) are based on separate data pools for default rate and loss given default (LGD), meaning that the underlying data in this table effectively comes from four different data pools. Each pool is supplied by an overlapping but not perfectly consistent set of lenders.
2. For each of the Trade Finance and “Other Products” pools, the defaulted borrowers in the default rate calculation are not completely consistent with the defaulted borrowers used in the LGD calculation.
3. The Trade Finance default rate and LGD data is all exposure-weighted, meaning that it more greatly reflects larger
transactions. The GCD comparative “Other Products” data is exposure-weighted for default rate and Borrower-weighted for LGD, meaning that the LGD reflects the more numerous smaller transactions.
4. Discount rate for LGD has been applied at a consistent 9%
5. The data series cover different dates. The ICC Trade Finance data comes from 2008 to 2015 while the GCD “Other Products” data comes from 2000 to 2015 for probability of default (PD) and the LGD from 2000 to 2013
6. The borrower size, borrower industry and country profile differs between the Trade Finance and “Other Products” data pools
7. The data templates used differ between ICC Trade Register and GCD. For LGD collection, GCD collects detailed cash flows tagged by date and source, and uses this to compute a discounted recovery rate and thence an LGD. The ICC Trade Register LGD collection of short-term data receives exposure amounts at time of default and then the final loss or recovery, meaning that the recoveries are delivered net and aggregated before discounting. Numerous choices of data selection and methodology have been made in each of the default rate and LGD calculations, not necessarily consistent between each of the data pools. An example is the inclusion of post-default advances in LGD from the GCD data pool, where this has been added back to the exposure at default, while this has not been done within the Trade Finance data pool. Both methods are valid and many other possibilities exist.
Medium to Long-Term Trade Finance
Observed average maturity
The maturity describes the amount of time remaining before a transaction expires, not the total maturity of the contract upon its initial issuance. The Trade Register report shows the distribution of maturities across the entire sample, and a comparison of the transaction

72 2016 ICC TRADE REGISTER REPORT | APPENDIx A: APPROACH TO ANALySIS
average and the exposure weighted average. These calculations are made over the entire sample of transactions for which maturity values were submitted.
Default rate
The data underlying the analysis of the Medium to Long-Term (MLT) Trade Register is collected at the transaction level, and banks are asked to provide both unique customer and transaction IDs. As a result, consistent transaction-level and customer-level Default Rates can be calculated for closer alignment to the Basel methodology. All transactions are reported by four major asset categories – Corporate, FI, Sovereign and Specialized – to highlight the differences in risk profile.
Given that MLT transactions typically span 10–15 years, and banks report data to the MLT Trade Register on an annual basis, any individual transaction is likely to appear in multiple years. However, as Basel Default Rate measures are based on a 12-month outcome window (as opposed to a transaction or customer lifetime perspective), different methodologies can be applied to arrive at these metrics. In short, the Default Rates presented in this report are annual averages over 2007-2015; the sum of the number of defaults across all years is divided by the sum of total transactions in each year. Defaults are only counted in the year that they occur and are excluded from the total transaction count in subsequent years.
Three different default rates (by Exposures, number of Obligors, and number of Transactions) are calculated based on the same set of underlying transactions and the methodological approach outlined above. For each of these metrics, the sums are calculated across the entire sample for 2007–2015.
Loss Given Default
OverviewAs detailed in Short-Term Trade Finance analysis, Loss Given Default is a measure of the loss incurred by a bank in relation to the overall exposure of the bank at the time a counterparty defaults.
This is calculated as:
LGD = (1 - recovery rate) + discount on recoveries (%) + costs (%)
Observed recovery rateTypically, when a customer defaults, the Export Credit Agency (ECA) will assume responsibility for the payments due under the terms of the contract and make payments in line with the original contract. This does cause potential challenges when analysing observed recoveries for which the full recovery period is not available. For example, if 3.5 years remain contractually at the point of default, on average 25–30% of the total recoveries would be expected to come from the ECA each year.
As a result, observed recoveries for the most recent defaults may amount to the instalments due as agreed originally (i.e. not to the full contractual loan lifecycle expected recovery rate, based on the level of cover). While the defaulted amount recognised will be the full outstanding amount, the observed recovery will be a portion of the defaulted amount as the ECA will pay out based on the agreed payment schedule instead of the full outstanding amount. In other situations, the ECA will make an upfront lump-sum payment. Where the ECA recovery is not complete, the amount due is determined by comparing the original payment profile with the observed recoveries.
Even in situations where the ECA has accelerated the workout or the workout is complete, additional recoveries from borrowers may occur and eventual recoveries may be higher than those indicated in this report.
Additionally, where recoveries are made from the customer, they are shared between the bank and the ECAs based on the uncovered and covered portions, as the ECA is subrogated in the rights of the bank after indemnification.
For example, if a customer defaults owing the bank $1 million, with ECA cover of 95%, the ECA will pay the bank $950,000. If the customer makes a payment of $100,000, $95,000 (95%) would be given to the ECA

73GLOBAL RISKS IN TRADE FINANCE
AP
PE
ND
IX
and $5,000 (5%) would be retained by the bank. The bank’s overall recovery is $955,000.
DiscountingFor Basel Loss Given Default purposes, the following factors need to be accounted for:
• Discount rate on recoveries, with recoveries discounted from the point of default to the point of recovery
• Direct and indirect recovery costs, typically shared with ECA
• Downturn effects (i.e. the potential impact of an economic downturn on recovery cash flows and cure rates) in addition to MLT transactions
The discount rate applied to these products differs significantly across banks and is an area of ongoing debate. Applying a discount rate to the MLT Trade Register data is further complicated as products have state backing from OECD sovereigns. This state backing means it can be assumed that the stream of payments from these products is similar to those of a government bond. Therefore, we use a discount rate applied to a bond from the government of the ECA with a similar maturity. For example, if the recovery from the ECA occurs two years after default, we use a discount rate based on the 2-year sovereign bond rate.
Given that highly-rated OECD ECAs have never defaulted on a valid claim, some practitioners consider that the discount rate should be based on the 3-month sovereign bond rate, as the ECA is committed to indemnify within a few months, instalment-by-instalment (and not at the date of the default), and to cover interest.
However, two adjustments are required to this rate:
• A liquidity premium to reflect the fact that ECA claims are a relatively small and illiquid market (a liquidity premium of 1% has been used as per previous years’ methodology)
• An adjustment for the risk of disagreement on the validity of the claim (as this is increasingly rare, no
adjustment has been made at this stage. Furthermore, most practitioners argue that the risk of disagreement on the claim validity is an operational risk and more appropriately reflected in operational risk capital).
The discount rate for the covered portion of the repayments is based on a point on the government yield curve (based on the maturity of the underlying transaction) with an additional 1% liquidity premium. The last 12 months of data and the average time to recovery suggest an average discount rate of approximately 1.5%. However, where the MLT Trade Register only reflects principal repayments, no discounting effect has been applied as the interest due would offset any discounting effect.
For the uncovered portion of the portfolio, (i.e. those recoveries from the customer rather than the ECA post-attribution), a discount rate of 9% is applied, similar to the one used for Short-Term Products and a typical unsecured recovery.
Costs of recoveryThe ECA will typically cover a substantial share of the collection/workout costs for the defaulted exposure in line with the level of cover provided.
For this year’s calculations, workout costs are assumed to be 1% of MLT exposures (including banks’ internal indirect costs in line with Basel requirements).
Expected Loss (EL)
Using the results generated in default and LGD calculations, overall EL is estimated based on the formula:
EL = Default Rate x EAD x LGD
Sufficient information to appropriately calculate the EAD based on empirical data is not available, and for the purposes of this calculation EAD is assumed to be equal to the current balance.
Results are based on the average coverage ratios from the MLT Trade Register. In some instances this coverage is higher, up to 100%, and the EL will vary by case.

74 2016 ICC TRADE REGISTER REPORT | APPENDIx B: DATA COLLECTION AND FILTERING
Data Availability
The data collection under the revised methodology is now in its third year (covering four years of data from 2012–2015) and significant improvements have been realised:
• Significantly larger data set from more banks than ever with more data points across years
• More complete data set particularly across the granular data categories such as geographical breakdowns
• Enhanced consistency of data items across submitted data sets and between contributing Member Banks
• Established data gathering and data processing across many participating banks, including all year-on-year improvements in systems, auditing, data extraction and cleansing
Despite recent improvements there are several difficulties in the data gathering process that should be considered when reviewing the results:
• Data definitions and terminology may vary between Member Banks, requiring a significant verification and validation effort to assure maximum accuracy and consistency of data elements. These issues include the all-important definition of default, which requires some degree of expert judgement by the Member Bank to determine the crucial element of “unlikeliness to pay”. This is particularly significant for larger borrowers, banks and sovereigns.
• Data sourcing, collection and submission may involve multiple systems within a single financial institution, and may require manual intervention. This can introduce error into the dataset
• Data is not always accessible/available at the desired level of detail and granularity, such that some observations can only be presented in aggregated form, rendering some comparisons difficult
One specific area where the number of observations is considerably smaller than for other analyses is the recovery rate / loss given default (LGD) analysis. Not only is this the result of the low number of defaults, but it is also due to the fact that, after the date of default of an obligor, many banks aggregate exposures and recovery data at either a customer or facility level and are not able to break these down into transaction- / product-level information, which would be required to estimate recoveries and losses. This issue is not specific to trade finance data and is not a weakness of data collection or processing, but rather reflects the complex legal and operational environment faced by banks when collecting defaulted loans and transactions, where every case is unique.
To account for these challenges and to ensure data quality, consistency and comparability, an iterative four-step data cleansing process has been used to compile the final data set:
1. Critical evaluation of new data submitted by Member Banks, focussing on identifying outliers, likely data errors, omissions of critical fields and any other issues per each bank’s submission
2. A detailed audit report to each Member Bank, then discussed iteratively as replacement data or clarifications are submitted.
3. Aggregation of new and updated data with prior submitted data from each Member Bank, resulting in a further round of audit and questioning
4. Filtering of unresolved issues or likely erroneous data points, including omission of certain years, products and banks where necessary (in collaboration with the submitting banks)
The foregoing process has resulted in a qualified, quality-controlled data set which maximises the acceptance of available data.
APPENDIX B: DATA COLLECTION AND FILTERING

75GLOBAL RISKS IN TRADE FINANCE
AP
PE
ND
IX
Quality and Quantity of Submitted Data
As the Trade Register evolves, so too do the Member Banks’ abilities to submit accurate, granular data. The 2015 data set shows a further improvement in quality and quantity over the data sets used in previous editions of this report.
For the Short-Term Trade Register, 87% of the transactions now included in the Trade Register have successfully passed the data filtering process, resulting in a stable data set of 17.3 million transactions. This compares to 4.6 million transactions post-filter in previous years’ analyses and hence demonstrates the significant improvement in breadth and depth of the Trade Register and the related strength of the 2015 Report. However, it also means that aggregated results are more heavily influenced by more recent years.
For Medium to Long-Term (MLT) Trade Finance, the filtering process also excludes approximately 16% of available transactions. This results in 37,279 transactions available for analysis, which is an increase of almost 10% over previous year’s data set.
As noted above, due to the complexity of data access in complex global financial services firms and resultant limitations to data availability, not all participants are able to complete the data collection templates in full. Therefore, in some cases different subsets of the data have been used for different analyses. This is to include as many observations as possible and therefore arrive at the best possible representation of the in-scope Trade Finance universe.
Figures 43-44 show the number of transactions and participants whose data could be included in the main analyses presented in the subsequent sections. It should be noted that this is not a comprehensive overview of all aspects of the analysis contained in this report.
FIGURE 43:
Unfiltered data sample for Short-Term Trade Finance, 2008-2015
FIGURE 44:
Unfiltered data sample for MLT Trade Finance, 2007-2015
Member Banks
Number of Transactions
Number of Customers
Exposure (USD$ BN)
Submitted data 24 19,744,330 874,028 10,625
Default rate analysis 21 17,255,616 734,425 8,536
Recovery Rate Analysis 12 4,999 324 2
Member Banks
Number of Transactions
Number of Customers
Exposure (USD$ BN)
Submitted data 18 44,718 5,547 660.8
Default rate analysis 17 37,279 4,355 613.44
Recovery Rate Analysis 11 208 130 1.34

76 2016 ICC TRADE REGISTER REPORT | APPENDIx B: DATA COLLECTION AND FILTERING
Data required to accurately calculate observed LGD rates must come from cases where the recovery has been completed. Incomplete cases can give some information as to the future likely outcome, but only fully complete cases can tell us how much a bank has lost, if anything. Due to the long recovery process for MLT cases, it takes many years after the date of default to complete the set of all defaulted cases with their final outcomes, hence the relative scarcity of completed data for LGD in the MLT data set.
Data Quality Checks and Filtering Process
This section includes an overview of the data quality filters applied to the Trade Register data used for the purpose of this report.
In the Short-Term Trade Register, the filtering criteria that lead to most exclusions are linked to the requirement for each bank to be able to submit obligor, transaction and exposure level information on a consistent basis. This is reflected in the “customer” and “transaction” filters (for example, if a bank cannot provide customer information this would be reflected in the customer filter). The transaction filter also includes any transactions that have been excluded due to other data quality issues that could not be resolved over the course of the data collection process.
It can be argued that the customer filter and transactional filter can be applied independently to derive the customer level default rate and the transaction level default rate, respectively. On the one hand this would create a larger sample set, but on the other hand, this approach would lead to two different subsamples on which to derive analytics. When compared, these would always have inherent differences as a result of the sample, and might lead to incorrect conclusions being drawn. As a result of this, a smaller, more comparable data set for the purposes of the overall default rate analysis has been produced, using only data where both customer and transaction
information was available. However, where possible for other analyses such as maturity and loss given default, this filter has been relaxed. The unavoidable result of this difference in filtering is that the Expected Loss calculation is a mixture of different borrowers for each of the default rate and LGD elements.
It should be noted that almost 90% of the excluded transactions pertain to the years of 2007–2012. This reflects the improvements in data quality and completeness in recent years of the Trade Register, and the challenges associated with the introduction of new data collection templates in 2012.
In the Medium to Long-Term Trade Register, the following filters are applied to analyse default rate:
• ECA filter: given only transactions where an ECA from a high-income OECD country has provided a guarantee or insurance are in scope of the MLT Trade Register, this filter excludes transactions where information about the ECA or the level of political or commercial coverage could not be provided
• Year and default filter: in order to establish analytical integrity, each default should only be considered once in the database (in the year that default occurs); this filter excludes defaulted transactions reported in multiple years and any transactions with misaligned dates (e.g. a default date prior to the trade date)
• Customer and transaction data quality filter: in order to ensure customer and transaction default rates are measured accurately, any transactions without unique customer or transaction IDs have been excluded. This filter also includes transactions that have been excluded for other data quality reasons such as zero exposure values or missing country or asset category information

77GLOBAL RISKS IN TRADE FINANCE
AP
PE
ND
IX
Given the long-term character of MLT transactions, data submissions always cover multiple years on a transaction-by-transaction basis. This was the fourth year in which participants submitted data to the MLT Trade Register with initial submissions in 2012 asking participants to submit data back to 2007. Significant effort has been put into comparisons of different years’ submissions and appropriate cleansing in order to arrive at a consistent year-after-year data set for individual transactions. Ultimately a coherent data set covering MLT data across a period of 2007–2015 could be derived. Over the last four years, a healthy increase in both the number of transactions in the Trade Register and the number of banks participating in the exercise has been recognised and this trend is expected to continue.

78 2016 ICC TRADE REGISTER REPORT | APPENDIx C: DETAILED ANALySIS TABLES
FIGURE 46:
Variance of Obligor Default Rates across Banks by Product, 2008-2015
For continuity and to enable comparison with previous reports, a number of recurring figures have been reproduced below to include 2015 data collected as part of this year’s Trade Register.
Short-Term Trade Finance
Default Rate Analysis
APPENDIX C: DETAILED ANALYSIS TABLES
FIGURE 45:
Total customers and default rate by Loan sub-product, 2008-2015
Loan Sub-Product ObligorsDefaulting
Obligors Default Rate
Loans for Import/Export (Bank & Corp.) 203,811 1,623 0.796%
Loans for Import (Bank & Corp.) 86,249 839 0.973%
Loans for Export (Bank & Corp.) 77,626 619 0.797%
Loans for Import/Export (Bank) 42,020 54 0.129%
Loans for Import/Export (Corp.) 161,791 1,569 0.970%
Product Average default rate (By Obligor)
Export L/C 0.047%
Import L/C 0.351%
Performance Guarantees 0.479%
Loans for Import/Export 0.796%
0%
1%
2%
3%
4%
5%
Export L/C Import L/C Performance Guarantees
Loans for Import/Export

79GLOBAL RISKS IN TRADE FINANCE
AP
PE
ND
IX
FIGURE 47:
Obligor Default Rates by Product and Region, 2008-2015
Import L/C Export L/C
Loans for Import/Export
Performance guarantees
0% 0%
0%
Afr
ica
Afr
ica
AP
AC
AP
AC
Ce
ntr
al &
S
ou
th A
me
ric
a
Ce
ntr
al &
S
ou
th A
me
ric
a
Eu
rop
e
Eu
rop
e
Mid
dle
Ea
st
Mid
dle
Ea
st
No
rth
Am
eri
ca
No
rth
Am
eri
ca
Oth
er
/ N
A
Oth
er
/ N
A
0%
0.8% 0.15%
2.5% 1.0%
0.12%
2.0% 0.8%
0.8%0.9%
1.5% 0.6%
0.8%0.6%
1.0% 0.4%
0.8% 0.3%
0.5% 0.2%
FIGURE 48:
Average “event likelihood” in the life of a Performance Guarantee
Loss Given Default and Expected Loss Analysis
100%
0%
40%
20%
60%
80%
% Claim made and successful
% Claim not made
Total % Claim made but unsuccessful
100
3
89
8
FIGURE 49:
Average Time to Recovery in Days and Years, 2008-2015
Product TTR - Days TTR - Years
Import L/C 196.4 0.5
Export L/C 113.9 0.3
Loans for Import/Export 144.8 0.4
Performance Guarantees 69.8 0.2
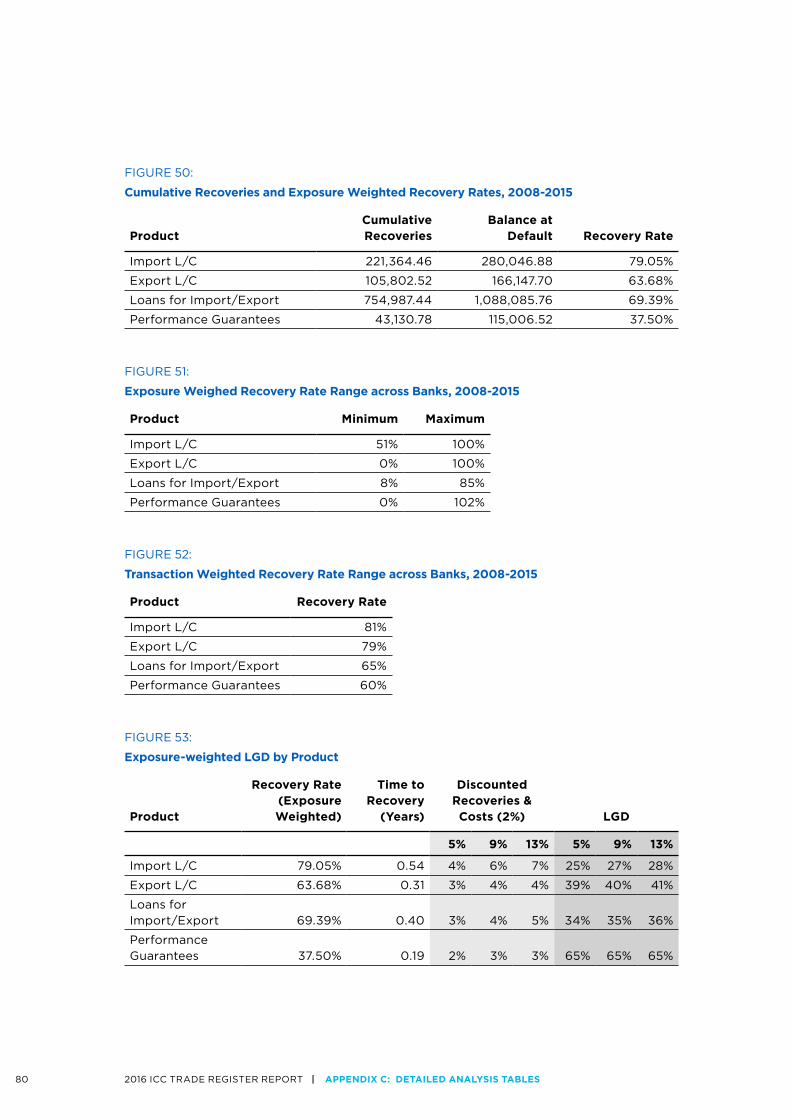
80 2016 ICC TRADE REGISTER REPORT | APPENDIx C: DETAILED ANALySIS TABLES
FIGURE 50:
Cumulative Recoveries and Exposure Weighted Recovery Rates, 2008-2015
FIGURE 53:
Exposure-weighted LGD by Product
FIGURE 51:
Exposure Weighed Recovery Rate Range across Banks, 2008-2015
FIGURE 52:
Transaction Weighted Recovery Rate Range across Banks, 2008-2015
ProductCumulative Recoveries
Balance at Default Recovery Rate
Import L/C 221,364.46 280,046.88 79.05%
Export L/C 105,802.52 166,147.70 63.68%
Loans for Import/Export 754,987.44 1,088,085.76 69.39%
Performance Guarantees 43,130.78 115,006.52 37.50%
Product
Recovery Rate (Exposure Weighted)
Time to Recovery
(Years)
Discounted Recoveries & Costs (2%) LGD
5% 9% 13% 5% 9% 13%
Import L/C 79.05% 0.54 4% 6% 7% 25% 27% 28%
Export L/C 63.68% 0.31 3% 4% 4% 39% 40% 41%
Loans for Import/Export 69.39% 0.40 3% 4% 5% 34% 35% 36%
Performance Guarantees 37.50% 0.19 2% 3% 3% 65% 65% 65%
Product Minimum Maximum
Import L/C 51% 100%
Export L/C 0% 100%
Loans for Import/Export 8% 85%
Performance Guarantees 0% 102%
Product Recovery Rate
Import L/C 81%
Export L/C 79%
Loans for Import/Export 65%
Performance Guarantees 60%

81GLOBAL RISKS IN TRADE FINANCE
AP
PE
ND
IX
FIGURE 54:
Expected Loss Calculation by Product
Product
Default Rate (By Obligor) EAD LGD Expected Loss
9% Customer Transaction Exposure
Import L/C 0.35% 100% 27% 0.09% 0.03% 0.02%
Export L/C 0.05% 100% 40% 0.02% 0.00% 0.02%
Loans for Import/Export 0.80% 100% 35% 0.28% 0.08% 0.07%
Performance Guarantees 0.48% 8% 65% 0.02% 0.01% 0.01%
FIGURE 55:
Obligor default rate by asset category, 2007–2015
Medium to Long-Term Trade Finance
Default Rate Analysis: By Asset Category
Asset Total Obligors Defaulting Obligors Default Rate
Corporate 7,912 76 0.96%
FI 3,558 50 1.41%
Sovereign 1,952 5 0.26%
Specialized 2,855 16 0.56%
Total 16,277 147 0.90%
FIGURE 56:
Transaction default rate by asset category, 2007–2015
Asset Total Transactions Defaulting Transactions Default Rate
Corporate 16,749 132 0.79%
FI 7,223 103 1.43%
Sovereign 5,617 8 0.14%
Specialized 7,690 42 0.55%
Total 37,279 285 0.76%

82 2016 ICC TRADE REGISTER REPORT | APPENDIx C: DETAILED ANALySIS TABLES
FIGURE 58:
Obligor default rate by region of risk, 2007–2014
FIGURE 59:
Transaction default rates by region of risk, 2007–2014
Default Rate Analysis: By Region
Asset Total Obligors Defaulting Obligors Default Rate
Africa 1,644 11 0.67%
APAC 2,848 15 0.53%
Central & South America 1,882 16 0.85%
Europe 3,154 18 0.57%
ex-CIS 4,136 53 1.28%
Middle East 1,252 33 2.64%
North America 1,361 1 0.07%
Total 16,277 147 0.90%
AssetTotal
TransactionsDefaulting
Transactions Default Rate
Africa 4,270 24 0.56%
APAC 8,340 28 0.34%
Central & South America 4,694 23 0.49%
Europe 6,855 40 0.58%
ex-CIS 6,595 86 1.30%
Middle East 3,580 82 2.29%
North America 2,945 2 0.07%
Total 37,279 285 0.76%
FIGURE 57:
Exposure weighted default rate by asset category, 2007–2014
AssetTotal Exposures
($K)Defaulting Exposures
($K) Default Rate
Corporate 323,322,616 1,470,122 0.45%
FI 46,846,323 578,686 1.24%
Sovereign 106,277,088 76,216 0.07%
Specialized 136,995,852 576,569 0.42%
Total 613,441,878 2,701,594 0.44%

83GLOBAL RISKS IN TRADE FINANCE
AP
PE
ND
IX
FIGURE 60:
Exposure weighted default rates by region of risk, 2007–2014
AssetTotal Exposures
($K)Defaulting Exposures
($K) Default Rate
Africa 64,996,149 172,554 0.27%
APAC 141,939,507 487,941 0.34%
Central & South America 87,416,063 150,809 0.17%
Europe 126,574,597 473,217 0.37%
ex-CIS 67,614,627 728,006 1.08%
Middle East 60,559,707 665,503 1.10%
North America 64,341,228 23,564 0.04%
Total 613,441,878 2,701,594 0.44%

84 2016 ICC TRADE REGISTER REPORT | APPENDIx D: LIST OF ACRONyMS
APPENDIX D: LIST OF ACRONYMS
AML Anti-Money Laundering
AVC Asset Value Correlation
BCBS Basel Committee on Banking Supervision
BIS Bank for International Settlements
bps Basis Point(s)
CAGR Compound Annual Growth Rate
CCAR Comprehensive Capital Analysis and Review
CCF Credit Conversion Factor
CFTA The Continental Free Trade Agreement (CFTA)
CIS Commonwealth of Independent States
CRR Capital Requirements Regulation
EAD Exposure At Default
EC European Commission
ECA Export Credit Agency
ECB European Central Bank
EL Expected Loss
EU European Union
FI Financial Institution
GDP Gross Domestic Product
IFC International Finance Corporation
IFRS International Financial Reporting Standards
ICC International Chamber of Commerce
IMF International Monetary Fund
A/F-IRB Advanced / Foundation-Internal Ratings-Based Approach
KYC Know Your Customer
KYCC Know Your Customer’s Customer
L/C(s) Letter(s) of credit
LCR Liquidity Coverage Ratio
LGD Loss Given Default
MDB Multilateral Development Bank
MFW Maturity Floor Waiver
MLT Medium to Long-Term
NSFR Net Stable Funding Ratio
OECD Organisation for Economic Co-operation and Development
PD Probability of Default
PRA Prudential Regulation Authority
QIS Quantitative Impact Studies
RWA Risk Weighted Assets
SME Small and Medium-Sized Enterprises
TF Trade Finance
UCC Unconditionally Cancellable Commitment
UN United Nations
WTO World Trade Organization


The world’s essential rule-making body for the banking industry
ICC is the largest, most representative business organization in the world. Its global network comprises over 6 million companies, chambers of commerce and business associations in more than 130 countries, with interests spanning every sector of private enterprise.
With 85 years of experience and more than 600 members, the ICC Banking Commission – the largest Commission of ICC – has rightly gained a reputation as the most authoritative voice in the field of trade finance.
RULES
ICC Banking Commission produces universally accepted rules
and guidelines for international banking practice. ICC rules
on documentary credits, UCP 600, are the most successful
privately drafted rules for trade ever developed, serving
as the basis of USD 2 trillion trade transactions a year.
POLICyMAkINGICC Banking Commission is helping policymakers and standard
setters to translate their vision into concrete programmes and
regulations to enhance business practices throughout the world.
PUBLICATIONS AND MARkET INTELLIGENCEUsed by banking professionals and trade finance experts
worldwide, ICC Banking Commission publications and market
intelligence is the industry’s most reputable and reliable source of
guidance to bankers and practitioners in a broad range of fields.
DISPUTE RESOLUTIONICC Banking Commission and ICC International Centre
for Expertise administer the ICC Rules for Documentary
Instruments Dispute Resolution Expertise (DOCDEX) to
facilitate the rapid settlement of disputes arising in banking.
EDUCATION AND CERTIFICATIONThe ICC Academy is the world business organization’s
ground-breaking e-learning platform. Its industry-relevant
Global Trade Certificate (GTC) provides an extensive
overview of trade finance products and techniques.
SPECIALIZED TRAINING AND EvENTSIn addition to its bi-annual summit gathering 300+ international
delegates every six months, the ICC Banking Commission
organizes regular seminars and conferences around the world, in
partnerships with ICC National Committees and other sponsors.
STRATEGIC PARTNERSHIPS Well-established collaboration with leading policymakers and
trade association, including WTO (World Trade Organization),
ADB (Asian Development Bank), Berne Union, EBRD (European
Bank for Reconstruction and Development), IDB (Inter-American
Development Bank), IFC (International Finance Corporation), IMF
(International Monetary Fund), SWIFT, the World Bank and others.
ICC BANkING COMMISSION