ic/2010/085 united nations educational, scientific and - ictp
TRANSCRIPT
Available at: http://publications.ictp.it IC/2010/085
United Nations Educational, Scientific and Cultural Organization and
International Atomic Energy Agency
THE ABDUS SALAM INTERNATIONAL CENTRE FOR THEORETICAL PHYSICS
METABOLIC CHANGES UNDERLYING BOLD SIGNAL VARIATIONS AFTER ADMINISTRATION OF ZOLPIDEM
Rafael Rodriguez-Rojas1 International Center for Neurological Restoration, Havana, Cuba
and The Abdus Salam International Centre for Theoretical Physics, Trieste, Italy,
Calixto Machado
Institute of Neurology and Neurosurgery, Havana, Cuba
Lázaro Álvarez, Maylen Carballo International Center for Neurological Restoration, Havana, Cuba
Jesus Perez-Nellar
Hermanos Ameijeras Hospital, Havana, Cuba,
Mario Estevez Institute of Neurology and Neurosurgery, Havana, Cuba,
Nancy Pavon
International Center for Neurological Restoration, Havana, Cuba
and
Mauricio Chinchilla Hermanos Ameijeras Hospital, Havana, Cuba.
MIRAMARE — TRIESTE
December 2010
1 Corresponding author. [email protected]

1
Abstract
Zolpidem is a non-benzodiazepine drug belonging to the imidazopiridine class, which has selectivity for stimulating the effect of gamma aminobutyric acid [GABA] and is used for the therapy of insomnia. Nonetheless, several reports have been published over recent years about a paradoxical arousing effect of Zolpidem in patients with severe brain damage. We studied a PVS case using 1H-MRS and BOLD signal, before and after Zolpidem administration. Significantly increased BOLD signal was localized in left frontal superior cortex, bilateral cingulated areas, left thalamus and right head of the caudate nucleus. A transient activation was observed in frontal cortex, comprising portions of anterior cingulate, medial, and orbito-frontal cortices. Additionally, significant pharmacological activation in sensory-motor cortex is observed 1 hour after Zolpidem intake. Significant linear correlations of BOLD signal changes were found with primary concentrations of NAA, Glx and Lac in the right frontal cortex. We discussed that when Zolpidem attaches to the modified GABA receptors of the neurodormant cells, dormancy is switched off, inducing brain activation. This might explain the significant correlations of BOLD signal changes and 1H-MRS metabolites in our patient. We concluded that 1H-MRS and BOLD signal assessment might contribute to study neurovascular coupling in PVS cases after Zolpidem administration. Although this is a report of a single case, considering our results we recommend to apply this methodology in series of PVS and MCS patients.

2
INTRODUCTION
Patients in a persistent vegetative state (PVS) are awake but are apparently unaware of
themselves or their environment. The diagnosis of PVS has been made more difficult by
recognition of the minimally conscious state (MCS) as a transitional phase in the partial
recovery of self-awareness or environmental awareness as a patient emerges from PVS, leading
to a relative high proportion of diagnostic errors.[1,2]
Zolpidem is a non-benzodiazepine drug belonging to the imidazopiridine class, which has
selectivity for stimulating the effect of gamma aminobutyric acid (GABA) and is used for the
therapy of insomnia.[3] Nonetheless, several reports have been published over recent years
about a paradoxical “arousing” effect of Zolpidem in patients with severe brain damage.[4-7]
Clauss et al., first reported Zolpidem use in brain injury in 2000 after an accidental prescription
in a PVS case causing the patient to wake up and to speak to relatives within 15 minutes of
receiving Zolpidem, the effect lasting for 3 hours.[8]
Functional neuroimaging has provided new insights for assessing cerebral function in PVS
and MCS.[9] Improved perfusion in brain areas of hypoactivity, and at other brain sites such as
physiologically suppressed cerebellum [cerebellar diaschisis], has been reported after
Zolpidem[10]. Other case reports have been published in blepharospasm [11], Parkinson's
disease,[12] spinocerebellar ataxia,[4], postanoxic spasticity,[13,14], and aphasia after stroke
where SPECT imaging showed a 40% increase in cerebral blood flow (CBF) in affected
areas.[15] Changes on 99mTc HMPAO Brain SPECT after Zolpidem are often accompanied by
clinical improvement in severe brain damaged patients, such as awakening, release from brain
injury symptoms and in sleep anomaly.[3,5,12,13,16] In summary, there is some evidence about
the potential effect of Zolpidem to repeal metabolic, hemodinamic and electrical abnormal
activity in severe brain injury.[3,17]
Advanced magnetic resonance methods, such as functional magnetic resonance imaging
[fMRI] and proton magnetic resonance spectroscopy (1H-MRS), have shown to be powerful
tools to assess residual brain activity and outcome prediction in severe brain damaged
patients.[18] fMRI and 1H-MRS provide complementary information for investigating the
human brain metabolism. fMRI based on blood oxygen level-dependent (BOLD) signal is
related to a variety of physiological parameters as well as CBF. The magnitude of the BOLD
change, due to elevated neuronal activity, is determined by decreased susceptibility effects
resulting from the local increase in oxygenated haemoglobin.[19]
Localised 1H-MRS has been used to monitor metabolic changes associated with several
brain pathologies.[20] In PVS and MCS cases, 1H-MRS has evidenced both local and diffuse
biochemical impairment by quantifying several neurometabolites.[21] The potential of 1H-MRS
to provide specific brain metabolic information endorses its use for explaining the relative
contribution of extravascular compartments to BOLD signal dynamics. [20, 21]

3
We studied a PVS case using 1H-MRS and BOLD signal, according to our previous
hypothesis that local changes in neurometabolites levels contribute to CBF increment,
providing an index of neurovascular coupling after Zolpidem administration.
METHODS
Patient
We studied a 21 years old female patient (YOR), who suffered a stroke causing a top of the
basilar artery syndrome, and who had been in PVS for 5 years. Previous MRI showed
destruction of the rostral part of the pons, the mesencephalon, and both thalami. YOR showed
circadian wakefulness, although she maintained longer periods of time with her eyes closed.
With informed written consent of her parents, 10 mg of Zolpidem were administered through a
percutaneous endoscopic gastrostomy. Ethical approval was obtained prior to data collection
from the Institute of Neurology and Neurosurgery Ethics Committee. Throughout the session,
clinical and physiological parameters were controlled.
Data collection.
Magnetic resonance data were collected on a Magnetom Symphony 1.5 Tesla MR system
(Siemens, Earlangen, Germany), using a standard head coil for radio frequency transmission
and signal reception. The patient remained in the same spatial location inside the scanner during
the whole MRI study. The head was padded with foam to minimize head movement. For co-
registration with functional images, a 3D whole-head MPRAGE image was collected.
Furthermore, T2-weighted images in axial and coronal orientations were acquired to aid co-
registration of the MRS voxel.
Functional image acquisition protocol involved six blocks of MRS and fMRI, with total
duration of 10 min per block. The first images block acquisition started 10 min before Zolpidem
administration. Five consecutive blocks were acquired after Zolpidem administration at +10,
+25, +40, +55 and +70 minutes [for clarification of study timeline, see Figure 1].
BOLD sensitive functional images were acquired using an interleaved ascending EPI
sequence, consisting of 36 axial slices with no interslice gap. Each run comprised 60 T2-
weighted volumes, resulting in a total of 360 functional volumes.
In vivo 1H-MRS spectra were acquired after manual shim adjustment by using a spin-echo
single-voxel (SVS_SE) sequence, combined with the water suppression technique. Localization
of the volume of interest (VOI = 2.0 cm3) in the right frontal cortex was decided based on a
previous EEG study of patient YOR, showing brain activation in that region after Zolpidem
administration, in temporal concordance with autonomic and behavioral changes (Machado C.
et al., in preparation). Details of acquisition sequences and parameters are available in Table 1.

4
Data processing and analysis
fMRI data were pre-processed and analysed using the SPM5 package (from the Wellcome
Department of Cognitive Neurology, London, UK) running in Matlab 7.4 (Mathworks Inc.,
Sherborne, MA). Functional EPI images were spatially realigned using a least squares approach
and a 6 parameter (rigid body) spatial transformation. Further pre-processing included spatial
resampling at an isotropic voxel size (1mm×1mm×1mm) and slice-timing and spatial smoothing
with an isotropic 8-mm full-width-at-half-maximum Gaussian kernel.
In the present report, the pre-medication fMRI run is considered as baseline and the term
activation is used to represent the transient signal increase after Zolpidem administration.
Student’s t-tests were conducted at each voxel to detect Zolpidem-induced changes in BOLD
time courses on each time point versus the baseline. Condition-specific effects were estimated
using conventional statistical parametric mapping analysis. The resulting activation maps were
checked subsequently for plausibility. All areas reaching significance on cluster level, with
thresholds at a family-wise error (FWE) corrected probability of 0.05, will be reported. To
further eliminate random noise, cluster filtering [cluster size >10 contiguous pixels] was applied
to produce final statistical parametric maps (SPMs) of t deviates SPM(t), subsequently
normalized to SPM(Z).
The intensities of 1H-MRS metabolites were estimated using the automated spectral fitting
routine available in the commercial software Syngo MR A30 (Siemens, Erlangen, Germany)
that included baseline correction. Prior to 2D Fourier transformation, the k-space imaging data
were spatially smoothed with Hamming filtering (half width = 300 ms) to improve signal to
noise ratio.
Metabolite concentrations were calculated for N-acetylaspartate (NAA), Glutamate /
Glutamine (Glx), choline-containing compounds (Cho), creatine / phosphocreatine (Cr), myo-
inositol (Ins) and lactate (Lac). Glutamatergic concentration was estimated from the combined
signal of three resonance peaks. Metabolite concentration ratios were additionally calculated,
using the sum of the Cr and phosphocreatine integrals as denominators.
The fMRI time series data were obtained from a cubic volume of interest (VOI) centred on
the activation cluster in the right frontal cortex (Figure 2). For comparison with metabolites time
spectra, the VOI mean signal intensity for each time point was calculated by averaging the time
courses of all voxel in this VOI during the entire run [60 images]. Square Pearson product
moment correlations were used to quantify relationships between Zolpidem-induced changes in
BOLD signal and both primary and normalized metabolite levels.

5
RESULTS
BOLD changes
fMRI analysis revealed multiple areas of Zolpidem-induced activations. Figure 2 shows
SPM(t) at the five conditions, with threshold at a t-value of 4.69 and superimposed on axial and
sagittal high resolution anatomical slices. Significantly increased BOLD signal at P<0.01, FWE
corrected for multiple comparisons, were localized in left frontal superior cortex, bilateral
cingulated areas, left thalamus and right head of the caudate nucleus. All these findings were
consistently reproducible throughout all conditions. A transient activation at P<0.05, FWE
corrected, is observed in frontal cortex, comprising portions of anterior cingulate, medial, and
orbitofrontal cortices. Additionally, significant pharmacological activation in sensory-motor
cortex is observed 1 hour after Zolpidem intake. Table 2 presents the activated brain regions,
showing the significant activation for each condition and the maximum Z score.
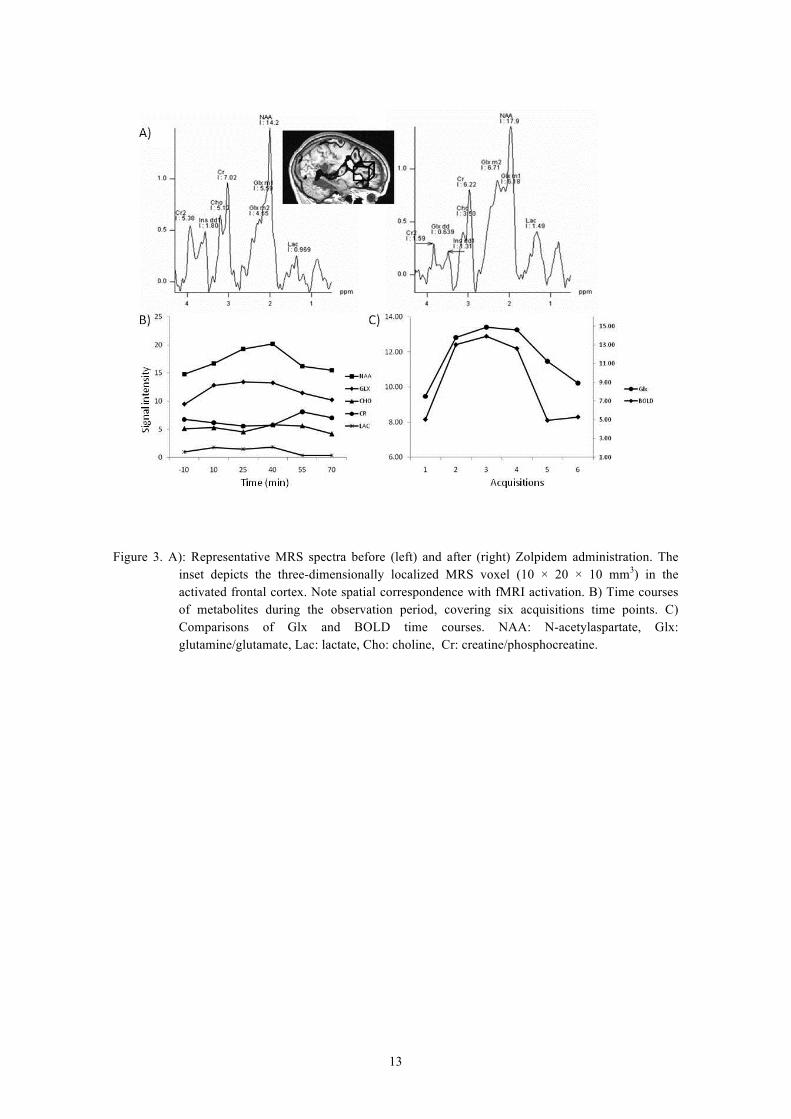
1H-MRS Changes
Spectra were highly reproducible throughout the whole study. Information about resonance
peaks is presented in Table 3. After 25 minutes of Zolpidem administration, NAA
concentrations progressively augmented until 55 minutes, when concentrations of this
metabolite began to gradually decrease. Glx and Lac concentrations showed a tendency to
decrease after 40 minutes.
Coincidence in spatial location of the activated cluster and MRS voxel in right frontal
cortex is shown in Figure 3. Time dependent behaviour of BOLD time course and metabolites
concentrations were compared. Significant linear correlations (p<0.05) of BOLD signal changes
were found with primary concentrations of NAA, Glx and Lac (Table 4). When BOLD
amplitude change was compared with metabolite concentration ratios relative to Cr, no
significant correlations were found.
DISCUSSION
After brain injury, an increment of excitatory and inhibitory neurotransmitters occurs,
mostly glutamate and GABA.[3,17] Although Glutamate’s excitatory action induces apoptosis
in brain cells to absorb toxic metabolites, GABA’s inhibitory effect predominates, suppressing
cellular metabolism, which protects cells from unfavorable environment, leading to loss of
consciousness. After some time GABA content diminishes due to increased usage and runs off
from the brain into the blood. As GABA cannot be restored sufficiently in some brain regions, a
secondary protective response is triggered, which converts GABA receptors hypersensitive, so
that decreased levels of this neurotransmitter can preserve their suppressive effect, and uphold a
trend of synchronized slow wave activity in the brain, termed neurodormant state.[17,22,23]
Dormancy or hibernation of myocardium after an ischemic insult has been described in
6
cardiology,[24] and hence when applied to the brain is recognized as
neurodormancy.[3,7,10,25-30]
When Zolpidem attaches to the modified GABA receptors of the neurodormant cells, the
receptor structure is deformed and abnormal cell metabolism ceases, and hence dormancy is
switched off. If dormancy involves large or important functional areas, clinical changes related
to brain activation after Zolpidem administration can be dramatic. [3,8,10,17,31,32]
We found a significant correlation between transient changes of NAA, Glx and Lac primary
concentration and BOLD signals. As NAA is considered a metabolic marker for neuronal
density and function, the significant correlation of BOLD signal and NAA concentration
increment might be related to dormancy switch-off. A CBF increment has been documented
using 99mTc HMPAO SPECT or 18F FDG PET, indicating that those non-functioning areas
start to function again after Zolpidem.[3,10,33]
At present, a convergent set of data points out that glutamate signaling on astrocytes
provides a mechanism to strongly connect synaptic activity and glucose consumption.[29,34,35]
According to Magistretti, astrocytes form the first cellular barrier encountered by glucose
entering the brain parenchyma.[34] This metabolic pathway, often referred to as the astrocyte-
neuron-lactate shuttle, is a clear example of cooperation between astrocytes and neurons. The
basic mechanism in neurometabolic coupling is the glutamate stimulated aerobic glycolysis in
astrocytes, which results in the release of lactate from astrocytes. [34,36-40] This could
explicate a strengthening of brain activation in those areas previously governed by
neurodormancy, [17,22] and it might also explain the strong correlation between Glx and BOLD
signal after Zolpidem administration in our patient.
Clark et al. recently hypothesized that the abundant NAA in neuronal tissue can also serve
as a large pool for replenishing Glx in periods of speedy or dynamic signaling demands and
stress, helping to provide adequate levels of this metabolite.[40]
The initial GABA effect when CBF has not augmented yet after Zolpidem uptake could be
explained by recent reports indicating that GABA does not couple inhibitory neuronal activity
with glucose utilization, as does glutamate for excitatory neurotransmission, and suggests that
GABA-mediated synaptic transmission does not contribute directly to brain imaging signals
based on deoxyglucose.[41]
Another interesting result to discuss is the significant correlation we found between
transient changes in Lac and BOLD signals. This might be also explained considering the
metabolic pathway known as the astrocyte-neuron-lactate shuttle. As it was previously argued
Glx stimulates aerobic glycolysis in astrocytes by a mechanism involving an activation of the
Na+-K+ ATPase. This process results in a transient Lac overproduction, which is released from
astrocytes to the extracellular space, followed by a recoupling phase during which time Lac
would be oxidized by neurons into pyruvate and enters the tricarboxylic acid [TCA] cycle to

7
serve as an energy fuel.[34,36,37,39,42,43] 1H-MRS in humans has demonstrated a transitory
Lac peak in primary visual cortex, during physiologic activation of the visual system.[44] It has
been discussed that the spatiotemporal window during a Lac peak which could be discriminated
by 1H-MRS would depend on the promptness and level of recoupling existing between
astrocytic glycolysis and neuronal oxidative phosphorylation.[34]
When BOLD amplitude change was compared with metabolite concentration ratios relative
to Cr, no significant correlations were found. The rationale for normalization is based on the
concept that Cr is in chemical equilibrium, and that its regional concentration is not affected by
neurodegenerative processes. However, Cr is roughly considered as a marker of energy
metabolism and its metabolite resonance may be affected by BOLD changes in localized 1H-
MRS.[21,45]. In fact, in our case, Cr concentration varied in the same period when NAA
augmented after Zolpidem intake.
We conclude that 1H-MRS and BOLD signal assessment might contribute to study
neurovascular coupling in PVS cases after Zolpidem administration. Although this is a report of
a single case, considering our results we recommend to apply this methodology in series of PVS
and MCS patients.
Acknowledgments
This work was supported by the International Center for Neurological Restoration and the
Institute of Neurology and Neurosurgery, Havana. RRR was supported by the Associateship
Scheme of The Abdus Salam International Centre for Theoretical Physics, Trieste, Italy. The
authors also wish to acknowledge the assistance of Maria Luisa Rodriguez in manuscript
preparation.
REFERENCES
[1] Monti MM, Laureys S, Owen AM, The vegetative state. BMJ,341:c3765. 2010.
[2] Machado C, Brain death. A reappraisal. New York: Springer, 2007.
[3] Nyakale NE, Clauss RP, Nel W, Sathekge M, Clinical and brain SPECT scan response to zolpidem in patients after brain damage. Arzneimittelforschung, 60:177-81, 2010.
[4] Clauss R, Sathekge M, Nel W, Transient improvement of spinocerebellar ataxia with zolpidem. N Engl J Med, 351:511-2, 2004.
[5] Singh R, McDonald C, Dawson K, Lewis S, Pringle AM, Smith S, et al., Zolpidem in a minimally conscious state, Brain Inj, 22:103-6, 2008.
[6] Staner C, Joly F, Jacquot N, Vlasova ID, Nehlin M, Lundqvist T, et al., Sublingual zolpidem in early onset of sleep compared to oral zolpidem: polysomnographic study in patients with primary insomnia, Curr Med Res Opin, 26:1423-31, 2010.
[7] Whyte J, Myers R. Incidence of clinically significant responses to zolpidem among patients with disorders of consciousness: a preliminary placebo controlled trial, Am J Phys Med Rehabil, 88:410-8, 2009.

8
[8] Clauss RP, van der Merwe CE, Nel HW, Arousal from a semi-comatose state on zolpidem. S Afr Med J, 91:788-9, 2001.
[9] Owen AM, Coleman MR, Functional neuroimaging of the vegetative state, Nat Rev Neurosci, 3:235-43, 2008.
[10] Clauss RP, Nel WH, Effect of zolpidem on brain injury and diaschisis as detected by 99mTc HMPAO brain SPECT in humans, Arzneimittelforschung, 54:641-6, 2004.
[11] Garretto NS, Bueri JA, Rey RD, Arakaki T, Nano GV, Mancuso M, Improvement of blepharospasm with Zolpidem, Mov Disord, 19:967-8, 2004
[12] Chen YY, Sy HN, Wu SL, Zolpidem improves akinesia, dystonia and dyskinesia in advanced Parkinson's disease, J Clin Neurosci, 15:955-6, 2008.
[13] Damm J, Eser D, Moeller HJ, Rupprecht R. Severe dependency on zolpidem in a patient with multiple sclerosis suffering from paraspasticity, World J Biol Psychiatry 2:516-8, 2010.
[14] Shadan FF, Poceta JS, Kline LE, Zolpidem for postanoxic spasticity, South Med J, 8:791-2, 2004.
[15] Cohen L, Chaaban B, Habert MO, Transient improvement of aphasia with zolpidem, N Engl J Med, 350:949-50, 2004..
[16] Hoque R, Chesson AL, Jr, Zolpidem-induced sleepwalking, sleep related eating disorder, and sleep-driving: fluorine-18-flourodeoxyglucose positron emission tomography analysis, and a literature review of other unexpected clinical effects of zolpidem, J Clin Sleep Med, 15:471-6, 2009.
[17] Clauss RP. Neurotransmitters in coma, vegetative and minimally conscious states, pharmacological interventions, Med Hypotheses doi:10.1016/j.mehy.2010.03.005.
[18] Coleman MR, Davis MH, Rodd JM, Robson T, Ali A, Owen AM, et al., Towards the routine use of brain imaging to aid the clinical diagnosis of disorders of consciousness, Brain,132:2541-52, 2009.
[19] Ances BM, Leontiev O, Perthen JE, Liang C, Lansing AE, Buxton RB. Regional differences in the coupling of cerebral blood flow and oxygen metabolism changes in response to activation: implications for BOLD-fMRI, Neuroimage, 39:1510-21, 2008.
[20] Lee SK, Kim J, Kim HD, Lee JS, Lee YM. Initial experiences with proton MR spectroscopy in treatment monitoring of mitochondrial encephalopathy, Yonsei Med J, 51:672-5, 2010.
[21] Machado C, Rodriguez R, Carballo M, Perez J, Korein J, Results of proton MRS studies in PVS and MCS patients, Can J Neurol Sci, 36:365-9, 2009.
[22] Clauss R, Nel W. Drug induced arousal from the permanent vegetative state, NeuroRehabilitation 2006,21[1]:23-8.
[23] Clauss RP, Dormehl IC, Oliver DW, Nel WH, Kilian E, Louw WK. Measurement of cerebral perfusion after zolpidem administration in the baboon model, Arzneimittelforschung, 51:619-22, 2001.
[24] Tomita Y, Matsumura K, Wakamatsu Y, Matsuzaki Y, Shibuya I, Kawaguchi H, et al., Cardiac neural crest cells contribute to the dormant multipotent stem cell in the mammalian heart, J Cell Biol, 170:1135-46, 2005.
[25] Pistoia F, Mura E, Govoni S, Fini M, Sara M, Awakenings and awareness recovery in disorders of consciousness: is there a role for drugs?, CNS Drugs, 24:625-38, 2010.
[26] Cohen SI, Duong TT, Increased arousal in a patient with anoxic brain injury after administration of zolpidem, Am J Phys Med Rehabil, 87:229-31, 2008.
9
[27] Wang WT, Chen YY, Wu SL, Wei TS, Liu SY. Zolpidem dramatically improved motor and speech function in a patient with central pontine myelinolysis, Eur J Neurol, 14:e9-10, 2007.
[28] Brefel-Courbon C, Payoux P, Ory F, Sommet A, Slaoui T, Raboyeau G, et al., Clinical and imaging evidence of zolpidem effect in hypoxic encephalopathy, Ann Neurol, 62:102-5, 2007.
[29] Hawkins RA. The blood-brain barrier and glutamate, Am J Clin Nutr, 90:867S-74S, 2009.
[30] Hawkins RA, O'Kane RL, Simpson IA, Vina JR. Structure of the blood-brain barrier and its role in the transport of amino acids, J Nutr, 136:218S-26S, 2006.
[31] Thomas P, Rascle C, Mastain B, Maron M, Vaiva G, Test for catatonia with zolpidem, Lancet 349:792, 1997.
[32] Hall SD, Yamawaki N, Fisher AE, Clauss RP, Woodhall GL, Stanford IM. GABA[A] alpha-1 subunit mediated desynchronization of elevated low frequency oscillations alleviates specific dysfunction in stroke--a case report, Clin Neurophysiol 121:549-55, 2010.
[33] Finelli LA, Landolt HP, Buck A, Roth C, Berthold T, Borbely AA, et al. Functional neuroanatomy of human sleep states after zolpidem and placebo: a H215O-PET study, J Sleep Res, 9:161-73, 2000.
[34] Magistretti PJ. Role of glutamate in neuron-glia metabolic coupling, Am J Clin Nutr 903:875S-80S, 2009.
[35] Norup NA, Lauritzen M. Coupling and uncoupling of activity-dependent increases of neuronal activity and blood flow in rat somatosensory cortex, J Physiol, 533:773-85, 2001,
[36] Magistretti PJ. Neuroscience. Low-cost travel in neurons., Science, 325:1349-51, 2009.
[37] Pellerin L, Bouzier-Sore AK, Aubert A, Serres S, Merle M, Costalat R, et al., Activity-dependent regulation of energy metabolism by astrocytes: an update, Glia, 55:1251-62, 2007.
[38] Magistretti PJ. Neuron-glia metabolic coupling and plasticity, J Exp Biol, 209:2304-11, 2006.
[39] Bernardinelli Y, Magistretti PJ, Chatton JY. Astrocytes generate Na+-mediated metabolic waves, Proc Natl Acad Sci U S A, 101:14937-42, 2004.
[40] Clark JF, Doepke A, Filosa JA, Wardle RL, Lu A, Meeker TJ, et al. N-acetylaspartate as a reservoir for glutamate, Med Hypotheses, 67:506-12, 2006.
[41] Chatton JY, Pellerin L, Magistretti PJ, GABA uptake into astrocytes is not associated with significant metabolic cost: implications for brain imaging of inhibitory transmission, Proc Natl Acad Sci U S A, 100:12456-61, 2003.
[42] Magistretti PJ, Chatton JY. Relationship between L-glutamate-regulated intracellular Na+ dynamics and ATP hydrolysis in astrocytes, J Neural Transm, 112:77-85, 2005.
[43] Bouzier-Sore AK, Voisin P, Canioni P, Magistretti PJ, Pellerin L, Lactate is a preferential oxidative energy substrate over glucose for neurons in culture, J Cereb Blood Flow Metab 23:1298-306, 2003.
[44] Prichard J, Rothman D, Novotny E, Petroff O, Kuwabara T, Avison M, et al., Lactate rise detected by 1H NMR in human visual cortex during physiologic stimulation, Proc Natl Acad Sci U S A, 88:5829-31, 1991.
[45] Sonnewald U, Gribbestad IS, Westergaard N, Nilsen G, Unsgard G, Schousboe A, et al. Nuclear magnetic resonance spectroscopy: biochemical evaluation of brain function in vivo and in vitro. Neurotoxicology, 15:579-90, 1994.

10
Table 1. Detailed parameters of MRI acquisition sequences.
Sequence TE (ms) TR (ms) Matrix size In-plane resolution (mm2)
Slice thickness (mm)
Slices
3D MPRAGE 1.33 14 256 x 256 1.0 x 1.0 1.0 160
T2 99 6220 256 x 256 0.5 x 0.5 2.0 30
EPI 50 3000 256 x 256 3.0 x 3.0 4.0 36
SVS_SE 30 5000 – 10 x 20 10 –
Table 2. Regions with Zolpidem – induced activations, normalized Z – values and significance levels
S1>S0 S2>S0 S3>S0 S4>S0 S5>S0
Z-value P-value Z-value P-value Z-value P-value Z-value P-value Z-value P-value
Frontal cortex L 4.59 0.054 4.74 0.028 4.99 <0.001 4.70 0.034 4.29 0.169
Frontal superior L 5.28 0.002 5.17 0.004 5.73 <0.001 5.10 0.006 3.94 0.483
Cingulate area L 6.07 <0.001 5.67 <0.001 5.86 <0.001 5.67 <0.001 4.83 0.019
Cingulate area R 6.89 <0.001 7.11 <0.001 6.11 <0.001 5.62 <0.001 5.19 0.004
Thalamus L 5.35 0.002 5.13 0.005 4.99 0.009 4.74 <0.001 4.34 0.140
Caudate R 6.86 <0.001 6.76 <0.001 5.67 <0.001 4.69 <0.001 5.03 0.008
Sensory-motor area 3.02 1.000 3.10 0.998 3.89 <0.001 4.97 0.011 4.35 0.133
P-values are corrected for family-wise error at the whole brain level. Sn indicates time point, where S0 correspond to baseline.

11
Table 3. Metabolites of interest. Resonance peaks correspond to the maximum intensity of the correspondent metabolite.
Metabolites Abbreviation Resonance peaks (ppm)
N-acetylaspartate NAA 2.02
Glutamate + Glutamine Glx 2.14, 2.36 and 2.46
Choline-containing compounds Cho 3.22
Creatine + phosphocreatine Cr 3.03
Myo-inositol Ins 3.54
Lactate Lac 1.33
Table 4. Correlations of variation in metabolites concentrations with BOLD signal changes.
Metabolite R p
N-acetyl aspartate (NAA) 0.848 0.03
Creatine + phosphocreatine (Cr) -0. 368 0.64
Choline (Cho) 0.117 0.82
Mioinositol (Ins) -0.520 0.29
Glutamate + Glutamine (Glx) 0.913 0.01
Lactate (Lac) 0.905 0.01
R: Pearson product moment correlation coefficient

12
Figure 1. Scanning session time line. After a T1-weighted high resolution and a baseline acquisition block, patient received an acute dose of Zolpidem (10 mg). During the next 80 minutes, six consecutive blocks of single voxel 1H-MRS and BOLD-fMRI were conducted.
Figure 2. Statistically thresholded Zolpidem-induced BOLD activation in four time points, rendered on the patient’sT1-weighted axial and sagittal views. Results are thresholded for display at whole brain family wise error corrected (P<0.05). Colour scale represents t-values.
13
Figure 3. A): Representative MRS spectra before (left) and after (right) Zolpidem administration. The inset depicts the three-dimensionally localized MRS voxel (10 × 20 × 10 mm3) in the activated frontal cortex. Note spatial correspondence with fMRI activation. B) Time courses of metabolites during the observation period, covering six acquisitions time points. C) Comparisons of Glx and BOLD time courses. NAA: N-acetylaspartate, Glx: glutamine/glutamate, Lac: lactate, Cho: choline, Cr: creatine/phosphocreatine.