ibm tivoli network manager ip edition: network ... · about network troubleshooting ... monitoring...
TRANSCRIPT

Network Manager IP EditionVersion 3 Release 9
Network Troubleshooting Guide
R2E2
IBM


Network Manager IP EditionVersion 3 Release 9
Network Troubleshooting Guide
R2E2
IBM

NoteBefore using this information and the product it supports, read the information in “Notices” on page 105.
This edition applies to version 3.9 of IBM Tivoli Network Manager IP Edition (product number 5724-S45) and to allsubsequent releases and modifications until otherwise indicated in new editions.
© Copyright IBM Corporation 2006, 2016.US Government Users Restricted Rights – Use, duplication or disclosure restricted by GSA ADP Schedule Contractwith IBM Corp.

Contents
About this publication . . . . . . . . vIntended audience . . . . . . . . . . . . vWhat this publication contains . . . . . . . . vPublications . . . . . . . . . . . . . . viAccessibility . . . . . . . . . . . . . . ixTivoli technical training . . . . . . . . . . ixSupport information . . . . . . . . . . . . xConventions used in this publication . . . . . . x
Chapter 1. About networktroubleshooting . . . . . . . . . . . 1About network views and the Network Hop View. . 1
Network Hop View . . . . . . . . . . . 1Network views . . . . . . . . . . . . 2Network domains . . . . . . . . . . . 3Device connectivity . . . . . . . . . . . 3Network map and tree icons and symbols . . . 4Default network view nodes . . . . . . . . 5
About events . . . . . . . . . . . . . . 7Default event status icons . . . . . . . . . 8
About the Structure Browser . . . . . . . . . 9
Chapter 2. Finding network devices . . 13Searching for devices using the Network Hop View 13
Using the basic search . . . . . . . . . . 13Using the advanced search . . . . . . . . 14
Browsing the network using the Network Views . . 16Searching for devices within a view . . . . . . 16
Finding Cisco devices in the current view . . . 17Finding Ethernet interfaces in the current view 17
Searching for a network view . . . . . . . . 18Visualizing devices in tabular layout . . . . . . 18
Switching to tabular layout . . . . . . . . 19Filtering devices in tabular layout . . . . . . 21
Using entity smart search. . . . . . . . . . 22Performing an entity smart search across alldomains . . . . . . . . . . . . . . 22Performing an entity smart search across acustom NCIM database table . . . . . . . 24
Chapter 3. Identifying networkproblems. . . . . . . . . . . . . . 27Identifying problems using network views . . . . 27
Using the Network Health View . . . . . . 27Monitoring subnets . . . . . . . . . . . 28Monitoring device classes. . . . . . . . . 28Monitoring links. . . . . . . . . . . . 29Monitoring Border Gateway Protocol (BGP)networks . . . . . . . . . . . . . . 30Monitoring Open Shortest Path First (OSPF)routing domains . . . . . . . . . . . . 30Monitoring multicast groups and routes . . . . 31Monitoring MPLS Traffic Engineered tunnels . . 32Monitoring VPLS VPNs . . . . . . . . . 32
Monitoring aggregated network domains . . . 32Identifying problems using event lists . . . . . 33
Chapter 4. Diagnosing networkproblems. . . . . . . . . . . . . . 35Investigating faulty devices . . . . . . . . . 35
Displaying related events . . . . . . . . . 35Displaying a Network Hop View related to anetwork view. . . . . . . . . . . . . 36Displaying network views related to a NetworkHop View . . . . . . . . . . . . . . 37
Investigating events . . . . . . . . . . . 37Displaying related topology views. . . . . . 37Investigating root cause . . . . . . . . . 39Investigating service-affected events . . . . . 41Retrieving related MIB information . . . . . 42View the structure of the network device relatedto an event . . . . . . . . . . . . . 43
Investigating network connections . . . . . . . 43Showing device connectivity. . . . . . . . 43Tracing the route to devices . . . . . . . . 44Visualizing a network path . . . . . . . . 49Pinging devices and subnets. . . . . . . . 53Retrieving Cisco and Juniper route information 59Setting up login credentials . . . . . . . . 63
Retrieving device information . . . . . . . . 64Logging into a device . . . . . . . . . . 64Querying domain registration information . . . 64Retrieving protocol information from Cisco andJuniper devices . . . . . . . . . . . . 67
Investigating the health of device components . . . 74Viewing the structure of a network device . . . 75Identifying faulty components from the StructureBrowser tree . . . . . . . . . . . . . 77Identifying faulty components from the StructureBrowser table . . . . . . . . . . . . . 78Searching the node text in the Structure Browsertree . . . . . . . . . . . . . . . . 80Switching between tree and table mode in theStructure Browser . . . . . . . . . . . 81Showing events for a device or component . . . 81Customizing Structure Browser preferences. . . 82
Showing device connectivity. . . . . . . . . 83Retrieving MIB information . . . . . . . . . 84
About the SNMP MIB Browser . . . . . . . 84Accessing MIB data. . . . . . . . . . . 85Issuing an SNMP MIB query . . . . . . . 86
Graphing MIB variables . . . . . . . . . . 88Configuring MIB graph properties andpreferences . . . . . . . . . . . . . 88Working with the MIB graph . . . . . . . 90
Chapter 5. Supporting problemresolution . . . . . . . . . . . . . 91Creating polls . . . . . . . . . . . . . 91
© Copyright IBM Corp. 2006, 2016 iii

Making devices available for maintenance . . . . 91Unmanaging devices and components . . . . 91Taking devices and components out ofunmanaged state . . . . . . . . . . . 93
Discovering devices again . . . . . . . . . 96The Add node tool . . . . . . . . . . . . 96The Remove node tool. . . . . . . . . . . 97
Chapter 6. Reporting on devices. . . . 99Running reports from the Reports window . . . . 99
Running reports from a network map . . . . . 99
Appendix. Network Manager glossary 101
Notices . . . . . . . . . . . . . . 105Trademarks . . . . . . . . . . . . . . 107
Index . . . . . . . . . . . . . . . 109
iv IBM Tivoli Network Manager IP Edition: Network Troubleshooting Guide
About this publication
IBM Tivoli Network Manager IP Edition provides detailed network discovery,device monitoring, topology visualization, and root cause analysis (RCA)capabilities. Network Manager can be extensively customized and configured tomanage different networks. Network Manager also provides extensive reportingfeatures, and integration with other IBM products, such as IBM Tivoli ApplicationDependency Discovery Manager, IBM Tivoli Business Service Manager and IBMSystems Director.
The IBM Tivoli Network Manager IP Edition Network Troubleshooting Guide describeshow to use Network Manager IP Edition to troubleshoot network problems.
Intended audienceThis publication is intended for network operators who are responsible foridentifying or resolving network problems using IBM Tivoli Network Manager IPEdition.
IBM Tivoli Network Manager IP Edition works in conjunction with IBM TivoliNetcool/OMNIbus; this publication assumes that you understand how IBM TivoliNetcool/OMNIbus works. For more information on IBM Tivoli Netcool/OMNIbus,see the publications described in “Publications” on page vi.
What this publication containsThis publication contains the following sections:v Chapter 1, “About network troubleshooting,” on page 1
Describes the network troubleshooting tools available in Network Manager.v Chapter 2, “Finding network devices,” on page 13
Describes how to search for a specific device using its IP address or host name,or browse for a device in the network views.
v Chapter 3, “Identifying network problems,” on page 27Describes how to use Network Manager to identify network problems.
v Chapter 4, “Diagnosing network problems,” on page 35Describes how to use the network troubleshooting tools available in NetworkManager to diagnose problems with the network.
v Chapter 5, “Supporting problem resolution,” on page 91Describes how to support network problem resolution.
v Chapter 6, “Reporting on devices,” on page 99Describes how to run reports on network devices to check the health of devices,summarize network and device data, visualize Return On Investment and Greeninitiatives, and troubleshoot problems.
© Copyright IBM Corp. 2006, 2016 v

PublicationsThis section lists publications in the Network Manager library and relateddocuments. The section also describes how to access Tivoli publications online andhow to order Tivoli publications.
Your Network Manager library
The following documents are available in the Network Manager library:v IBM Tivoli Network Manager IP Edition Release Notes, GI11-9354-00
Gives important and late-breaking information about IBM Tivoli NetworkManager IP Edition. This publication is for deployers and administrators, andshould be read first.
v IBM Tivoli Network Manager Getting Started Guide, GI11-9353-00Describes how to set up IBM Tivoli Network Manager IP Edition after you haveinstalled the product. This guide describes how to start the product, make sure itis running correctly, and discover the network. Getting a good networkdiscovery is central to using Network Manager IP Edition successfully. Thisguide describes how to configure and monitor a first discovery, verify the resultsof the discovery, configure a production discovery, and how to keep the networktopology up to date. Once you have an up-to-date network topology, this guidedescribes how to make the network topology available to Network Operators,and how to monitor the network. The essential tasks are covered in this shortguide, with references to the more detailed, optional, or advanced tasks andreference material in the rest of the documentation set.
v IBM Tivoli Network Manager IP Edition Product Overview, GC27-2759-00Gives an overview of IBM Tivoli Network Manager IP Edition. It describes theproduct architecture, components and functionality. This publication is foranyone interested in IBM Tivoli Network Manager IP Edition.
v IBM Tivoli Network Manager IP Edition Installation and Configuration Guide,SC27-2760-00Describes how to install IBM Tivoli Network Manager IP Edition. It alsodescribes necessary and optional post-installation configuration tasks. Thispublication is for administrators who need to install and set up IBM TivoliNetwork Manager IP Edition.
v IBM Tivoli Network Manager IP Edition Administration Guide, SC27-2761-00Describes administration tasks for IBM Tivoli Network Manager IP Edition, suchas how to administer processes, query databases and start and stop the product.This publication is for administrators who are responsible for the maintenanceand availability of IBM Tivoli Network Manager IP Edition.
v IBM Tivoli Network Manager IP Edition Discovery Guide, SC27-2762-00Describes how to use IBM Tivoli Network Manager IP Edition to discover yournetwork. This publication is for administrators who are responsible forconfiguring and running network discovery.
v IBM Tivoli Network Manager IP Edition Event Management Guide, SC27-2763-00Describes how to use IBM Tivoli Network Manager IP Edition to poll networkdevices, to configure the enrichment of events from network devices, and tomanage plug-ins to the Tivoli Netcool/OMNIbus Event Gateway, includingconfiguration of the RCA plug-in for root-cause analysis purposes. Thispublication is for administrators who are responsible for configuring andrunning network polling, event enrichment, root-cause analysis, and EventGateway plug-ins.
vi IBM Tivoli Network Manager IP Edition: Network Troubleshooting Guide
v IBM Tivoli Network Manager IP Edition Network Troubleshooting Guide,GC27-2765-00Describes how to use IBM Tivoli Network Manager IP Edition to troubleshootnetwork problems identified by the product. This publication is for networkoperators who are responsible for identifying or resolving network problems.
v IBM Tivoli Network Manager IP Edition Network Visualization Setup Guide,SC27-2764-00Describes how to configure the IBM Tivoli Network Manager IP Edition networkvisualization tools to give your network operators a customized workingenvironment. This publication is for product administrators or team leaders whoare responsible for facilitating the work of network operators.
v IBM Tivoli Network Manager IP Edition Management Database Reference,SC27-2767-00Describes the schemas of the component databases in IBM Tivoli NetworkManager IP Edition. This publication is for advanced users who need to querythe component databases directly.
v IBM Tivoli Network Manager IP Edition Topology Database Reference, SC27-2766-00Describes the schemas of the database used for storing topology data in IBMTivoli Network Manager IP Edition. This publication is for advanced users whoneed to query the topology database directly.
v IBM Tivoli Network Manager IP Edition Language Reference, SC27-2768-00Describes the system languages used by IBM Tivoli Network Manager IPEdition, such as the Stitcher language, and the Object Query Language. Thispublication is for advanced users who need to customize the operation of IBMTivoli Network Manager IP Edition.
v IBM Tivoli Network Manager IP Edition Perl API Guide, SC27-2769-00Describes the Perl modules that allow developers to write custom applicationsthat interact with the IBM Tivoli Network Manager IP Edition. Examples ofcustom applications that developers can write include Polling and DiscoveryAgents. This publication is for advanced Perl developers who need to write suchcustom applications.
v IBM Tivoli Monitoring for Tivoli Network Manager IP User's Guide, SC27-2770-00Provides information about installing and using IBM Tivoli Monitoring for IBMTivoli Network Manager IP Edition. This publication is for systemadministrators who install and use IBM Tivoli Monitoring for IBM TivoliNetwork Manager IP Edition to monitor and manage IBM Tivoli NetworkManager IP Edition resources.
Prerequisite publications
To use the information in this publication effectively, you must have someprerequisite knowledge, which you can obtain from the following publications:v IBM Tivoli Netcool/OMNIbus Installation and Deployment Guide, SC23-9680
Includes installation and upgrade procedures for Tivoli Netcool/OMNIbus, anddescribes how to configure security and component communications. Thepublication also includes examples of Tivoli Netcool/OMNIbus architectures anddescribes how to implement them.
v IBM Tivoli Netcool/OMNIbus User's Guide, SC23-9683Provides an overview of the desktop tools and describes the operator tasksrelated to event management using these tools.
v IBM Tivoli Netcool/OMNIbus Administration Guide, SC23-9681
About this publication vii
Describes how to perform administrative tasks using the TivoliNetcool/OMNIbus Administrator GUI, command-line tools, and process control.The publication also contains descriptions and examples of ObjectServer SQLsyntax and automations.
v IBM Tivoli Netcool/OMNIbus Probe and Gateway Guide, SC23-9684Contains introductory and reference information about probes and gateways,including probe rules file syntax and gateway commands.
v IBM Tivoli Netcool/OMNIbus Web GUI Administration and User's Guide SC23-9682Describes how to perform administrative and event visualization tasks using theTivoli Netcool/OMNIbus Web GUI.
Accessing terminology online
The IBM Terminology Web site consolidates the terminology from IBM productlibraries in one convenient location. You can access the Terminology Web site at thefollowing Web address:
http://www.ibm.com/software/globalization/terminology
Accessing publications online
IBM posts publications for this and all other Tivoli products, as they becomeavailable and whenever they are updated, to the IBM Knowledge Center Web siteat:
http://www-01.ibm.com/support/knowledgecenter/
Network Manager documentation is located under the Cloud & SmarterInfrastructure node on that Web site.
Note: If you print PDF documents on other than letter-sized paper, set the optionin the File > Print window that allows your PDF reading application to printletter-sized pages on your local paper.
Ordering publications
You can order many Tivoli publications online at the following Web site:
http://www.elink.ibmlink.ibm.com/publications/servlet/pbi.wss
You can also order by telephone by calling one of these numbers:v In the United States: 800-879-2755v In Canada: 800-426-4968
In other countries, contact your software account representative to order Tivolipublications. To locate the telephone number of your local representative, performthe following steps:1. Go to the following Web site:
http://www.elink.ibmlink.ibm.com/publications/servlet/pbi.wss2. Select your country from the list and click Go. The Welcome to the IBM
Publications Center page is displayed for your country.3. On the left side of the page, click About this site to see an information page
that includes the telephone number of your local representative.
viii IBM Tivoli Network Manager IP Edition: Network Troubleshooting Guide

AccessibilityAccessibility features help users with a physical disability, such as restrictedmobility or limited vision, to use software products successfully.
Accessibility features
The following list includes the major accessibility features in Network Manager:v The console-based installer supports keyboard-only operation.v The console-based installer supports screen reader use.v Network Manager provides the following features suitable for low vision users:
– All non-text content used in the GUI has associated alternative text.– Low-vision users can adjust the system display settings, including high
contrast mode, and can control the font sizes using the browser settings.– Color is not used as the only visual means of conveying information,
indicating an action, prompting a response, or distinguishing a visualelement.
v Network Manager provides the following features suitable for photosensitiveepileptic users:– Web pages do not contain anything that flashes more than two times in any
one second period.
The accessibility of the Network Manager Knowledge Center is described in theKnowledge Center itself.
Extra steps to configure Internet Explorer for accessibility
If you are using Internet Explorer as your web browser, you might need toperform extra configuration steps to enable accessibility features.
To enable high contrast mode, complete the following steps:1. Click Tools > Internet Options > Accessibility.2. Select all the check boxes in the Formatting section.
If clicking View > Text Size > Largest does not increase the font size, click Ctrl +and Ctrl -.
IBM® and accessibility
See the IBM Human Ability and Accessibility Center for more information aboutthe commitment that IBM has to accessibility.
Tivoli® technical training
For Tivoli technical training information, refer to the following IBM TivoliEducation Web site:
http://www.ibm.com/software/tivoli/education
About this publication ix
Support informationIf you have a problem with your IBM software, you want to resolve it quickly. IBMprovides the following ways for you to obtain the support you need:
OnlineGo to the IBM Software Support site at http://www.ibm.com/software/support/probsub.html and follow the instructions.
IBM Support AssistantThe IBM Support Assistant (ISA) is a free local software serviceabilityworkbench that helps you resolve questions and problems with IBMsoftware products. The ISA provides quick access to support-relatedinformation and serviceability tools for problem determination. To installthe ISA software, go to http://www.ibm.com/software/support/isa
Conventions used in this publicationThis publication uses several conventions for special terms and actions andoperating system-dependent commands and paths.
Typeface conventions
This publication uses the following typeface conventions:
Bold
v Lowercase commands and mixed case commands that are otherwisedifficult to distinguish from surrounding text
v Interface controls (check boxes, push buttons, radio buttons, spinbuttons, fields, folders, icons, list boxes, items inside list boxes,multicolumn lists, containers, menu choices, menu names, tabs, propertysheets), labels (such as Tip: and Operating system considerations:)
v Keywords and parameters in text
Italic
v Citations (examples: titles of publications, diskettes, and CDs)v Words defined in text (example: a nonswitched line is called a
point-to-point line)v Emphasis of words and letters (words as words example: "Use the word
that to introduce a restrictive clause."; letters as letters example: "TheLUN address must start with the letter L.")
v New terms in text (except in a definition list): a view is a frame in aworkspace that contains data
v Variables and values you must provide: ... where myname represents....
Monospace
v Examples and code examplesv File names, programming keywords, and other elements that are difficult
to distinguish from surrounding textv Message text and prompts addressed to the userv Text that the user must typev Values for arguments or command options
x IBM Tivoli Network Manager IP Edition: Network Troubleshooting Guide

Operating system-dependent variables and paths
This publication uses environment variables without platform-specific prefixes andsuffixes, unless the command applies only to specific platforms. For example, thedirectory where the Network Manager core components are installed is representedas NCHOME.
When using the Windows command line, preface and suffix environment variableswith the percentage sign %, and replace each forward slash (/) with a backslash (\)in directory paths. For example, on Windows systems, NCHOME is %NCHOME%.
On UNIX systems, preface environment variables with the dollar sign $. Forexample, on UNIX, NCHOME is $NCHOME.
The names of environment variables are not always the same in the Windows andUNIX environments. For example, %TEMP% in Windows environments isequivalent to $TMPDIR in UNIX environments. If you are using the bash shell ona Windows system, you can use the UNIX conventions.
About this publication xi

xii IBM Tivoli Network Manager IP Edition: Network Troubleshooting Guide

Chapter 1. About network troubleshooting
Network Manager provides several ways for troubleshooting network problems,including network views, event lists, Path Views, and the Structure Browser.
Network views and event lists provide a starting point for identifying networkproblems.v Network views are displayed in the Network Views GUI. Network views show
different views of your network based on geographical or other groupings. Forexample, network views can show subnets and VLAN groupings. Status iconswithin the Network Views GUI show event status of devices and device groups.
v Event lists are displayed in the Active Event List (AEL). The AEL provides listsof events on network devices and can be filtered to show events from selecteddevices only.
You can use the Path Views and the Structure Browser to investigate specificdevices and routes between devices.v The Path Views allows you to trace network paths. Network paths display every
device and link encountered between the start and end devices. Issues affectingdevices and links on that path are displayed graphically.
v The Structure Browser allows you to navigate the internal structure of a device.You can also use the Structure Browser to investigate the health of devicecomponents and isolate a fault within a network device.
About network views and the Network Hop ViewThere are two types of topology view: the Network Hop View and network views.Use these views to visualize the network and as a starting point for networktroubleshooting.
Network Hop ViewUse the Network Hop View to search the network for a specific device and displaya specified network device. You can also use the Network Hop View as a startingpoint for network troubleshooting.
Use the Hop Views to create a topology map around a specified device. This isknown as the seed device. You can also configure a number of hops from the seeddevice. The displayed topology consists of every device connected to the seeddevice, within the number of hops that you configure. The following examplesdescribe how the content of the Hop Views changes as you vary the number ofhops.v Example 1: You specify Device A as the seed device and a number of hops equal
to one. The Hop View shows you a network map consisting of Device A and alldevices directly connected to device A.
v Example 2: You specify Device A as the seed device and a number of hops equalto two. Device A is directly connected to two devices, Device B and Device C.The Hop View shows you Device A, Devices B and C, all devices directlyconnected to Device B, and all devices directly connected to Device C.
© Copyright IBM Corp. 2006, 2016 1

Network viewsNetwork Views show hierarchically organized views of a discovered network. Usethe Network Views to view the results of a discovery and to troubleshoot networkproblems.
Network views can display any set of device types, subnets, VLANs or otherviews, depending on how your network is organized.
The network view tree shows an icon next to each network view name thatindicates the highest severity event on devices within the network view. Click onthe icon to open an AEL that shows all events on devices within the network view.
When the discovery completes, it automatically generates a top-level networkviews node. If your network is very large and consists of thousands of devices,then your administrator might have discovered it in multiple domains. In this case,you see a top-level network views node for each domain.
Note: By default the top-level network views node is called NCOMS, becauseNCOMS is the default Network Manager IP Edition domain.
The contents of the top-level node depend on the devices and device collectionswithin your network. All networks contain the following sub-nodes:v Device classes: devices grouped by vendor, model, or other device characteristic.v Subnets: all subnets in the current Network Manager domain.
If you have a large and more complex network, for example, if you are a serviceprovider organization and you support customer VPNs using MPLS, the top-levelnode can also contain the following sub-nodes:v VLANs: all virtual LANs in the current Network Manager domainv HSRP groups: all Hot Standby Router Protocol router groups in the current
Network Manager domainv VTP domains: all VLAN Trunking Protocol domains in the current Network
Manager domainv MPLS: all MPLS core networks and Virtual Private Networks in the current
Network Manager domainv BGP Networks: all BGP autonomous systems (ASs) in the current Network
Manager domainv OSPF Routing Domains: all OSPF areas in the current Network Manager domain
Note: The subnodes listed are the default views that the system buildsautomatically following a discovery. You can also build custom network views.Related tasks:“Searching for a network view” on page 18If you have many network views, you can search through the network view tree tofind the view you want.Related reference:“Default network view nodes” on page 5Use this information to understand which nodes appear by default in yournetwork view tree.
2 IBM Tivoli Network Manager IP Edition: Network Troubleshooting Guide
Network domainsA network domain is a collection of network entities to be discovered andmanaged. A single Network Manager IP Edition installation can manage multiplenetwork domains.
The default network domain is called NCOMS. If you add extra domains then youmust give each domain a unique name.
Restriction: Use only alphanumeric characters and underscores (_) in domainnames. All other characters, for example hyphens (-), are not permitted.
By default the system uses the default NCOMS domain. The system provides theoption to change the domain when you perform the following tasks:v Configuring and running a discoveryv Configuring polls and poll definitionsv Querying management database data using OQLv Visualizing the network using the Network Views and the Network Hop View.v Browsing device MIBs using the SNMP MIB Browser
Device connectivityYou can display the network at different OSI layering levels in the network map.Change the connectivity layer setting if you wish to focus on subnet membership,OSI layer 2 connections, OSI layer 3 connections, Protocol Independent Multicast(PIM), or Internet Protocol Multicast (IPM) routes.
The following sections explain and illustrate the different views.
IP Subnets connectivityUse IP Subnets connectivity to display device membership by subnet in thenetwork map.
The IP Subnets connectivity option shows all devices within a subnet connected toa subnet cloud. Using the IP Subnets connectivity option usually simplifies thenetwork displayed in the network map and makes subnet membership clear. If youwish to see all connections, choose Layer 3 to show all routers and connectionsbetween them, or Layer 2 for data link connections.
Layer 2 connectivityUse the Layer 2 connectivity option to display discovered Layer 2 connections,such as between routers, switches and other network devices in the topology. Alayer 2 view typically shows switch and hub connections.
Layer 3 connectivityUse the Layer 3 connectivity option to display discovered Layer 3 connections,such as between routers and other network devices. Switches are not normallydisplayed.
The connections between devices are displayed as follows:v Connections between two layer 3 interfaces are shown.v Connections between a layer 3 and a layer 2 interface are shown as being
between the layer 3 interface and the subnet to which the layer 2 interfacebelongs.
v Connections between two layer 2 interfaces are not shown.
Chapter 1. About network troubleshooting 3
Note: Switches with routing capabilities are displayed if they have activeconnections involving layer 3 interfaces.
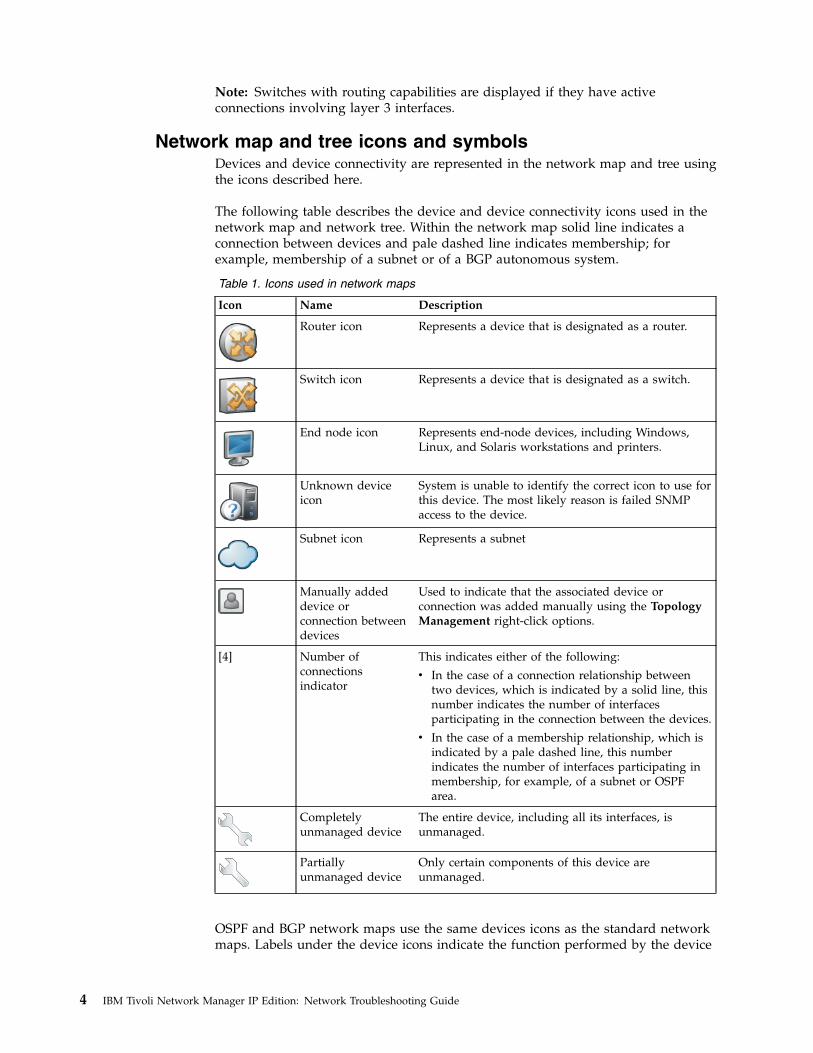
Network map and tree icons and symbolsDevices and device connectivity are represented in the network map and tree usingthe icons described here.
The following table describes the device and device connectivity icons used in thenetwork map and network tree. Within the network map solid line indicates aconnection between devices and pale dashed line indicates membership; forexample, membership of a subnet or of a BGP autonomous system.
Table 1. Icons used in network maps
Icon Name Description
Router icon Represents a device that is designated as a router.
Switch icon Represents a device that is designated as a switch.
End node icon Represents end-node devices, including Windows,Linux, and Solaris workstations and printers.
Unknown deviceicon
System is unable to identify the correct icon to use forthis device. The most likely reason is failed SNMPaccess to the device.
Subnet icon Represents a subnet
Manually addeddevice orconnection betweendevices
Used to indicate that the associated device orconnection was added manually using the TopologyManagement right-click options.
[4] Number ofconnectionsindicator
This indicates either of the following:
v In the case of a connection relationship betweentwo devices, which is indicated by a solid line, thisnumber indicates the number of interfacesparticipating in the connection between the devices.
v In the case of a membership relationship, which isindicated by a pale dashed line, this numberindicates the number of interfaces participating inmembership, for example, of a subnet or OSPFarea.
Completelyunmanaged device
The entire device, including all its interfaces, isunmanaged.
Partiallyunmanaged device
Only certain components of this device areunmanaged.
OSPF and BGP network maps use the same devices icons as the standard networkmaps. Labels under the device icons indicate the function performed by the device
4 IBM Tivoli Network Manager IP Edition: Network Troubleshooting Guide
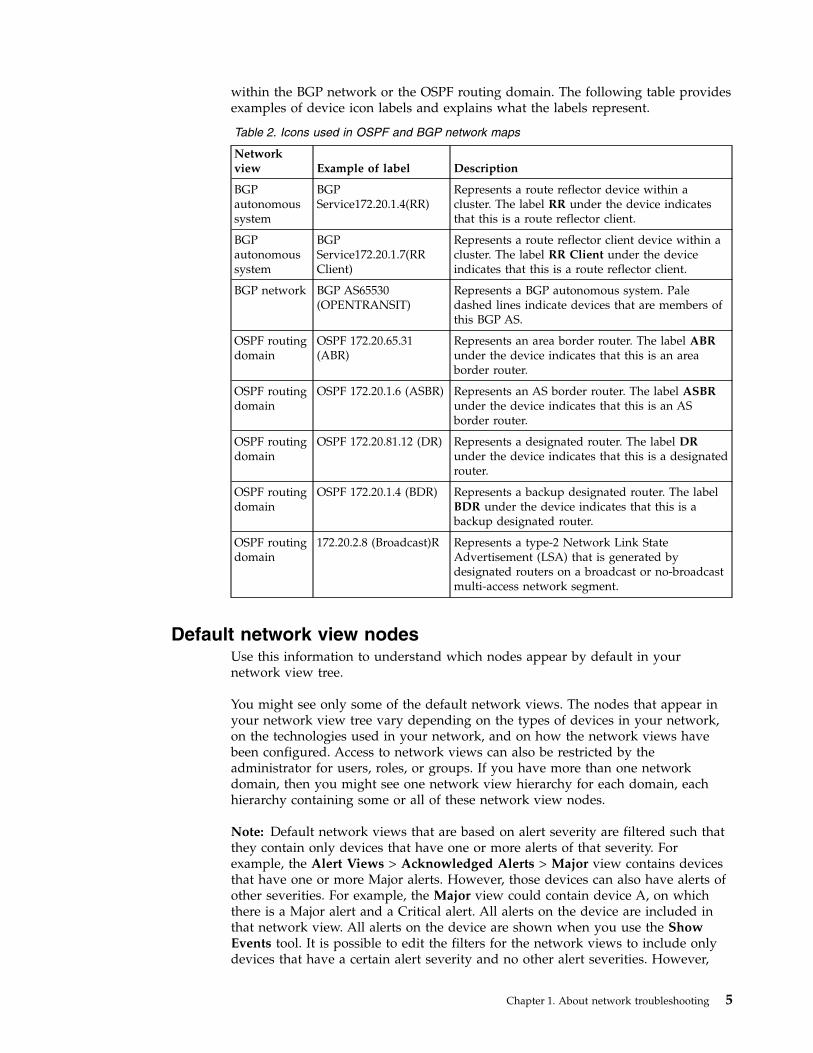
within the BGP network or the OSPF routing domain. The following table providesexamples of device icon labels and explains what the labels represent.
Table 2. Icons used in OSPF and BGP network maps
Networkview Example of label Description
BGPautonomoussystem
BGPService172.20.1.4(RR)
Represents a route reflector device within acluster. The label RR under the device indicatesthat this is a route reflector client.
BGPautonomoussystem
BGPService172.20.1.7(RRClient)
Represents a route reflector client device within acluster. The label RR Client under the deviceindicates that this is a route reflector client.
BGP network BGP AS65530(OPENTRANSIT)
Represents a BGP autonomous system. Paledashed lines indicate devices that are members ofthis BGP AS.
OSPF routingdomain
OSPF 172.20.65.31(ABR)
Represents an area border router. The label ABRunder the device indicates that this is an areaborder router.
OSPF routingdomain
OSPF 172.20.1.6 (ASBR) Represents an AS border router. The label ASBRunder the device indicates that this is an ASborder router.
OSPF routingdomain
OSPF 172.20.81.12 (DR) Represents a designated router. The label DRunder the device indicates that this is a designatedrouter.
OSPF routingdomain
OSPF 172.20.1.4 (BDR) Represents a backup designated router. The labelBDR under the device indicates that this is abackup designated router.
OSPF routingdomain
172.20.2.8 (Broadcast)R Represents a type-2 Network Link StateAdvertisement (LSA) that is generated bydesignated routers on a broadcast or no-broadcastmulti-access network segment.
Default network view nodesUse this information to understand which nodes appear by default in yournetwork view tree.
You might see only some of the default network views. The nodes that appear inyour network view tree vary depending on the types of devices in your network,on the technologies used in your network, and on how the network views havebeen configured. Access to network views can also be restricted by theadministrator for users, roles, or groups. If you have more than one networkdomain, then you might see one network view hierarchy for each domain, eachhierarchy containing some or all of these network view nodes.
Note: Default network views that are based on alert severity are filtered such thatthey contain only devices that have one or more alerts of that severity. Forexample, the Alert Views > Acknowledged Alerts > Major view contains devicesthat have one or more Major alerts. However, those devices can also have alerts ofother severities. For example, the Major view could contain device A, on whichthere is a Major alert and a Critical alert. All alerts on the device are included inthat network view. All alerts on the device are shown when you use the ShowEvents tool. It is possible to edit the filters for the network views to include onlydevices that have a certain alert severity and no other alert severities. However,
Chapter 1. About network troubleshooting 5
take care that devices that have multiple alerts with different severities are notaccidentally omitted from your network view hierarchy.
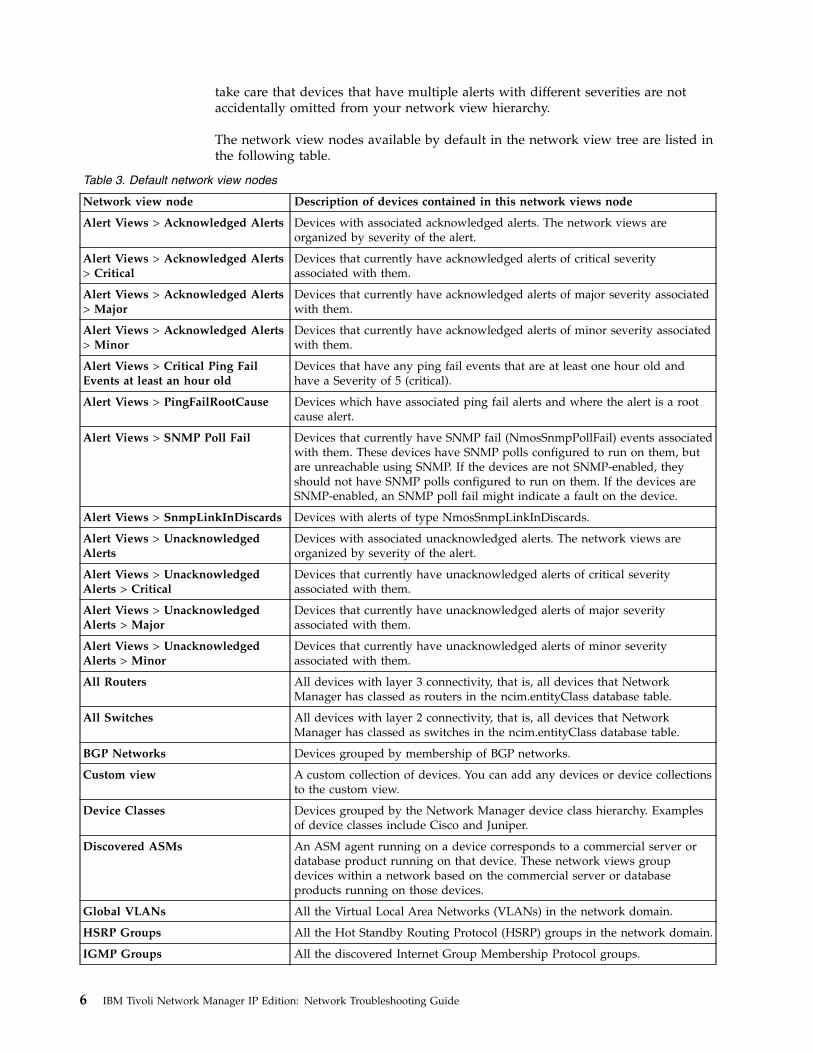
The network view nodes available by default in the network view tree are listed inthe following table.
Table 3. Default network view nodes
Network view node Description of devices contained in this network views node
Alert Views > Acknowledged Alerts Devices with associated acknowledged alerts. The network views areorganized by severity of the alert.
Alert Views > Acknowledged Alerts> Critical
Devices that currently have acknowledged alerts of critical severityassociated with them.
Alert Views > Acknowledged Alerts> Major
Devices that currently have acknowledged alerts of major severity associatedwith them.
Alert Views > Acknowledged Alerts> Minor
Devices that currently have acknowledged alerts of minor severity associatedwith them.
Alert Views > Critical Ping FailEvents at least an hour old
Devices that have any ping fail events that are at least one hour old andhave a Severity of 5 (critical).
Alert Views > PingFailRootCause Devices which have associated ping fail alerts and where the alert is a rootcause alert.
Alert Views > SNMP Poll Fail Devices that currently have SNMP fail (NmosSnmpPollFail) events associatedwith them. These devices have SNMP polls configured to run on them, butare unreachable using SNMP. If the devices are not SNMP-enabled, theyshould not have SNMP polls configured to run on them. If the devices areSNMP-enabled, an SNMP poll fail might indicate a fault on the device.
Alert Views > SnmpLinkInDiscards Devices with alerts of type NmosSnmpLinkInDiscards.
Alert Views > UnacknowledgedAlerts
Devices with associated unacknowledged alerts. The network views areorganized by severity of the alert.
Alert Views > UnacknowledgedAlerts > Critical
Devices that currently have unacknowledged alerts of critical severityassociated with them.
Alert Views > UnacknowledgedAlerts > Major
Devices that currently have unacknowledged alerts of major severityassociated with them.
Alert Views > UnacknowledgedAlerts > Minor
Devices that currently have unacknowledged alerts of minor severityassociated with them.
All Routers All devices with layer 3 connectivity, that is, all devices that NetworkManager has classed as routers in the ncim.entityClass database table.
All Switches All devices with layer 2 connectivity, that is, all devices that NetworkManager has classed as switches in the ncim.entityClass database table.
BGP Networks Devices grouped by membership of BGP networks.
Custom view A custom collection of devices. You can add any devices or device collectionsto the custom view.
Device Classes Devices grouped by the Network Manager device class hierarchy. Examplesof device classes include Cisco and Juniper.
Discovered ASMs An ASM agent running on a device corresponds to a commercial server ordatabase product running on that device. These network views groupdevices within a network based on the commercial server or databaseproducts running on those devices.
Global VLANs All the Virtual Local Area Networks (VLANs) in the network domain.
HSRP Groups All the Hot Standby Routing Protocol (HSRP) groups in the network domain.
IGMP Groups All the discovered Internet Group Membership Protocol groups.
6 IBM Tivoli Network Manager IP Edition: Network Troubleshooting Guide
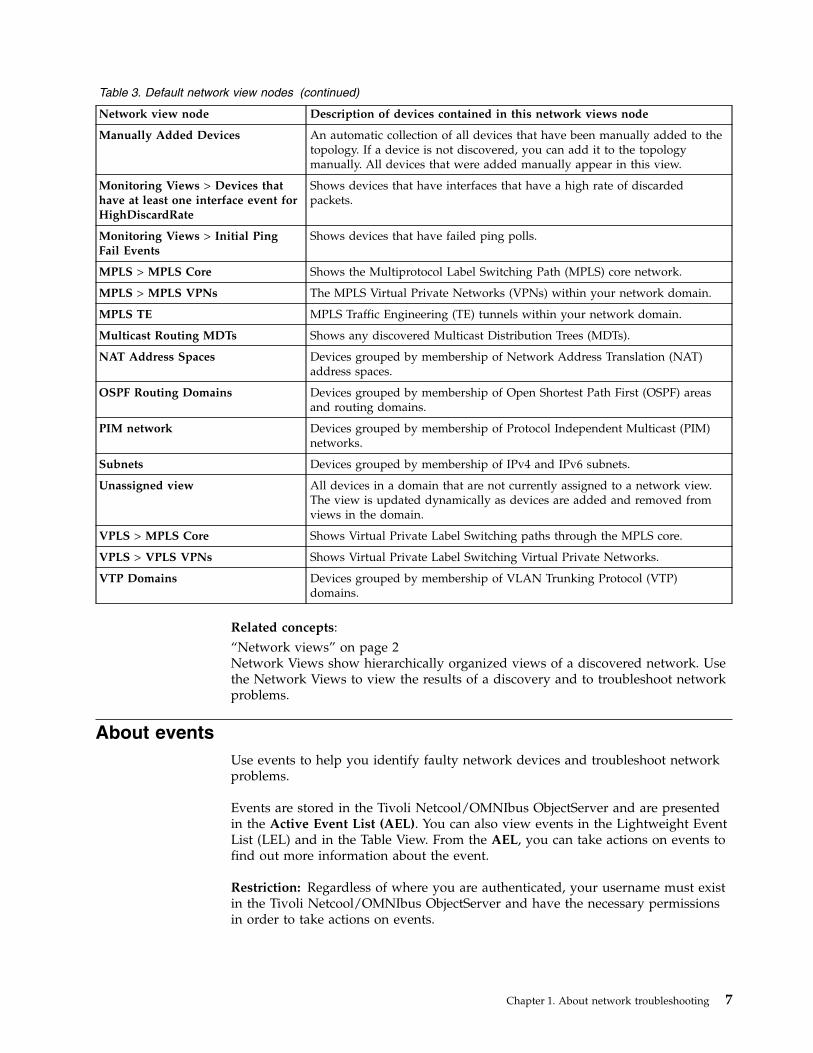
Table 3. Default network view nodes (continued)
Network view node Description of devices contained in this network views node
Manually Added Devices An automatic collection of all devices that have been manually added to thetopology. If a device is not discovered, you can add it to the topologymanually. All devices that were added manually appear in this view.
Monitoring Views > Devices thathave at least one interface event forHighDiscardRate
Shows devices that have interfaces that have a high rate of discardedpackets.
Monitoring Views > Initial PingFail Events
Shows devices that have failed ping polls.
MPLS > MPLS Core Shows the Multiprotocol Label Switching Path (MPLS) core network.
MPLS > MPLS VPNs The MPLS Virtual Private Networks (VPNs) within your network domain.
MPLS TE MPLS Traffic Engineering (TE) tunnels within your network domain.
Multicast Routing MDTs Shows any discovered Multicast Distribution Trees (MDTs).
NAT Address Spaces Devices grouped by membership of Network Address Translation (NAT)address spaces.
OSPF Routing Domains Devices grouped by membership of Open Shortest Path First (OSPF) areasand routing domains.
PIM network Devices grouped by membership of Protocol Independent Multicast (PIM)networks.
Subnets Devices grouped by membership of IPv4 and IPv6 subnets.
Unassigned view All devices in a domain that are not currently assigned to a network view.The view is updated dynamically as devices are added and removed fromviews in the domain.
VPLS > MPLS Core Shows Virtual Private Label Switching paths through the MPLS core.
VPLS > VPLS VPNs Shows Virtual Private Label Switching Virtual Private Networks.
VTP Domains Devices grouped by membership of VLAN Trunking Protocol (VTP)domains.
Related concepts:“Network views” on page 2Network Views show hierarchically organized views of a discovered network. Usethe Network Views to view the results of a discovery and to troubleshoot networkproblems.
About eventsUse events to help you identify faulty network devices and troubleshoot networkproblems.
Events are stored in the Tivoli Netcool/OMNIbus ObjectServer and are presentedin the Active Event List (AEL). You can also view events in the Lightweight EventList (LEL) and in the Table View. From the AEL, you can take actions on events tofind out more information about the event.
Restriction: Regardless of where you are authenticated, your username must existin the Tivoli Netcool/OMNIbus ObjectServer and have the necessary permissionsin order to take actions on events.
Chapter 1. About network troubleshooting 7

Sources of events
When Tivoli Netcool/OMNIbus receives events and alarms from network devices,it generates and stores alerts. The ObjectServer receives events from TivoliNetcool/OMNIbus probes, and potentially from many other network eventsources.
Deduplication
Alerts are deduplicated. This means that if an event occurs multiple times, it onlyoccupies a single alert row in the AEL, with a count value indicating how manytimes the event occurred.
Default event status iconsThe Structure Browser in table mode, the Network Views, and the Network HopView show the severity of events affecting a device or other network entity such asa card, by showing an alert icon adjacent to the entity.
The following table shows the default event status icons.
Table 4. Default event status icons
Default icon in the Network ViewsSeverity ormeaning
Color in the Active EventList
5 (critical) Red
4 (major) Orange
3 (minor) Yellow
2 (warning) Blue
1 (indeterminate) Purple
0 (clear) Green
No status has beenretrieved for thisdevice. If thispersists, theremight be an error.
Not applicable
There are no eventsfor this device.This icon is notused in theNetwork HopView.
Not applicable
This icon appearsnext to unmanageddevices orcomponents.
Not applicable
8 IBM Tivoli Network Manager IP Edition: Network Troubleshooting Guide
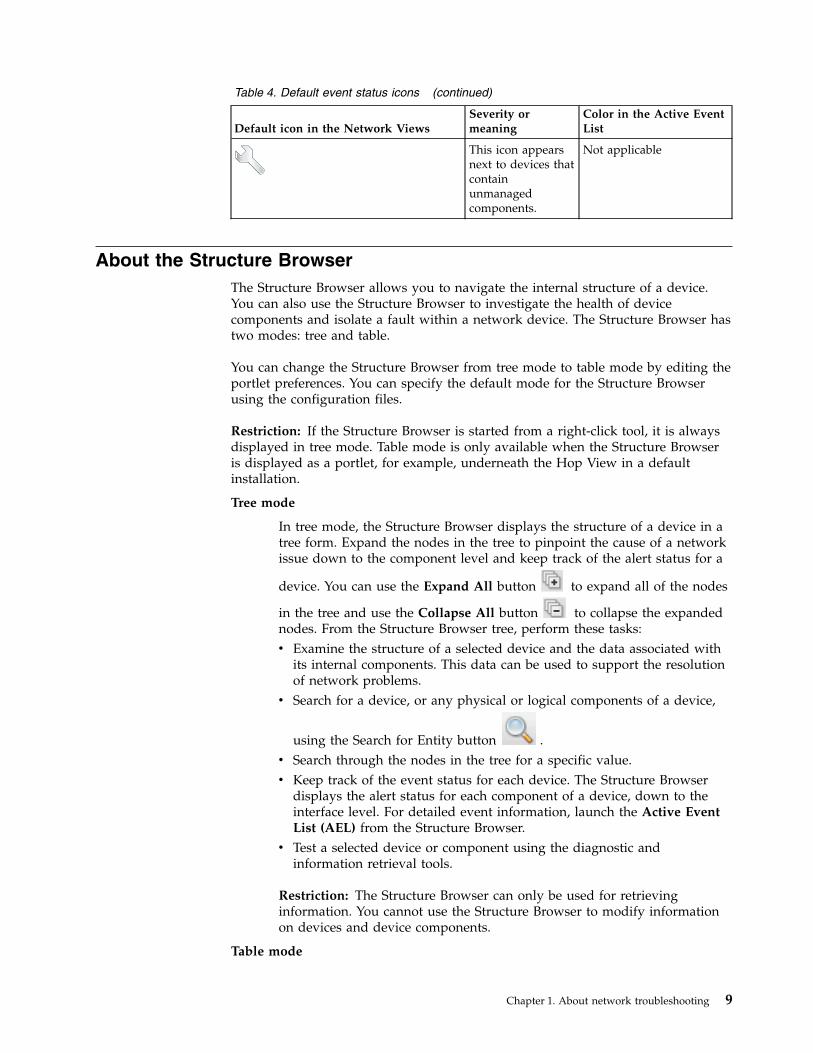
Table 4. Default event status icons (continued)
Default icon in the Network ViewsSeverity ormeaning
Color in the Active EventList
This icon appearsnext to devices thatcontainunmanagedcomponents.
Not applicable
About the Structure BrowserThe Structure Browser allows you to navigate the internal structure of a device.You can also use the Structure Browser to investigate the health of devicecomponents and isolate a fault within a network device. The Structure Browser hastwo modes: tree and table.
You can change the Structure Browser from tree mode to table mode by editing theportlet preferences. You can specify the default mode for the Structure Browserusing the configuration files.
Restriction: If the Structure Browser is started from a right-click tool, it is alwaysdisplayed in tree mode. Table mode is only available when the Structure Browseris displayed as a portlet, for example, underneath the Hop View in a defaultinstallation.
Tree mode
In tree mode, the Structure Browser displays the structure of a device in atree form. Expand the nodes in the tree to pinpoint the cause of a networkissue down to the component level and keep track of the alert status for a
device. You can use the Expand All button
to expand all of the nodes
in the tree and use the Collapse All button
to collapse the expandednodes. From the Structure Browser tree, perform these tasks:v Examine the structure of a selected device and the data associated with
its internal components. This data can be used to support the resolutionof network problems.
v Search for a device, or any physical or logical components of a device,
using the Search for Entity button .v Search through the nodes in the tree for a specific value.v Keep track of the event status for each device. The Structure Browser
displays the alert status for each component of a device, down to theinterface level. For detailed event information, launch the Active EventList (AEL) from the Structure Browser.
v Test a selected device or component using the diagnostic andinformation retrieval tools.
Restriction: The Structure Browser can only be used for retrievinginformation. You cannot use the Structure Browser to modify informationon devices and device components.
Table mode
Chapter 1. About network troubleshooting 9

In table mode, the Structure Browser displays summary information aboutthe selected device in a table. The table is updated with new informationeach time you select a device. Use the table to view information about aselected device and to check the alert status for the device.
From the Structure Browser table, perform these tasks:v Examine summary data that can be used to resolve network problems.v Keep track of the event status for a device. For detailed event
information, launch the Active Event List (AEL) from the StructureBrowser.
v Test a selected device or component using the diagnostic andinformation retrieval tools.
v Refresh the information in the current table view using the Refresh
button .
v Pause the refresh of information using the Pause button .
View information about a device from one of three table views: DeviceInformation, Interfaces, and Device Connectivity.
Show device information Device Information is the default view. Select a device to seeinformation about the device. By default, the table is empty untilyou select a device unless you specify an entity ID to use bydefault when you open the Device Information view. You canspecify an entity ID through portlet preferences or by clicking onthe Hop View to load device information immediately. The firsttime the portlet is displayed, device information for the defaultentity ID is displayed. The column names vary depending on thetype of entity selected.
Show interfaces
The Interfaces view shows all of the interfaces available on thedevice as well as their severity and managed status. You canconfigure the columns that you want to view in the table, but youcannot change the column names or the order in which thecolumns are displayed. The ncim.interfaces table in the NCIMdatabase contains the list of columns to be displayed in theInterfaces view. If you want to hide a column that you do not needto view, set the column width to zero in thestructurebrowser.properties file. You can filter the table to onlyshow interfaces that match the filter. If there is no match, then norows are displayed in the table.
In the Interfaces view, the following icon denotes unmanaged
devices or components: . The alert status indicator denotesthe alert severity level of each component.
Show device connectivity
10 IBM Tivoli Network Manager IP Edition: Network Troubleshooting Guide
The Connectivity view shows the severity and managed status ofinterfaces on the device. This view also shows interface data bothfor interfaces on the device, and for the interfaces that they areconnected to, including connection type.
In the Connectivity view, the following icon denotes unmanaged
devices or components: . The alert status indicator denotesthe alert severity level of each component.
Related tasks:“Searching the node text in the Structure Browser tree” on page 80You can search for a value within the nodes in the Structure Browser tree.“Identifying faulty components from the Structure Browser tree” on page 77Using the tree mode of the Structure Browser, you can identify a faulty componentin order to retrieve further details about the critical alert.“Identifying faulty components from the Structure Browser table” on page 78Using the table mode of the Structure Browser, you can identify a faultycomponent in order to retrieve further details about the critical alert.
Chapter 1. About network troubleshooting 11

12 IBM Tivoli Network Manager IP Edition: Network Troubleshooting Guide
Chapter 2. Finding network devices
Search for a specific device using its IP address or host name, or browse for adevice in the network views.
In the Network Health View or Network Views, you can also switch betweenvisualizing devices in a map and in a tabular layout.
Searching for devices using the Network Hop ViewSearch for a seed device in the Network Hop View to display that device andthose devices connected to it.
The Network Hop View displays a view of the network including all deviceswithin a certain number of connections from a device that you choose. The devicearound which the view is based is called the seed device.
You can search for a seed device using either the basic search or the advancedsearch.
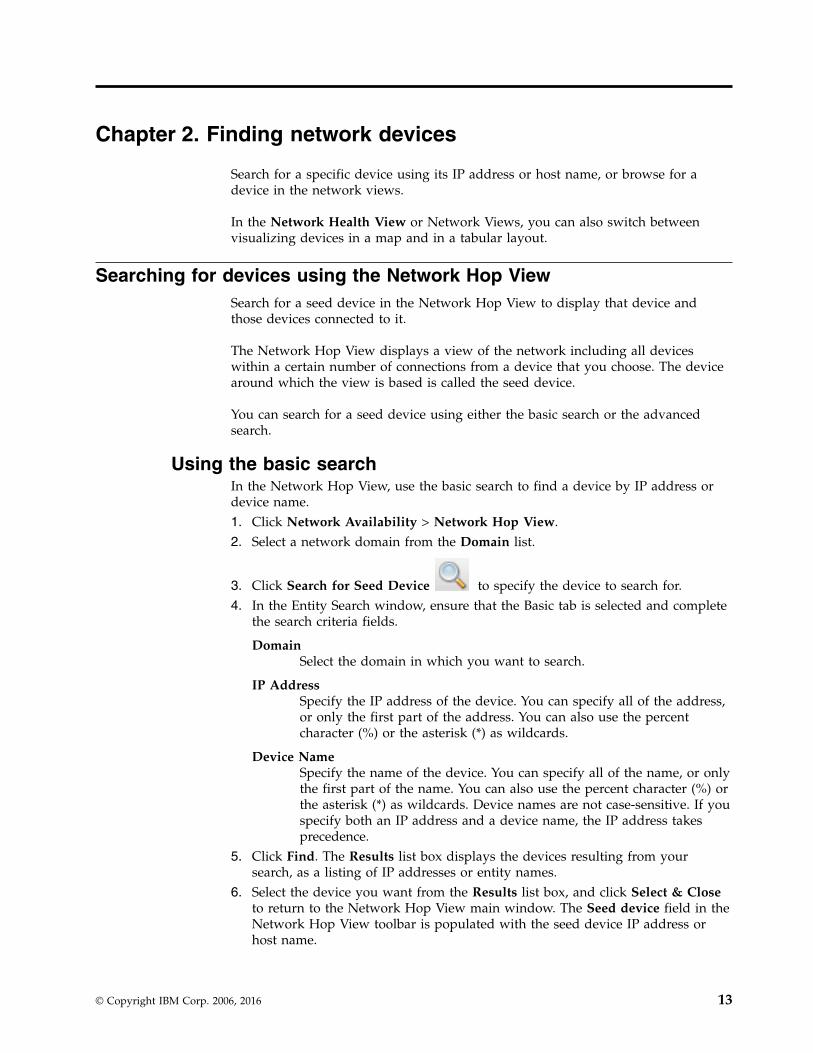
Using the basic searchIn the Network Hop View, use the basic search to find a device by IP address ordevice name.1. Click Network Availability > Network Hop View.2. Select a network domain from the Domain list.
3. Click Search for Seed Device to specify the device to search for.4. In the Entity Search window, ensure that the Basic tab is selected and complete
the search criteria fields.
DomainSelect the domain in which you want to search.
IP AddressSpecify the IP address of the device. You can specify all of the address,or only the first part of the address. You can also use the percentcharacter (%) or the asterisk (*) as wildcards.
Device NameSpecify the name of the device. You can specify all of the name, or onlythe first part of the name. You can also use the percent character (%) orthe asterisk (*) as wildcards. Device names are not case-sensitive. If youspecify both an IP address and a device name, the IP address takesprecedence.
5. Click Find. The Results list box displays the devices resulting from yoursearch, as a listing of IP addresses or entity names.
6. Select the device you want from the Results list box, and click Select & Closeto return to the Network Hop View main window. The Seed device field in theNetwork Hop View toolbar is populated with the seed device IP address orhost name.
© Copyright IBM Corp. 2006, 2016 13

Tip: If you know the entity ID of the device, you can also type it into the Seedfield. Do not type device IP addresses or hostnames into the Seed field.
7. Select the maximum number of hops displayed from the seed device from theHops list. This setting shows more or less devices connected to the seed device.
8. Specify how to display connectivity:
Layer 2Displays all switched connections between devices in the topology. Alayer 2 view typically shows switch and hub connections.
Layer 3Shows routers and the connections between routers. Switches are notnormally displayed.
Note: If switches have active connections involving layer 3 interfaces,they are included in this layout.
The connections between devices are displayed as follows:v Connections between two layer 3 interfaces are shown as normal.v Connections between a layer 3 and a layer 2 interface are shown as
being between the layer 3 interface and the subnet to which the layer2 interface belongs.
v Connections between two layer 2 interfaces are not shown.
IP SubnetsShows all devices within a subnet connected to a subnet cloud. Thislayout helps to simplify the network map and also helps to makesubnet membership clear. If you want to see all connections, selectLayer 3 to show all routers and connections between them, or Layer 2for data link connections.
PIM Shows all devices that belong to Protocol Independent Multicast (PIM)groups.
IPMRouteShows all devices that belong to Internet Protocol Multicast (IPM)routes.
9. Click Apply Changes . The topology you selected is displayed in thenetwork map. Faulty devices are displayed with an associated event icon.
Fix Pack 4
To see which domain a device is in, hover the cursor over the device.
If a cross-domain discovery is configured, the Network Hop View results caninclude devices that are in a different domain than the domain that contains theseed device.
Using the advanced searchIn the Network Hop View, use the advanced search to find a device by anyattribute of the device from the topology database.
To perform an advanced search for a device, complete the following steps:1. Click Network Availability > Network Hop View.2. Select a network domain from the Domain list.
3. Click Search for Seed Device to specify the device to search for.
14 IBM Tivoli Network Manager IP Edition: Network Troubleshooting Guide

4. In the Entity Search window, ensure that the Advanced tab is selected andcomplete the search criteria fields.
DomainSelect the domain in which you want to search.
Table Select the database table that you want to search. The mainNodeDetailstable lists network devices.
Field Select the field whose value you want to search. The selection availablefor this field is automatically populated based on the chosen database.
ComparatorSelect a comparator.
Value Required. Type the value that you want to search for. You can use thepercent character (%) or the asterisk (*) as wildcards.
5. Click Find. The Results list box displays the devices resulting from yoursearch, as a listing of IP addresses or entity names.
6. Select the device you want from the Results list box, and click Select & Closeto return to the Network Hop View main window. The Seed device field in theNetwork Hop View toolbar is populated with the seed device IP address orhost name.
Tip: If you know the entity ID of the device, you can also type it into the Seedfield. Do not type device IP addresses or hostnames into the Seed field.
7. Select the maximum number of hops displayed from the seed device from theHops list. This setting shows more or less devices connected to the seed device.
8. Specify how to display connectivity:
IP SubnetsShows all devices within a subnet connected to a subnet cloud. Thislayout helps to simplify the network map and also helps to makesubnet membership clear. If you want to see all connections, selectLayer 3 to show all routers and connections between them, or Layer 2for data link connections.
Layer 2Displays all switched connections between devices in the topology. Alayer 2 view typically shows switch and hub connections.
Layer 3Shows routers and the connections between routers. Switches are notnormally displayed.
Note: If switches have active connections involving layer 3 interfaces,they are included in this layout.
The connections between devices are displayed as follows:v Connections between two layer 3 interfaces are shown as normal.v Connections between a layer 3 and a layer 2 interface are shown as
being between the layer 3 interface and the subnet to which the layer2 interface belongs.
v Connections between two layer 2 interfaces are not shown.
9. Click Apply Changes . The topology you selected is displayed in thenetwork map. Faulty devices are displayed with an associated event icon.
Chapter 2. Finding network devices 15
Fix Pack 4 To see which domain a device is in, hover the cursor over the device.If a cross-domain discovery is configured, the Network Hop View results caninclude devices that are in a different domain than the domain that contains theseed device.
Browsing the network using the Network ViewsBrowse the network using network views in order to visualize the network basedon geographical or other groupings. For example, you can browse subnets ordevice classes.
Before you can work with network views the following must be complete:v The administrator must have successfully completed the first network discoveryv Network views must be configured for your user ID.1. Click Availability > Network Availability > Network Views.2. In the Network Views tree on the left of the portlet, browse the network by
expanding network view nodes of interest. Here are some examples:v To browse subnets, click the + symbol next to the Subnets node.v To browse VLANs, click the + symbol next to the Global VLANs node.v To browse device classes and see devices grouped into categories such as
Linux, Sun, and Cisco, click the + symbol next to the Device Classes node.
Note: Devices which the discovery process was unable to access usingSNMP appear in the NoSNMPAccess sub-node, under the Device Classesnode.
3. Click a network view. The network map displays subnets and devices in thatnetwork view. Faulty devices are displayed with an associated event icon.
Searching for devices within a viewWithin the Network Hop View or Network Views, you can search for specificdevices. For example, you can find devices that have high-speed interfaces.
If the device you want to find is not included in the current Network Hop View or
Network View, you cannot find it using Find in Map . You must search inanother Network View or search for the device as a seed device.1. From the Network Hop View or Network Views network map, click Find in
Map .2. From the Find in Map window, formulate search criteria by completing the
relevant fields. For example, you can highlight all devices in the topology mapthat meet the following criteria.v Find all Cisco devices in the network map.v Find all devices with high speed interfaces.
Table Select the database table that you want to search. The mainNodeDetailstable lists network devices.
Field Select the field whose value you want to search. The selection availablefor this field is automatically populated based on the chosen database.
16 IBM Tivoli Network Manager IP Edition: Network Troubleshooting Guide

ComparatorSelect a comparator.
Value Required. Type the value that you want to search for. You can use thepercent character (%) or the asterisk (*) as wildcards.
3. Click Find. Devices that meet the criteria are highlighted with blue handles.The map is zoomed in to and centred on the devices, and the overview istoggled on.
Finding Cisco devices in the current viewUse this example query to find all Cisco devices in the current Hop View orNetwork View.
To formulate this query, select the chassis database table. This table containsproperties of main node devices, such as switches and routers. Specify theclassName field from this table. Use the % wildcard character to indicate that theclassname value must contain the letters "isco". The resulting query looks like this:
Table: chassisField: classNameComparator: likeValue: %isco%
This query finds devices with classnames such as the following:v Cisco26xx
v Cisco36xx
v Cisco72xx
v CiscoCat35xx
Devices found by this query are highlighted in the network map using handlesaround the device.
Finding Ethernet interfaces in the current viewUse this example query to find interfaces in the current Hop View or NetworkView that are of type Ethernet.
To formulate this query, select the Basic > interfaces database table, and specifythe ifType field from this table. Specify that the value of the ifType field must beequal to ethernet-csmacd.
Table: interfacesField: ifTypeComparator: =Value: ethernet-csmacd
This query finds devices in the topology map that have Ethernet interfaces.Devices found by this query are highlighted in the network map using handlesaround the device.
Chapter 2. Finding network devices 17
Searching for a network viewIf you have many network views, you can search through the network view tree tofind the view you want.
To search for a particular network view name, complete the following steps.
1. From the Network Views, click the Toggle search button
in the toolbar.A search box is displayed below the toolbar, with a Begin Search button andClear Search button.
2. Type a search query into the search box. Searches are not case-sensitive. Youcan use the percent character (%) or asterisk character (*) as a wildcard.Wildcards match zero or more characters.
Remember: A wildcard can be used anywhere in the middle of the searchphrase. If you do not specify a wildcard, a wildcard is automatically used atthe front and end of the search phrase. Any wildcards actually specified at thefont or the end will be silently ignored.
3. Click Begin Search . Only views with names that match the searchphrase are displayed. If a container matches the search, all its children aredisplayed. The search term is highlighted in the view names.
4. To display a network view, click the name of the view in the tree.5. To clear the search and display the full tree with all nodes collapsed, click
Clear Search .
Visualizing devices in tabular layoutSwitch to tabular layout of your topology maps using the Network Health Viewand Network Views. Displaying topology maps in tabular layout enables filteringand sorting of topology data.
In addition to the graphical views of your topology provided within the NetworkHealth View and Network Views, you can also display the topology map intabular layout.
Restriction: The following restrictions apply to the tabular layout:v Network hop views cannot be displayed in tabular layout.v The tabular layout lists nodes but does not display connections between network
nodes. To view network connections, choose a different layout, such assymmetrical or orthogonal.
v No hover help information is provided when you move your mouse over a nodein the tabular layout. To view device hover help, choose a different layout, suchas symmetrical or orthogonal.
v When switching between tabular layout and other layouts, device selection isnot preserved.
v The tabular layout cannot be printed or saved as an image. To print the view,choose a different layout, such as symmetrical or orthogonal.
18 IBM Tivoli Network Manager IP Edition: Network Troubleshooting Guide

Switching to tabular layoutYou can display topology maps using tabular layout.
In order to display a topology map using tabular layout, you must be in theNetwork Health View or Network Views.
Note: You cannot display a topology map in tabular layout using the NetworkHop View.1. Click Availability > Network Availability > Network Health View to open the
Network Health View or Availability > Network Availability > NetworkViews to open the Network Views.
2. Navigate the Network View Tree to find a network view of interest.
3. Click Tabular layout to display the topology map in table form. Thefollowing toolbar items are present when the network view is presented intabular layout.
Save Saves the view or view container.
Filter Filter the contents of the table by entering a string in the Filter fieldand pressing the Return key.
For example, to find all rows that contain the string "snmp", type snmp.The search is case insensitive. For columns containing icons, such as theMaximum Severity column, the search string is compared against thetooltip value for the relevant cell. For example, if you enter a filtervalue of 3, then the filter returns any rows containing nodes that havean associated Minor severity, because the Minor severity icons has atooltip that reads Severity 3.
Note: If the table layout is refreshed by the system due to a change indata contained in the table, for example, updates to the MaximumSeverity column, then the filter is reapplied before the refreshed viewis displayed.
Restriction: You cannot use regular expressions in the Filter.
Hierarchical Layout Changes the format of the view to a hierarchical layout. This option isnot available for views that cannot contain connectivity information,such as Unassigned network views.
Symmetric Layout Changes the format of the view to a symmetrical layout. This option isnot available for views that cannot contain connectivity information,such as Unassigned network views.
Orthogonal Layout Changes the format of the view to an orthogonal layout. This option isnot available for views that cannot contain connectivity information,such as Unassigned network views.
Chapter 2. Finding network devices 19

Circular Layout Changes the format of the view to a circular layout. This option is notavailable for views that cannot contain connectivity information, suchas Unassigned network views.
Grid Layout Changes the format of the view to a grid layout. This option is onlyavailable for views that cannot contain connectivity information, suchas Unassigned views.
Tabular Layout Changes the format of the view to a tabular layout. This option is notavailable for views that cannot contain connectivity information, suchas Unassigned network views.
You can perform the following actions on the table that lists the network viewnodes. Any settings made are valid for this session only.
Restriction: Sort operations performed on the IP Address field treat IPv6addresses as bigger than IPv4 addresses. Within each IP version, the sorting isperformed based on byte representations of the IP addresses.
Sort ColumnClick the column header to sort that column in descending order. Clickthe column a second time to sort the column in ascending order.Further clicks toggle the column between descending and ascendingorder. The meaning of ascending and descending order variesaccording to the type of data in the column:
Alphabetical dataAscending order orders the data from a to z. Descending orderorders the data from z to a.
Numerical dataAscending order orders the data from lowest to highest.Descending order orders the data from higest to lowest.
Icon Ascending order orders the icons from the highest to lowestvalue associated with the icon. Descending order orders theicons from the lowest to highest value associated with the icon.The values associated with each icon are listed below.
Resize a columnClick and drag the vertical line separator to the right of the columnheading.
Move a columnClick a column header and drag it to the right or the left of adjacentcolumns.
The table that lists the network view nodes contains that the followingcolumns.
Display Name
Human-readable name to be displayed adjacent to this entity in atopology map and in the Network Views tabular layout.
IP Address
20 IBM Tivoli Network Manager IP Edition: Network Troubleshooting Guide

The IP address through which this entity was discovered and will bemonitored.
Class Name
The name of a class of devices.
Class Type
The type of device or type of class.
Managed StateTakes one of the following values:v Managed: if the row represents a device container, such as Cisco,
then all devices in the container are in managed status. If the rowrepresents a device then the device is in managed status.
v Unmanaged. if the row represents a device container, such as Cisco,then all devices in the container are in unmanaged status. If the rowrepresents a device then the device is in unmanaged status.
v Partially Managed: if the row represents a device container, such asCisco, then one or more, but not all, of the devices in the container isin unmanaged status. If the row represents a device, then one ormore components in the device is in unmanaged status.
Maximum SeverityDisplays an event status icon showing the severity of the device or themaximum severity of all devices if the row represents a devicecontainer, such as Cisco.
Note: If there are more than 2,000 devices in a single network view,then no event status information is displayed in the table.
Filtering devices in tabular layoutYou can filter devices in a tabular layout of the topology map. For example, if youenter a search string of 3, the table might display rows containing devices with IPaddresses such as 172.3.102.10 and with class names like 3Com.
This task assumes that you are already in the Network Health View or NetworkViews and that you are displaying a topology map in tabular layout.1. In the Filter field, type a filter string and press Enter. Here are some examples
of filter strings:
v To display all devices that have associated Critical events , type critical.
Note: By default, the Maximum Severity column displays an icon related tothe severity. A tooltip associated with the icon displays the severity stringassociated with the icon. Use the text displayed in the icon tooltip to filter onthe Maximum Severity value.
v To display all Cisco devices, type cisco. This shows all devices where theClass Name column contains the string "Cisco".
The Filter field does not support wildcard characters such as *. It also does notsupport regular expressions. If the table is refreshed, for example due to anupdate in Maximum Severity of one or more devices displayed in the table,then the filter you specified is reapplied before the filtered table is displayed.
2. To remove the filter, empty the Filter field and press Enter.
Chapter 2. Finding network devices 21
Using entity smart search
Fix Pack 4
Use entity smart search to search for an entity across all Network Managerdomains or across a custom NCIM database table in an extended NCIM database.
An entity smart search has the following characteristics:v Spans all Network Manager domainsv Provides for searches across an NCIM database table in an extended NCIM
databasev Uses the entityName as the search parameterv Uses a URL supplied to the Tivoli Integrated Portal
An entity smart search has the following possible results:v Single match -- The specified entityName is unique in the NCIM database.v Multiple matches -- The specified entityName exists in more than one Network
Manager domain and/or parent entity node.v Zero matches -- No matching entities were found in the NCIM database.v Error -- An error occurred and the entity smart search failed.
Performing an entity smart search across all domainsFix Pack 4
Use the entity smart search feature to search for an entity across all NetworkManager domains.
An entity is a topology database concept. All devices and device componentsdiscovered by Network Manager are entities. You perform an entity smart searchacross all Network Manager domains by specifying a URL that contains the nameof the entity. You specify this URL in the Tivoli Integrated Portal.
Note: You can use only the name of the entity when performing an entity smartsearch across all Network Manager domains.
To perform an entity smart search across all Network Manager domains specify thefollowing URL to the Tivoli Integrated Portal:http(s)://TIP_HOST:TIP_PORT/ibm/console/ncp_structureview/Search.do?selectEntityName=entityName
wherev TIP_HOST -- Specifies the name of the host computer on which the Tivoli
Integrated Portal server was installed.v TIP_PORT -- Specifies the port number associated with the host computer on
which the Tivoli Integrated Portal server was installed.v entityName -- Specifies the name of the entity to search across all Network
Manager domains. The entityName is case sensitive as it must match an existingvalue in the NCIM database.You can also specify spaces in the entityName by using the + (plus sign) or %20(percent sign followed by the number 20). For example, the space in the entityname ;SM 0001 can be specified as ;SM+0001 or ;SM%200001.
22 IBM Tivoli Network Manager IP Edition: Network Troubleshooting Guide
Note: The URL path is case sensitive (that is, all items in the path are lower caseexcept for the upper case S in Search). The parameter name selectEntityName inthe URL specification is also case sensitive.
1. Log into the Tivoli Integrated Portal.2. In the browser Location bar, specify the previously described URL. After the
URL has been successfully submitted to the Tivoli Integrated Portal server thereare four possible scenarios:v Single match -- The specified entityName is unique in the NCIM database.
The Structure Browser is launched and the selected entityName is displayedin the context of the containing structure.
v Multiple matches -- The specified entityName exists in more than oneNetwork Manager domain and/or parent entity node. A new context pagedisplays the results using the following format:$DOMAIN_NAME/$CONTAINMENT_PATH_BY_ENTITYNAME
where– DOMAIN_NAME -- Specifies the Network Manager domain in which the
specified entityName resides.– CONTAINMENT_PATH_BY_ENTITYNAME -- Specifies the list of entities
that exist from the root entity to the entity specified in the entity smartsearch. Consider the following example where an entity smart search isperformed on an entity called SM00189990:DOMAIN1 NAP02513002/SM02513016/SM00189990
In the example, the containment path for the domain called DOMAIN1specifies the following entities:
– Root entity -- The root entity is the first entity in the list. In this example,the root entity is NAP02513002.
– Repeater entity -- Zero or more repeater entities can follow the root entity.In the example, there is one repeater entity, SM02513016.
– Search entity -- This is the entity specified in the entity smart search. Inthe example, the search entity is SM00189990.
Note: For some search results there will only be a root entity and the entityspecified in the entity smart search. For other search results there will be aroot entity, one or more repeater entities, and the entity specified in theentity smart search.
v Zero matches -- A results page indicates there were no matches in the NCIMdatabase for the specified entityName.
v Error -- A results page indicates an error has occurred and that the searchshould be attempted again.
The following example shows the URL for an entity smart search across allNetwork Manager domains:https://tip01.ibm.com:16311/ibm/console/ncp_structureview/Search.do?selectEntityName=SM00071103
wherev tip01.ibm.com -- Specifies the host name of the computer on which the Tivoli
Integrated Portal server was installed.v 16311 -- Specifies the port number associated with the host computer on which
the Tivoli Integrated Portal server was installed.v SM00071103 -- Specifies the name of the entity to search across all Network
Manager domains.
Chapter 2. Finding network devices 23

Use the Structure Browser to navigate the internal structure of a device or toinvestigate the health of device components and isolate a fault within a networkdevice. Specifically, the Structure Browser highlights the entity specified in theentity smart search.
Performing an entity smart search across a custom NCIMdatabase table
Fix Pack 4
Use the entity smart search feature to search for an entity across a custom NCIMdatabase table in an extended NCIM database.
An entity is a topology database concept. All devices and device componentsdiscovered by Network Manager are entities. You perform an entity smart searchacross a custom NCIM database table by specifying a URL that contains the nameof the entity and the name of the custom NCIM database table. You specify thisURL in the Tivoli Integrated Portal.
To perform an entity smart search across a custom NCIM database table specifythe following URL to the Tivoli Integrated Portal:http(s)://TIP_HOST:TIP_PORT/ibm/console/ncp_structureview/Search.do?selectEntityName=entityName&namespace=CUSTOM_TABLE.CUSTOM_FIELD
wherev TIP_HOST -- Specifies the name of the host computer on which the Tivoli
Integrated Portal server was installed.v TIP_PORT -- Specifies the port number associated with the host computer on
which theTivoli Integrated Portal server was installed.v entityName -- Specifies the name of the entity to search across a custom NCIM
database table. The entityName is case sensitive as it must match an existingvalue in the specified NCIM custom database table. The entityName is linked tothe entityId in the custom NCIM database table.You can also specify spaces in the entityName by using the + (plus sign) or %20(percent sign followed by the number 20). For example, the space in the entityname ;SM 0001 can be specified as ;SM+0001 or ;SM%200001.
Note: The URL path is case sensitive (that is, all items in the path are lower caseexcept for the upper case S in Search). The parameter name selectEntityName inthe URL specification is also case sensitive.
v CUSTOM_TABLE -- Specifies the name of the NCIM custom database table inthe extended NCIM database in which to perform the search of the entityspecified in entityName. This NCIM custom database table contains the twofields: entityId and CUSTOM_FIELD. The entityId is a foreign key to theentityNameCache table and must be unique for each entity across all domains.The entityId is automatically incremented.
Note: You do not specify the entityId in the URL specification.v CUSTOM_FIELD -- Specifies the name of the field to search within the NCIM
custom database table. The entityId field in the NCIM custom database table inthe extended NCIM database will reference the entityId field in the entityDatatable.
24 IBM Tivoli Network Manager IP Edition: Network Troubleshooting Guide

Note: When using the extended namespace functionality, ensure that the NCIMcustom database table forms a natural join to the NCIM.entityData table byentityId. After that, the user can put whatever data they want into the NCIMcustom database table.
The performance of the extended namespace search is dependent on the NCIMcustom database having relevant up-to-date indexing.
The following notes describe use of the namespace parameter and associatedvalues:– The namespace parameter is not case sensitive– The parameter values, CUSTOM_TABLE and CUSTOM_FIELD, must be
separated by a dot (.).– The parameter values, CUSTOM_TABLE and CUSTOM_FIELD, are not case
sensitive and can include only alphabetic characters and the underscore (_)character. These parameter values must also begin with an alphabeticcharacter.
1. Log into the Tivoli Integrated Portal.2. In the browser Location bar, specify the previously described URL. After the
URL has been successfully submitted to the Tivoli Integrated Portal server thereare four possible scenarios:v Single match -- The specified entityName is unique in the NCIM custom
database table. The Structure Browser is launched and the selectedentityName is displayed in the context of the containing structure.
v Multiple matches -- The specified entityName exists in more than oneNetwork Manager domain and/or parent entity node. A new context pagedisplays the results using the following format:$DOMAIN_NAME/$CONTAINMENT_PATH_BY_ENTITYNAME
where– DOMAIN_NAME -- Specifies the Network Manager domain in which the
specified entityName resides.– CONTAINMENT_PATH_BY_ENTITYNAME -- Specifies the list of entities
that exist from the root entity to the entity specified in the entity smartsearch. Consider the following example where an entity smart search isperformed on an entity called SM00189990:DOMAIN1 NAP02513002/SM02513016/SM00189990
In the example, the containment path for the domain called DOMAIN1specifies the following entities:
– Root entity -- The root entity is the first entity in the list. In this example,the root entity is NAP02513002.
– Repeater entity -- Zero or more repeater entities can follow the root entity.In the example, there is one repeater entity, SM02513016.
– Search entity -- This is the entity specified in the entity smart search. Inthe example, the search entity is SM00189990.
Note: For some search results there will only be a root entity and the entityspecified in the entity smart search. For other search results there will be aroot entity, one or more repeater entities, and the entity specified in theentity smart search.
v Zero matches -- A results page displays that indicates there were no matchesin the NCIM custom database table for the specified entityName.
Chapter 2. Finding network devices 25
v Error -- A results page displays that indicates an error has occurred and thatthe search should be attempted again.
The following example shows the URL for an entity smart search across an NCIMcustom database table:https://tip01.ibm.com:16311/ibm/console/ncp_structureview/Search.do?selectEntityName=Tokyo&namespace=customns.location
wherev tip01.ibm.com -- Specifies the host name of the computer on which the Tivoli
Integrated Portal server was installed.v 16311 -- Specifies the port number associated with the host computer on which
the Tivoli Integrated Portal server was installed.v customns -- Specifies the name of the custom table in the extended NCIM
database in which to perform the search of the entity specified in entityName.v location -- Specifies name of the field to search within the customns custom
table.v Tokyo -- Specifies the name of the entity to search for in the customns custom
table. (This entity is linked to the entityId in the customns custom databasetable.)
26 IBM Tivoli Network Manager IP Edition: Network Troubleshooting Guide

Chapter 3. Identifying network problems
You can identify network problems in two ways: using network views or usingevent lists.
Identifying problems using network viewsUse network views to view the results of a discovery or to troubleshoot networkproblems.
Before you can work with network views the administrator must complete thefollowing tasks:v The first network discovery must have successfully completed.v The administrator must configure network views for you, either by dynamically
generating network views or by creating custom network views.
You can use different types of network view to monitor different types of devicesor device technologies.1. Click Network Availability > Network Views.2. In the Network Views tree on the left of the portlet, expand the network view
nodes by clicking the + symbols.3. Select a network view with an event status icon of severity minor or higher.
The network map displays subnets and devices in that network view. Faultydevices and subnets are marked with an event status icon. Names of faultydevices are highlighted in a color that corresponds to the event severity on thatdevice. Hover over a device in a network view to display summary informationabout the device.
Related tasks:“Investigating faulty devices” on page 35You can perform a range of diagnosis tasks on devices and subnets. You can showrelated network events. You can also drill into faulty network devices, displaySNMP MIB values, log into the faulty devices, and investigate the routes todevices.
Using the Network Health ViewUse the Network Health View to display events on a device.1. Click Availability > Network Availability > Network Health View. The
Network Health View page appears with the Network Views portlet aboveand the Active Event List (AEL) portlet below.
Note: When you first open the Network Health View page, the AEL portletdisplays all events in the ObjectServer.
2. Display a network view of interest in the Network Views portlet.3. Select a single device in the network map. The contents of the AEL portlet are
filtered to display only the events that occurred on the selected device.
Restriction: The contents of the AEL portlet are not filtered in the followingcases:v Multiple devices are selected in the Network Views portlet.
© Copyright IBM Corp. 2006, 2016 27

v A device is found and selected in the network map following a Find in Mapoperation.
In these cases no filter is applied and the AEL displays all events in theObjectServer.
Monitoring subnetsYou can determine whether there are events on any of the devices in your subnets.Use the Subnets network view to monitor subnets for events.
To monitor subnets using the Network Views, proceed as follows:1. Click Availability > Network Availability > Network Views.2. In the navigation tree on the left of the portlet, click the + symbol to expand
the Subnets network view nodes.3. Determine the most severe event in each subnet based on the associated event
status icon.4. Select the Subnet node with an event status icon of severity minor or higher.
The topology display panel displays devices in that network view and marksfaulty devices with an event status icon. Names of faulty devices arehighlighted in a color that corresponds to the event severity on that device.
You can perform any of the following actions on this device:v Investigate network routes to this devicev Drill into the device using the Structure Browser to investigate the health of
device componentsv Log into the device to examine processes running on the devicev Browse the MIB associated with this deviceRelated tasks:“Displaying events on a subnet” on page 36You can display events on all devices in a subnet by running the Show Eventscommand on a Subnet network view.
Monitoring device classesYou can determine whether there are events on any devices of a particular vendoror model. For example, you can monitor events on all your Sun devices or on allyour Cisco28xx devices.
Use the Device Classes network view to monitor devices of a particular vendor ormodel for events. The device classes reflect the Active Object Class (AOC)hierarchy. AOCs are based on vendor, type, and model family. To monitor deviceclasses such as Linux devices, Sun workstations, and Windows servers, proceed asfollows.1. Click Availability > Network Availability > Network Views.2. In the navigation tree on the left of the portlet, click the + symbol to expand
the Device Classes network view nodes.3. Identify a particular class of devices and locate the associated event status icon.
This icon indicates the most severe event on that device class. For example,identify the Linux node and locate the associated event status icon. This icontells you the most severe event on the Linux devices.
4. Select a faulty device class from the network view tree. For example, if theLinux node has an event status icon of severity minor or higher then select it.
28 IBM Tivoli Network Manager IP Edition: Network Troubleshooting Guide

The topology display panel displays devices of the selected class and marksfaulty devices with an event status icon.
You can perform any of the following actions on this device:v Investigate network routes to this devicev Drill into the device using the Structure Browser to investigate the health of
device componentsv Log into the device to examine processes running on the devicev Browse the MIB associated with this deviceRelated tasks:“Displaying events on a device” on page 35Use this network troubleshooting procedure to display all events on a faultydevice.
Monitoring linksBy monitoring the links between devices, you can determine the status of thedevices connected by the link. In addition, you can launch tools to diagnose theunderlying problem.
Your administrator can configure the display of the links as either colored, orcolored with an associated severity icon. They can also configure the thickness ofthe line based on the connection speed of the link. By default, these options are on.
The display of link status can be customized for each individual view.1. Open any view that displays the links between devices. An error status for a
link is indicated by a line with a color corresponding to the alert status, as wellas an associated severity status icon, if configured.
2. Hover over the link to display information about the link.3. Click a link to select it.4. Right-click a link to open the right-click menu.
From the right-click menu, you can do any of the following tasks:v Display the link events in the AEL. If you change the severity status of an event
in the AEL, this status will be filtered back to the link.v Ping the link end points.v Diagnose an underlying problem. For example, you can ping the IP addresses
either side of a link.v Unmanage the link and associated devices to prevent the devices at the link's
end points from being polled. Typically, you would unmanage a link whilemaintenance is carried out, and then manage it again once it has been restoredto working order.
Note: When you unmanage a link, you unmanage all connected interfaces. Thisis indicated by half-spanner icons at each end of the link.
v Manage the link and associated devices.
Chapter 3. Identifying network problems 29
Monitoring Border Gateway Protocol (BGP) networksYou can determine whether there are events on any devices in your BGP networks.Use the BGP Network network view to monitor BGP networks for events.
To monitor BGP networks, proceed as follows.1. Click Availability > Network Availability > Network Views.2. In the navigation tree on the left of the portlet, click the + symbol to expand
the BGP Network node. For each top-level node, an event status icon to theright of the tree indicates the status of devices in that node.
3. Determine the most severe event in each BGP network based on the associatedevent status icon.
4. If a BGP network node has an event status icon of severity minor or higherthen select it. The network map displays devices in that BGP network andmarks faulty devices with an event status icon.
5. Check the status of the following devices within the network map.a. EBGP speaker devices: EBGP speaker devices connect BGP ASs and are
essential for correct BGP network operation. In the network map, an EBGPspeaker device appears as a member of one BGP AS but is also connected toa separate EBGP speaker device that is a member of a different BGP AS.
b. Route reflector (RR) devices: Route reflector devices are responsible forcommunicating with a subset (cluster) of routers within an AS. Routereflectors perform peer operations with each other and hence avoid theneed to fully mesh BGP ASs. Correct operation of route reflectors istherefore essential for correct connections within the BGP AS. Routereflectors are marked with the label RR within the network map.
Related tasks:“Retrieving BGP information” on page 68Retrieve Border Gateway Protocol (BGP) information from devices in ordertroubleshoot BGP-related network issues.
Monitoring Open Shortest Path First (OSPF) routing domainsYou can determine whether there are events on any devices in your OSPF routingdomains and OSPF areas. Use the OSPF Routing Domains network view tomonitor OSPF routing domains and OSPF areas for events.
To monitor OSPF routing domains and OSPF areas, proceed as follows.1. Click Availability > Network Availability > Network Views.2. In the navigation tree on the left of the portlet, click the + symbol to expand
the OSPF Routing Domains node. For each top-level node, an event status iconto the right of the tree indicates the status of devices in that node.
3. Determine the most severe event in each OSPF routing domain based on theassociated event status icon.
4. If an OSPF routing domain node has an event status icon of severity minor orhigher, then select it. The network map displays devices in that routing domainand marks faulty devices with an event status icon.
5. Check the status of the following devices within the network map.a. Area border routers (ABRs): These routers connect two or more OSPF areas
and provide routing to other OSPF areas via the backbone network. ABRsare marked with the label ABR within the network map.
30 IBM Tivoli Network Manager IP Edition: Network Troubleshooting Guide
b. Autonomous system border routers (ASBRs): These routers communicate withother networks using an IGP protocol. ASBRs are marked with the labelASBR within the network map.
c. Designated routers (DRs) and backup designated routers (BDRs): DRs are OSPFrouter interfaces designated to provide a source for routing updates and soreduce the need to fully mesh connections when multi-access technologies,such as Ethernet, are used. A backup designated router (BDR) is alwayskept up to date to ease the transition should the primary DR fail. DRs aremarked with the label DR within the network map. Backup DRs are markedwith the label BDR within the network map.
d. Type 2 LSAs: Generated for every transit network within an area. A transitnetwork has at least two directly attached OSPF routers. Ethernet is anexample of a Transit Network. A Type 2 LSA lists each of the attachedrouters that make up the transit network and is generated by the DR.
Related tasks:“Retrieving OSPF information” on page 73Retrieve Open Shortest Path First protocol (OSPF) information from devices inorder to troubleshoot OSPF-related issues.
Monitoring multicast groups and routesYou can monitor multicast groups and routes to determine whether there are anyevents on the devices in those groups and routes.
PIM groups, IGMP groups, and IP Multicast routes can only be monitored if thediscovery has been configured to discover them. Views for these groups and routesare created automatically; you can also create them manually.
To monitor multicast groups, complete the following tasks.1. Click Availability > Network Availability > Network Views.v In the navigation tree on the left of the portlet, click the + symbol to expand
the IGMP Groups node. A list of the IGMP groups that have beendiscovered is displayed.
v In the navigation tree on the left of the portlet, click the + symbol to expandthe PIM network node. A list of the PIM groups that have been discovered isdisplayed.
v In the navigation tree on the left of the portlet, click the + symbol to expandthe Multicast Routing MDTs node. A list of the IP multicast routes that havebeen discovered is displayed. Multicast Distribution Trees (MDTs) are namedaccording to the (source, group address) notation. For example, an (S,G)notation of (172.20.1.6,224.0.0.1) shows that a device with an IP address of172.20.1.6 is a source sending data to the 224.0.0.1 group.
2. Determine the most severe event in each group based on the associated eventstatus icon.
Chapter 3. Identifying network problems 31

Monitoring MPLS Traffic Engineered tunnelsYou can monitor MPLS Traffic Engineered (TE) tunnels to determine whether thereare any events on the devices that comprise the tunnels.
MPLS TE tunnels can only be monitored if the discovery has been configured todiscover them.
To monitor MPLS TE tunnels, complete the following tasks.1. Click Availability > Network Availability > Network Views.2. In the navigation tree on the left of the portlet, click the + symbol to expand
the MPLS TE node. A list of the MPLS TE tunnels that have been discovered isdisplayed.
3. Determine the most severe event in each tunnel based on the associated eventstatus icon.
Monitoring VPLS VPNsYou can monitor Virtual Private LAN Service Virtual Private Networks (VPLSVPNS) to determine whether there are any events on the devices in the networks.
VPLS VPNs can only be monitored if the discovery has been configured todiscover them. VPLS VPN views are created automatically; you can also createthem manually.
To monitor VPLS VPNs, complete the following tasks.1. Click Availability > Network Availability > Network Views.2. In the navigation tree on the left of the portlet, click the + symbol to expand
the VPLS VPN views node. A list of the VPLS VPNs that have been discoveredis displayed.
3. Determine the most severe event in each VPN based on the associated eventstatus icon.
Monitoring aggregated network domainsFix Pack 4
You can monitor events from multiple domains within the same network view.
In order to monitor cross-domain network views, you must first create somecross-domain network views.1. Click Availability > Network Availability > Network Views.2. In the navigation tree on the left of the portlet, click the + symbol to expand a
network view that was created in the AGGREGATION domain.3. Determine the most severe event based on the associated event status icon. You
can hover the cursor over a device to see what domain the device is in.
32 IBM Tivoli Network Manager IP Edition: Network Troubleshooting Guide

Identifying problems using event listsYou can monitor all network events in a single event list. Use the Fault-FindingView to monitor network events.
To monitor all network events, proceed as follows.1. Click Availability > Network Availability > Fault-Finding View. The
Fault-Finding View page appears with the Active Event List (AEL) portletabove and the Network Hop View portlet below.
Note: When you first open the Fault-Finding View page, the AEL portletdisplays all events in the ObjectServer and the Network Hop View portlet isempty.
2. Select an event of interest in the AEL, or right-click an event and then clickBroadcast Topology Context. The Network Hop View portlet now displays thenetwork topology related to the selected event.
Restriction: Results vary if you select multiple events in the AEL.v If all the selected events occurred on the same network device, then the
Network Hop View portlet only displays the network topology related tothat device.
v If the selected events occurred on different devices, then the Network HopView portlet does not display any network topology .
Related tasks:“Investigating events” on page 37Use features of the Active Event List (AEL) to support network troubleshooting.You can use the AEL to show affected network devices, identify root-cause events,and identify events that have a major service impact.
Chapter 3. Identifying network problems 33

34 IBM Tivoli Network Manager IP Edition: Network Troubleshooting Guide

Chapter 4. Diagnosing network problems
Diagnose network problems using the network troubleshooting tools available inNetwork Manager.
Investigating faulty devicesYou can perform a range of diagnosis tasks on devices and subnets. You can showrelated network events. You can also drill into faulty network devices, displaySNMP MIB values, log into the faulty devices, and investigate the routes todevices.Related tasks:“Investigating network connections” on page 43Investigate network connections, trace routes, and create paths in order to checkconnectivity within your network.“Retrieving device information” on page 64Retrieving device information provides important information on the devices inyour network to support troubleshooting. Device information includes deviceconfiguration information, domain information, and detailed interface, protocol,and routing information.“Investigating the health of device components” on page 74Investigate the health of device components in order to isolate the fault within anetwork device.“Retrieving MIB information” on page 84Retrieve MIB variable information from network devices to diagnose networkproblems.
Displaying related eventsYou can retrieve event data associated with faulty devices and subnets.
Displaying events on a deviceUse this network troubleshooting procedure to display all events on a faultydevice.
To display events on a device:1. From the Network Hop View or Network Views, identify a faulty device in the
network map.2. Right-click the faulty device and click Show Events. An AEL opens in a
separate browser window containing the events on the selected device.
You can now perform any of the following actions on these events:v Identify the root cause of any of these events.v Identify service-affected events within this event list.Related tasks:“Investigating events” on page 37Use features of the Active Event List (AEL) to support network troubleshooting.You can use the AEL to show affected network devices, identify root-cause events,and identify events that have a major service impact.
© Copyright IBM Corp. 2006, 2016 35
Displaying events on a subnetYou can display events on all devices in a subnet by running the Show Eventscommand on a Subnet network view.
To display events on devices in a subnet:1. In the network view tree in the Network Views, expand the Subnets node.2. Determine the most severe event in each subnet based on the associated event
status icon.3. In the network map, right-click a subnet and choose Show Events. An AEL
appears in a separate browser window containing the events on the selectedsubnet.
You can perform any of the following actions on these events:v Identify the root cause of any of these events.v Identify service-affected events within this event list.Related tasks:“Investigating events” on page 37Use features of the Active Event List (AEL) to support network troubleshooting.You can use the AEL to show affected network devices, identify root-cause events,and identify events that have a major service impact.
Displaying events for a network viewDisplay events for all devices in a network view by clicking the icon next to theview name.
The event icon next to each network view shows the highest level of alert on adevice in the network view.
To view all events on devices in a network view, click the event icon next to theview name. An AEL opens in a separate browser window containing the events onthe selected network view.
Displaying a Network Hop View related to a network viewYou can switch from a network view containing a device to a Network Hop Viewcontaining the same device. Switch from a network view to a Network Hop Viewto navigate around the network by specifying increasing numbers of hops, orconnections, from the faulty device.
To switch from a network view to a Network Hop View.1. In the Network Views network map identify a device.2. Right-click the device and click Find in Network Hop View. The Network Hop
View appears in a separate browser window centred around the selecteddevice.
You can perform any of the following actions on this device:v Investigate network routes to this devicev Drill into the device using the Structure Browser to investigate the health of
device componentsv Log into the device to examine processes running on the devicev Browse the MIB associated with this device
36 IBM Tivoli Network Manager IP Edition: Network Troubleshooting Guide

Displaying network views related to a Network Hop ViewYou can determine which subnets, VLANs, or other network collections a deviceforms part of by switching from the Network Hop View to the Network Views.
To switch from the Network Hop View to the Network Views:1. In the Network Hop View topology display panel right-click a device and click
Find in Network View.2. Proceed as follows:v If a network view appears in a separate browser window, this means that the
device is found only in one network view.v If you are presented with a list of network views, this means that the device
is found in more than one network view. Select the network view of interestand click OK.
Investigating eventsUse features of the Active Event List (AEL) to support network troubleshooting.You can use the AEL to show affected network devices, identify root-cause events,and identify events that have a major service impact.
Note: Unmanaged events are events received from Tivoli Netcool/OMNIbusprobes (and possibly from other event sources) on devices or interfaces that havebeen marked as Unmanaged in Network Manager. An unmanaged device isusually marked Unmanaged because it is undergoing maintenance and maytherefore generate unnecessary network events. Network Manager can filter outunmanaged events from the AEL in the following ways:v Filtering out the unmanaged events so that they do not appear at all in the AEL.v Configuring the AEL to display the NmosManagedStatus field. This field
displays the value 1 (Operator unmanaged) or 2 (System unmanaged).
Check with your network administrator on how the system is configured to handlethe presentation of unmanaged events in the AEL.
Displaying related topology viewsTopology views show the network devices affected by an event. You can displaytwo types of topology view: network views and the Network Hop View.
Displaying the Network Hop View related to an eventDisplay the Network Hop View related to an event to see the affected networkdevice in context. This shows the network device affected by an event togetherwith a network map of the connected devices. You can also specify a number ofhops, or device connections, from the affected device.
Before you display a related Network Hop View, ensure that the event toinvestigate is selected in the Active Event List (AEL).
To display the Network Hop View related to an event:1. From an AEL window, right-click an event and click Find in Network Hop
View. The Network Hop View opens in a separate browser window. Thenetwork map is centered around the device affected by the selected event. TheSeed device field is populated with the IP address of the device on which thealert was raised.
Chapter 4. Diagnosing network problems 37

2. Use the navigation features in the Network Hop View toolbar to move aroundthe network.
You can perform any of the following actions on this device:v Investigate network routes to this devicev Drill into the device using the Structure Browser to investigate the health of
device componentsv Log into the device to examine processes running on the devicev Browse the MIB associated with this deviceRelated tasks:“Investigating network connections” on page 43Investigate network connections, trace routes, and create paths in order to checkconnectivity within your network.“Retrieving device information” on page 64Retrieving device information provides important information on the devices inyour network to support troubleshooting. Device information includes deviceconfiguration information, domain information, and detailed interface, protocol,and routing information.“Retrieving MIB information” on page 84Retrieve MIB variable information from network devices to diagnose networkproblems.“Investigating the health of device components” on page 74Investigate the health of device components in order to isolate the fault within anetwork device.
Displaying network views related to an eventDisplay network views related to an event to see the affected network device incontext. For example, the affected device may belong to a VLAN (one networkview) and may also belong to the Sun device class (another network view).1. Select an event in the Active Event List (AEL).2. In the AEL window, right-click and then click Find in Network View.3. Proceed as follows:v If a network view appears in a separate browser window, this means that the
affected device is found only in one network view.v If you are presented with a list of network views, this means that the
affected device is found in more than one network view. Select the networkview of interest and click OK.
4. Use the features in the Network Views toolbar to examine the devices in thenetwork map.
You can perform any of the following actions on this device:v Investigate network routes to this devicev Drill into the device using the Structure Browser to investigate the health of
device componentsv Log into the device to examine processes running on the devicev Browse the MIB associated with this deviceRelated tasks:“Investigating network connections” on page 43Investigate network connections, trace routes, and create paths in order to checkconnectivity within your network.
38 IBM Tivoli Network Manager IP Edition: Network Troubleshooting Guide
“Retrieving device information” on page 64Retrieving device information provides important information on the devices inyour network to support troubleshooting. Device information includes deviceconfiguration information, domain information, and detailed interface, protocol,and routing information.“Retrieving MIB information” on page 84Retrieve MIB variable information from network devices to diagnose networkproblems.“Investigating the health of device components” on page 74Investigate the health of device components in order to isolate the fault within anetwork device.
Investigating root causeA single network problem may generate multiple events. Use root-cause analysistools to determine a device that is causing other devices to show faults.
The event record contains a field that indicates whether an event is a root-cause ora suppressed event. The network administrator can configure the Active Event List(AEL) to display this field.
For information on root-cause scenarios and examples, see the IBM Tivoli NetworkManager IP Edition Event Management Guide.
About event correlation and root-cause analysisEvents received from network devices are correlated with the network topology.This enables the system to determine root-cause events and provides the ability toswitch between event data and network topology data.
Event correlation is the ability to analyze an event on one device and calculate theimpact on each connected device in the network topology. By performing eventcorrelation on each event received by the Tivoli Netcool/OMNIbus ObjectServer,the system is able to provide the following capabilities:v Root-cause analysisv Ability to switch between event data and network topology data
Root-cause analysis
Based on knowledge of the network topology, the system determines whichdevices are inaccessible due to other network failures. The system suppresses theevents on these inaccessible devices and marks them in the Active Event List(AEL) as symptom events. The system marks the non-symptom events as rootcause events.
Root cause events are differentiated from symptom events in the AEL in thefollowing ways:v Root-cause events have a higher severity than symptom events. This ensures
that root-cause events are given higher priority.v The system marks root-cause events and symptom events using a field in the
event record held in the ObjectServer. This provides the ability to identify theroot cause event related to symptom events.
Ability to switch between event data and network topology data
This capability provides two approaches to network troubleshooting.
Chapter 4. Diagnosing network problems 39

v You can initially identify network problems using events. Starting from an eventin the AEL, you can display a network map showing the affected device and thetopology around that device.
v Alternatively, you can initially identify network problems using topology data.Starting from a network view or the Network Hop View containing a faultydevice, you can display an AEL showing all the events for that device.
Identifying root cause eventsA single network problem may generate multiple events. You can use the ActiveEvent List (AEL) to identify the root-cause event.
Before you issue the command to identify the root-cause event, ensure that at leastone event is selected in the AEL.
To identify root-cause events:1. From an AEL window, right-click an event and click Show Root Cause. An
AEL opens in a separate browser window containing the root-cause event.2. Use the features in the AEL to further investigate this event.
You can perform any of the following actions on this event:v Display related topology viewsv Drill into the affected device to investigate the health of device componentsv Browse the MIB associated with the affected deviceRelated tasks:“Displaying related topology views” on page 37Topology views show the network devices affected by an event. You can displaytwo types of topology view: network views and the Network Hop View.“Retrieving related MIB information” on page 42As part of network troubleshooting activity, you can retrieve MIB information forthe device associated with a specified event in the Active Event List (AEL).“View the structure of the network device related to an event” on page 43As part of network troubleshooting activity, you can view the structure of a deviceassociated with a specified event in the Active Event List (AEL).
Investigating symptom eventsStarting from a root-cause event you can use the Active Event List (AEL) toidentify the symptom events.
Before you issue the command to identify the symptom events, ensure that at leastone event is selected in the AEL.1. From an AEL window, right-click an event and click Show Symptoms. An AEL
opens in a separate browser window containing symptom events.2. Use the features in the AEL to further investigate these events.
You can perform any of the following actions on these events:v Display related topology viewsv Drill into the affected device to investigate the health of device componentsv Browse the MIB associated with the affected deviceRelated tasks:“Displaying related topology views” on page 37Topology views show the network devices affected by an event. You can displaytwo types of topology view: network views and the Network Hop View.
40 IBM Tivoli Network Manager IP Edition: Network Troubleshooting Guide
“Retrieving related MIB information” on page 42As part of network troubleshooting activity, you can retrieve MIB information forthe device associated with a specified event in the Active Event List (AEL).“View the structure of the network device related to an event” on page 43As part of network troubleshooting activity, you can view the structure of a deviceassociated with a specified event in the Active Event List (AEL).
Investigating service-affected eventsService-Affected Events (SAEs) are events generated by Network Manager thatindicate that a network service, such as an MPLS VPN, has been affected as aresult of events from a device that supports the service.
Identifying service-affected eventsUse the SAEs in the Active Event List (AEL) to quickly identify networkservice-affecting events.
Network Manager uses the discovered topology and event data to create SAEs. AnSAE is generated on a service when a severity 5 (Critical) event occurs on a deviceor interface that is essential to that service. The SAEs themselves have a severity of4 (Major) and are colored orange in the AEL. The Summary field contains textindicating that the event is an SAE.1. Click on the color-coded severity indicator box corresponding to severity 5
(Major). The severity indicator boxes are located at the bottom of the AEL andthe corresponding color is orange.
2. Examine the Summary field of the Major severity events to determine whetherany of the events is an SAE.
Network Manager models MPLS Layer 3 VPNs and identifies the Provider-Edge toCustomer-Edge facing interfaces for each discovered VPN. When an event is raisedagainst one of these interfaces, Network Manager calculates that a specific VPNinstance could be affected by the event. Network Manager raises an SAE on theVPN and does not delete the original event.
You can perform any of the following actions on this event:v Display network events that contributed to a service-affected event.v Display related topology viewsv Drill into the affected device to investigate the health of device componentsv Browse the MIB associated with the affected deviceRelated tasks:“Identifying contributing events” on page 42Identify which events contributed to a service-affected event (SAE) in order toperform further troubleshooting activities to resolve the SAE.
Chapter 4. Diagnosing network problems 41
Identifying contributing eventsIdentify which events contributed to a service-affected event (SAE) in order toperform further troubleshooting activities to resolve the SAE.
Before identifying the contributing events, first identify the relevant SAE.
To identify contributing events:1. From an Active Event List (AEL) window, right-click an SAE and click Show
SAE Related Events. An AEL opens in a separate browser window containingthe events that contributed to the SAE.
2. Use the features in the AEL to further investigate these events.3. Optional: To identify contributing services, click Show SAE Related Services.
You can perform any of the following actions on these events:v Display related topology viewsv Drill into the affected device to investigate the health of device componentsv Browse the MIB associated with the affected deviceRelated tasks:“Displaying related topology views” on page 37Topology views show the network devices affected by an event. You can displaytwo types of topology view: network views and the Network Hop View.“Retrieving related MIB information”As part of network troubleshooting activity, you can retrieve MIB information forthe device associated with a specified event in the Active Event List (AEL).“View the structure of the network device related to an event” on page 43As part of network troubleshooting activity, you can view the structure of a deviceassociated with a specified event in the Active Event List (AEL).
Retrieving related MIB informationAs part of network troubleshooting activity, you can retrieve MIB information forthe device associated with a specified event in the Active Event List (AEL).
To retrieve MIB information related to an event:1. Select an event in the AEL.2. From an AEL window, right-click the selected event and click Show SNMP
MIB Browser. The SNMP MIB Browser appears in a separate browser windowwith the Host field populated with the IP address or device name of theaffected device.
3. Use the features in the SNMP MIB Browser to further investigate this event.Related tasks:“Issuing an SNMP MIB query” on page 86Issue a MIB query to retrieve MIB variables from network devices andsubsequently diagnose problems on those devices.
42 IBM Tivoli Network Manager IP Edition: Network Troubleshooting Guide

View the structure of the network device related to an eventAs part of network troubleshooting activity, you can view the structure of a deviceassociated with a specified event in the Active Event List (AEL).
Before you issue the command to drill into the affected device, ensure that theevent to investigate is selected in the Active Event List.1. Select an event in the AEL.2. From an AEL window, right-click an event and click Show Device Structure.
The Structure Browser opens in a separate browser window in tree modepopulated with component details for the affected device. The table mode ofthe Structure Browser is not available from the right-click menu.
3. Use the features in the Structure Browser tree to explore the device structureand investigate the health of device components.
Related tasks:“Identifying faulty components from the Structure Browser tree” on page 77Using the tree mode of the Structure Browser, you can identify a faulty componentin order to retrieve further details about the critical alert.
Investigating network connectionsInvestigate network connections, trace routes, and create paths in order to checkconnectivity within your network.
Showing device connectivityRun this command on a device in the network map to see the interfaces on thatdevice and associated connections for each interface.1. From the Network Hop View or Network Views select a device in the network
map. To select multiple devices, press Ctrl.2. Right-click one of the selected devices and click Show Connectivity
Information. A new browser window is displayed for each of the selecteddevices. The window contains a table with the following connectivityinformation. Each row in the table represents a device connection.
Local nodeSpecifies connectivity information for the selected device.
Entity nameSpecifies the IP address or hostname of the selected device.
Interface descriptionSpecifies descriptive information for a connected interface onthe selected device.
Interface typeSpecifies the interface type for the connected interface.
Neighbor nodeSpecifies connectivity information for devices connected to the selecteddevice.
Entity nameSpecifies the IP address or hostname of a device connected tothe selected device. Click this hyperlink to open a separatebrowser window showing connectivity information for thisdevice.
Chapter 4. Diagnosing network problems 43

Interface descriptionSpecifies descriptive information for an interface connected tothe selected device.
Interface typeSpecifies the interface type for an interface connected to theselected device.
Tracing the route to devicesTrace the route to devices in the network in order to troubleshoot connectivity. Youcan trace the route from your local client machine, from the Network Manager IPEdition server, or perform a remote traceroute from any Cisco or Juniper network
The following topics describe how to trace the route to devices.
Tracing the route from the serverTrace the route to devices from the Network Manager Server in order to checknetwork paths.
The following topics describe how to trace the route to devices from the NetworkManager Server.
Tracing the route to devices:
Trace the route to devices in the network map from the Network Manager IPEdition to check network paths.
To perform this procedure, you must be in the Network Views or in the NetworkHop View.1. From the Network Hop View or Network Views network map, select the device
to which to trace the route. To select multiple devices, press Ctrl.2. Right-click one of the selected devices and choose WebTools > Advanced
Traceroute. The results of the traceroute operation appear in one or moreseparate browser windows.
It is also possible to perform a custom traceroute by customizing the traceroutesettings.Related tasks:“Performing a custom traceroute”Trace the route to one or more devices in the network map from the NetworkManager to check the path to that device.
Performing a custom traceroute:
Trace the route to one or more devices in the network map from the NetworkManager to check the path to that device.
Restriction: Network Manager servers running on Windows can only specify alimited number of traceroute parameters. Some parameters are available only onUNIX operating systems.1. From the Network Hop View or Network Views network map, select the device
to ping. To select multiple devices, press Ctrl.2. Right-click one of the selected devices and choose WebTools > Launch
WebTools GUI....
44 IBM Tivoli Network Manager IP Edition: Network Troubleshooting Guide

3. From the WebTools Menu click traceroute.4. In the Advanced Traceroute Tool window, complete the relevant fields.
Target Specify a single IP address, hostname, or subnet, or a comma-separatedlist of IP addresses or hostnames to traceroute. The tool will attempt toping each address or hostname specified.
UNIX SendSpecify the number of packets at each hop. The default value is 3.
UNIX Packet SizeSpecify the size in bytes of each packet to send to the specified targets.The default value is 40.
UNIX Minimum TTLSpecify the minimum time to live (TTL) in hops for the packets usedfor this traceroute operation. The default value is 1.
Maximum TTLSpecify the maximum TTL in hops for the packets used for thistraceroute operation. The default value is 64.
UNIX Show: ASN at each hopSpecify whether the Autonomous System Number (ASN) should beresolved at each hop. This option is selected by default.
Show: Do not resolve IP addressesSpecify whether IP addresses must be resolved by the domain namesystem (DNS). This option is not selected by default.
UNIX Show: DNS SOASpecify whether to include DNS Start of Authority (SOA) record. TheSOA record includes information about the name of the server thatsupplied the data for the zone and the administrator of the zone. Thisoption is selected by default.
UNIX Show: Delay statistics at each hopSpecify whether to calculate and display statistics for minimum,average and maximum delay for each hop. This option is not selectedby default.
UNIX Show: Microsecond timestampsSpecify whether to use microsecond timestamps. This option is notselected by default.
Send: E-Mail To...Specify whether the results should be emailed to one or more listedrecipients. This option is not selected by default.
RecipientsSpecify a comma-separated list of recipients to which the results of thetool should be sent. This field is only displayed if Send: E-Mail To... isselected.
Use: Next hop on Any SuccessSpecify whether the tool should go to the next hop on any success. Thisoption is not selected by default.
UNIX Use: Parallel ProbingSpecify whether or tool should use parallel probing to increase thespeed of the traceroute. This option is selected by default.
Chapter 4. Diagnosing network problems 45

UNIX
Use: Abort after 10 hops without Response
Specify whether the tool should abort the traceroute after tenconsecutive hops without answer. This option is selected by default.
UNIX Use: RFC1191 Path MTU DiscoverySpecify whether the tool should determine the Maximum TransmissionUnit (MTU) of the path on which the traceroute operation is beingperformed. This option is not selected by default.
5. Click Start to launch the tool with the parameters specified. The results of theoperation appear in one or more separate browser windows.
Performing remote traceroute operationsPerform remote traceroute operations from Cisco and Juniper devices totroubleshoot device availability and latency issues.
The following topics describe how to perform remote traceroute operations.Related tasks:“Setting up login credentials” on page 63Configure login credentials in order to log into Cisco and Juniper devices, andvarious network troubleshooting activities from these devices; for example, remoteping and remote traceroute.
Performing a remote traceroute from Cisco or Juniper devices:
Perform a remote traceroute from one or more Cisco or Juniper devices to a targetdevice in order to troubleshoot device availability and latency issues.
If you want to automatically login into Cisco or Juniper devices, you must firstconfigure login credentials.1. From the Network Hop View or Network Views network map, select the Cisco
or Juniper device from which to perform the remote traceroute. To selectmultiple devices, press Ctrl. When selecting multiple devices, ensure that theyare all Cisco or all Juniper devices.
2. Right-click one of the selected devices and select one of the following menuoptions.
Type of device Menu option
Cisco Select WebTools > Cisco Tools... >Diagnostic Tools... > Traceroute from thisdevice...
Juniper Select WebTools > Juniper Tools... >Diagnostic Tools... > Traceroute from thisdevice...
3. From the Cisco or Juniper Traceroute Tool window, complete the relevant fields.
Note: This operation does not support IPv6 addresses.
From Cisco or Juniper device or devices from which to traceroute. Specify asingle IP address, hostname, or subnet, or a comma-separated list of IPaddresses or hostnames.
To Target device for the traceroute. Specify a single IP address orhostname.
46 IBM Tivoli Network Manager IP Edition: Network Troubleshooting Guide
Automatic LoginSpecify that you have already specified Telnet login credentials to usewhen running this tool. This is not selected by default.
UsernameSpecify a username to use for Telnet access to the devices specified inthe Query field. If you have specified multiple devices, then the logincredentials that you specify must be valid for all of these devices.
PasswordSpecify a password to use for Telnet access to the devices specified inthe Query field. If you have specified multiple devices, then the logincredentials that you specify must be valid for all of these devices.
PasscodeSpecify an optional security authentication measure. Complete this fieldonly if your network administrator has applied RSA SecurID two-factoruser authentication to the devices you wish to log into. Type thepasscode from your RSA SecurID token.
Note: Your passcode changes at regular 30 second intervals. Ensurethat you launch the tool immediately after supplying the passcode.
Send: E-Mail To...Specify whether the results should be emailed to one or more listedrecipients. This option is not selected by default.
RecipientsSpecify a comma-separated list of recipients to which the results of thetool should be sent. This field is only displayed if Send: E-Mail To... isselected.
4. Click Start to launch the tool with the parameters specified. The results of theping operation appear in one or more separate browser windows.
Performing a remote traceroute to a device within an LSP:
Perform a remote traceroute to a device within a Multiprotocol Label Switching(MPLS) label-switched path (LSP) from a specified Cisco provider-edge (PE) routerin order to troubleshoot the MPLS core network.
In order to perform this procedure, first ensure the following:v You are in an MPLS VPN network view.v If you want to automatically log into the Cisco or Juniper devices, you must first
configure login credentials.1. In the network map, select the Cisco PE router from which you wish perform
the LSP traceroute. To select multiple devices, press Ctrl.2. Right-click on one of the selected devices and choose the menu option
WebTools > Cisco Tools... > Diagnostic Tools... > LSP Traceroute from thisdevice....
3. Complete the fields in the Cisco LSP Traceroute Tool window.
From Specify the Cisco device or devices to LSP traceroute from. This fieldaccepts a comma-separated list of IP addresses or hostnames.
Target FEC and MaskSpecify the forward-equivalency class (FEC) and netmask. The FEC is aclassification of a group of packets. All packets assigned to an FEC
Chapter 4. Diagnosing network problems 47

receive the same routing treatment. This tool accepts FECs based on IPaddress. Therefore, this field accepts a single IP address and a netmask.
Automatic LoginSpecify that you have already specified Telnet login credentials to usewhen running this tool. This is not selected by default.
UsernameSpecify a username to use for Telnet access to the devices specified inthe Query field. If you have specified multiple devices, then the logincredentials that you specify must be valid for all of these devices.
PasswordSpecify a password to use for Telnet access to the devices specified inthe Query field. If you have specified multiple devices, then the logincredentials that you specify must be valid for all of these devices.
PasscodeSpecify an optional security authentication measure. Complete this fieldonly if your network administrator has applied RSA SecurID two-factoruser authentication to the devices you wish to log into. Type thepasscode from your RSA SecurID token.
Note: Your passcode changes at regular 30 second intervals. Ensurethat you launch the tool immediately after supplying the passcode.
Send: E-Mail To...Specify whether the results should be emailed to one or more listedrecipients. This option is not selected by default.
RecipientsSpecify a comma-separated list of recipients to which the results of thetool should be sent. This field is only displayed if Send: E-Mail To... isselected.
4. Click Start to launch the tool with the parameters specified. The results of theping operation appear in one or more separate browser windows.
Performing a remote traceroute to a device within a VPN:
Perform a remote traceroute to a device within a virtual private network (VPN)from a specified Cisco provider-edge (PE) router in order to troubleshoot VPNconnectivity.
In order to perform this procedure, first ensure the following:v You are in an MPLS VPN network view.v If you want to automatically log into the Cisco or Juniper devices, you must first
configure login credentials.1. In the network map, select the Cisco PE router from which you wish perform
the VPN traceroute. To select multiple devices, press Ctrl.2. Right-click one of the selected devices and choose WebTools > Cisco Tools... >
Diagnostic Tools... > VRF Traceroute from this device....3. Complete the fields in the Cisco VRF Traceroute Tool window.
From Specify the Cisco device or devices from which to perform a VRFtraceroute. This field accepts a comma-separated list of IP addresses orhostnames.
To Specify a target device for the traceroute. This field accepts a single IPaddress or hostname.
48 IBM Tivoli Network Manager IP Edition: Network Troubleshooting Guide
VRF Specify the Virtual Routing and Forwarding table (VRF) that containsthe device.
Automatic LoginSpecify that you have already specified Telnet login credentials to usewhen running this tool. This is not selected by default.
UsernameSpecify a username to use for Telnet access to the devices specified inthe Query field. If you have specified multiple devices, then the logincredentials that you specify must be valid for all of these devices.
PasswordSpecify a password to use for Telnet access to the devices specified inthe Query field. If you have specified multiple devices, then the logincredentials that you specify must be valid for all of these devices.
PasscodeSpecify an optional security authentication measure. Complete this fieldonly if your network administrator has applied RSA SecurID two-factoruser authentication to the devices you wish to log into. Type thepasscode from your RSA SecurID token.
Note: Your passcode changes at regular 30 second intervals. Ensurethat you launch the tool immediately after supplying the passcode.
Send: E-Mail To...Specify whether the results should be emailed to one or more listedrecipients. This option is not selected by default.
RecipientsSpecify a comma-separated list of recipients to which the results of thetool should be sent. This field is only displayed if Send: E-Mail To... isselected.
4. Click Start to launch the tool with the parameters specified. The results of theping operation appear in one or more separate browser windows.
Visualizing a network pathA network path view displays every device and link encountered between the startand end devices. Issues affecting devices and links on that path are displayedgraphically. You can edit the path view manually by excluding devices from theview. You can retrace a path, or edit it before retracing it. You can also copy a pathview to another view container, or delete it.
Before you can work with network paths, the administrator must have successfullycompleted the first network discovery, and network views must be configured foryour user ID.
You can only edit or retrace IP paths. MPLS TE paths are populated duringdiscovery and cannot be edited or retraced.
Note: MPLS TE paths are displayed by default under the itnmadmin views. Thiscan be altered by editing the $ITNMHOME/profiles/TIPProfile/etc/tnm/topoviz.properties file and changing the values for the following view attributes:v topoviz.pathview.accesslevelv topoviz.pathview.accessid
Chapter 4. Diagnosing network problems 49
1. Click Network Availability > Path Views. The Path Views window opens. Anynetwork paths that have been created are shown.
2. To interact with network paths, use the following buttons:
Views drop-downUse to find and display a specific path view. Path views are arrangedin a tree structure based on path view container types, for example,'AUTO', 'IP Paths', 'itnmadmin', or 'Client Views'.
Each path view displays the view name, the number of hops in thepath, and the highest severity alert (if any) associated with that pathview.
Note: You can click the severity icon to launch the Active Event Listwith that event selected. You can also select a device, and then clickFind In Network View or Find In Hop View from the context menu.
New path Opens the Trace IPv4 Network Path window, where you can create anew path view.
Note: IP path views only.
Depending on the user roles set by your administrator for your userID, you may be able to save the new path to your list of path views.
Edit path Click here to edit a path view that is currently being displayed. TheTrace IPv4 Network Path window opens populated with the details forthe path, any of which can be changed. You trace and display theedited path by clicking Save and Trace.
Note: IP path views only.
Retrace path Click here to retrace the path between the devices in the currentlyselected path view. Paths between devices in a network are dynamic,and therefore trace results may be different each time a path is retraced.
Note: IP path views only.
Copy or move path Opens the Copy or Move Path dialog. Use to copy or move a selectedpath to a different view container.
Delete path Click here to delete the path view that is currently being displayed. Ifthe path view is the last view in a container, the container will bedeleted as well.
Note: The path stored in the NCIM database is not deleted. If any userrecreates the deleted path with the same settings, a new trace occursand the existing path in the NCIM database is updated with the newtrace results.
50 IBM Tivoli Network Manager IP Edition: Network Troubleshooting Guide

Toggle search Displays a search box below the toolbar from which you can search fora view.
Save Saves the view or view container.
Save as Image Saves the view or view as an image.
Print Prints the view or view container.
Find in Map Searches for a device in the topology map.
Select Changes the cursor to select mode. When the cursor is in select mode,if you click a device in the topology display panel that device isselected.
Pan Changes the cursor to pan mode. When the cursor is in pan mode, the
cursor changes to the following icon: . Click and hold the leftmouse button to grab the topology; you can then use the mouse tomove the topology.
Select Zoom Changes the cursor to select-zoom mode. When the cursor is inselect-zoom mode, you can use the mouse to draw a rectangle over aparticular area of the topology. When you release the mouse button, thescreen zooms in to the rectangle you have drawn.
Interactive Zoom Changes the cursor to interactive-zoom mode. When the cursor is ininteractive zoom mode, hold down the mouse button and move thecursor up to zoom out, and while hold down the mouse button andmove the cursor down to zoom in.
Toggle Overview Displays an overview of the current view on a new page.
Zoom In Zooms in to the view.
Chapter 4. Diagnosing network problems 51
Zoom Out Zooms out of the view.
Fit in Window Fits the current view to the size of the Topology Display window.
Hierarchical Layout Changes the format of the view to a hierarchical layout. This option isnot available for views that cannot contain connectivity information,such as Unassigned network views.
Symmetric Layout Changes the format of the view to a symmetrical layout. This option isnot available for views that cannot contain connectivity information,such as Unassigned network views.
Orthogonal Layout Changes the format of the view to an orthogonal layout. This option isnot available for views that cannot contain connectivity information,such as Unassigned network views.
Circular Layout Changes the format of the view to a circular layout. This option is notavailable for views that cannot contain connectivity information, suchas Unassigned network views.
If you chose to create a new path or retrace an existing path, then Path Viewwindow displays the devices resulting from your search.
Note: If the path was not successfully traced, then you get a path trace error,indicating the reason that the path could not be traced. Path trace errorsinclude the following:v One of the devices along the path was unable to provide the necessary
SNMP routing data within the specified timeout. For example, the devicemight be set to non-forwarding mode.
v Input parameters specified in the Trace an IPv4 Path window are invalid.v An IP address in the path did not respond to ping verification.v Time to trace the path exceeds one of the path trace timeouts.v A communication error occurred while the path trace was trying to
communicate with the Topology manager, ncp_model, or with the NCIMtopology database.
Possible reasons for these errors include the following:v SNMP access for at least one of the devices along the path has not been
correctly configured.v This device does not make the necessary SNMP MIB routing information
available.v This device is not running an SNMP agent.v Path trace timeouts are too short.
52 IBM Tivoli Network Manager IP Edition: Network Troubleshooting Guide
You can take one or more of the following actions to resolve these errors:v Click View Path Trace Details for detailed log information on the error.v Check, and if necessary, correct the SNMP community string settings for this
device in the Discovery Configuration GUI.v Check, and if necessary, correct the MIB settings for this device using the
SNMP MIB Browser.v Increase the length of the path trace timeouts.v Correct the parameters specified in the Trace an IPv4 Path window and
retrace the path.v Check that the Topology manager, ncp_model, is running and that the NCIM
topology database is accessible.
Pinging devices and subnetsPing devices in the network in order to check connectivity. You can ping from yourlocal client machine, from the Network Manager IP Edition server, or remote pingfrom any Cisco or Juniper network device.
The following topics describe how to ping devices and subnets.
Pinging from the local clientPing one or more devices in the network map from your client machine to checkconnectivity to that device.1. From the Network Hop View or Network Views network map select the device
to ping. To select multiple devices, press Ctrl.2. Right-click one of the selected devices and choose Ping from this host. This
launches the generic ping tool on the local machine and pings the selecteddevice or devices.
Pinging from the serverPing devices and subnets, from the Network Manager Server in order to checkconnectivity.
The following topics describe how to ping devices and subnets from the NetworkManager server. The ping from the server uses TCP echo and not ICMP.
Pinging devices:
Ping one or more devices in the network map from the Network Manager IPEdition server to check connectivity to that device.1. From the Network Hop View or Network Views network map select the device
to ping. To select multiple devices, press Ctrl.2. Right-click one of the selected devices and choose WebTools > Advanced Ping
The results of the ping operation appear in one or more separate browserwindows.
It is also possible to perform a custom ping by customizing the ping settings.Related tasks:“Performing a custom device ping” on page 54Ping one or more devices in the network map from the Network Manager serverusing custom settings to check connectivity to that device.
Chapter 4. Diagnosing network problems 53

Performing a custom device ping:
Ping one or more devices in the network map from the Network Manager serverusing custom settings to check connectivity to that device.
Restriction: Network Manager servers running on Windows can only specify alimited number of ping parameters. Some parameters are available only on UNIXoperating systems.1. From the Network Hop View or Network Views network map select the device
to ping. To select multiple devices, press Ctrl.2. Right-click one of the selected devices and choose WebTools > Launch
WebTools GUI....3. In the WebTools Menu click ping.4. In the Advanced Ping Tool window complete the relevant fields.
Target Specify the IP addresses or hostnames of the devices that you wish toping. Specify a single IP address, hostname, or subnet, or acomma-separated list of IP addresses or hostnames. The tool willattempt to ping each address or hostname specified.
Send Specify the number of ping packets to send to each of the specifieddevices. The default value is 1.
Packet SizeSpecify the size in bytes of each packet to send to the specified targets.The default value is 56.
UNIX No. RetriesSpecify the number of retries to make for each target specified. Thedefault value is 3.
Show: DNS Resolved IP AddressesSpecify whether or not IP addresses must be resolved by the domainname system (DNS). This option is selected by default.
UNIX Show: Elapsed Time on Return PacketsSpecify whether or not elapsed times to complete the ping operationshould be displayed. This option is not selected by default.
UNIX Show: Final SummarySpecify whether or not to include a final summary. This option isselected by default.
Send: E-Mail To...Specify whether or not the results should be emailed to one or morelisted recipients. This option is not selected by default.
RecipientsSpecify a comma-separated list of recipients to which the results of thetool should be sent. This field is only displayed if Send: E-Mail To... isselected.
5. Click Start to launch the tool with the parameters specified. The results of theping operation appear in one or more separate browser windows.
54 IBM Tivoli Network Manager IP Edition: Network Troubleshooting Guide
Pinging subnets (UNIX only): UNIX
Ping one or more subnets in the network map from the Network Manager serverto check connectivity to that subnet.
Restriction: This task is only available if your Network Manager server is runningon UNIX.1. From the Network Hop View or Network Views network map, select any
device.2. Right-click the selected device and choose WebTools > Launch WebTools
GUI.... The WebTools Menu appears3. From the WebTools Menu click subnet ping.4. In the Advanced Subnet Ping Tool window, complete the relevant fields.
CIDR SubnetSubnets to ping. Specify a single subnet in Classless Inter-DomainRouting (CIDR) notation; for example,10.1.1.0/24. The tool will attemptto ping each IP address within the specified subnet.
Send Specify the number of ping packets to send to each of the specifieddevices. The default value is 1.
Packet SizeSpecify the size in bytes of each packet to send to the specified targets.The default value is 56.
No. RetriesSpecify the number of retries to make for each target specified. Thedefault value is 3.
Show: DNS Resolved IP AddressesSpecify whether IP addresses must be resolved by the domain namesystem (DNS). This option is selected by default.
Show: Elapsed Time on Return PacketsSpecify whether elapsed times to complete the ping operation shouldbe displayed. This option is not selected by default.
Show: Final SummarySpecify whether to include a final summary. This option is selected bydefault.
Send: E-Mail To...Specify whether the results should be emailed to one or more listedrecipients. This option is not selected by default.
RecipientsSpecify a comma-separated list of recipients to which the results of thetool should be sent. This field is only displayed if Send: E-Mail To... isselected.
5. Click Start to launch the tool with the parameters specified. The results of theping operation appear in one or more separate browser windows.
Chapter 4. Diagnosing network problems 55

Performing remote ping operationsPerform remote ping operations from Cisco and Juniper devices to troubleshootdevice availability and latency issues.
The following topics describe how to perform remote ping operations.Related tasks:“Setting up login credentials” on page 63Configure login credentials in order to log into Cisco and Juniper devices, andvarious network troubleshooting activities from these devices; for example, remoteping and remote traceroute.
Performing a remote ping from Cisco or Juniper devices:
Perform a remote ping from one or more Cisco or Juniper devices to a targetdevice to troubleshoot device availability and latency issues.
If you want to automatically login into Cisco or Juniper devices, you must firstconfigure login credentials.1. From the Network Hop View or Network Views network map, select the Cisco
or Juniper device from which you wish perform the remote ping. To selectmultiple devices, press Ctrl. When selecting multiple devices, ensure that theyare all Cisco or all Juniper devices.
2. Right-click one of the selected devices and select one of the following menuoptions.
Type of device Menu option
Cisco Select WebTools > Cisco Tools... >Diagnostic Tools... > Ping from thisdevice....
Juniper Select WebTools > Juniper Tools... >Diagnostic Tools... > Ping from thisdevice...
3. In the Cisco or Juniper Ping Tool window complete the relevant fields.
Note: This operation does not support IPv6 addresses.
From Cisco or Juniper device or devices to ping from. Specify a single IPaddress, hostname, or subnet, or a comma-separated list of IP addressesor hostnames.
To Target device for the ping. Specify a single IP address or hostname.
Automatic LoginSpecify that you have already specified Telnet login credentials to usewhen running this tool. This is not selected by default.
UsernameSpecify a username to use for Telnet access to the devices specified inthe Query field. If you have specified multiple devices, then the logincredentials that you specify must be valid for all of these devices.
PasswordSpecify a password to use for Telnet access to the devices specified inthe Query field. If you have specified multiple devices, then the logincredentials that you specify must be valid for all of these devices.
56 IBM Tivoli Network Manager IP Edition: Network Troubleshooting Guide

PasscodeSpecify an optional security authentication measure. Complete this fieldonly if your network administrator has applied RSA SecurID two-factoruser authentication to the devices you wish to log into. Type thepasscode from your RSA SecurID token.
Note: Your passcode changes at regular 30 second intervals. Ensurethat you launch the tool immediately after supplying the passcode.
Send: E-Mail To...Specify whether the results should be emailed to one or more listedrecipients. This option is not selected by default.
RecipientsSpecify a comma-separated list of recipients to which the results of thetool should be sent. This field is only displayed if Send: E-Mail To... isselected.
4. Click Start to launch the tool with the parameters specified. The results of theping operation appear in one or more separate browser windows.
Remote pinging a device within an LSP:
Ping a device within a Multiprotocol Label Switching (MPLS) label-switched path(LSP) from a specified Cisco provider-edge (PE) router in order to troubleshoot theMPLS core network.
In order to perform this procedure, first ensure the following:v You are in an MPLS VPN network view.v If you want to automatically log into the Cisco or Juniper devices, you must first
configure login credentials.1. In the network map, select the Cisco PE router from which you wish perform
the LSP ping. To select multiple devices, press Ctrl.2. Using the right mouse button, click on one of the selected devices and choose
the menu option WebTools > Cisco Tools... > Diagnostic Tools... > LSP Pingfrom this device...
3. Complete the fields in the Cisco LSP Ping Tool window.
From Specify a Cisco device or devices to LSP ping from. This field accepts acomma-separated list of IP addresses or hostnames.
Target FEC and MaskSpecify the IPv4 forward-equivalency class (FEC) and netmask. TheFEC is a classification of a group of packets. All packets assigned to anFEC are routed in the same way. This tool accepts FECs based on IPaddress. Therefore, this field accepts a single IP address and a netmask.
Automatic LoginSpecify that you have already specified Telnet login credentials to usewhen running this tool. This is not selected by default.
UsernameSpecify a username to use for Telnet access to the devices specified inthe Query field. If you have specified multiple devices, then the logincredentials that you specify must be valid for all of these devices.
PasswordSpecify a password to use for Telnet access to the devices specified in
Chapter 4. Diagnosing network problems 57
the Query field. If you have specified multiple devices, then the logincredentials that you specify must be valid for all of these devices.
PasscodeSpecify an optional security authentication measure. Complete this fieldonly if your network administrator has applied RSA SecurID two-factoruser authentication to the devices you wish to log into. Type thepasscode from your RSA SecurID token.
Note: Your passcode changes at regular 30 second intervals. Ensurethat you launch the tool immediately after supplying the passcode.
Send: E-Mail To...Specify whether the results should be emailed to one or more listedrecipients. This option is not selected by default.
RecipientsSpecify a comma-separated list of recipients to which the results of thetool should be sent. This field is only displayed if Send: E-Mail To... isselected.
4. Click Start to launch the tool with the parameters specified. The results of theping operation appear in one or more separate browser windows.
Remote pinging a device within a VPN:
Ping a device within a virtual private network (VPN) from a specified Ciscoprovider-edge (PE) router in order to troubleshoot VPN connectivity.
In order to perform this procedure, first ensure the following:v You are in an MPLS VPN network view.v If you want to automatically log into the Cisco or Juniper devices, you must first
configure login credentials.1. In the network map, select the Cisco PE router from which you wish perform
the VPN ping. To select multiple devices, press Ctrl.2. Right-click on one of the selected devices and choose WebTools > Cisco Tools...
> Diagnostic Tools... > VRF Ping from this device....3. Complete the fields in the Cisco VRF Ping Tool window.
From Specify the Cisco device or devices to VRF ping from. This field acceptsa comma-separated list of IP addresses or hostnames.
To Specify the target device for the ping. This field accepts a single IPaddress or hostname.
VRF Specify the Virtual Routing and Forwarding table (VRF) that containsthe device of interest.
Automatic LoginSpecify that you have already specified Telnet login credentials to usewhen running this tool. This is not selected by default.
UsernameSpecify a username to use for Telnet access to the devices specified inthe Query field. If you have specified multiple devices, then the logincredentials that you specify must be valid for all of these devices.
PasswordSpecify a password to use for Telnet access to the devices specified in
58 IBM Tivoli Network Manager IP Edition: Network Troubleshooting Guide

the Query field. If you have specified multiple devices, then the logincredentials that you specify must be valid for all of these devices.
PasscodeSpecify an optional security authentication measure. Complete this fieldonly if your network administrator has applied RSA SecurID two-factoruser authentication to the devices you wish to log into. Type thepasscode from your RSA SecurID token.
Note: Your passcode changes at regular 30 second intervals. Ensurethat you launch the tool immediately after supplying the passcode.
Send: E-Mail To...Specify whether the results should be emailed to one or more listedrecipients. This option is not selected by default.
RecipientsSpecify a comma-separated list of recipients to which the results of thetool should be sent. This field is only displayed if Send: E-Mail To... isselected.
4. Click Start to launch the tool with the parameters specified. The results of theping operation appear in one or more separate browser windows.
Retrieving Cisco and Juniper route informationRetrieve routing information from Cisco and Juniper devices to troubleshootrouting issues.
The following topics describe how to retrieve routing information from Cisco andJuniper devices.Related tasks:“Setting up login credentials” on page 63Configure login credentials in order to log into Cisco and Juniper devices, andvarious network troubleshooting activities from these devices; for example, remoteping and remote traceroute.
Retrieving Cisco route informationRetrieve route information from a selected Cisco device to a specific target (deviceor subnet) in order to troubleshoot device availability and latency issues.
If you want to automatically log into Cisco or Juniper devices, you must firstconfigure login credentials.1. From the Network Hop View or Network Views network map, select the Cisco
device at the beginning of the route. To select multiple devices, press Ctrl.When selecting multiple devices, ensure that they are all Cisco devices.
2. Right-click one of the selected devices and choose WebTools > Cisco Tools... >Diagnostic Tools... > View a route....
3. In Cisco Route Information Tool window complete the required fields.
Note: This operation does not support IPv6 addresses.
Query Specify a single IP address, hostname, or subnet, or a comma-separatedlist of IP addresses, hostnames, or subnets.
Note: If you are retrieving route information for a device within avirtual private network (VPN), then the content of this field must bethe IP address or hostname of a single provider-edge (PE) router
Chapter 4. Diagnosing network problems 59
adjacent to the relevant VPN. The option to retrieve route informationfor a device within a VPN only applies to Cisco devices.
Route Specify IP address or hostname of a target device. The tool providesroute information from the device or devices specified in the Queryfield, to this target device.
Show VRF RouteSpecify that you wish to retrieve route information for a device withina specified virtual routing and forwarding table (VRF). Selecting thisoption toggles the VRF field, where you can specify the relevant VRF.
Note: This option is only available for Cisco devices.
VRF Specifies a VRF related to the VPN containing the device for which toobtain routing information.
Automatic LoginSpecify that you have already specified Telnet login credentials to usewhen running this tool. This is not selected by default.
UsernameSpecify a username to use for Telnet access to the devices specified inthe Query field. If you have specified multiple devices, then the logincredentials that you specify must be valid for all of these devices.
PasswordSpecify a password to use for Telnet access to the devices specified inthe Query field. If you have specified multiple devices, then the logincredentials that you specify must be valid for all of these devices.
PasscodeSpecify an optional security authentication measure. Complete this fieldonly if your network administrator has applied RSA SecurID two-factoruser authentication to the devices you wish to log into. Type thepasscode from your RSA SecurID token.
Note: Your passcode changes at regular 30 second intervals. Ensurethat you launch the tool immediately after supplying the passcode.
Send: E-Mail To...Specify whether the results should be emailed to one or more listedrecipients. This option is not selected by default.
RecipientsSpecify a comma-separated list of recipients to which the results of thetool should be sent. This field is only displayed if Send: E-Mail To... isselected.
4. Click Start to launch the tool with the parameters specified. The results of theoperation appear in one or more separate browser windows.
60 IBM Tivoli Network Manager IP Edition: Network Troubleshooting Guide

Retrieving Juniper route informationRetrieve route information from a selected Juniper device to a specific target(device or subnet) to troubleshoot device availability and latency issues.
If you want to automatically login into Cisco or Juniper devices, you must firstconfigure login credentials.1. From the Network Hop View or Network Views network map, select the
Juniper device at the beginning of the route. To select multiple devices, pressCtrl. When selecting multiple devices, ensure that they are all Juniper devices.
2. Right-click one of the selected devices and choose WebTools > Juniper Tools...> Diagnostic Tools... > View a route....
3. In the Juniper Route Information Tool window complete the required fields.
Note: This operation does not support IPv6 addresses.
Query Specify a single IP address, hostname, or subnet, or a comma-separatedlist of IP addresses, hostnames, or subnets.
Route Specify IP address or hostname of a target device. The tool providesroute information from the device or devices specified in the Queryfield, to this target device.
Automatic LoginSpecify that you have already specified Telnet login credentials to usewhen running this tool. This is not selected by default.
UsernameSpecify a username to use for Telnet access to the devices specified inthe Query field. If you have specified multiple devices, then the logincredentials that you specify must be valid for all of these devices.
PasswordSpecify a password to use for Telnet access to the devices specified inthe Query field. If you have specified multiple devices, then the logincredentials that you specify must be valid for all of these devices.
PasscodeSpecify an optional security authentication measure. Complete this fieldonly if your network administrator has applied RSA SecurID two-factoruser authentication to the devices you wish to log into. Type thepasscode from your RSA SecurID token.
Note: Your passcode changes at regular 30 second intervals. Ensurethat you launch the tool immediately after supplying the passcode.
Send: E-Mail To...Specify whether the results should be emailed to one or more listedrecipients. This option is not selected by default.
RecipientsSpecify a comma-separated list of recipients to which the results of thetool should be sent. This field is only displayed if Send: E-Mail To... isselected.
4. Click Start to launch the tool with the parameters specified. The results of theoperation appear in one or more separate browser windows.
Chapter 4. Diagnosing network problems 61
Retrieving VRF route informationRetrieve information on a specific VRF instance to troubleshoot routes from the PErouter.
In order to perform this procedure, first ensure the following.v You are in an MPLS VPN network view.v If you want to automatically log into the Cisco or Juniper devices, you must first
configure login credentials.1. In the network map, select the Cisco PE router from which you wish retrieve
VRF route information. To select multiple devices, press Ctrl.2. Right-click one of the selected devices and choose WebTools > Cisco Tools... >
Information Tool... > View VRF Information....3. Complete the fields in the Cisco VRF Information Tool window.
Query Specify the IP address or hostname or a Cisco PE router containing theVRF of interest.
VRF Specify the VRF for which you wish to retrieve information.
Automatic LoginSpecify that you have already specified Telnet login credentials to usewhen running this tool. This is not selected by default.
UsernameSpecify a username to use for Telnet access to the devices specified inthe Query field. If you have specified multiple devices, then the logincredentials that you specify must be valid for all of these devices.
PasswordSpecify a password to use for Telnet access to the devices specified inthe Query field. If you have specified multiple devices, then the logincredentials that you specify must be valid for all of these devices.
PasscodeSpecify an optional security authentication measure. Complete this fieldonly if your network administrator has applied RSA SecurID two-factoruser authentication to the devices you wish to log into. Type thepasscode from your RSA SecurID token.
Note: Your passcode changes at regular 30 second intervals. Ensurethat you launch the tool immediately after supplying the passcode.
Send: E-Mail To...Specify whether the results should be emailed to one or more listedrecipients. This option is not selected by default.
RecipientsSpecify a comma-separated list of recipients to which the results of thetool should be sent. This field is only displayed if Send: E-Mail To... isselected.
4. Click Start to launch the tool with the parameters specified. The results of theping operation appear in one or more separate browser windows.
62 IBM Tivoli Network Manager IP Edition: Network Troubleshooting Guide

Setting up login credentialsConfigure login credentials in order to log into Cisco and Juniper devices, andvarious network troubleshooting activities from these devices; for example, remoteping and remote traceroute.
You can configure Telnet login details (username and password) using the XMLconfiguration file provided for each WebTool. One set of login details can beconfigured for each WebTool. Passwords specified in the WebTools configurationfiles are plain-text . If you configure Telnet login details within these files, then it isrecommended that you apply appropriate security measures to the WebToolsdirectory, NCHOME/precision/scripts/webtools/etc.
You can configure multiple usernames and passwords in the XML configurationfile. To configure login details:1. Open the XML configuration file for the web tool you want to configure. These
configuration files are held at the following location: NCHOME/precision/scripts/webtools/etc.
2. Within the XML code, locate the login section.3. Specify login details as follows:
a. Username: within the username section, specify one or more usernames.b. Password: within the password section, specify one or more passwords. If
you configure a single username and password for a WebTool then the tooluses these same login details when performing a Telnet login into all thedevices specified.
Note: If the login details vary across the devices you wish to log into andyou wish to run the same web tool on multiple devices simultaneously, thenyou must configure multiple usernames and passwords. In this case, theweb tool attempts to log into each device using each combination ofusername and password until it finds a successful combination. This canhave an impact on the time taken for the web tool to log into all devices.
4. Save the XML configuration file.
Now that you have configured login details for a specific WebTool then you canautomatically access these details by clicking the Automatic checkbox in the toolwindow.Related tasks:“Performing remote ping operations” on page 56Perform remote ping operations from Cisco and Juniper devices to troubleshootdevice availability and latency issues.“Performing remote traceroute operations” on page 46Perform remote traceroute operations from Cisco and Juniper devices totroubleshoot device availability and latency issues.“Retrieving Cisco and Juniper route information” on page 59Retrieve routing information from Cisco and Juniper devices to troubleshootrouting issues.
Chapter 4. Diagnosing network problems 63

Retrieving device informationRetrieving device information provides important information on the devices inyour network to support troubleshooting. Device information includes deviceconfiguration information, domain information, and detailed interface, protocol,and routing information.
The following topics describe how to retrieve device information.
Logging into a deviceUse Telnet to log into a network device to troubleshoot a device. This command isnot available on Windows 2008 and Windows Vista operating systems.
Restriction: This command is not available on Windows 2008 and Windows Vistaoperating systems. This is because the Telnet client is not installed by default onthose operating systems.1. From the Network Hop View or Network Views network map, select the device
to log into. To select multiple devices, press Ctrl.2. Right-click one of the selected devices and choose Telnet. This launches a
command prompt, issues a Telnet command to the local machine and displaysthe progress of the Telnet login in the command prompt.
Querying domain registration informationQuery domain registration information in order to determine the organization orindividual responsible for a specified IP address or IP address range or to resolveIP addresses or hostnames.
The following topics describe how to query domain registration information.
Querying Internet registry databasesQuery Internet registry databases in order to determine the organization orindividual responsible for a specified IP address or IP address range. You can alsoretrieve other information, including contact details, and server and IP addressinginformation.
The following topics describe how to query Internet registry databases.
Issuing a standard Internet registry database query:
Query an Internet registry database in order to determine the organization orindividual responsible for a specified IP address or IP address range.
By default, this operation queries the RIPE database. This is the Réseaux IPEuropéens, which is the regional Internet registry for Europe, the Middle East andparts of Central Asia,1. From the Network Hop View or Network Views network map, select the device
to query. To select multiple devices, press Ctrl.2. Right-click one of the selected devices and choose WebTools > Whois Lookup.
The results of the lookup operation appear in one or more separate browserwindows.
You can also query Internet registries for other geographies, by issuing a customInternet registry database query.Related tasks:
64 IBM Tivoli Network Manager IP Edition: Network Troubleshooting Guide
“Issuing a custom Internet registry database query”Query an Internet registry database in order to determine the organization orindividual responsible for a specified IP address or IP address range. Using customqueries, you can retrieve information from Internet registries for geographies otherthan the default Réseaux IP Européens (RIPE) registry, which is the regionalInternet registry for Europe, the Middle East and parts of Central Asia.
Issuing a custom Internet registry database query:
Query an Internet registry database in order to determine the organization orindividual responsible for a specified IP address or IP address range. Using customqueries, you can retrieve information from Internet registries for geographies otherthan the default Réseaux IP Européens (RIPE) registry, which is the regionalInternet registry for Europe, the Middle East and parts of Central Asia.1. From the Network Hop View or Network Views network map, select the device
to query. To select multiple devices, press Ctrl.2. Right-click one of the selected devices and choose WebTools > Launch
WebTools GUI....3. From the WebTools Menu click Whois lookup.4. In the Whois Lookup Tool window complete the relevant fields.
Query forSpecify the IP addresses or hostnames of the devices to query. Specify asingle IP address, hostname, or subnet, or a comma-separated list of IPaddresses or hostnames. This field also accepts a search string.
DatabaseSpecify the Internet registry database to query. The following databasesmay be queried:v AFRINIC: Africa Network Information Center, the regional Internet
registry for Africa.v ARIN: American Registry for Internet Numbers, the regional Internet
registry for Canada, many islands in the Caribbean and NorthAtlantic ocean, and the United States
v APNIC: Asia Pacific Network Information Centre, the regionalInternet registry for the Asia-Pacific region.
v JPIRR: Japan Network Information Center, the regional Internetregistry for Japan.
v LACNIC: Latin American and Caribbean Internet Addresses Registry,the regional Internet registry for Latin America and the Caribbean.
v RADB: Routing Assets Database is a public registry of routinginformation for networks in the Internet.
v RIPE: Réseaux IP Européens, the regional Internet registry forEurope, the Middle East and parts of Central Asia
v VERIO: Verio is a global IP service provider.
Send: E-Mail To...Specify whether the results should be emailed to one or more listedrecipients. This option is not selected by default.
RecipientsSpecify a comma-separated list of recipients to which the results of thetool should be sent. This field is only displayed if Send: E-Mail To... isselected.
Chapter 4. Diagnosing network problems 65
5. Click Start to launch the tool with the parameters specified. The results of theoperation appear in one or more separate browser windows.
Performing DNS lookupsPerform DNS lookups in order to resolve IP addresses or hostnames.
The following topics describe how to perform DNS lookups.
Issuing a standard DNS lookup:
Issue a Domain Name System (DNS) lookup in order to resolve IP addresses orhostnames.
By default, this operation retrieves DNS address (A) records only.1. From the Network Hop View or Network Views network map, select the device
to query. To select multiple devices, press Ctrl.2. Right-click one of the selected devices and choose the menu option WebTools >
DNS Lookup. The results of the lookup operation appear in one or moreseparate browser windows.
You can also retrieve other record types, such as mail exchange (MX) records byissuing a custom DNS lookup.Related tasks:“Issuing a custom DNS lookup”Issue a Domain Name System (DNS) lookup in order to resolve IP addresses orhostnames. Using custom DNS lookups, you can retrieve non-standard DNS recordtypes, such as mail exchange (MX) records.
Issuing a custom DNS lookup:
Issue a Domain Name System (DNS) lookup in order to resolve IP addresses orhostnames. Using custom DNS lookups, you can retrieve non-standard DNS recordtypes, such as mail exchange (MX) records.1. From the Network Hop View or Network Views network map, select the device
to query. To select multiple devices, press Ctrl.2. Right-click on one of the selected devices and choose WebTools > Launch
WebTools GUI....3. From the WebTools Menu click DNS lookup.4. In the DNS Lookup Tool window complete the relevant fields.
Query forSpecify the IP addresses or hostnames of the devices to query. Specify asingle IP address, hostname, or subnet, or a comma-separated list of IPaddresses and/or hostnames. This field also accepts a search string.
Type Specify the type of record to query in DNS. You can query any of thefollowing types:v ANY: any recordv A: address recordsv CNAME: canonical name recordsv HINFO: host information recordsv MINFO: mailbox information recordsv MX: mail exchange records
66 IBM Tivoli Network Manager IP Edition: Network Troubleshooting Guide
v NS: name server recordsv PTR: pointer recordsv SOA: start of authority recordsv TXT: text records
Send: E-Mail To...Specify whether the results should be emailed to one or more listedrecipients. This option is not selected by default.
RecipientsSpecify a comma-separated list of recipients to which the results of thetool should be sent. This field is only displayed if Send: E-Mail To... isselected.
5. Click Start to launch the tool with the parameters specified. The results of theoperation appear in one or more separate browser windows.
Retrieving protocol information from Cisco and Juniperdevices
Retrieve detailed interface, protocol, and routing information from Cisco andJuniper devices in order to support troubleshooting activities.
The following topics describe how to retrieve detailed interface, protocol, androuting information from Cisco and Juniper devices.
Retrieving interface administrative and operational statusRetrieve interface information in order to determine the operational andadministrative status of interfaces on selected devices.
You can only launch this command on Cisco and Juniper devices.1. From the Network Hop View or Network Views network map, select the device
to query. To select multiple devices, press Ctrl.2. Right-click one of the selected devices and select one of the following menu
options.
Type of device Menu option
Cisco Select WebTools > Cisco Tools... >Information Tools... > View BGPInformation...
Juniper Select WebTools > Juniper Tools... >Information Tools... > View BGPInformation...
3. In the Cisco or Juniper Information Tool window complete the relevant fields.
Note: This operation does not support IPv6 addresses.
Query Specify a single IP address, hostname, or a comma-separated list of IPaddresses or hostnames. IP addresses for selected devices automaticallyappear in this field.
View Specify the type of information to retrieve from the device.
Automatic LoginSpecify that you have already specified Telnet login credentials to usewhen running this tool. This is not selected by default.
Chapter 4. Diagnosing network problems 67
UsernameSpecify a username to use for Telnet access to the devices specified inthe Query field. If you have specified multiple devices, then the logincredentials that you specify must be valid for all of these devices.
PasswordSpecify a password to use for Telnet access to the devices specified inthe Query field. If you have specified multiple devices, then the logincredentials that you specify must be valid for all of these devices.
PasscodeSpecify an optional security authentication measure. Complete this fieldonly if your network administrator has applied RSA SecurID two-factoruser authentication to the devices you wish to log into. Type thepasscode from your RSA SecurID token.
Note: Your passcode changes at regular 30 second intervals. Ensurethat you launch the tool immediately after supplying the passcode.
Send: E-Mail To...Specify whether the results should be emailed to one or more listedrecipients. This option is not selected by default.
RecipientsSpecify a comma-separated list of recipients to which the results of thetool should be sent. This field is only displayed if Send: E-Mail To... isselected.
4. Click Start to launch the tool with the parameters specified. The results of theoperation appear in one or more separate browser windows.
Retrieving BGP informationRetrieve Border Gateway Protocol (BGP) information from devices in ordertroubleshoot BGP-related network issues.
You can only launch this command on Cisco and Juniper devices.1. From the Network Hop View or Network Views network map, select the device
to query. To select multiple devices, press Ctrl.2. Using the right mouse button, click on one of the selected devices and select
one of the following menu options.
Type of device Menu option
Cisco Select WebTools > Cisco Tools... >Information Tools... > View BGPInformation...
Juniper Select WebTools > Juniper Tools... >Information Tools... > View BGPInformation...
3. In the Cisco or Juniper Information Tool window complete the relevant fields.
Note: This operation does not support IPv6 addresses.
Query Specify a single IP address, hostname, or a comma-separated list of IPaddresses or hostnames. IP addresses for selected devices automaticallyappear in this field.
View Specify the type of information to retrieve from the device.
68 IBM Tivoli Network Manager IP Edition: Network Troubleshooting Guide
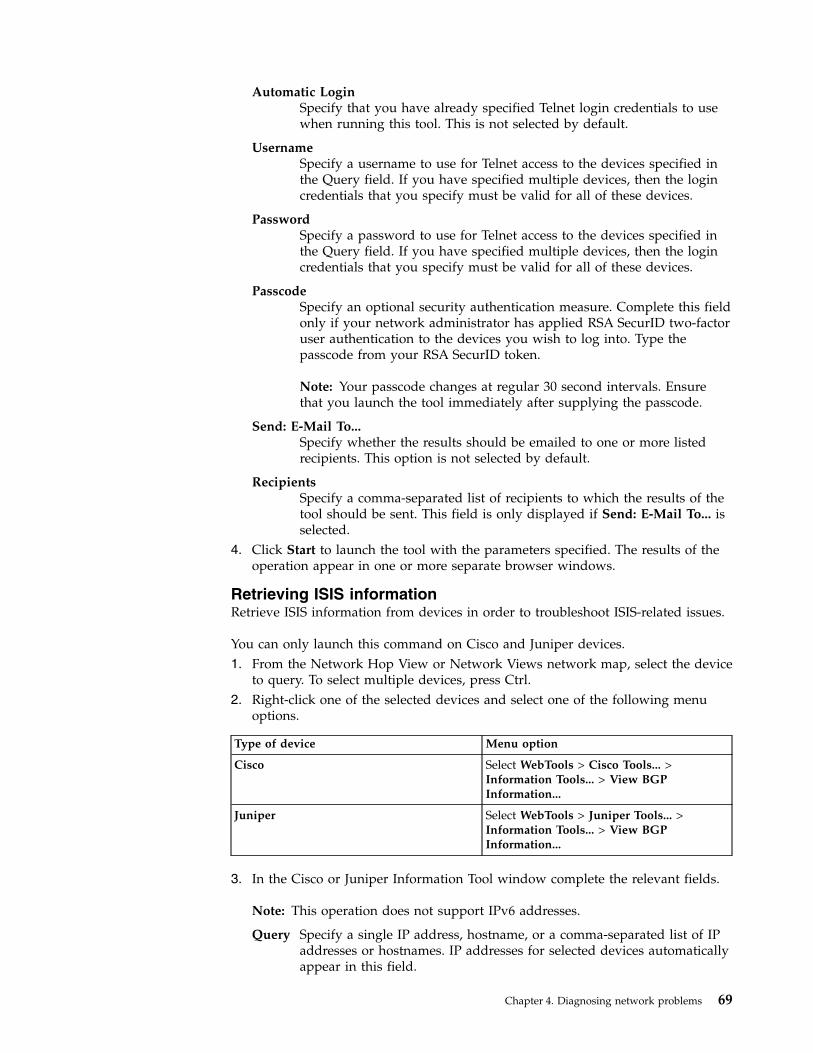
Automatic LoginSpecify that you have already specified Telnet login credentials to usewhen running this tool. This is not selected by default.
UsernameSpecify a username to use for Telnet access to the devices specified inthe Query field. If you have specified multiple devices, then the logincredentials that you specify must be valid for all of these devices.
PasswordSpecify a password to use for Telnet access to the devices specified inthe Query field. If you have specified multiple devices, then the logincredentials that you specify must be valid for all of these devices.
PasscodeSpecify an optional security authentication measure. Complete this fieldonly if your network administrator has applied RSA SecurID two-factoruser authentication to the devices you wish to log into. Type thepasscode from your RSA SecurID token.
Note: Your passcode changes at regular 30 second intervals. Ensurethat you launch the tool immediately after supplying the passcode.
Send: E-Mail To...Specify whether the results should be emailed to one or more listedrecipients. This option is not selected by default.
RecipientsSpecify a comma-separated list of recipients to which the results of thetool should be sent. This field is only displayed if Send: E-Mail To... isselected.
4. Click Start to launch the tool with the parameters specified. The results of theoperation appear in one or more separate browser windows.
Retrieving ISIS informationRetrieve ISIS information from devices in order to troubleshoot ISIS-related issues.
You can only launch this command on Cisco and Juniper devices.1. From the Network Hop View or Network Views network map, select the device
to query. To select multiple devices, press Ctrl.2. Right-click one of the selected devices and select one of the following menu
options.
Type of device Menu option
Cisco Select WebTools > Cisco Tools... >Information Tools... > View BGPInformation...
Juniper Select WebTools > Juniper Tools... >Information Tools... > View BGPInformation...
3. In the Cisco or Juniper Information Tool window complete the relevant fields.
Note: This operation does not support IPv6 addresses.
Query Specify a single IP address, hostname, or a comma-separated list of IPaddresses or hostnames. IP addresses for selected devices automaticallyappear in this field.
Chapter 4. Diagnosing network problems 69

View Specify the type of information to retrieve from the device.
Automatic LoginSpecify that you have already specified Telnet login credentials to usewhen running this tool. This is not selected by default.
UsernameSpecify a username to use for Telnet access to the devices specified inthe Query field. If you have specified multiple devices, then the logincredentials that you specify must be valid for all of these devices.
PasswordSpecify a password to use for Telnet access to the devices specified inthe Query field. If you have specified multiple devices, then the logincredentials that you specify must be valid for all of these devices.
PasscodeSpecify an optional security authentication measure. Complete this fieldonly if your network administrator has applied RSA SecurID two-factoruser authentication to the devices you wish to log into. Type thepasscode from your RSA SecurID token.
Note: Your passcode changes at regular 30 second intervals. Ensurethat you launch the tool immediately after supplying the passcode.
Send: E-Mail To...Specify whether the results should be emailed to one or more listedrecipients. This option is not selected by default.
RecipientsSpecify a comma-separated list of recipients to which the results of thetool should be sent. This field is only displayed if Send: E-Mail To... isselected.
4. Click Start to launch the tool with the parameters specified. The results of theoperation appear in one or more separate browser windows.
Retrieving MBGP informationRetrieve MBGP information from devices in order to troubleshoot MBGP-relatedissues.
To perform this procedure, you must be in the Network Views or in the NetworkHop View.
You can only launch this command on Cisco devices.1. In the network map select the device to query. To select multiple devices, press
Ctrl.2. Using the right mouse button, click on one of the selected devices and select
the appropriate menu option:
Type of device Menu option
Cisco Choose the menu option WebTools > CiscoTools...> Information Tools...> View MBGPInformation...
Juniper Choose the menu option WebTools >Juniper Tools...> Information Tools...> ViewMBGP Information...
The Cisco or Juniper Information Tool window appears.
70 IBM Tivoli Network Manager IP Edition: Network Troubleshooting Guide
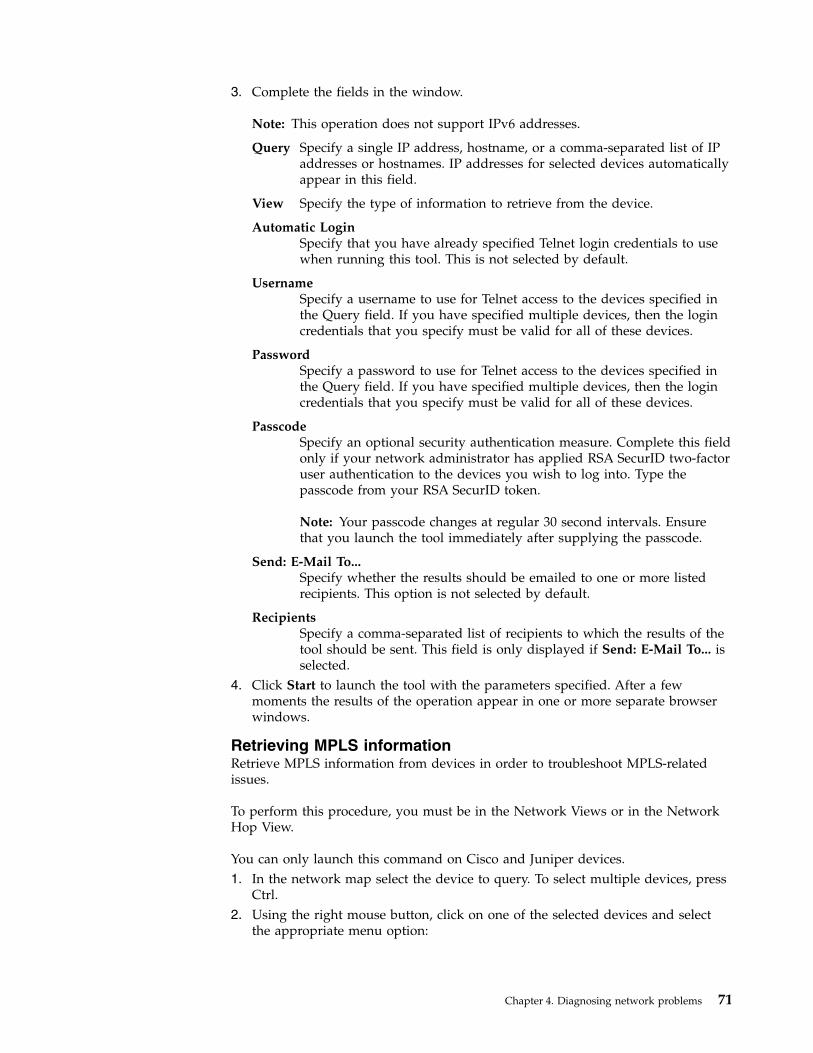
3. Complete the fields in the window.
Note: This operation does not support IPv6 addresses.
Query Specify a single IP address, hostname, or a comma-separated list of IPaddresses or hostnames. IP addresses for selected devices automaticallyappear in this field.
View Specify the type of information to retrieve from the device.
Automatic LoginSpecify that you have already specified Telnet login credentials to usewhen running this tool. This is not selected by default.
UsernameSpecify a username to use for Telnet access to the devices specified inthe Query field. If you have specified multiple devices, then the logincredentials that you specify must be valid for all of these devices.
PasswordSpecify a password to use for Telnet access to the devices specified inthe Query field. If you have specified multiple devices, then the logincredentials that you specify must be valid for all of these devices.
PasscodeSpecify an optional security authentication measure. Complete this fieldonly if your network administrator has applied RSA SecurID two-factoruser authentication to the devices you wish to log into. Type thepasscode from your RSA SecurID token.
Note: Your passcode changes at regular 30 second intervals. Ensurethat you launch the tool immediately after supplying the passcode.
Send: E-Mail To...Specify whether the results should be emailed to one or more listedrecipients. This option is not selected by default.
RecipientsSpecify a comma-separated list of recipients to which the results of thetool should be sent. This field is only displayed if Send: E-Mail To... isselected.
4. Click Start to launch the tool with the parameters specified. After a fewmoments the results of the operation appear in one or more separate browserwindows.
Retrieving MPLS informationRetrieve MPLS information from devices in order to troubleshoot MPLS-relatedissues.
To perform this procedure, you must be in the Network Views or in the NetworkHop View.
You can only launch this command on Cisco and Juniper devices.1. In the network map select the device to query. To select multiple devices, press
Ctrl.2. Using the right mouse button, click on one of the selected devices and select
the appropriate menu option:
Chapter 4. Diagnosing network problems 71
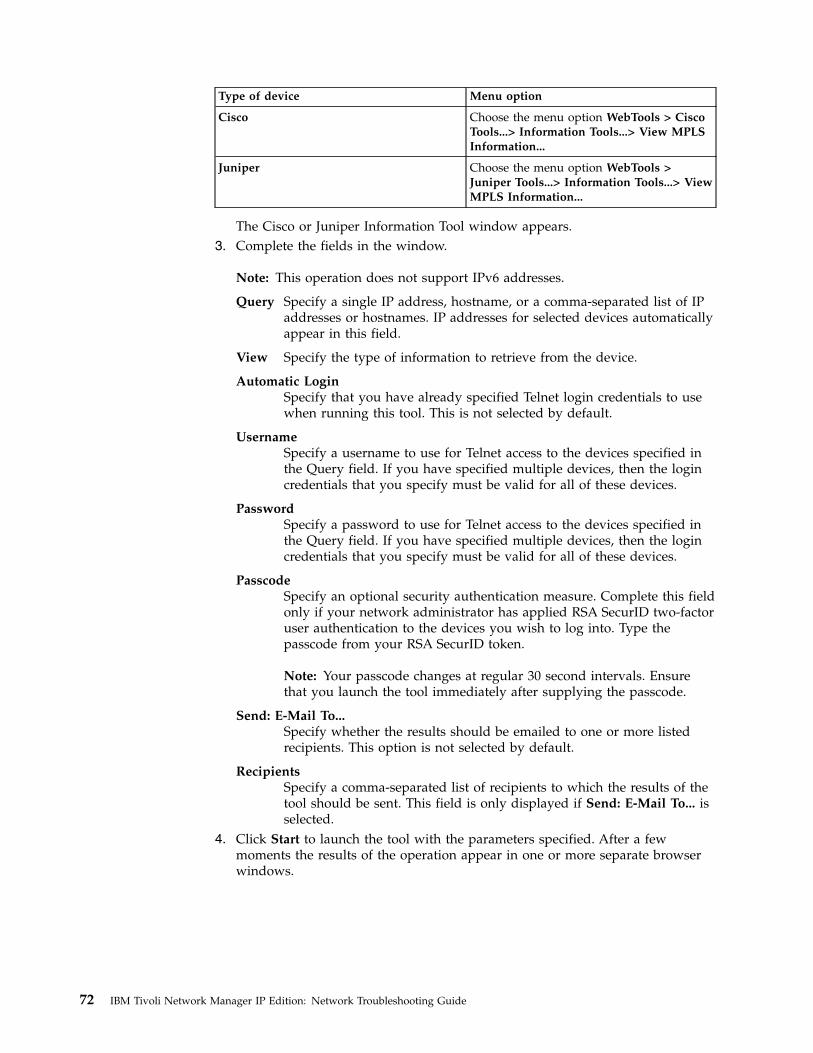
Type of device Menu option
Cisco Choose the menu option WebTools > CiscoTools...> Information Tools...> View MPLSInformation...
Juniper Choose the menu option WebTools >Juniper Tools...> Information Tools...> ViewMPLS Information...
The Cisco or Juniper Information Tool window appears.3. Complete the fields in the window.
Note: This operation does not support IPv6 addresses.
Query Specify a single IP address, hostname, or a comma-separated list of IPaddresses or hostnames. IP addresses for selected devices automaticallyappear in this field.
View Specify the type of information to retrieve from the device.
Automatic LoginSpecify that you have already specified Telnet login credentials to usewhen running this tool. This is not selected by default.
UsernameSpecify a username to use for Telnet access to the devices specified inthe Query field. If you have specified multiple devices, then the logincredentials that you specify must be valid for all of these devices.
PasswordSpecify a password to use for Telnet access to the devices specified inthe Query field. If you have specified multiple devices, then the logincredentials that you specify must be valid for all of these devices.
PasscodeSpecify an optional security authentication measure. Complete this fieldonly if your network administrator has applied RSA SecurID two-factoruser authentication to the devices you wish to log into. Type thepasscode from your RSA SecurID token.
Note: Your passcode changes at regular 30 second intervals. Ensurethat you launch the tool immediately after supplying the passcode.
Send: E-Mail To...Specify whether the results should be emailed to one or more listedrecipients. This option is not selected by default.
RecipientsSpecify a comma-separated list of recipients to which the results of thetool should be sent. This field is only displayed if Send: E-Mail To... isselected.
4. Click Start to launch the tool with the parameters specified. After a fewmoments the results of the operation appear in one or more separate browserwindows.
72 IBM Tivoli Network Manager IP Edition: Network Troubleshooting Guide
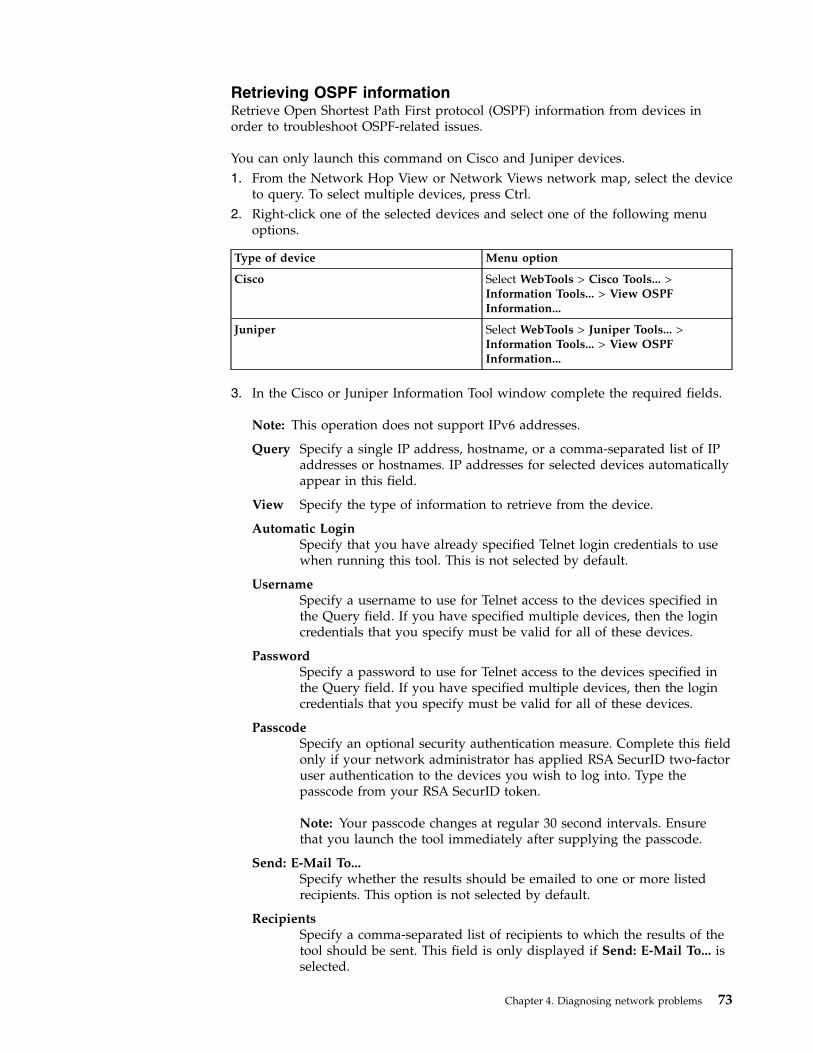
Retrieving OSPF informationRetrieve Open Shortest Path First protocol (OSPF) information from devices inorder to troubleshoot OSPF-related issues.
You can only launch this command on Cisco and Juniper devices.1. From the Network Hop View or Network Views network map, select the device
to query. To select multiple devices, press Ctrl.2. Right-click one of the selected devices and select one of the following menu
options.
Type of device Menu option
Cisco Select WebTools > Cisco Tools... >Information Tools... > View OSPFInformation...
Juniper Select WebTools > Juniper Tools... >Information Tools... > View OSPFInformation...
3. In the Cisco or Juniper Information Tool window complete the required fields.
Note: This operation does not support IPv6 addresses.
Query Specify a single IP address, hostname, or a comma-separated list of IPaddresses or hostnames. IP addresses for selected devices automaticallyappear in this field.
View Specify the type of information to retrieve from the device.
Automatic LoginSpecify that you have already specified Telnet login credentials to usewhen running this tool. This is not selected by default.
UsernameSpecify a username to use for Telnet access to the devices specified inthe Query field. If you have specified multiple devices, then the logincredentials that you specify must be valid for all of these devices.
PasswordSpecify a password to use for Telnet access to the devices specified inthe Query field. If you have specified multiple devices, then the logincredentials that you specify must be valid for all of these devices.
PasscodeSpecify an optional security authentication measure. Complete this fieldonly if your network administrator has applied RSA SecurID two-factoruser authentication to the devices you wish to log into. Type thepasscode from your RSA SecurID token.
Note: Your passcode changes at regular 30 second intervals. Ensurethat you launch the tool immediately after supplying the passcode.
Send: E-Mail To...Specify whether the results should be emailed to one or more listedrecipients. This option is not selected by default.
RecipientsSpecify a comma-separated list of recipients to which the results of thetool should be sent. This field is only displayed if Send: E-Mail To... isselected.
Chapter 4. Diagnosing network problems 73
4. Click Start to launch the tool with the parameters specified. The results of theoperation appear in one or more separate browser windows.
Retrieving Virtual Private LAN Service (VPLS) informationRetrieve Virtual Private LAN Service (VPLS) information from devices in order totroubleshoot VPLS-related issues.
You can only launch this command on Cisco and Juniper devices.1. From the Network Hop View or Network Views network map, select the device
to query. To select multiple devices, press Ctrl.2. Right-click one of the selected devices and select Webtools > Launch Webtools
GUI.3. Select one of the following menu options.
Type of device Menu option
Cisco Select Cisco Tools... > Information Tools... >View VPLS Information...
Juniper Select Juniper Tools... > Information Tools...> View VPLS Information...
4. For Cisco devices, select one of the following menu options.
Option Description
Show vfi Displays VPLS information.
Show xconnect all Displays information about cross connectsconfigured on the device.
Show mpls l2transport vc Displays information about all pseudowiresconfigured on the device.
5. For Juniper devices, select one of the following menu options.
Option Description
Show vpls connections Displays VPLS-related pseudowires.
Show vpls mac-table Displays MAC table entries associated withcorresponding VFI and VPLS instances.
Show vpls statistics Displays statistical information about allVPLS configured on the device.
Investigating the health of device componentsInvestigate the health of device components in order to isolate the fault within anetwork device.
Use the Structure Browser to investigate the health of device components.
74 IBM Tivoli Network Manager IP Edition: Network Troubleshooting Guide

Viewing the structure of a network deviceUse the Structure Browser to view the internal structure of the device andinvestigate the health of the device components.
The following topics describe how to use the Structure Browser to view theinternal structure of a device.
Using the Structure Browser with the Network Hop ViewView the structure of a device displayed in the Hop View and investigate thehealth of the device components using the Structure Browser.
When you launch the Network Hop View, the Structure Browser opens in a portletbelow the Network Hop View. The Structure Browser opens in either tree or tablemode, depending how it has been configured.1. Click Availability > Network Availability > Hop View. The Network Hop
View page appears with the Network Hop View portlet above and theStructure Browser portlet below.
Note: When you first open the Network Hop View, the Structure Browser isempty.
2. Display a device in the Network Hop View. For information about displayingdevices in the Network Hop View, see the IBM Tivoli Network Manager IPEdition Network Visualization Setup Guide.
3. From the Network Hop View, select the device for which you wish to show thestructure. The Structure Browser is automatically updated to show a tree ortable for the selected device. You can now investigate faulty components usingthe tree or table mode.
Related tasks:“Customizing Structure Browser preferences” on page 82The administrator can change configuration settings for the Structure Browser. Editthe configuration files to change the appearance of the Structure Browser.“Switching between tree and table mode in the Structure Browser” on page 81If the Structure Browser is displayed as a portlet, you can choose to display theStructure Browser in tree mode or table mode.“Identifying faulty components from the Structure Browser tree” on page 77Using the tree mode of the Structure Browser, you can identify a faulty componentin order to retrieve further details about the critical alert.“Identifying faulty components from the Structure Browser table” on page 78Using the table mode of the Structure Browser, you can identify a faultycomponent in order to retrieve further details about the critical alert.“Searching the node text in the Structure Browser tree” on page 80You can search for a value within the nodes in the Structure Browser tree.
Chapter 4. Diagnosing network problems 75

Viewing the structure of a device from the Network ViewsShow the structure of devices from a network map in order to view the devicecomponents.1. In the Network Views network map, select a device to view components for the
selected device. Press the Ctrl key to select multiple devices.2. Right-click one of the selected devices and choose Show Device Structure. The
Structure Browser tree displays the structure of the selected device.
Note: The Structure Browser table is only available when the StructureBrowser is viewed as a portlet.
Opening the Structure Browser from the event listLaunch the Structure Browser from an Active Event List (AEL) in order to viewthe internal structure of the device associated with the event and investigate thehealth of the device components.
To perform this procedure, you must be in the Active Event List (AEL).1. In the event list, select the event of interest. To select multiple events, press Ctrl
while you click. To select contiguous events, select the first event in acontinuous list and then press Shift while you click the last event in thecontinuous list.
2. Right-click anywhere in the event list and select Show Device Structure. Aftera few moments the Structure Browser opens in one or more separate browserwindows. Each Structure Browser appears in tree mode preloaded with thestructure of the device associated with the selected event.
You can now perform any of the following actions:v Identify faulty componentsv Show events for faulty componentsv Navigate within the structure of this deviceRelated tasks:“Customizing Structure Browser preferences” on page 82The administrator can change configuration settings for the Structure Browser. Editthe configuration files to change the appearance of the Structure Browser.“Identifying faulty components from the Structure Browser table” on page 78Using the table mode of the Structure Browser, you can identify a faultycomponent in order to retrieve further details about the critical alert.“Switching between tree and table mode in the Structure Browser” on page 81If the Structure Browser is displayed as a portlet, you can choose to display theStructure Browser in tree mode or table mode.“Searching the node text in the Structure Browser tree” on page 80You can search for a value within the nodes in the Structure Browser tree.“Identifying faulty components from the Structure Browser tree” on page 77Using the tree mode of the Structure Browser, you can identify a faulty componentin order to retrieve further details about the critical alert.“Showing events for a device or component” on page 81Show events for a device or component from within the Structure Browser toisolate the fault within a network device.
76 IBM Tivoli Network Manager IP Edition: Network Troubleshooting Guide
Identifying faulty components from the Structure Browser treeUsing the tree mode of the Structure Browser, you can identify a faulty componentin order to retrieve further details about the critical alert.
The Structure Browser has two modes: tree and table. When the StructureBrowser is opened from an event list or from the Network Views, it always opensin tree mode and cannot be displayed in table mode. When the Structure Browseris displayed as a portlet, it can be configured to display in either tree mode ortable mode.1. In the Structure Browser window, go to the Device Structure Tree on the left
hand side and look for the critical alert in the alert status indicator column. Thealert status indicator column is on the right-hand side of the tree.
Remember: The most severe alert affecting a device component is displayed atthe main node level in the tree. From here, you can drill down into the devicecomponents and see what the most severe alert is on each component.
2. Expand the tree and locate a faulty component. For example, a device faultmight be caused by a faulty Ethernet Gigabit port interface.
3. Select the faulty component. When highlighted, all information available aboutthe faulty interface is displayed in the Component Detail Table. You can usethe information in the Component Detail Table to provide exact details of thedevice component that is failing in a trouble ticket. Also, make a note of thecontainment path displayed in the Component Path area. This is useful as aquick reference to the faulty component, and can be added to the trouble ticket.
4. Use the following items in the Tools menu to perform actions on thecomponent.
Show EventsStarts the AEL to display all alerts for the selected device orcomponent.
Find in Network ViewStarts the Network Views in a new window and displays the networktopology, with the device that contains the selected componenthighlighted.
Find in Hop ViewStarts the Network Hop View in a separate window and displays thenetwork topology, with the device containing the selected componenthighlighted.
Create a Poll PolicyCreates a new network poll for the selected device. Only create a newpoll if you are a network administrator and you are familiar with thenetwork.
Rediscover NodesRediscovers one or more devices including the currently-selecteddevice.
Browse SNMP MIB DataStarts the SNMP MIB Browser in a separate window where you canperform SNMP queries on the selected device.
Graph SNMP MIB DataOpens the MIB Grapher with a historical display of snmpInBandwidth.To define the information that is displayed, open the Graph Propertieswindow.
Chapter 4. Diagnosing network problems 77
Manage/UnmanagePuts the selected device or component into a managed or unmanagedstate.
Ping from this hostStarts the generic ping tool on the local workstation and pings thecurrently-selected device.
Telnet Starts a Telnet window from which you can log into thecurrently-selected workstation.
Related concepts:“About the Structure Browser” on page 9The Structure Browser allows you to navigate the internal structure of a device.You can also use the Structure Browser to investigate the health of devicecomponents and isolate a fault within a network device. The Structure Browser hastwo modes: tree and table.Related tasks:“Using the Structure Browser with the Network Hop View” on page 75View the structure of a device displayed in the Hop View and investigate thehealth of the device components using the Structure Browser.“Switching between tree and table mode in the Structure Browser” on page 81If the Structure Browser is displayed as a portlet, you can choose to display theStructure Browser in tree mode or table mode.“Searching the node text in the Structure Browser tree” on page 80You can search for a value within the nodes in the Structure Browser tree.“Showing events for a device or component” on page 81Show events for a device or component from within the Structure Browser toisolate the fault within a network device.“Creating polls” on page 91Create a poll if existing monitoring of network devices does not meet yourrequirements. You can configure ping, link state, and threshold polls directly fromthe network map.“Discovering devices again” on page 96You can discover a particular device or set of devices again if you think that theyhave changed, and you do not want to wait for the next full discovery.“Retrieving MIB information” on page 84Retrieve MIB variable information from network devices to diagnose networkproblems.
Identifying faulty components from the Structure Browsertable
Using the table mode of the Structure Browser, you can identify a faultycomponent in order to retrieve further details about the critical alert.
The Structure Browser has two modes: tree and table. When the StructureBrowser is displayed as a portlet, it can be configured to display in either treemode or table mode. Complete these steps in table mode.1. Select the faulty entity in the Hop View.2. In the Structure Browser table below the Hop View portlet, click the Show
device information button .3. Find a faulty interface in one of two ways.
78 IBM Tivoli Network Manager IP Edition: Network Troubleshooting Guide

v Browse the table.v Sort the status field by clicking the column header.
4. Click the Show interfaces button
or the Show device connectivity
button .
Note: You can also double-click on the interface to open the Structure Browsertree in a stand-alone window and access Tools from the tree.
5. Select a row and right-click to select Tools.6. Use the following items in the Tools menu to perform actions on the
component.
Show EventsStarts the AEL to display all alerts for the selected device orcomponent.
Find in Network ViewStarts the Network Views in a new window and displays the networktopology, with the device that contains the selected componenthighlighted.
Find in Hop ViewStarts the Network Hop View in a separate window and displays thenetwork topology, with the device containing the selected componenthighlighted.
Create a Poll PolicyCreates a new network poll for the selected device. Only create a newpoll if you are a network administrator and you are familiar with thenetwork.
Rediscover NodesRediscovers one or more devices including the currently-selecteddevice.
Browse SNMP MIB DataStarts the SNMP MIB Browser in a separate window where you canperform SNMP queries on the selected device.
Graph SNMP MIB DataOpens the MIB Grapher with a historical display of snmpInBandwidth.To define the information that is displayed, open the Graph Propertieswindow.
Manage/UnmanagePuts the selected device or component into a managed or unmanagedstate.
Ping from this hostStarts the generic ping tool on the local workstation and pings thecurrently-selected device.
Telnet Starts a Telnet window from which you can log into thecurrently-selected workstation.
Related concepts:
Chapter 4. Diagnosing network problems 79

“About the Structure Browser” on page 9The Structure Browser allows you to navigate the internal structure of a device.You can also use the Structure Browser to investigate the health of devicecomponents and isolate a fault within a network device. The Structure Browser hastwo modes: tree and table.Related tasks:“Using the Structure Browser with the Network Hop View” on page 75View the structure of a device displayed in the Hop View and investigate thehealth of the device components using the Structure Browser.“Opening the Structure Browser from the event list” on page 76Launch the Structure Browser from an Active Event List (AEL) in order to viewthe internal structure of the device associated with the event and investigate thehealth of the device components.
Searching the node text in the Structure Browser treeYou can search for a value within the nodes in the Structure Browser tree.
You can enter a string to be matched against the following set of predefineddatabase fields:v ifName, ifDescr, ifAlias, ifTypeString, ifPhysAddress, accessIPAddress,
accessProtocol, duplex, and entPhysicalVendorType in the interface tablev address, protocol, subnet, and DNSName in the ipEndPointTable table
To search within the Device Structure Tree in the Structure Browser:
1. Enter the search string in the field located to the right of the Expand All
and Collapse All buttons.
Note: The search string is case-insensitive and can be a complete value (for anexact search) or a wildcard. The supported wildcards, which can be appendedto a search string, are * and %. For example, to search for IP addresses thatbegin with 172, you can enter 172* or 172%.
2. Ensure that the root node is selected in the tree.
Tip: The tree is traversed from the selected node, with the search beingperformed from top to bottom.
3. Click Find/Find Next in turn to find the first and subsequent matchingnodes. Each matching node is selected in turn within the tree, and theassociated information is displayed in the Component Detail Table.
Related concepts:“About the Structure Browser” on page 9The Structure Browser allows you to navigate the internal structure of a device.You can also use the Structure Browser to investigate the health of devicecomponents and isolate a fault within a network device. The Structure Browser hastwo modes: tree and table.Related tasks:“Using the Structure Browser with the Network Hop View” on page 75View the structure of a device displayed in the Hop View and investigate thehealth of the device components using the Structure Browser.
80 IBM Tivoli Network Manager IP Edition: Network Troubleshooting Guide
“Opening the Structure Browser from the event list” on page 76Launch the Structure Browser from an Active Event List (AEL) in order to viewthe internal structure of the device associated with the event and investigate thehealth of the device components.“Identifying faulty components from the Structure Browser tree” on page 77Using the tree mode of the Structure Browser, you can identify a faulty componentin order to retrieve further details about the critical alert.
Switching between tree and table mode in the StructureBrowser
If the Structure Browser is displayed as a portlet, you can choose to display theStructure Browser in tree mode or table mode.
Restriction: If the Structure Browser is started from a right-click tool, it is alwaysdisplayed in tree mode. Table mode is only available when the Structure Browseris displayed as a portlet, for example, underneath the Hop View in a defaultinstallation.
To change the display mode of a Structure Browser portlet, complete the followingsteps.
1. From the Structure Browser portlet, click Edit .2. Select Tree or Table from the View Mode list. This setting overrides the default
set by the administrator.Related tasks:“Using the Structure Browser with the Network Hop View” on page 75View the structure of a device displayed in the Hop View and investigate thehealth of the device components using the Structure Browser.“Opening the Structure Browser from the event list” on page 76Launch the Structure Browser from an Active Event List (AEL) in order to viewthe internal structure of the device associated with the event and investigate thehealth of the device components.“Identifying faulty components from the Structure Browser tree” on page 77Using the tree mode of the Structure Browser, you can identify a faulty componentin order to retrieve further details about the critical alert.
Showing events for a device or componentShow events for a device or component from within the Structure Browser toisolate the fault within a network device.1. Open the Structure Browser in either tree or table mode.2. Select a faulty device or component.3. Click Tools > Show Events.
An AEL appears in a separate browser window containing the events on theselected device or component.
Note:
All alerts on the device are shown when you use the Show Events tool. It ispossible that, for example, Critical alerts are shown when you use the Show Eventstool on a device from the default Major alerts view. Default network views that arebased on alert severity are filtered such that they contain only devices that have
Chapter 4. Diagnosing network problems 81

one or more alerts of that severity. However, those devices can also have alerts ofother severities. It is possible to edit the filters for the network views to includeonly devices that have a certain alert severity and no other alert severities.However, take care that devices that have multiple alerts with different severitiesare not accidentally omitted from your network view hierarchy.
Customizing Structure Browser preferencesThe administrator can change configuration settings for the Structure Browser. Editthe configuration files to change the appearance of the Structure Browser.
The configuration files are located in the ITNMHOME/profiles/TIPProfile/etc/tnmdirectory. The structurebrowser.properties file controls settings that are related tothe Structure Browser window. The status.properties file controls all statusindicator settings for both the Topoviz views and the Structure Browser window.The ncp_structurebrowser_menu.xml file controls what tools are available from theStructure Browser.
Note: The configuration files are monitored for changes every 60 seconds, sochanges are automatically detected by the Structure Browser.1. From the command line, navigate to the ITNMHOME/profiles/TIPProfile/etc/
tnm directory.2. Back up and edit the ITNMHOME/profiles/TIPProfile/etc/tnm/
structurebrowser.properties file.
Structure Browser property Description
structurebrowser.default.viewMode Specifies the default mode for the StructureBrowser when it is opened as a portlet. Thedefault mode determines how data isdisplayed when the Structure Browser isopened as a portlet. The two options aretree or table. The default mode can beoverriden by a user's portlet preferences.Note: The Structure Browser table is onlyavailable when the Structure Browser isopened as a portlet. The table cannot belaunched as a stand-alone window.
structurebrowser.showManagedStatus Specifies whether to show the managedstatus of a device from the tree or theinterface or connectivity tables. If the valueis set to false, then managedStatus ishidden.
structurebrowser.table.interfaces.width.columnName
Specifies the width of individual columns inthe Interfaces view of the Structure Browserin table mode. The width is measured inunits of em or px.
structurebrowser.table.connectivity.width.localColumnName
Specifies the width of individual columnsfor the local interface in the Connectivityview of the Structure Browser in table modein units of em or px.
structurebrowser.table.connectivity.width.connectivity
Specifies the width of the Connectivitycolumn in units of em or px.
structurebrowser.table.connectivity.width.columnName
Specifies the width of individual columnsfor the remote interface in the Connectivitysection of the Structure Browser in tablemode in units of em or px.
82 IBM Tivoli Network Manager IP Edition: Network Troubleshooting Guide

Structure Browser property Description
structurebrowser.tree.image.x Specifies the managed status icon to displayin the tree and the table.
Restriction: The features available depend on the version of the productinstalled. If the latest version is installed and the lines to set the default viewmode and the column widths are not present in the configuration file, copy thelines into the ITNMHOME/profiles/TIPProfile/etc/tnm/structurebrowser.properties file from the ITNMHOME/profiles/TIPProfile/etc/tnm/default/structurebrowser.properties file.
3. Save and close the file.4. Back up and edit the ITNMHOME/profiles/TIPProfile/etc/tnm/
status.properties file.
Status property Description
status.enabled Specifies whether the status field is visiblefrom the interface and connectivity tables.
status.none.enabled Specifies whether an icon is displayed whenthe status is Clear.
status.tree.updateperiod Specifies how often the table and the tree areupdated or refreshed. This property alsocontrols status updates.
status.tree.image.x Specifies the status icons for the table andthe tree.
5. Save and close the file.Related tasks:“Using the Structure Browser with the Network Hop View” on page 75View the structure of a device displayed in the Hop View and investigate thehealth of the device components using the Structure Browser.“Opening the Structure Browser from the event list” on page 76Launch the Structure Browser from an Active Event List (AEL) in order to viewthe internal structure of the device associated with the event and investigate thehealth of the device components.
Showing device connectivityRun this command on a device in the network map to see the interfaces on thatdevice and associated connections for each interface.1. From the Network Hop View or Network Views select a device in the network
map. To select multiple devices, press Ctrl.2. Right-click one of the selected devices and click Show Connectivity
Information. A new browser window is displayed for each of the selecteddevices. The window contains a table with the following connectivityinformation. Each row in the table represents a device connection.
Local nodeSpecifies connectivity information for the selected device.
Entity nameSpecifies the IP address or hostname of the selected device.
Chapter 4. Diagnosing network problems 83

Interface descriptionSpecifies descriptive information for a connected interface onthe selected device.
Interface typeSpecifies the interface type for the connected interface.
Neighbor nodeSpecifies connectivity information for devices connected to the selecteddevice.
Entity nameSpecifies the IP address or hostname of a device connected tothe selected device. Click this hyperlink to open a separatebrowser window showing connectivity information for thisdevice.
Interface descriptionSpecifies descriptive information for an interface connected tothe selected device.
Interface typeSpecifies the interface type for an interface connected to theselected device.
Retrieving MIB informationRetrieve MIB variable information from network devices to diagnose networkproblems.
The following topics describe how to retrieve MIB information.
About the SNMP MIB BrowserUse the SNMP MIB Browser to retrieve MIB variable information from networkdevices to support diagnosis of network problems.
The SNMP MIB Browser obtains MIB data from devices in the discovered topology.Using the SNMP MIB Browser, you can navigate within the MIB for the selecteddevice and retrieve the value of any MIB variables.
The SNMP MIB Browser enables you to issue SNMP MIB queries on a specifiednetwork device and display the results of these queries.
The SNMP MIB Browser enables you to perform diagnostic work when trying toresolve problems on network devices. In particular, the SNMP MIB Browserenables you to perform the following tasks:v View values of MIB objects for any device on your network. You can browse the
MIB tree, issue SNMP queries – using SNMP Get, Get Next, Get Table, Walk, andGraph commands – and view resulting data. This data can help you to resolveproblems on a device.
v Perform immediate diagnosis on network devices that are displaying faultybehavior.
Restriction: You can use the SNMP MIB Browser to display MIB information only.You cannot use the SNMP MIB Browser to modify MIB information.
84 IBM Tivoli Network Manager IP Edition: Network Troubleshooting Guide
Accessing MIB dataAccess MIB variables for network devices in order to diagnose problems onnetwork devices.
The following topics describe how to access MIB data.
Accessing the SNMP MIB BrowserAccess the SNMP MIB Browser to retrieve MIB variable values for network devicesand diagnose problems on those devices.1. Click Availability > Network Availability > SNMP MIB Browser.2. In the SNMP MIB Browser issue an SNMP MIB query for a device.Related tasks:“Issuing an SNMP MIB query” on page 86Issue a MIB query to retrieve MIB variables from network devices andsubsequently diagnose problems on those devices.
Launching the SNMP MIB Browser from an event listLaunch the SNMP MIB Browser from an event list in order to diagnose problemson network devices associated with selected events.
To perform this procedure, you must be in the Active Event List (AEL).1. In the event list select the event of interest. To select multiple events, press Ctrl
while you click. To select contiguous events, select the first event in acontinuous list and then press Shift while you click the last event in thecontinuous list.
2. Right-click anywhere in the event list and choose Browse SNMP MIB Data.After a few moments the SNMP MIB Browser opens in one or more separatebrowser windows. Each SNMP MIB Browser appears preloaded with the IPaddress of the device associated with the selected event.
You can now issue an SNMP MIB query for this device.Related tasks:“Issuing an SNMP MIB query” on page 86Issue a MIB query to retrieve MIB variables from network devices andsubsequently diagnose problems on those devices.
Launching the SNMP MIB Browser from the Hop View or NetworkViewsLaunch the SNMP MIB Browser from the Network Hop View or Network Views inorder to diagnose problems on selected network devices.1. From the Network Hop View or Network Views network map, select the device
from which to retrieve MIB data. To select multiple devices, press Ctrl.2. Right-click one of the selected devices and choose Browse SNMP MIB Data.
The SNMP MIB Browser opens in one or more separate browser windows.Each SNMP MIB Browser appears preloaded with the IP address of the selectedevent.
You can issue an SNMP MIB query for this device.Related tasks:“Issuing an SNMP MIB query” on page 86Issue a MIB query to retrieve MIB variables from network devices andsubsequently diagnose problems on those devices.
Chapter 4. Diagnosing network problems 85
Launching the SNMP MIB Browser from the Structure BrowserLaunch the SNMP MIB Browser from the Structure Browser to diagnose problemsfor a device.
The Structure Browser has two display modes: tree and table. The tree mode canbe accessed by right-clicking a device and selecting Show Device Structure; thetree is also available as a portlet. The table mode is shown underneath the HopView in a default installation. The table is only available from a portlet.1. Navigate to the Structure Browser.2. From either the tree or the table, proceed as follows.v From the tree, select an entity that has SNMP data associated with it and
click Tools > Browse SNMP MIB Data.v From the table, click Show Interfaces or Show Device Connectivity and
then select a row and right-click to select Tools > Browse SNMP MIB Data.
After a few moments, the SNMP MIB Browser window opens preloaded withthe IP address of the selected device.
You can now issue an SNMP MIB query for the device.Related tasks:“Issuing an SNMP MIB query”Issue a MIB query to retrieve MIB variables from network devices andsubsequently diagnose problems on those devices.
Issuing an SNMP MIB queryIssue a MIB query to retrieve MIB variables from network devices andsubsequently diagnose problems on those devices.
To perform this procedure, you must be in the SNMP MIB Browser.1. Navigate to the part of the MIB tree that contains the MIB object that you wish
to query and select the desired MIB object. Specify the MIB object that youwish to query. You can do this in one of the following ways: The OID fielddisplays the MIB object identifier that corresponds to the MIB object youselected.
Tip: Standard MIB variables can be found at the MIB tree pathiso/org/dod/internet/mgmt/mib-2. Vendor-specific MIB variables can be foundat the MIB tree path iso/org/dod/internet/private/enterprises.
2. Type the IP address or hostname of the target device in the Host field. If youlaunched the SNMP MIB Browser from the AEL, from a network map, or fromthe Structure Browser, then the Host field is automatically filled in when theSNMP MIB Browser starts.
3. Select the query to issue from the Method drop-down list. The optionsavailable within this menu are:
Get Use this query to obtain a single (scalar) values; for example,sysUpTime
Get NextUse this query to obtain the next single (scalar) value in an array.
Walk Use this query to obtain array data; for example, system.
Get TableUse this query to obtain table data.
86 IBM Tivoli Network Manager IP Edition: Network Troubleshooting Guide
Graph Use this query to start the Graph Properties window and specify theinformation (content and scope) to be displayed in the MIB graph.
The choice of SNMP query is constrained by the type of MIB object youselected.. For example, you cannot perform a Get query on a MIB variable oftype table. If you try to issue a query on a node that does not accept that query,the SNMP MIB Browser responds with a warning.
4. Click Go. The results of the query appear in the SNMP Query Results area.
Note: If the SNMP query yields no results, the reason may be one of thefollowing:v The MIB object you selected does not exist on the host.v The SNMP Helper, the device that the SNMP MIB Browser uses to query the
host, is unable to access the host.5. To refresh MIB object data to see how data has changed since the last time a
query was issued, click the Go button.
SNMP queries available from the SNMP MIB BrowserUse this information to understand the SNMP queries that you can issue using theSNMP MIB Browser.
You can use the SNMP MIB Browser to issue SNMP queries, as described in thefollowing table. The examples shown in the table can all be found within the MIBtree at the following path: iso/org/dod/internet/mgmt/mib-2.
Table 5. SNMP Queries Available from the SNMP MIB Browser
SNMPQuery Description Node Example
Get Performs a single instance lookup.It obtains a MIB object togetherwith an instance of this MIB object.For example, if you perform a Getquery on the sysDescr MIB object,then you obtain data for aninstance of this single MIB object,sysDescr.0.
Single MIB objectsonly
sysDescr
sysUpTime
sysLocation
Get Next
Walk
Obtains all instances of a MIBobject. This query only works withMIB objects that are sequential.
For example, if you issue a GetNext query on ifDescr, which is acolumn object in the table ifTable,then this query returns the valuefor all instances of ifDescr in thetable, that is, ifDescr.1 andifDescr.2.
Note that the Get Next and Walkqueries both perform the sameoperation.
Single MIB objects sysDescr
Tables ifTable
ipRouteTable
Single MIB objects thatrepresent columns in atable
ifDescr
Branch nodes thatcontain only singleMIB objects
icmp
Branch nodes thatcontain only tables
at
Branch nodes thatcontain single MIBobjects and tables
system
interfaces
Chapter 4. Diagnosing network problems 87

Table 5. SNMP Queries Available from the SNMP MIB Browser (continued)
SNMPQuery Description Node Example
Get Table Obtains a MIB table, which is agrouping of MIB objects. Forexample, the interfaces tablecontains information for allinterfaces on a network device.
Tables ifTable
ipRouteTable
Graph Displays a real-time graph of aMIB variable for the selecteddevice.
Numerical single MIBobjects only
memory usage
Graphing MIB variablesAs part of fault analysis and problem resolution, you can use the SNMP MIBGraph portlet to display real-time graphs of MIB variables for network devices.You can specify the intervals at which the MIB variables are polled. The historicaldata of MIB variables can be displayed in the graphs.
You can open the SNMP MIB Graph portlet from the left navigation menu. Theportlet can also be launched in context from other applications, such as the MIBBrowser, Active Event List (AEL), and any Network View that displays a resource.
Ensure that the devices that you want to graph are discovered and that the deviceinformation is in the NCIM database.v To open the SNMP MIB Graph portlet from the menu, click Availability >
Network Availabilty > SNMP MIB Graph.v To open the portlet in context:
– In the MIB Browser, select an OID and request to graph the variable. The hostname and OID are used for the MIB graph. Default values are used for theremaining parameters.
– In an AEL, right-click an event and launch the SNMP MIB Graph from themenu. Only the host name of the polled resource is passed to the MIB graph.
– In other applications, such as a Network View, select a device and launch theSNMP MIB Graph from the menu. Only the host name of the polled resourceis passed to the MIB graph.
When the SNMP MIB Graph is launched in context, it is displayed in a newbrowser window. The MIB graph attempts to display historical data for theselected device. You can suppress the display of historical data by changing thedefault settings for the portlet.
Configuring MIB graph properties and preferencesYou use SNMP MIB Graph to define the information and the scope of theinformation that is displayed in the MIB graph.
You first define graph properties, before expanding the Preferences area to defineyour display preferences.1. In the Properties section, accept the default values or provide new values for
the fields:
88 IBM Tivoli Network Manager IP Edition: Network Troubleshooting Guide

DomainSpecifies the device domain from a list of domains that are currentlysupported by Network Manager.
Host Specifies the device hostname or IP address. The host field supportseither hostname, or an IPv4/IPv6 address. This field can be passed infrom the AEL, Network View, Network Hop View, structure browser, orMIB Browser.
Poll dataContains a list of up to two poll definitions or MIB OIDs that havebeen added. The Add button becomes inoperable once two polls havebeen added.
MIB OIDSpecifies the use of a MIB OID. The default value is selected.When selected, the MIB OID text field and Browse button areenabled for input.
Poll DefinitionSpecifies the use of a poll definition. The default value isunselected. When selected, the Poll Definition dropdown andthe New button are enabled.
Polling interval (seconds)Provides the polling interval to be used for sending requests to thedevice to retrieve the desired values.
2. In the Preferences section, accept the default values or provide new values forthe fields:
Title Specifies the title of the graph. The default value is Hostname –MIBOID/PollDef name.
Graph refresh interval (seconds)Specifies the period between device queries. The default value is 15seconds.
Default selected rowsSpecifies whether the lowest or highest values will be graphed/selectedby default.
ColumnSpecifies which column will be graphed/selected by default. Thechoices are average, current, maximum, and minimum. The default iscurrent.
Override SNMP Community String (SNMP v1 and v2 only)Optionally allows you to override the community string currently beingused by the polling engine. The default value is unselected. When thecheckbox is selected, the Community string field is enabled.
Community StringOptionally specifies the community string to be used in the devicequery. The default value is blank and disabled. This field supportsoverriding SNMP v1 and v2 community strings only.
Chapter 4. Diagnosing network problems 89
Working with the MIB graphA graph can display data for up to two MIB OIDS or poll definitions against thesame host. You can take several actions when viewing a MIB graph.
A MIB graph must be configured before you can view it. .
You can view MIB graphs in the SNMP MIB Graph portlet accessed from NetworkAvailability, or launch it in context from another interface. If launched in context,SNMP MIB Graph is displayed in a separate browser window.1. Open SNMP MIB Graph.v Place the mouse cursor over a line to display summary graph data.v Toggle to the table view to view detailed graph data.
2. Use the graph toolbar in the following way:
Graph/Table Switches graph area between graph view and table view.
Period Allows changing graph from real time to a specific historical period.
Start dateChanges the start of the historical period by date and time.
Apply Applies changes to period and start date.3. Use the main toolbar in the following way:
ConfigureSwitches to Edit mode.
Copy graph configurationLaunches a new browser window with a copy of the current graphsconfiguration to allow the user to use all the current settings, butperhaps alter the device.
Legend/Line Switches the legend area to the table view to allow manual lineselection.
Auto-lineSwitches the lines to be displayed between the following options:v User select (displays the Line Selection table)v Highest averagev Lowest averagev Highest currentv Lowest currentv Highest maximumv Lowest maximumv Highest minimumv Lowest minimum
Apply Applies changes to line selection.4. If you have selected User Select in the previous step, use the line selection table
to manually select the lines to be displayed in the graph.
90 IBM Tivoli Network Manager IP Edition: Network Troubleshooting Guide

Chapter 5. Supporting problem resolution
Support problem resolution by helping network engineers work on devices.
The following topics describe how you can support problem resolution.
Creating pollsCreate a poll if existing monitoring of network devices does not meet yourrequirements. You can configure ping, link state, and threshold polls directly fromthe network map.1. In the Network Hop View or Network Views network map select the device to
poll. To select multiple devices, press Ctrl.2. Right-click one of the selected devices and choose Create a Poll Policy. The
Poll Configuration Wizard appears with the selected devices preloaded.
You can configure a poll for the selected devices using the Poll ConfigurationWizard.
Making devices available for maintenanceMake devices available for maintenance so that network engineers can work onknown device problems.
The following topics describe how to put devices and their components into andout of unmanaged state.
Unmanaging devices and componentsPlace a device or its components into unmanaged state so that engineers can workon the device to resolve a problem.
The following topics describe how to place a device or its components intounmanaged state.
Placing devices into unmanaged statePlace a device into unmanaged state so that engineers can work on the device toresolve a problem.
Placing a device into unmanaged state deactivates Network Manager polling andevent correlation for this device.
Note: The event list still displays events for this device generated due to pollingby other network manager software, such as Tivoli Netcool/OMNIbus. You canconfigure the event list to filter out or to tag these events.1. In the Network Hop View or Network Views network map select the device to
place into unmanaged state. To select multiple devices, press Ctrl.2. Right-click one of the selected devices and choose Unmanage. A wrench icon
appears next to the selected devices indicating that the device is now inunmanaged state.
© Copyright IBM Corp. 2006, 2016 91
Placing device components into unmanaged statePlace device components, including interfaces, into unmanaged state so thatengineers can work on the device and its components to resolve a problem.
Placing device components into unmanaged state deactivates Network Managerpolling and event correlation for the components.
Note: The event list still displays events for the components generated due topolling by other Network Manager software, such as Tivoli Netcool/OMNIbus.You can configure the event list to filter out or to tag these events.
Complete these steps from the Structure Browser.
The Structure Browser has two display modes: tree and table. The tree mode canbe accessed by right-clicking a device and selecting Show Device Structure; thetree is also available as a portlet. The table mode is shown underneath the HopView in a default installation. The table is only available from a portlet.1. From the Structure Browser, identify a device with components that you want
to change from managed state to unmanaged state and proceed as follows.v From the tree, double-click the device.v From the table, click Show interfaces or Show device connectivity.
2. Identify the managed device components that you want to change tounmanaged and click Tools > Unmanage.
A wrench icon
appears next to the selected components indicating thatthese components are now in unmanaged state. Polling and event correlation stopsfor these components.
If the device or its components was updated during the resolution of the problem,rediscover the device to refresh the device information in the network topology.
The Unmanage node toolIf a device is unavailable or defective, use the UnmanageNode.pl command to set adevice to an unmanaged state by using the command-line interface.
If you set a device to unmanaged, Network Manager polling is suspended for theunmanaged node. In the Active Event List, all alerts are tagged to indicate they arefrom an unmanaged device, and are not used for root cause analysis.
You can also unmanage individual devices or groups of devices from the topologymap views. There is also an option to set individual components of a device tounmanaged state using the Structure Browser.
Usage
This command is located in NCHOME/precision/bin.
The following syntax shows how the UnmanageNode.pl command works:
ncp_perl UnmanageNode.pl -domain DomainName -user username -pwd password-file FileName -verbose host
The following table describes the command-line options for UnmanageNode.pl.
92 IBM Tivoli Network Manager IP Edition: Network Troubleshooting Guide
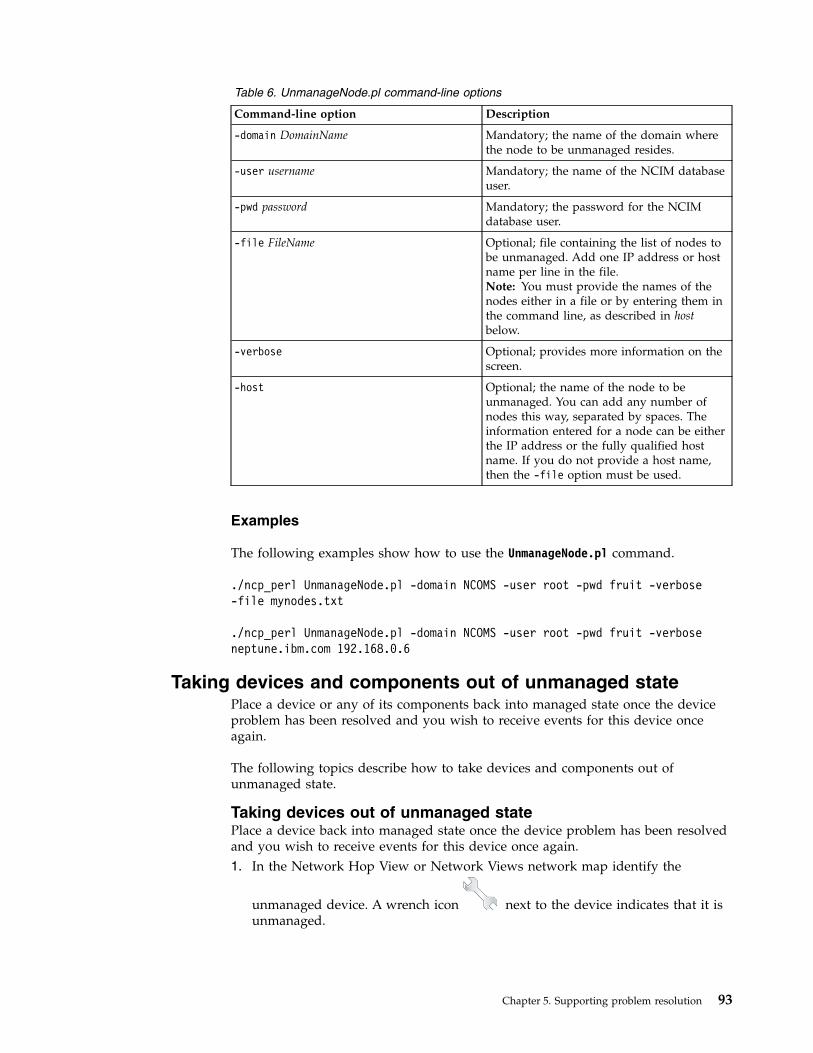
Table 6. UnmanageNode.pl command-line options
Command-line option Description
-domain DomainName Mandatory; the name of the domain wherethe node to be unmanaged resides.
-user username Mandatory; the name of the NCIM databaseuser.
-pwd password Mandatory; the password for the NCIMdatabase user.
-file FileName Optional; file containing the list of nodes tobe unmanaged. Add one IP address or hostname per line in the file.Note: You must provide the names of thenodes either in a file or by entering them inthe command line, as described in hostbelow.
-verbose Optional; provides more information on thescreen.
-host Optional; the name of the node to beunmanaged. You can add any number ofnodes this way, separated by spaces. Theinformation entered for a node can be eitherthe IP address or the fully qualified hostname. If you do not provide a host name,then the -file option must be used.
Examples
The following examples show how to use the UnmanageNode.pl command.
./ncp_perl UnmanageNode.pl -domain NCOMS -user root -pwd fruit -verbose-file mynodes.txt
./ncp_perl UnmanageNode.pl -domain NCOMS -user root -pwd fruit -verboseneptune.ibm.com 192.168.0.6
Taking devices and components out of unmanaged statePlace a device or any of its components back into managed state once the deviceproblem has been resolved and you wish to receive events for this device onceagain.
The following topics describe how to take devices and components out ofunmanaged state.
Taking devices out of unmanaged statePlace a device back into managed state once the device problem has been resolvedand you wish to receive events for this device once again.1. In the Network Hop View or Network Views network map identify the
unmanaged device. A wrench icon
next to the device indicates that it isunmanaged.
Chapter 5. Supporting problem resolution 93

2. Check that the device responds to a ping command. Right-click the device andchoose Ping from this host. If the ping test is successful, then go to the nextstep. If the device fails the ping test, then the device might require furtherinvestigation.
3. Right-click the device and choose Manage. The wrench icon disappearsindicating that the device is now managed. Polling and event correlation nowresume for this device.
If the device was updated during the resolution of the problem, you shoulddiscover the device again to refresh the device information in the networktopology.Related tasks:“Discovering devices again” on page 96You can discover a particular device or set of devices again if you think that theyhave changed, and you do not want to wait for the next full discovery.
Changing device components from unmanaged to managed stateChange device components, including interface, back to managed state if theproblem was resolved and you want to receive events for the device components.
The Structure Browser has two display modes: tree and table. The tree mode canbe accessed by right-clicking a device and selecting Show Device Structure; thetree is also available as a portlet. The table mode is shown underneath the HopView in a default installation. The table is only available from a portlet.1. From either the tree or the table, identify a device with unmanaged
components. These devices have a half-wrench icon
beside them.2. From either the tree or the table, proceed as follows.v From the tree, double-click the device.v From the table, click Show Interfaces or Show Connectivity.
3. Identify the unmanaged device components and click Tools > Manage.
The components are now managed and the wrench icons are removed. Polling andevent correlation resumes for these components.
If the device or its components was updated during the resolution of the problem,rediscover the device to refresh the device information in the network topology.Related tasks:“Discovering devices again” on page 96You can discover a particular device or set of devices again if you think that theyhave changed, and you do not want to wait for the next full discovery.
The Manage node toolUse the ManageNode.pl to set the status of an unmanaged device back to themanaged status by using the command-line interface.
This is useful when a device is in unmanaged state and you want to set it tomanaged state again to receive alerts that are not tagged unmanaged and are usedfor root cause analysis.
94 IBM Tivoli Network Manager IP Edition: Network Troubleshooting Guide

Usage
This command is located in NCHOME/precision/bin.
The following syntax shows how the ManageNode.pl command works:
ncp_perl ManageNode.pl -domain DomainName -user username -pwd password-file FileName -verbose host
The following table describes the command-line options for ManageNode.pl.
Table 7. ManageNode.pl command-line options
Command-line options Description
-domain DomainName Mandatory; the name of the domain wherethe unmanaged node resides.
-user username Mandatory; the name of the database user.
-pwd password Mandatory; the password for the databaseuser.
-file FileName Optional; file containing the list of nodes tobe set to managed state. Add one IP addressor host name per line in the file.Note: You must provide the names of thenodes either in a file or by entering them inthe command line, as described in hostbelow.
-verbose Optional; provides more information on thescreen.
host Optional; the name of the node to be set tomanaged state. You can add any number ofnodes this way, separated by spaces. Theinformation entered for a node can be eitherthe IP address or the fully qualified hostname. If you do not provide a host name,then the -file option must be used.
Examples
The following examples show how to use the ManageNode.pl command.
./ncp_perl ManageNode.pl -domain NCOMS -user root -pwd fruit -verbose -filemynodes.txt
./ncp_perl ManageNode.pl -domain NCOMS -user root -pwd fruit -verboseneptune.ibm.com 192.168.0.6
Chapter 5. Supporting problem resolution 95

Discovering devices againYou can discover a particular device or set of devices again if you think that theyhave changed, and you do not want to wait for the next full discovery.
Discovering a device can take several hours. Before issuing this command, ensurethat discovery has been correctly configured by the network administrator.1. In the Network Hop View or Network Views network map select the device to
discover again. To select multiple devices, press Ctrl.2. Right-click one of the selected devices and click Rediscover Node(s).3. In the Partial Discovery window make any desired changes to the partial
discovery settings.4. Optional: Add extra seeds and scope zones.
Restriction: Change discovery settings only if you are a network administratorand you are familiar with the network.
5. Click Go to launch the discovery.
The Add node toolUse the AddNode.pl command to add network devices to your network topologyby using the command-line interface. When you add a device, a partial discoveryis triggered to add the device to the network topology.
Full topology connectivity is not displayed for the device until after the next fulldiscovery is completed.
Usage
This command is located in NCHOME/precision/bin.
UNIX
Before running this script, ensure that you have set up the UNIX
environment.
The following syntax shows how the AddNode.pl command works:
ncp_perl AddNode.pl -domain DomainName -latency MessageLatency -debugDebugLevel -file FileName -verbose host
The following table describes the command-line options for AddNode.pl.
Table 8. AddNode.pl command-line options
Command-line options Description
-domain DomainName Mandatory; the name of the domain youwant to add the node to.
-latency MessageLatency Optional; the maximum time in millisecondsto wait between attempts to send a message.This is needed for busy networks.
-debug DebugLevel Optional; the level of detail the debuggingoutput provides. Values are 1 to 4, where 4represents the most detailed output.
96 IBM Tivoli Network Manager IP Edition: Network Troubleshooting Guide
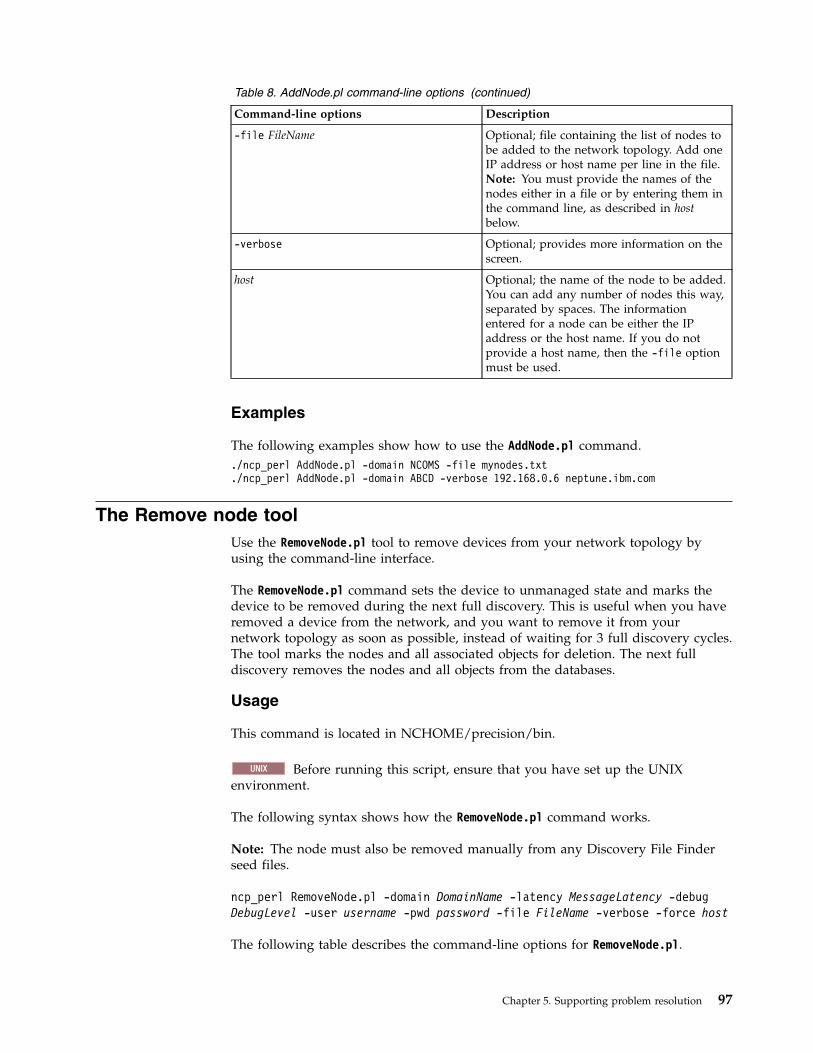
Table 8. AddNode.pl command-line options (continued)
Command-line options Description
-file FileName Optional; file containing the list of nodes tobe added to the network topology. Add oneIP address or host name per line in the file.Note: You must provide the names of thenodes either in a file or by entering them inthe command line, as described in hostbelow.
-verbose Optional; provides more information on thescreen.
host Optional; the name of the node to be added.You can add any number of nodes this way,separated by spaces. The informationentered for a node can be either the IPaddress or the host name. If you do notprovide a host name, then the -file optionmust be used.
Examples
The following examples show how to use the AddNode.pl command../ncp_perl AddNode.pl -domain NCOMS -file mynodes.txt./ncp_perl AddNode.pl -domain ABCD -verbose 192.168.0.6 neptune.ibm.com
The Remove node toolUse the RemoveNode.pl tool to remove devices from your network topology byusing the command-line interface.
The RemoveNode.pl command sets the device to unmanaged state and marks thedevice to be removed during the next full discovery. This is useful when you haveremoved a device from the network, and you want to remove it from yournetwork topology as soon as possible, instead of waiting for 3 full discovery cycles.The tool marks the nodes and all associated objects for deletion. The next fulldiscovery removes the nodes and all objects from the databases.
Usage
This command is located in NCHOME/precision/bin.
UNIX
Before running this script, ensure that you have set up the UNIX
environment.
The following syntax shows how the RemoveNode.pl command works.
Note: The node must also be removed manually from any Discovery File Finderseed files.
ncp_perl RemoveNode.pl -domain DomainName -latency MessageLatency -debugDebugLevel -user username -pwd password -file FileName -verbose -force host
The following table describes the command-line options for RemoveNode.pl.
Chapter 5. Supporting problem resolution 97
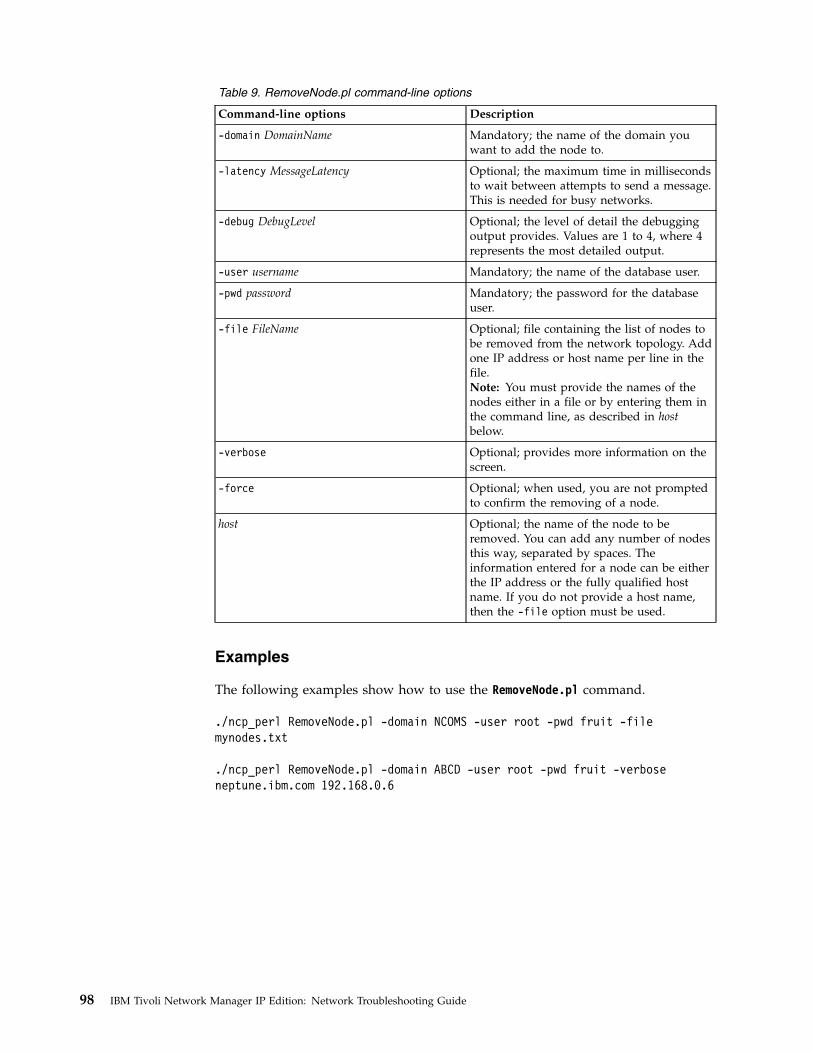
Table 9. RemoveNode.pl command-line options
Command-line options Description
-domain DomainName Mandatory; the name of the domain youwant to add the node to.
-latency MessageLatency Optional; the maximum time in millisecondsto wait between attempts to send a message.This is needed for busy networks.
-debug DebugLevel Optional; the level of detail the debuggingoutput provides. Values are 1 to 4, where 4represents the most detailed output.
-user username Mandatory; the name of the database user.
-pwd password Mandatory; the password for the databaseuser.
-file FileName Optional; file containing the list of nodes tobe removed from the network topology. Addone IP address or host name per line in thefile.Note: You must provide the names of thenodes either in a file or by entering them inthe command line, as described in hostbelow.
-verbose Optional; provides more information on thescreen.
-force Optional; when used, you are not promptedto confirm the removing of a node.
host Optional; the name of the node to beremoved. You can add any number of nodesthis way, separated by spaces. Theinformation entered for a node can be eitherthe IP address or the fully qualified hostname. If you do not provide a host name,then the -file option must be used.
Examples
The following examples show how to use the RemoveNode.pl command.
./ncp_perl RemoveNode.pl -domain NCOMS -user root -pwd fruit -filemynodes.txt
./ncp_perl RemoveNode.pl -domain ABCD -user root -pwd fruit -verboseneptune.ibm.com 192.168.0.6
98 IBM Tivoli Network Manager IP Edition: Network Troubleshooting Guide

Chapter 6. Reporting on devices
You can run reports on network devices to check the health of devices, summarizenetwork and device data, or troubleshoot problems.
As a network operator, you can run reports from the GUI in several ways. Accessto reports and report groups is controlled by the administrator. Your administratorcan also create and customize reports. Ensure that at a minimum a reader isinstalled on your computer for the file format to which you output reports. Forexample, to output reports in .pdf format, install a PDF reader.
Tip: If your network is large and complex, detailed reports can potentially containvery large amounts of data. Reports that are hundreds of thousands of lines longcan be more difficult to use, and can cause the reporting components to run out ofmemory. Ensure that your reports are optimized to return the data that is useful toyou.
Running reports from the Reports windowYou can run reports directly from the Reports window.
To run a report, complete the following steps.1. Log in to the Tivoli Integrated Portal and click Reporting > Common
Reporting > Network Manager.2. Click on a report set to see a list of available reports.3. Click a report name to generate a report in HTML format. You can also use the
Actions icons to customize or perform other actions on the report. For moreinformation about the options available in the Reports window, click the helpicon in the Reports window toolbar.
Running reports from a network mapYou can run reports from any Network Manager topology display.
To run a report from a network map, complete the following steps.1. Log in to the Tivoli Integrated Portal and navigate to a Network View, Hop
View, Path View, or Structure Browser.2. Right-click a device and click Reports. All reports that are available to run on
that device type are displayed.3. Click the report that you want to run.4. Enter any parameters required for the report.
© Copyright IBM Corp. 2006, 2016 99

100 IBM Tivoli Network Manager IP Edition: Network Troubleshooting Guide
Appendix. Network Manager glossary
Use this information to understand terminology relevant to the Network Managerproduct.
The following list provides explanations for Network Manager terminology.
AOC filesFiles used by the Active Object Class manager, ncp_class to classifynetwork devices following a discovery. Device classification is defined inAOC files by using a set of filters on the object ID and other device MIBparameters.
active object class (AOC)An element in the predefined hierarchical topology of network devicesused by the Active Object Class manager, ncp_class, to classify discovereddevices following a discovery.
agent See, discovery agent.
class hierarchyPredefined hierarchical topology of network devices used by the ActiveObject Class manager, ncp_class, to classify discovered devices following adiscovery.
configuration filesEach Network Manager process has one or more configuration files used tocontrol process behaviour by setting values in the process databases.Configuration files can also be made domain-specific.
discovery agentPiece of code that runs during a discovery and retrieves detailedinformation from discovered devices.
Discovery Configuration GUIGUI used to configure discovery parameters.
Discovery engine (ncp_disco)Network Manager process that performs network discovery.
discovery phaseA network discovery is divided into four phases: Interrogating devices,Resolving addresses, Downloading connections, and Correlatingconnectivity.
discovery seedOne or more devices from which the discovery starts.
discovery scopeThe boundaries of a discovery, expressed as one or more subnets andnetmasks.
Discovery Status GUIGUI used to launch and monitor a running discovery.
discovery stitcherPiece of code used during the discovery process. There are variousdiscovery stitchers, and they can be grouped into two types: data collectionstitchers, which transfer data between databases during the data collection
© Copyright IBM Corp. 2006, 2016 101
phases of a discovery, and data processing stitchers, which build thenetwork topology during the data processing phase.
domainSee, network domain.
entity A topology database concept. All devices and device componentsdiscovered by Network Manager are entities. Also device collections suchas VPNs and VLANs, as well as pieces of topology that form a complexconnection, are entities.
event enrichmentThe process of adding topology information to the event.
Event Gateway (ncp_g_event)Network Manager process that performs event enrichment.
Event Gateway stitcherStitchers that perform topology lookup as part of the event enrichmentprocess.
failoverIn your Network Manager environment, a failover architecture can be usedto configure your system for high availability, minimizing the impact ofcomputer or network failure.
Failover plug-inReceives Network Manager health check events from the Event Gatewayand passes these events to the Virtual Domain process, which decideswhether or not to initiate failover based on the event.
Fault Finding ViewComposite GUI view consisting of an Active Event List (AEL) portletabove and a Network Hop View portlet below. Use the Fault Finding Viewto monitor network events.
full discoveryA discovery run with a large scope, intended to discover all of the networkdevices that you want to manage. Full discoveries are usually just calleddiscoveries, unless they are being contrasted with partial discoveries. Seealso, partial discovery.
message brokerComponent that manages communication between Network Managerprocesses. The message broker used byNetwork Manager is called ReallySmall Message Broker. To ensure correct operation of Network Manager,Really Small Message Broker must be running at all times.
NCIM databaseRelational database that stores topology data, as well as administrativedata such as data associated with poll policies and definitions, andperformance data from devices.
ncp_discoSee, Discovery engine.
ncp_g_eventSee, Event Gateway.
ncp_modelSee, Topology manager.
102 IBM Tivoli Network Manager IP Edition: Network Troubleshooting Guide

ncp_pollerSee, Polling engine.
network domainA collection of network entities to be discovered and managed. A singleNetwork Manager installation can manage multiple network domains.
Network Health ViewComposite GUI view consisting of a Network Views portlet above and anActive Event List (AEL) portlet below. Use the Network Health View todisplay events on network devices.
Network Hop ViewNetwork visualization GUI. Use the Network Hop View to search thenetwork for a specific device and display a specified network device. Youcan also use the Network Hop View as a starting point for networktroubleshooting. Formerly known as the Hop View.
Network Polling GUIAdministrator GUI. Enables definition of poll policies and poll definitions.
Network ViewsNetwork visualization GUI that shows hierarchically organized views of adiscovered network. Use the Network Views to view the results of adiscovery and to troubleshoot network problems.
OQL databasesNetwork Manager processes store configuration, management andoperational information in OQL databases.
OQL languageVersion of the Structured Query Language (SQL) that has been designedfor use in Network Manager. Network Manager processes create andinteract with their databases using OQL.
partial discoveryA subsequent rediscovery of a section of the previously discoverednetwork. The section of the network is usually defined using a discoveryscope consisting of either an address range, a single device, or a group ofdevices. A partial discovery relies on the results of the last full discovery,and can only be run if the Discovery engine, ncp_disco, has not beenstopped since the last full discovery. See also, full discovery.
Path ViewsNetwork visualization GUI that displays devices and links that make up anetwork path between two selected devices. Create new path views orchange existing path views to help network operators visualize networkpaths.
performance dataPerformance data can be gathered using performance reports. Thesereports allow you to view any historical performance data that has beencollected by the monitoring system for diagnostic purposes.
Polling engine (ncp_poller)Network Manager process that polls target devices and interfaces. ThePolling engine also collects performance data from polled devices.
poll definitionDefines how to poll a network device or interface and further filter thetarget devices or interfaces.
Appendix. Network Manager glossary 103

poll policyDefines which devices to poll. Also defines other attributes of a poll suchas poll frequency.
Probe for Tivoli Netcool/OMNIbus (nco_p_ncpmonitor)Acquires and processes the events that are generated by Network Managerpolls and processes, and forwards these events to the ObjectServer.
RCA plug-inBased on data in the event and based on the discovered topology, attemptsto identify events that are caused by or cause other events using rulescoded in RCA stitchers.
RCA stitcherStitchers that process a trigger event as it passes through the RCA plug-in.
root-cause analysis (RCA)The process of determining the root cause of one or more device alerts.
SNMP MIB BrowserGUI that retrieves MIB variable information from network devices tosupport diagnosis of network problems.
SNMP MIB GrapherGUI that displays a real-time graph of MIB variables for a device and ussethe graph for fault analysis and resolution of network problems.
stitcherCode used in the following processes: discovery, event enrichment, androot-cause analysis. See also, discovery stitcher, Event Gateway stitcher,and RCA stitcher.
Structure BrowserGUI that enables you to investigate the health of device components inorder to isolate faults within a network device.
Topology Manager (ncp_model)Stores the topology data following a discovery and sends the topologydata to the NCIM topology database where it can be queried using SQL.
WebToolsSpecialized data retrieval tools that retrieve data from network devices andcan be launched from the network visualization GUIs, Network Views andNetwork Hop View, or by specifying a URL in a web browser.
104 IBM Tivoli Network Manager IP Edition: Network Troubleshooting Guide
Notices
This information applies to the PDF documentation set for IBM Tivoli NetworkManager IP Edition 3.9.
This information was developed for products and services offered in the U.S.A.
IBM may not offer the products, services, or features discussed in this document inother countries. Consult your local IBM representative for information on theproducts and services currently available in your area. Any reference to an IBMproduct, program, or service is not intended to state or imply that only that IBMproduct, program, or service may be used. Any functionally equivalent product,program, or service that does not infringe any IBM intellectual property right maybe used instead. However, it is the user's responsibility to evaluate and verify theoperation of any non-IBM product, program, or service.
IBM may have patents or pending patent applications covering subject matterdescribed in this document. The furnishing of this document does not grant youany license to these patents. You can send license inquiries, in writing, to:
IBM Director of LicensingIBM CorporationNorth Castle DriveArmonk, NY 10504-1785U.S.A.
For license inquiries regarding double-byte character set (DBCS) information,contact the IBM Intellectual Property Department in your country or sendinquiries, in writing, to:
Intellectual Property LicensingLegal and Intellectual Property LawIBM Japan, Ltd.19-21, Nihonbashi-Hakozakicho, Chuo-kuTokyo 103-8510, Japan
The following paragraph does not apply to the United Kingdom or any othercountry where such provisions are inconsistent with local law: INTERNATIONALBUSINESS MACHINES CORPORATION PROVIDES THIS PUBLICATION "AS IS"WITHOUT WARRANTY OF ANY KIND, EITHER EXPRESS OR IMPLIED,INCLUDING, BUT NOT LIMITED TO, THE IMPLIED WARRANTIES OFNON-INFRINGEMENT, MERCHANTABILITY OR FITNESS FOR A PARTICULARPURPOSE. Some states do not allow disclaimer of express or implied warranties incertain transactions, therefore, this statement may not apply to you.
This information could include technical inaccuracies or typographical errors.Changes are periodically made to the information herein; these changes will beincorporated in new editions of the publication. IBM may make improvementsand/or changes in the product(s) and/or the program(s) described in thispublication at any time without notice.
Any references in this information to non-IBM Web sites are provided forconvenience only and do not in any manner serve as an endorsement of those Web
© Copyright IBM Corp. 2006, 2016 105

sites. The materials at those Web sites are not part of the materials for this IBMproduct and use of those Web sites is at your own risk.
IBM may use or distribute any of the information you supply in any way itbelieves appropriate without incurring any obligation to you.
Licensees of this program who wish to have information about it for the purposeof enabling: (i) the exchange of information between independently createdprograms and other programs (including this one) and (ii) the mutual use of theinformation which has been exchanged, should contact:
IBM Corporation958/NH04IBM Centre, St Leonards601 Pacific HwySt Leonards, NSW, 2069AustraliaIBM Corporation896471/H128B76 Upper GroundLondonSE1 9PZUnited KingdomIBM CorporationJBF1/SOM1 294Route 100Somers, NY, 10589-0100United States of America
Such information may be available, subject to appropriate terms and conditions,including in some cases, payment of a fee.
The licensed program described in this document and all licensed materialavailable for it are provided by IBM under terms of the IBM Customer Agreement,IBM International Program License Agreement or any equivalent agreementbetween us.
Any performance data contained herein was determined in a controlledenvironment. Therefore, the results obtained in other operating environments mayvary significantly. Some measurements may have been made on development-levelsystems and there is no guarantee that these measurements will be the same ongenerally available systems. Furthermore, some measurements may have beenestimated through extrapolation. Actual results may vary. Users of this documentshould verify the applicable data for their specific environment.
Information concerning non-IBM products was obtained from the suppliers ofthose products, their published announcements or other publicly available sources.IBM has not tested those products and cannot confirm the accuracy ofperformance, compatibility or any other claims related to non-IBM products.Questions on the capabilities of non-IBM products should be addressed to thesuppliers of those products.
This information contains examples of data and reports used in daily businessoperations. To illustrate them as completely as possible, the examples include the
106 IBM Tivoli Network Manager IP Edition: Network Troubleshooting Guide

names of individuals, companies, brands, and products. All of these names arefictitious and any similarity to the names and addresses used by an actual businessenterprise is entirely coincidental.
COPYRIGHT LICENSE:
This information contains sample application programs in source language, whichillustrate programming techniques on various operating platforms. You may copy,modify, and distribute these sample programs in any form without payment toIBM, for the purposes of developing, using, marketing or distributing applicationprograms conforming to the application programming interface for the operatingplatform for which the sample programs are written. These examples have notbeen thoroughly tested under all conditions. IBM, therefore, cannot guarantee orimply reliability, serviceability, or function of these programs.
TrademarksThe terms in Table 10 are trademarks of International Business MachinesCorporation in the United States, other countries, or both:
Table 10. IBM trademarks
AIX iSeries RDN
ClearQuest Lotus SecureWay
Cognos Netcool solidDB
Current NetView System z
DB2 Notes Tivoli
developerWorks OMEGAMON WebSphere
EnterpriseStorage Server
PowerVM z/OS
IBM PR/SM z/VM
Informix pSeries zSeries
Intel, Intel logo, Intel Inside, Intel Inside logo, Intel Centrino, Intel Centrino logo,Celeron, Intel Xeon, Intel SpeedStep, Itanium, and Pentium are trademarks orregistered trademarks of Intel Corporation or its subsidiaries in the United Statesand other countries.
Java™ and all Java-based trademarks and logos are trademarks orregistered trademarks of Oracle and/or its affiliates.
Linux is a registered trademark of Linus Torvalds in the United States, othercountries, or both.
Notices 107
UNIX is a registered trademark of The Open Group in the United States and othercountries.
Microsoft, Windows, Windows NT, and the Windows logo are trademarks ofMicrosoft Corporation in the United States, other countries, or both.
Privacy policy considerations
IBM Software products, including software as a service solutions, ("SoftwareOfferings") may use cookies or other technologies to collect product usageinformation, to help improve the end user experience, to tailor interactions withthe end user or for other purposes. In many cases no personally identifiableinformation is collected by the Software Offerings. Some of our Software Offeringscan help enable you to collect personally identifiable information. If this SoftwareOffering uses cookies to collect personally identifiable information, specificinformation about this offering's use of cookies is set forth below.
This Software Offering does not use cookies or other technologies to collectpersonally identifiable information.
For more information about the use of various technologies, including cookies, forthese purposes, see IBM's privacy policy at http://www.ibm.com/privacy.
108 IBM Tivoli Network Manager IP Edition: Network Troubleshooting Guide

Index
Aaccessibility ixadd node tool 96AddNode.pl 96Advanced Ping Tool 53alerts
see events 7
BBGP
monitoring BGP networks 30retrieving information 68
browsingthe network 16
CCisco devices
finding in Hop View 17finding in Network Views 17
Cisco Information Toolrunning 67, 68, 69, 70, 71, 73, 74
Cisco route informationretrieving 59
componentsfaulty 74, 77, 78unmanaging 92visualizing 76
connectivityabout 3IP Subnets 3Layer 2 3Layer 3 3showing 43, 83
conventions, typeface xcreating
polls from Network Hop View orNetwork Views 91
custom DNS lookupissuing 66
custom Internet registry database queryissuing 65
Customizing Structure Browser 82
Ddefault network view nodes 5device
icons 4related events 35related to event 43
device componentschanging to managed state 94
device connectivityshowing 43, 83
device structurevisualizing 76
devicesbrowsing the network 16connectivity 3custom ping 54discovering again 96faulty components 74, 77, 78finding 13logging into 64monitoring 28performing traceroute to 44pinging 53searching for 13seed 1showing connectivity 43, 83taking out of unmanaged state 93unmanaged 37unmanaging 91viewing device structure 75visualizing components 76visualizing in tabular layout 18
devices with high-speed interfacesfinding in Hop View 17finding in Network Views 17
discoverystarting from the Hop View 96starting from the Network Views 96
displayingevents on device 35events on subnet 36network hop view related to
event 37network hop view related to network
view 36network views related to event 38network views related to network hop
view 37DNS lookups
about 66custom 66issuing 66
domainssee network domains 3
Eeducation
see Tivoli technical training ixentity smart search
across domains 22across NCIM database table 22
environment variables, notation xevent correlation 39event lists
launching SNMP MIB Browser 85launching Structure Browser 76using to identify network
problems 33event status icons 8events
about 7contributing to SAEs 42
events (continued)investigating 37on a device 35on a subnet 36related network hop view 37related network views 38root-cause 40service-affected 41symptom 39, 40unmanaged 37
Ffault analysis
graphing MIBs 88finding
devices in Hop View 17devices in Network Views 17
finding devicesmethods for 13
Gglossary 101graphing MIBs 88
for fault analysis 88for resolution of network
problems 88
HHop View
about 1, 13finding devices 17launching SNMP MIB Browser 85
Iicons
event status 8for devices 4
identifyingfaulty components 74, 77, 78network problems 27network problems using event
lists 33network problems using network
views 27root-cause events 40SAEs 41symptom events 40
interface administrative status 67interface operational status 67Internet registry database query
issuing 64investigating
events 37network routes 43SAEs 41
© Copyright IBM Corp. 2006, 2016 109

IP Subnets connectivity 3ISIS information
retrieving 69issuing
custom DNS lookup 66custom Internet registry database
query 65DNS lookups 66Internet registry database query 64
JJuniper Information Tool
running 67, 68, 69, 70, 71, 73, 74Juniper route information
retrieving 61
Llaunching
SNMP MIB Browser from eventlist 85
SNMP MIB Browser from HopView 85
SNMP MIB Browser from NetworkViews 85
SNMP MIB Browser from StructureBrowser 86
Structure Browser from event 76Layer 2 connectivity 3Layer 3 connectivity 3logging into
devices 64login credentials
setting up 63
MmainNodeDetails table 13maintenance mode
see unmanaged state 91managed state 91management information base
see MIB 86ManageNode.pl 94manuals viMBGP information
retrieving 70MIB Browser
see SNMP MIB Browser 84, 85MIB graph
working with the MIB graph 90MIB Graph Properties window 88MIB tree
ifDescr column object 87ifRouteTable table 87ifTable table 87interfaces branch node 87sysDescr scalar object 87sysLocation scalar object 87system branch node 87sysUpTime scalar object 87
MIBsabout 84, 87graphing 88
MIBs (continued)graphing with the Graph Properties
windowfor fault analysis 88for resolution of network
problems 88navigating 86retrieving data 86
monitoringBGP networks 30devices 28
MPLSTE
monitoring tunnels 32MPLS information
retrieving 71multicast
monitoring groups 31monitoring routes 31
Nnavigating
MIBs 86NCOMS 2, 3network
browsing 16network domains 2, 3network hop view
related to event 37related to network view 36
Network Manager glossary 101network maps
finding devices in 16network problems
diagnosing 35identifying 27identifying using event lists 33identifying using network views 27troubleshooting 35
network routesinvestigating 43
network view nodesdefault 5
network viewsdisplaying events on 36related to event 38related to network hop view 37searching 18using to identify network
problems 27visualizing in tabular layout 18
Network Views 2about 16finding devices 17launching SNMP MIB Browser 85
nodesnetwork view tree 5
Oobject identifier (OID) 86online publications viordering publications viOSPF information
retrieving 73
Pping
from server 53pinging
devices 53from local client 53from Network Manager server 53remote 56subnets 55
pivot devicesee seed device 1
pollscreation from Network Hop View or
Network Views 91Portlet views
Structure Browser 82publications vi
Rremote pinging
about 56from Cisco devices 56from Juniper devices 56within label-switched path (LSP) 57within virtual private network
(VPN) 58remote traceroute
about 46from Cisco devices 46from Juniper devices 46within label-switched path (LSP) 47within virtual private network
(VPN) 48remove node tool 92, 94, 97RemoveNode.pl 97reports
running 99resolving network problems
graphing MIBs 88retrieving
BGP information 68Cisco route information 59interface administrative and
operational status 67ISIS information 69Juniper route information 61MBGP information 70MIB data 86MIB information 84MPLS information 71OSPF information 73route information 59VPLS information 74VRF route information 62
root-cause analysis 39root-cause events
identifying 40route information
about 59retrieving 59
router icon 4
110 IBM Tivoli Network Manager IP Edition: Network Troubleshooting Guide

SSAEs
contributing events 42identifying 41investigating 41
searchingfor devices 13node text in Structure Browser 80
seed device 1, 13service-affected events
see SAEs 42setting up
login credentials 63Show events
Structure Browser 81showing
device connectivity 43, 83SNMP MIB Browser
about 84launching 85launching from event list 85launching from Hop View 85launching from Network Views 85launching from Structure Browser 86queries 87using 86
SNMP queriesGet Next query 87Get query 87Get Table query 87Walk query 87
Structure Browser 76about 9, 75customizing 82launching from event list 76launching SNMP MIB Browser 86searching node text 80Show events 81
subnetrelated events 36
subnet icon 4subnets
pinging 55support information xswitch icon 4symptom events 39
identifying 40
Ttable view 18tabular layout 18Telnet login credentials 63Tivoli software information center viTivoli technical training ixtools
AddNode.pl 96ManageNode.pl 94RemoveNode.pl 97topology management 92, 94, 96, 97UnmanageNode.pl 92
topology management toolsadd node 96remove node 92, 94, 97
topology mapsvisualizing in tabular layout 18
tracerouteabout 44custom 44from server 44remote 46to devices 44
training, Tivoli technical ixtroubleshooting
network 1network problems 35
typeface conventions x
Uunmanaged devices 37unmanaged events 37unmanaged state 91UnmanageNode.pl 92unmanaging
components 92devices 91
usingSNMP MIB Browser 86
Vvariables, notation for xviewing
components 77, 78device structure 75structure of device related to
event 43visualizing
device components 76device structure 76
VPLS informationretrieving 74
VRF route informationretrieving 62
WWebTools
multiple login details 63
Index 111

112 IBM Tivoli Network Manager IP Edition: Network Troubleshooting Guide


IBM®
Printed in the Republic of Ireland