ibm tivoli monitoring: cec base agent user's guide · pdf fileand monitoring agent...
TRANSCRIPT
IBM Tivoli Monitoring: CEC Base AgentVersion 6.2.2 Interim Feature 2
User's Guide
SC23-5239-08
���


IBM Tivoli Monitoring: CEC Base AgentVersion 6.2.2 Interim Feature 2
User's Guide
SC23-5239-08
���

NoteBefore using this information and the product it supports, read the information in “Notices” on page 183.
This edition applies to version 6.2.2 Interim Feature 2 of IBM Tivoli Monitoring: CEC Base Agent (product number5724-C04) and to all subsequent releases and modifications until otherwise indicated in new editions.
© Copyright IBM Corporation 2007, 2013.US Government Users Restricted Rights – Use, duplication or disclosure restricted by GSA ADP Schedule Contractwith IBM Corp.
Contents
Tables . . . . . . . . . . . . . . . v
Chapter 1. Overview of the agent . . . . 1IBM Tivoli Monitoring . . . . . . . . . . . 1Functions of the monitoring agent . . . . . . . 1System p monitoring agents . . . . . . . . . 1New in this release . . . . . . . . . . . . 3Components of the IBM Tivoli Monitoringenvironment . . . . . . . . . . . . . . 3Agent Management Services . . . . . . . . . 4User interface options . . . . . . . . . . . 5
Chapter 2. Requirements and agentinstallation and configuration . . . . . 7Requirements for the monitoring agent . . . . . 7Language pack installation . . . . . . . . . 8
Installing language packs on Windows systems. . 8Installing language packs on UNIX or Linuxsystems . . . . . . . . . . . . . . . 8Silent installation of language packs on Windows,UNIX, or Linux systems . . . . . . . . . 9
Agent-specific installation and configuration . . . 11AIX . . . . . . . . . . . . . . . . 11VIOS . . . . . . . . . . . . . . . 14Usage . . . . . . . . . . . . . . . 16
Chapter 3. Workspaces reference . . . 19Predefined workspaces . . . . . . . . . . 19Workspace descriptions . . . . . . . . . . 20
CEC Base Navigator item. . . . . . . . . 20CEC Resources Navigator item . . . . . . . 21CEC Utilization Navigator item. . . . . . . 21
Chapter 4. Attributes reference . . . . 23Attribute groups for the monitoring agent . . . . 23Attributes in each attribute group . . . . . . . 24
AME attribute group . . . . . . . . . . 24AMS Pools attribute group . . . . . . . . 31CPU Pools attribute group . . . . . . . . 33Director attribute group . . . . . . . . . 36Global CEC attribute group . . . . . . . . 37HMC Switch attribute group . . . . . . . 44Mon LPars attribute group . . . . . . . . 45Mon Unmon Alloc attribute group. . . . . . 56Per LPAR attribute group. . . . . . . . . 61Performance Object Status attribute group . . . 66TADDM attribute group . . . . . . . . . 69
Disk capacity planning for historical data . . . . 70
Chapter 5. Situations reference . . . . 73Predefined situations . . . . . . . . . . . 73Situation descriptions . . . . . . . . . . . 74
CEC Base Navigator item. . . . . . . . . 74CEC Resources Navigator item . . . . . . . 74
CEC Utilization Navigator item. . . . . . . 75
Chapter 6. Take Action commandsreference. . . . . . . . . . . . . . 79Predefined Take Action commands . . . . . . 79
Chapter 7. Policies reference . . . . . 81Predefined policies . . . . . . . . . . . . 81
Chapter 8. Tivoli Common Reportingfor the System p monitoring agents . . 83More information about Tivoli Common Reporting 83Prerequisites . . . . . . . . . . . . . . 83
Install Tivoli Common Reporting V2.1.1 or V3.1 84Obtain the reports from the product media . . . 84Configure historical collection . . . . . . . 84Create indexes . . . . . . . . . . . . 87Connect to the Tivoli Data Warehouse . . . . 88
Importing and running Cognos reports . . . . . 89Uninstalling reports . . . . . . . . . . . 92Predefined Cognos reports . . . . . . . . . 92
Prerequisites Checking reports . . . . . . . 94Accounting reports . . . . . . . . . . . 95Performance trends and resource forecastsreports . . . . . . . . . . . . . . . 96What if analysis for workload placement reports 114Workload right-sizing and balancing reports . . 121
Chapter 9. Troubleshooting . . . . . 131Trace logging . . . . . . . . . . . . . 132
Overview of log file management . . . . . 132Principal trace log files . . . . . . . . . 133Examples: Using trace logs . . . . . . . . 135RAS trace parameters . . . . . . . . . 136Dynamic modification of trace settings . . . . 138Setting trace parameters for the Tivoli EnterpriseConsole server . . . . . . . . . . . . 141
Problems and workarounds . . . . . . . . 142Installation and configuration troubleshooting 142Remote deployment troubleshooting . . . . 144Agent troubleshooting . . . . . . . . . 145Workspace troubleshooting . . . . . . . . 147Situation troubleshooting . . . . . . . . 149Take Action commands troubleshooting . . . 152Tivoli Common Reporting troubleshooting . . 152
Support information . . . . . . . . . . . 161
Appendix A. Event mapping . . . . . 163
Appendix B. Discovery LibraryAdapter for the CEC Base agent . . . 171DLA data model class types represented in CDM 171DLA data model classes for the CEC Base agent 171
CEC class . . . . . . . . . . . . . 172
© Copyright IBM Corp. 2007, 2013 iii

LPAR class . . . . . . . . . . . . . 172VIOS class . . . . . . . . . . . . . 174AIX class . . . . . . . . . . . . . . 174VIOS OS class . . . . . . . . . . . . 175TMSAgent class . . . . . . . . . . . 175
Appendix C. Integration with TivoliBusiness Service Manager . . . . . 177Components for integrating with Tivoli BusinessService Manager . . . . . . . . . . . . 177Tasks to integrate the agent with Tivoli BusinessService Manager . . . . . . . . . . . . 178
Installing the Discovery Library Toolkit on theTivoli Business Service Manager . . . . . . 178Configuring the Tivoli Event Integration Facility(EIF) probe to enrich events . . . . . . . 178Creating a service in Tivoli Business ServiceManager . . . . . . . . . . . . . . 178
Creating a data source mapping for each datasource . . . . . . . . . . . . . . . 179Configuring additional IBM Tivoli Monitoringweb services. . . . . . . . . . . . . 179Viewing data in the Tivoli Enterprise Portal . . 179
Appendix D. Documentation library 181Prerequisite publications. . . . . . . . . . 181Related publications . . . . . . . . . . . 182Other sources of documentation . . . . . . . 182
Notices . . . . . . . . . . . . . . 183Trademarks . . . . . . . . . . . . . . 185
Index . . . . . . . . . . . . . . . 187
iv IBM Tivoli Monitoring: CEC Base Agent User's Guide

Tables
1. Capacity planning for historical data logged bythe CEC Base agent . . . . . . . . . . 70
2. Tables for daily and hourly summarization 853. Queries for databases . . . . . . . . . 864. Setup files . . . . . . . . . . . . . 905. Information to gather before contacting IBM
Software Support . . . . . . . . . . 1316. Trace log files for troubleshooting agents 1337. Problems and solutions for installation and
configuration . . . . . . . . . . . 142
8. General problems and solutions foruninstallation . . . . . . . . . . . 144
9. Remote deployment problems and solutions 14410. Agent problems and solutions . . . . . . 14511. Workspace problems and solutions . . . . 14812. Situation problems and solutions . . . . . 15013. Take Action commands problems and
solutions . . . . . . . . . . . . . 15214. Tivoli Common Reporting for CEC Base agent
problems and solutions . . . . . . . . 155
© Copyright IBM Corp. 2007, 2013 v

vi IBM Tivoli Monitoring: CEC Base Agent User's Guide
Chapter 1. Overview of the agent
The IBM Tivoli Monitoring: CEC Base Agent (product code PK) provides you with the capability tomonitor the Central Electronics Complex (CEC).
IBM® Tivoli® Monitoring is the base software for the CEC Base agent. The CEC Base agent monitors theSystem p Central Electronics Complex Availability and Health resources.
IBM Tivoli MonitoringIBM Tivoli Monitoring provides a way to monitor the availability and performance of all the systems inyour enterprise from one or several designated workstations. It also provides useful historical data thatyou can use to track trends and to troubleshoot system problems.
You can use IBM Tivoli Monitoring to achieve the following tasks:v Monitor for alerts on the systems that you are managing by using predefined situations or custom
situations.v Establish your own performance thresholds.v Trace the causes leading to an alert.v Gather comprehensive data about system conditions.v Use policies to take actions, schedule work, and automate manual tasks.
The Tivoli Enterprise Portal is the interface for IBM Tivoli Monitoring products. You can use theconsolidated view of your environment as seen in the Tivoli Enterprise Portal to monitor and resolveperformance issues throughout the enterprise.
See the IBM Tivoli Monitoring publications listed in “Prerequisite publications” on page 181 for completeinformation about IBM Tivoli Monitoring and the Tivoli Enterprise Portal.
Functions of the monitoring agentSystem p Central Electronics Complex (CEC) Availability and Health Resources Monitoring
Shows an inventory of CEC resources and resources allocated to individual Logical Partitions(LPARs) on the CEC. The CEC Base agent monitors the number of LPARs, CPU, and memoryallocations per LPAR, LPAR state, LPAR utilization, operating environment, CEC modes, andCEC utilization.
System p monitoring agentsThe four System p® monitoring agents monitor the PowerVM® environment.
Figure 1 on page 2 shows the four System p monitoring agents in the PowerVM environment:v AIX® Premium agentv CEC Base agentv HMC Base agentv VIOS Premium agent
Each agent operates independently of each other and together, they provide a complete PowerVMmonitoring offering.
© Copyright IBM Corp. 2007, 2013 1
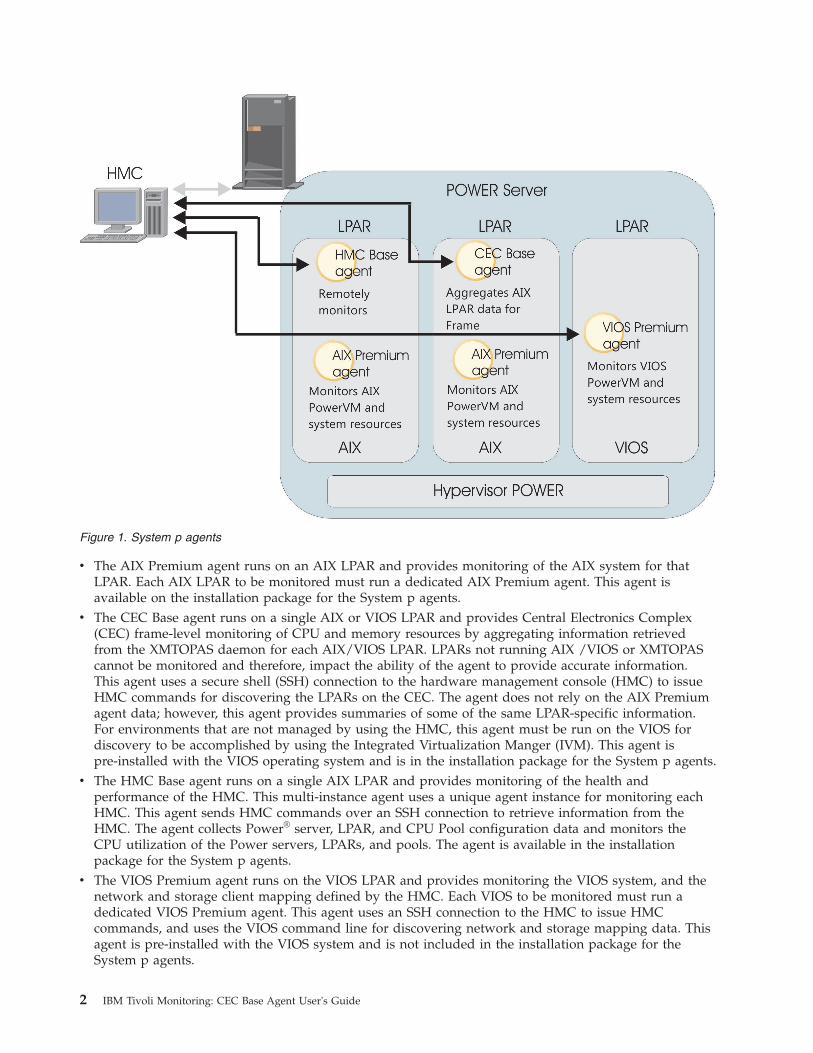
v The AIX Premium agent runs on an AIX LPAR and provides monitoring of the AIX system for thatLPAR. Each AIX LPAR to be monitored must run a dedicated AIX Premium agent. This agent isavailable on the installation package for the System p agents.
v The CEC Base agent runs on a single AIX or VIOS LPAR and provides Central Electronics Complex(CEC) frame-level monitoring of CPU and memory resources by aggregating information retrievedfrom the XMTOPAS daemon for each AIX/VIOS LPAR. LPARs not running AIX /VIOS or XMTOPAScannot be monitored and therefore, impact the ability of the agent to provide accurate information.This agent uses a secure shell (SSH) connection to the hardware management console (HMC) to issueHMC commands for discovering the LPARs on the CEC. The agent does not rely on the AIX Premiumagent data; however, this agent provides summaries of some of the same LPAR-specific information.For environments that are not managed by using the HMC, this agent must be run on the VIOS fordiscovery to be accomplished by using the Integrated Virtualization Manger (IVM). This agent ispre-installed with the VIOS operating system and is in the installation package for the System p agents.
v The HMC Base agent runs on a single AIX LPAR and provides monitoring of the health andperformance of the HMC. This multi-instance agent uses a unique agent instance for monitoring eachHMC. This agent sends HMC commands over an SSH connection to retrieve information from theHMC. The agent collects Power® server, LPAR, and CPU Pool configuration data and monitors theCPU utilization of the Power servers, LPARs, and pools. The agent is available in the installationpackage for the System p agents.
v The VIOS Premium agent runs on the VIOS LPAR and provides monitoring the VIOS system, and thenetwork and storage client mapping defined by the HMC. Each VIOS to be monitored must run adedicated VIOS Premium agent. This agent uses an SSH connection to the HMC to issue HMCcommands, and uses the VIOS command line for discovering network and storage mapping data. Thisagent is pre-installed with the VIOS system and is not included in the installation package for theSystem p agents.
Figure 1. System p agents
2 IBM Tivoli Monitoring: CEC Base Agent User's Guide
New in this releaseThe following enhancements to Tivoli Common Reporting for the System p monitoring agents were madesince version 6.2.2 Interim Feature 1 of the CEC Base agent.v A new Prerequisite Scanner Report helps in troubleshooting reports.v 14 new Cognos reports provide information about LPARs, CPU utilization, and trend and forecast for
the Managed Server by using the HMC Base agent V 6.2.2.3. These reports include new what ifanalysis reports for the HMC Base agent.
v One new report for the CEC Base agent provides information about the balanced and unbalancedCECs in your System p environment, for example significant variation in CPU or memory utilizationbetween the CECs. This information can be used to improve utilization in the environments.
v One new report for the VIOS Premium agent provides statistical information about the Physical FibreChannel Adapters in your System p environment. The data model was updated to add theKVA_FC_STATS table.
v Fixes for the CEC Base agent and VIOS Premium agent reports and data model improve performance.v Support is provided to run the reports against more summarization types: Weekly and Monthly.v The version number for the reports package is in the report titles instead of the package name.v The report names are prefixed with the agent name to help identify the reports easily.v New attribute groups for the HMC Base agent were added to the data model.v Raw data for VIOS Premium and AIX Premium agent attribute groups is exposed in the data model to
allow custom reporting.v Index scripts are provided to allow database administrators to update the indexes of tables or views
that are used in reports. These scripts improve the performance of reports that are running.v Tooltips provide descriptions of the data items in the data model when you hover over them in Query
or Report Studio.
Components of the IBM Tivoli Monitoring environmentAfter you install and set up the CEC Base agent, you have an environment that contains the client, server,and monitoring agent implementation for Tivoli Monitoring.
This Tivoli Monitoring environment contains the following components:
Tivoli Enterprise Portal clientThe portal has a user interface based on Java™ for viewing and monitoring your enterprise.
Tivoli Enterprise Portal ServerThe portal server is placed between the client and the Tivoli Enterprise Monitoring Server andenables retrieval, manipulation, and analysis of data from the monitoring agents. The TivoliEnterprise Portal Server is the central repository for all user data.
Tivoli Enterprise Monitoring ServerThe monitoring server acts as a collection and control point for alerts received from themonitoring agents, and collects their performance and availability data. The Tivoli EnterpriseMonitoring Server is also a repository for historical data.
Tivoli Enterprise Monitoring Agent, CEC Base agentThis monitoring agent collects data and distributes the data to the Tivoli Enterprise MonitoringServer, Tivoli Enterprise Portal Server, Tivoli Enterprise Portal, Tivoli Data Warehouse, and TivoliIntegrated Portal.
IBM Tivoli Netcool/OMNIbusTivoli Netcool/OMNIbus is an optional component and the recommended event managementcomponent. The Netcool/OMNIbus software is a service level management (SLM) system thatdelivers real-time, centralized monitoring of complex networks and IT domain events. Event
Chapter 1. Overview of the agent 3

information is tracked in a high-performance, in-memory database and presented to specific usersthrough individually configurable filters and views. The software includes automation functionsthat you can use to perform intelligent processing on managed events. You can use this softwareto forward events for Tivoli Monitoring situations to Tivoli Netcool/OMNIbus.
IBM Tivoli Enterprise Console®
The Tivoli Enterprise Console is an optional component that acts as a central collection point forevents from various sources, including events from other Tivoli software applications, Tivolipartner applications, custom applications, network management platforms, and relationaldatabase systems. You can view these events through the Tivoli Enterprise Portal (by using theevent viewer), and you can forward events from Tivoli Monitoring situations to the TivoliEnterprise Console component. If you do not already use Tivoli Enterprise Console and need anevent management component, you can choose to use IBM Tivoli Netcool/OMNIbus.
IBM Tivoli Common ReportingTivoli Common Reporting is a separately installable feature available to users of Tivoli softwarethat provides a consistent approach to generating and customizing reports. Some individualproducts provide reports that are designed for use with Tivoli Common Reporting and have aconsistent look and feel.
IBM Tivoli Application Dependency Discovery Manager (TADDM)TADDM delivers automated discovery and configuration tracking capabilities to build applicationmaps that provide real-time visibility into application complexity.
IBM Tivoli Business Service ManagerThe Tivoli Business Service Manager component delivers real-time information to help yourespond to alerts effectively based on business requirements. Optionally, you can use thiscomponent to meet service-level agreements (SLAs). Use the Tivoli Business Service Managertools to help build a service model that you can integrate with Tivoli Netcool/OMNIbus alerts oroptionally integrate with data from an SQL data source. Optional components provide access todata from other IBM Tivoli applications such as Tivoli Monitoring and TADDM.
IBM Dashboard Application Services HubThe Dashboard Application Services Hub has a core set of components that provide suchadministrative essentials as network security and database management. This component replacesthe Tivoli Integrated Portal component after version 2.2.
Tivoli Integrated PortalTivoli Integrated Portal helps the interaction and secure passing of data between Tivoli productsthrough a common portal. You can launch from one application to another and within the samedashboard view research different aspects of your managed enterprise. This component isinstalled automatically with the first Tivoli product that uses the Tivoli Integrated Portalframework. Subsequent products can install updated versions of Tivoli Integrated Portal. Afterversion 2.2, this component is replaced by the Dashboard Application Services Hub.
Agent Management ServicesYou can use IBM Tivoli Monitoring Agent Management Services to manage the CEC Base agent.
Agent Management Services is available for the following IBM Tivoli Monitoring OS agents: Windows,Linux, and UNIX. The services are designed to keep the CEC Base agent available, and to provideinformation about the status of the product to the Tivoli Enterprise Portal. IBM Tivoli Monitoring V6.2.2,Fix Pack 2 or later provides support for Agent Management Services. For more information about AgentManagement Services, see Agent Management Services in the IBM Tivoli Monitoring Administrator's Guide.
4 IBM Tivoli Monitoring: CEC Base Agent User's Guide
User interface optionsInstallation of the base IBM Tivoli Monitoring software and other integrated applications providesvarious interfaces that you can use to work with your resources and data.
The following interfaces are available:
Tivoli Enterprise Portal user interfaceYou can run the Tivoli Enterprise Portal as a desktop application or a browser application. Theclient interface is a graphical user interface (GUI) based on Java on a Windows or Linuxworkstation. The browser application is automatically installed with the Tivoli Enterprise PortalServer. The desktop application is installed by using the Tivoli Monitoring installation media orwith a Java Web Start application. To start the Tivoli Enterprise Portal browser client in yourInternet browser, enter the URL for a specific Tivoli Enterprise Portal browser client installed onyour Web server.
Command-line interfaceYou can use Tivoli Monitoring commands to manage the Tivoli Monitoring components and theirconfiguration. You can also run commands at the Tivoli Enterprise Console event server or theTivoli Netcool/OMNIbus ObjectServer to configure event synchronization for enterprisesituations.
Manage Tivoli Enterprise Monitoring Services windowYou can use the window for the Manage Tivoli Enterprise Monitoring Services utility to configurethe agent and start Tivoli services not designated to start automatically.
IBM Tivoli Netcool/OMNIbus event listYou can use the Netcool/OMNIbus event list to monitor and manage events. An event is createdwhen the Netcool/OMNIbus ObjectServer receives an event, alert, message, or data item. Eachevent is made up of columns (or fields) of information that are displayed in a row in theObjectServer alerts.status table. The Tivoli Netcool/OMNIbus web GUI is also a web-basedapplication that processes network events from one or more data sources and presents the eventdata in various graphical formats.
IBM Tivoli Enterprise ConsoleYou can use the Tivoli Enterprise Console to help ensure the optimal availability of an IT servicefor an organization. The Tivoli Enterprise Console is an event management application thatintegrates system, network, database, and application management. If you do not already useTivoli Enterprise Console and need an event management component, you can choose to useTivoli Netcool/OMNIbus.
IBM Tivoli Common ReportingUse the Tivoli Common Reporting web user interface for specifying report parameters and otherreport properties, generating formatted reports, scheduling reports, and viewing reports. Thisuser interface is based on the Dashboard Application Services Hub for Tivoli Common Reporting3.1 and on Tivoli Integrated Portal for earlier versions.
IBM Tivoli Application Dependency Discovery ManagerThe Discovery Management Console is the TADDM client user interface for managingdiscoveries.
IBM Tivoli Business Service ManagerThe Tivoli Business Service Manager console provides a graphical user interface that you can useto logically link services and business requirements within the service model. The service modelprovides an operator with a second-by-second view of how an enterprise is performing at anymoment in time or how the enterprise performed over a time period.
IBM Dashboard Application Services Hub consoleThe Dashboard Application Services Hub provides an administrative console for applications thatuse this framework. It is a web-based console that provides common task navigation for
Chapter 1. Overview of the agent 5

products, aggregation of data from multiple products into a single view, and the passing ofmessages between views from different products. This interface replaces the Tivoli IntegratedPortal component after version 2.2.
Tivoli Integrated PortalWeb-based products that are built on the Tivoli Integrated Portal framework share a commonuser interface where you can launch applications and share information. After version 2.2, thisinterface is replaced by the Dashboard Application Services Hub.
6 IBM Tivoli Monitoring: CEC Base Agent User's Guide

Chapter 2. Requirements and agent installation andconfiguration
Agent installation and configuration requires the use of the IBM Tivoli Monitoring Installation and SetupGuide and agent-specific installation and configuration information.
To install and configure IBM Tivoli Monitoring: CEC Base Agent, use the procedures for installingmonitoring agents in the IBM Tivoli Monitoring Installation and Setup Guide along with the agent-specificinstallation and configuration information.
If you are installing silently by using a response file, see “Performing a silent installation of IBM TivoliMonitoring” in the IBM Tivoli Monitoring Installation and Setup Guide.
s
Requirements for the monitoring agentIn addition to the requirements described in the IBM Tivoli Monitoring Installation and Setup Guide, agentstypically have agent-specific requirements.
The CEC Base agent has the following agent-specific requirements:v The monitoring agent runs on any of these operating systems:
– AIX 5.3– AIX 6.1– AIX 7.1– VIOS V2.2.1 (all releases) or V2.2.2 (all releases)
v This agent monitors the following versions:– CEC managed by HMC V6 or later, or IVM V2.2.1 (all releases) or V2.2.2 (all releases)
v The CEC agent is now preinstalled on the VIOS V2.2.1 (all releases) or V2.2.2 (all releases) to eliminatethe requirement to run the agent in an AIX LPAR. This configuration prevents the agent from beingaffected by AIX LPAR that are relocations initiated by the PowerVM Live Partition Mobility functionbecause the CEC agent runs on a non-relocatable partition.If the agent is running in a VIOS LPAR, it tries to connect to all LPARs on the CEC to gather summaryutilization information for that CEC. The agent communicates with the XMTOPAS or XMSERVDdaemon that must be running on each LPAR. LPARs that are running this daemon are defined asMonitored. LPARs that are not running this daemon are defined as Unmonitored because utilizationinformation for those LPARs cannot be determined. UDP port 2279 is used for this communication.Administrators can ensure that this port is not blocked by a firewall that might exist between theLPARs.
v A single computer that hosts the hub monitoring server, portal server, and a monitoring agent requiresapproximately 300 MB of space. A computer that hosts only the monitoring agent requiresapproximately 30 MB of space, including the specific enablement code for the monitoring agent. Morespace is required for each additional monitoring agent that you deploy on the monitoring computer.
v The IBM Systems Director dynamic workspace links are displayed only in the Tivoli Enterprise Portalworkspaces when the IBM Tivoli Monitoring version of the portal is at least IBM Tivoli Monitoring6.2.2 and an IBM Systems Director 6 host name or IP address is configured for the agent.
v When you launch to the IBM Systems Director Web UI, the agent must authenticate to the IBMSystems Director Server by using a user ID and password. By default, the Tivoli Enterprise Portal userID and password are used to automatically authenticate the user to the Systems Director Server. The
© Copyright IBM Corp. 2007, 2013 7

authentication is done by passing the Tivoli Enterprise Portal user ID and password in the encodedURL properties, eliminating the requirment to log on at the Systems Director Logon prompt. The userID and password information is protected by using the HTTPS protocol between the Tivoli EnterprisePortal and the IBM Systems Director Server. The agent can be configured to use a manual logon thatauthenticates the user for subsequent launches until either the Tivoli Enterprise Portal session is closed,or the Systems Director Server session times out because of inactivity.
v To connect to the HMC with a user other than hscroot, the user ID must have HMC Viewer privileges.v The monitoring agent must be connected to the following software:
– IBM Tivoli Monitoring V6.2.2 or laterv The openssh.base.client fileset must be present.
Language pack installationThe steps for installing language packs depend on which operating system and mode of installation youare using.
To install a language pack for the agent support files on the Tivoli Enterprise Monitoring Server, theTivoli Enterprise Monitoring Agent, and the Tivoli Enterprise Portal Server, make sure that you installedthe product in the English language. Then use the steps for the operating system or mode of installationyou are using:v “Installing language packs on Windows systems”v “Installing language packs on UNIX or Linux systems”v “Silent installation of language packs on Windows, UNIX, or Linux systems” on page 9
Installing language packs on Windows systemsYou can install the language packs on a Windows system.
Before you begin
First, make sure that you installed the product in the English language.
Procedure1. On the language pack CD, double-click the lpinstaller.bat file to start the installation program.2. Select the language of the installer and click OK.3. In the Introduction panel, click Next
4. Click Add/Update and click Next.5. Select the folder where the National Language Support package (NLSPackage) files are located.
Typically, the NLSPackage files are located in the nlspackage folder where the installer executablefile is located.
6. Select the language support for the agent of your choice and click Next. To make multiple selections,press Ctrl and select the language that you want.
7. Select the languages that you want to install and click Next.8. Examine the installation summary page and click Next to begin installation.9. After installation completes, click Finish to exit the installer.
10. Restart the Tivoli Enterprise Portal, Tivoli Enterprise Portal Server, and Eclipse Help Server if any ofthese components are installed.
Installing language packs on UNIX or Linux systemsYou can install the language packs on a UNIX or Linux system.
8 IBM Tivoli Monitoring: CEC Base Agent User's Guide

Before you begin
First, make sure that you installed the product in the English language.
Procedure1. Enter the mkdir command to create a temporary directory on the computer, for example, mkdir
dir_name. Make sure that the full path of the directory does not contain any spaces.2. Mount the language pack CD to the temporary directory that you created.3. Enter the following command to start the installation program: cd dir_name lpinstaller.sh -c
install_dir where install_dir is where you installed IBM Tivoli Monitoring. Typically, the directoryname is /opt/IBM/ITM for UNIX and Linux systems.
4. Select the language of the installer and click OK.5. In the Introduction panel, click Next.6. Click Add/Update and click Next.7. Select the folder where the National Language Support package (NLSPackage) files are located.
Typically, the NLSPackage files are located in the nlspackage folder where the installer executable fileis located.
8. Select the language support for the agent of your choice and click Next. To make multiple selections,press Ctrl and select the language that you want.
9. Select the languages that you want to install and click Next.10. Examine the installation summary page and click Next to begin installation.11. After installation completes, click Finish to exit the installer.12. Restart the Tivoli Enterprise Portal, Tivoli Enterprise Portal Server, and Eclipse Help Server if any of
these components are installed.
Silent installation of language packs on Windows, UNIX, or LinuxsystemsYou can use the silent-mode installation method to install the language packs. In silent mode, theinstallation process obtains the installation settings from a predefined response file. It does not promptyou for any information.
Before you begin
First, make sure that you installed the product in the English language.
Procedure1. Copy and paste the ITM_Agent_LP_silent.rsp response file template as shown in “Response file
example” on page 10.2. Change the following parameter settings:
NLS_PACKAGE_FOLDERFolder where the National Language Support package (NLSPackage) files are located.Typically, the NLSPackage files are located in the nlspackage folder, for example:NLS_PACKAGE_FOLDER = //tmp//LP//nlspackage.
PROD_SELECTION_PKGName of the language pack to install. Several product components can be included in onelanguage package. You might want to install only some of the available components in alanguage pack.
BASE_AGENT_FOUND_PKG_LISTAgent for which you are installing language support. This value is usually the same asPROD_SELECTION_PKG.
Chapter 2. Requirements and agent installation and configuration 9
LANG_SELECTION_LISTLanguage you want to install.
3. Enter the command to install the language pack with a response file (silent installation):v For Windows systems:
lpinstaller.bat -f path_to_response_file
v For UNIX or Linux systems:lpinstaller.sh -c candle_home -f path_to_response_file
where candle_home is the IBM Tivoli Monitoring base directory.
Response file example# IBM Tivoli Monitoring Agent Language Pack Silent Installation Operation##This is a sample response file for silent installation mode for the IBM Tivoli#Monitoring Common Language Pack Installer.#.#This file uses the IBM Tivoli Monitoring Common Agent Language Pack with the#install package as an example.#Note:#This response file is for the INSTALLATION of language packs only.#This file does not support UNINSTALLATION of language packs in silent mode.#-------------------------------------------------------------------------------#-------------------------------------------------------------------------------#To successfully complete a silent installation of the the example of Common Agent#localization pack, complete the following steps:##1.Copy ITM_Agent_LP_silent.rsp to the directory where lpinstaller.bat or#lpinstaller.sh is located (IBM Tivoli Monitoring Agent Language Pack build#location).##2.Modify the response file so that it is customized correctly and completely for#your site.# Complete all of the following steps in the response file.##3.After customizing the response file, invoke the silent installation using the#following command:#For Windows:# lpinstaller.bat -f <path_to_response_file>#For UNIX and Linux:# lpinstaller.sh -c <candle_home> -f <path_to_response_file>#Note:<candle_home> is the IBM Tivoli Monitoring base directory.#--------------------------------------------------------------------------------#--------------------------------------------------------------------------------#Force silent install mode.#--------------------------------------------------------------------------------INSTALLER_UI=silent#---------------------------------------------------------------------------------#Run add and update actions.#---------------------------------------------------------------------------------CHOSEN_INSTALL_SET=ADDUPD_SET#---------------------------------------------------------------------------------#NLS Package Folder, where the NLS Packages exist.#For Windows:# Use the backslash-backslash(\\) as a file separator (for example,#C:\\zosgmv\\LCD7-3583-01\\nlspackage).#For UNIX and Linux:# Use the slash-slash (//) as a file separator (for example,#//installtivoli//lpsilenttest//nlspackage).#---------------------------------------------------------------------------------#NLS_PACKAGE_FOLDER=C:\\zosgmv\\LCD7-3583-01\\nlspackageNLS_PACKAGE_FOLDER=//tmp//LP//nlspackage#---------------------------------------------------------------------------------#List the packages to process; both variables are required.
10 IBM Tivoli Monitoring: CEC Base Agent User's Guide

#Each variable requires that full paths are specified.#Separate multiple entries with a semicolon (;).#For Windows:# Use the backslash-backslash(\\) as a file separator.#For Unix and Linux:# Use the slash-slash (//) as a file separator.#---------------------------------------------------------------------------------#PROD_SELECTION_PKG=C:\\zosgmv\\LCD7-3583-01\\nlspackage\\KIP_NLS.nlspkg#BASE_AGENT_FOUND_PKG_LIST=C:\\zosgmv\\LCD7-3583-01\\nlspackage\\KIP_NLS.nlspkgPROD_SELECTION_PKG=//tmp//LP//nlspackage//kex_nls.nlspkg;//tmp//LP//nlspackage//koq_nls.nlspkgBASE_AGENT_FOUND_PKG_LIST=//tmp//LP//nlspackage//kex_nls.nlspkg;//tmp//LP//nlspackage//koq_nls.nlspkg#--------------------------------------------------------------------------------#List the languages to process.#Separate multiple entries with semicolons.#--------------------------------------------------------------------------------LANG_SELECTION_LIST=pt_BR;fr;de;it;ja;ko;zh_CN;es;zh_TW
Agent-specific installation and configurationIn addition to the installation and configuration information in the IBM Tivoli Monitoring Installation andSetup Guide, use this agent-specific installation and configuration information to install the CEC Baseagent.
AIX
Installation
Install the CEC Base agent on an AIX operating system by using the install-dir/install.sh script. Ifyou install as nonroot, you are prompted for the root password during the installation. Prompting occursso that the installation script can add the agents to the system initialization scripts. If you do not enterthe root password, the agents are not started automatically when the system is restarted.
Note: The IBM Tivoli Monitoring install.sh script identifies AIX 6.1 and 7.1 systems as AIX R6.1 (64bit). Install the agent on AIX 6.1 and 7.1 by using the AIX 6.1 installer option.
Configurationv Use the standard IBM Tivoli Monitoring agent configuration procedure. The CEC Base agent
communicates with the Hardware Management Console (HMC) through a Secure Shell (SSH)connection. Establishing this communication is essential because it allows the agent to obtain partitionand hardware information that pertains to the managed system so that it can be presented on theTivoli Enterprise Portal. Therefore, setting up SSL keys for non-prompted access from the agent systemto the HMC is required. The simplest way to set up the keys is to use the key.pl script that isprovided to facilitate this procedure. If the key.pl script is used, the openssh.base.client fileset isrequired. Run the key.pl command, which is in the install_dir/aix523/pk/bin directory.
v Use the key.pl command to set up SSH keys for non-prompted SSH access to the HMC.v key.pl command usage and description
– Purpose:Set up SSH credentials between the CEC Base agent system and the HMC to which the managedsystem that is to be monitored connects. If the command is run without providing any arguments,the command prompts you for the host name of the primary and the backup HMC servers, and theuser ID and password for the primary HMC and the backup HMC servers. The command alsoprompts for the name of the managed system that is to be monitored by the CEC Base agent. Thevalue for the managed system is required by the CEC Base agent for gathering metrics. Thecommand generates an SSH key pair of type RSA and connects to the HMC to authorize the HMCto allow a connection from the CEC Base agent system. As a result, a minimum of two password
Chapter 2. Requirements and agent installation and configuration 11
prompts occur if the passwords were entered correctly. If the -u user flag is not passed, the defaultHMC user of 'hscroot' is used. After the key is set up, the command stores the HMC and themanaged system information in a file in the install_dir/config directory. Running the commandwith the -q flag prints the file content. For the SSH key setup for IBM Tivoli Monitoring agentcommunication, the command must be executed under the same user ID that runs the agent.
– Syntax:key.pl [-q] | [ [-f] -s hmc [-u user] [-m manage] ] | [-h]
– Parameters:
-q Query for current HMC and managed system setup.
-u userHMC user for the primary HMC.
-y userUser for the secondary HMC.
-s hmcHostname or the IP address of the HMC to which the managed system connects.
-b hmcHostname or IP address of the secondary HMC.
-m manageManaged system to be monitored by the CEC Base agent. The value can be determined byrunning the following command on the HMC and choosing the correct CEC from the list thatthe HMC manages: lssyscfg -r sys -F name
-fForce the regeneration of key setup.
– Examples:- To set up the SSH key against an HMC by using the prompted interface, enter the following
command:key.pl
- To set up the SSH key against an HMC called majesty with a managed system named wampeter,enter the following command:key.pl -s majesty -m wampeter
- To regenerate the SSH key against an HMC called majesty, enter the following command:key.pl -f -s majesty
– Use the itmcmd command to configure the Tivoli Enterprise Monitoring Server and othercommunication parameters.
Configuration values
For both local and remote configuration, you provide the configuration values for the agent to operate.
When you are configuring an agent, a panel is displayed so you can enter each value. When a defaultvalue exists, this value is pre-entered into the field. If a field represents a password, two entry fields aredisplayed. You must enter the same value in each field. The values that you type are not displayed tohelp maintain the security of these values.
The configuration for this agent is organized into the following groups:
IBM Systems Director (DIRECTOR)
Use TEP Credentials to authenticate to IBM Systems Director Server.A value of Yes indicates that the Tivoli Enterprise Portal user ID and password are usedfor authenticating to the IBM Systems Director Server. A value of No indicates that you
12 IBM Tivoli Monitoring: CEC Base Agent User's Guide

are required to manually log in to the IBM Systems Director Server. Subsequentnavigation to the IBM Systems Director workspace uses this same user session, so you arenot required to log in again unless the session times out because of inactivity or theportal is restarted.
The type is one of the following values: Yes, No.
This value is optional.
IBM Systems Director Server Host NameAn IBM Systems Director Server host name or IP address that is managing the VMwareenvironment into which the agent can launch.
The type is string.
This value is optional.
IBM Systems Director Server Port NumberThe port number of the IBM Systems Director Server. The default value is 8422.
The type is string.
This value is optional.
Remote installation and configuration
You can install the monitoring agent remotely from the Tivoli Enterprise Portal or from the commandline.
Important: Remote installation and configuration is not supported for a CEC Base agent on a VIOSpartition.
Note: The CEC Base agent can be remotely installed and configured, but you cannot configure SSHremotely. SSH must be configured on the system, either manually or by running the key.pl script on thesystem.
When installing the agent remotely, you must provide the configuration values for the agent to operate.See “Configuration values” on page 12.
To install from the portal, see the IBM Tivoli Monitoring Installation and Setup Guide.
To remotely install or configure an agent through the Tivoli Enterprise Portal, you must have installed theapplication support for that agent (Tivoli Enterprise Monitoring Server, Tivoli Enterprise Portal Server,and Tivoli Enterprise Portal). You must also have installed the agent bundle into the Remote DeployDepot.
For information about displaying the configuration options that are available to use with theconfigureSystem or addSystem commands see “tacmd describeSystemType” in the IBM Tivoli MonitoringCommand Reference.
If you are using the command line, the following command is an example of remote installation andconfiguration:tacmd addSystem -t PK -n sample.node.name:KUX-p DIRECTOR.KPK_DIRECTOR_AUTHENTICATION=valueDIRECTOR.KPK_DIRECTOR_HOST_ADDRESS=valueDIRECTOR.KPK_DIRECTOR_PORT_NUMBER=value
Chapter 2. Requirements and agent installation and configuration 13

VIOSInstallation
The CEC Base agent comes pre-installed on the VIOS LPAR.
Configurationv Although the CEC Base agent is preinstalled on the VIOS, you must configure the CEC Base agent
with the cfgsvc command. The cfgsvc command configures the CEC Base agent with details about themanaged system and the HMC. (The command must be entered as a single line; the lines are separatedhere for clarity.)cfgsvc ITM_cec -attrHOSTNAME=tems_hostname_or_address1MIRROR=tems_hostname_or_address2MANAGING_SYSTEM=hmc_user@hmc_hostname_or_address3SECOND_MANAGING_SYSTEM=hmc_user@hmc_hostname_or_address4CEC=cec_nameDIRECTOR_HOST_ADDRESS=director_hostnameDIRECTOR_AUTHENTICATION=YesDIRECTOR_PORT_NUMBER=8422RESTART_ON_REBOOT=value
Where:
ITM_cecName of the monitoring agent.
-attr Parameter indicating the start of the attribute key=value pairs.
HOSTNAME=tems_hostname_or_address1(Required) Either the host name or IP address of the Tivoli Enterprise Monitoring Server towhich the CEC Base agent sends data.
MIRROR=tems_hostname_or_address2(Optional) Secondary Tivoli Enterprise Monitoring Server host name or IP address.
MANAGING_SYSTEM=hmc_user@hmc_hostname_or_address3(Required) hmc_hostname_or_address3 is the host name or IP address of the primary HardwareManagement Console (HMC) that is attached to the managed system on which the Virtual I/OServer with the monitoring agent is located.
(Optional) hmc_user is the user on the HMC computer with HMC viewer authority. The defaulthscroot user ID is used if no other user ID is provided.
The @ symbol is used to separate the user name from the host name, and is required onlywhen a user name is specified.
SECOND_MANAGING_SYSTEM=hmc_user@hmc_hostname_or_address4(Optional) Secondary HMC host name or IP address. User ID requirements are the same as forthe primary managing system.
CEC=cec_name(Required) Name of the managed system that the agent is monitoring. The value can bedetermined by running the following command on the HMC and choosing the correct CECfrom the list that the HMC manages: lssyscfg -r sys -F name
DIRECTOR_HOST_ADDRESS=director_hostname(Optional) IBM Systems Director Server to which to navigate by using the IBM SystemsDirector workspace links.
DIRECTOR_AUTHENTICATION=Yes or No(Optional) Specify Yes or No.
14 IBM Tivoli Monitoring: CEC Base Agent User's Guide

DIRECTOR_PORT_NUMBER=8422(Optional) Specify the port number, for example 8422.
RESTART_ON_REBOOT=value(Optional) Specify TRUE or FALSE:
TRUE: ITM_cec restarts when the Virtual I/O Server restarts.FALSE: ITM_cec does not restart when the Virtual I/O Server restarts.
v The cfgsvc command configures default values for IBM Tivoli Monitoring-specific values. If you mustchange the default ports and communication protocols to communicate with the Tivoli EnterpriseMonitoring Server, use the itmcmd command:1. Enter the AIX shell:
oem_setup_env
2. Run the itmcmd config command:# /opt/IBM/ITM/bin/itmcmd config -A pk
3. Respond to the prompts as you respond for any agent not in the VIOS environment to set protocolsand ports for communicating with the Tivoli Enterprise Monitoring Server.
v Enable the agent for unprompted SSH communication with the HMC by running the viosvrcmdcommand from the HMC:viosvrcmd -m managed_system_name -p vios_name -c "cfgsvc -key ITM_cec"mkauthkeys --add ’public_key’
Where:
managed_system_nameName of the managed system which has the Virtual I/O Server lpar hosting the CEC Base agent.
vios_nameName of the Virtual I/O server partition.
public_keyOutput of the viosvrcmd command.
Example$ viosvrcmd -m commo126041 -p VIOS7 -c "cfgsvc ITM_cec -key"ssh-rsa AAAAB3NzaC1yc2EAAAABIwAAAQEAvjDZsS0guWzfzfp9Bbwe\G0QMXv1tbDrtyWsgPbA2ExHA+xduWA51K0oFGarK2FC7e7Nj\KW+UmgQbrh/KSyKKwozjp4xWGNGhLmfan85ZpFR7wy9UQG1b\LgXZxYrY7yyQQQODjvwosWAfzkjpG3iW/xmWD5PKLBmob2QkKJ\bxjne+wqGwHTRYDGIiyhCBIdfFaLZgkXTZ2diZ98rL8LIv3qb+TsM1B\28AL4t+1OGGeW242lsB+8p4kamPJCYfKePHo67yP4NyKyPBFHY\3TpTrca4/y1KEBT0Va3Pebr5JEIUvWYs6/RW+bUQk1Sb6eYbcRJFH\[email protected]
$ mkauthkeys --add ’ssh-rsa AAAAB3NzaC1yc2EAAAABIwAAAQEAvjDZsS0guWzfzfp9Bbwe\G0QMXv1tbDrtyWsgPbA2ExHA+xduWA51K0oFGarK2FC\7e7NjKW+UmgQbrh/KSyKKwozjp4xWGNGhLmfan85Zp\FR7wy9UQG1bLgXZxYrY7yyQQQODjvwosWAfzkjpG\3iW/xmWD5PKLBmob2QkKJbxjne+wqGwHTRYDGIiyh\CBIdfFaLZgkXTZ2diZ98rL8LIv3qb+TsM1B28AL4t+1OG\GeW242lsB+8p4kamPJCYfKePHo67yP4NyKyPBFHY\3TpTrca4/y1KEBT0Va3Pebr5JEIUvWYs6/RW+bUQk1\[email protected]’
Note: If the SSH communication keys were set up during configuration of the VIOS Premium agent,do not repeat this step for the CEC Base agent. If you are configuring the CEC Base agent in anon-HMC IVM environment, do not set up the SSH keys.
v Start the CEC Base agent with the startsvc command:startsvc ITM_cec
v Stop the CEC Base agent with the stopsvc command:
Chapter 2. Requirements and agent installation and configuration 15

stopsvc ITM_cec
v See the following command information:– cfgsvc (http://pic.dhe.ibm.com/infocenter/powersys/v3r1m5/topic/iphcg/cfgsvc.htm)– lssvc (http://pic.dhe.ibm.com/infocenter/powersys/v3r1m5/topic/iphcg/lssvc.htm)– startsvc (http://pic.dhe.ibm.com/infocenter/powersys/v3r1m5/topic/iphcg/startsvc.htm)– stopsvc (http://pic.dhe.ibm.com/infocenter/powersys/v3r1m5/topic/iphcg/stopsvc.htm)
v If an HMC failover occurs, a second HMC is detected automatically; it does not require configuration.
Changing the encryption key values in a VIOS environment
If the encryption key must be set to a nondefault value for agent on VIOS, follow these steps:1. Enter the UNIX shell on the VIOS system:
oem_setup_env
2. Remove the current keyfiles directory from the IBM Tivoli Monitoring installation location. Forexample:# cd /opt/IBM/ITM# rm -R keyfiles
3. Locate the IBM Tivoli Monitoring installation script for System p agents that comes preinstalled onVIOS:find /usr/lpp -name install.sh
4. Run the script. For example:# /usr/lpp/itm.premium/itm_agent/install.sh
Running the script takes you through the installation process.5. Accept the defaults until you see a prompt that asks for a 32-character encryption key:
Enter a 32-character encryption key, or just press Enter to usethe defaultDefault = IBMTivoliMonitoringEncryptionKey....+....1....+....2....+....3..
6. Enter the new value for the encryption key and press Enter.7. Continue accepting the defaults until the installation script completes.
UsageIn an AIX environment, the standard commands in the install_dir/bin directory are used to start, stop,and configure the AIX Premium agent.
In a VIOS environment, the following commands are used:v Start the CEC Base agent with the startsvc command:
startsvc ITM_cec
v Stop the CEC Base agent with the stopsvc command:stopsvc ITM_cec
v See the following command information:– cfgsvc (http://pic.dhe.ibm.com/infocenter/powersys/v3r1m5/topic/iphcg/cfgsvc.htm)– lssvc (http://pic.dhe.ibm.com/infocenter/powersys/v3r1m5/topic/iphcg/lssvc.htm)– startsvc (http://pic.dhe.ibm.com/infocenter/powersys/v3r1m5/topic/iphcg/startsvc.htm)– stopsvc (http://pic.dhe.ibm.com/infocenter/powersys/v3r1m5/topic/iphcg/stopsvc.htm)
For the CEC Base agent to monitor LPAR and frame utilization, the agent must meet the followingrequirements:v Network connectivity to other LPARs on the same CEC.
16 IBM Tivoli Monitoring: CEC Base Agent User's Guide
v All LPARs must be running xmtopas/xmservd to support IBM Tivoli Monitoring agent data collection.v Open communications on UDP port 2279 between all LPARs on the same CEC.
If an LPAR is being reported as unmonitored, the following causes are possible:v The SSH is not configured correctly between the CEC and the HMC. See AIX Configuration or VIOS
Configuration.v xmservd/xmtopas is not running on the unmonitored LPAR.v Communication on the UDP port 2279 is blocked.
Note: CEC monitoring is not supported over firewalls. If a firewall is in place between the CEC and theremote LPAR, opening port 2279 for UDP might allow communications to work.
Chapter 2. Requirements and agent installation and configuration 17

18 IBM Tivoli Monitoring: CEC Base Agent User's Guide

Chapter 3. Workspaces reference
A workspace is the working area of the Tivoli Enterprise Portal application window. The Navigator treecontains a list of the workspaces provided by the agent.
About workspaces
Use the Navigator tree to select the workspace you want to see. As part of the application window, thestatus bar shows the Tivoli Enterprise Portal Server name and port number to which the displayedinformation applies and the ID of the current user.
When you select an item in the Navigator tree, a default workspace is displayed. When you right-click aNavigator item, a menu that includes a Workspace item is displayed. The Workspace item contains a listof workspaces for that Navigator item. Each workspace has at least one view. Some views have links toother workspaces. You can also use the Workspace Gallery tool as described in the Tivoli Enterprise PortalUser's Guide to open workspaces.
The workspaces in the Navigator are displayed in a Physical view that shows your enterprise as aphysical mapping or a dynamically populated logical view that is agent-specific. You can also create aLogical view. The Physical view is the default view.
This monitoring agent provides predefined workspaces. You cannot modify or delete the predefinedworkspaces, but you can create new workspaces by editing them and saving the changes with a differentname.
Workspace views can be any combination of query-based views, event views, and special purpose views.
Additional information about workspaces
For more information about creating, customizing, and working with workspaces, see "Using workspaces"in the Tivoli Enterprise Portal User's Guide.
For a list of the predefined workspaces for this monitoring agent and a description of each workspace,see Predefined workspaces and the information about each individual workspace.
Some attribute groups for this monitoring agent might not be represented in the predefined workspacesor views for this agent. For a full list of the attribute groups, see “Attribute groups for the monitoringagent” on page 23.
Predefined workspacesThe CEC Base agent provides predefined workspaces, which are organized by Navigator item.v CEC Base Navigator item
– CEC Resource Inventory workspace– HMC Failover workspace– IBM Systems Director workspace– Performance Object Status workspace
v CEC Resources Navigator item– CEC View workspace– Monitored Partitions workspace
© Copyright IBM Corp. 2007, 2013 19

v CEC Utilization Navigator item– Active Memory Expansion workspace– CEC Utilization workspace– LPAR Summary workspace– LPAR Utilization workspace
Workspace descriptionsEach workspace description provides information about the workspace such as the purpose and a list ofviews in the workspace.
Workspaces are listed under Navigator items.
CEC Base Navigator itemThe workspace descriptions are organized by the Navigator item to which the workspaces are relevant.CEC Resource Inventory workspace
Shows the CEC metrics for total CPU and memory allocations and metrics for each LPAR on theCEC.
This workspace contains the following views:CEC Resource Inventory
Shows CEC metrics on total CPU and memory allocations. The entry in this viewcontains a link that provides the ability to navigate to the IBM Systems DirectorWorkspace. The latter requires that an IBM Systems Director Server been configured forthe agent and will show the CEC Server in the IBM System Director Web UI.
CEC LPAR MetricsShows a table of CEC LPARS and their metrics.
CPU Shared PoolsShows the default physical processor pool (PoolID=0), any defined subpools, poolallocations, and utilization attributes.
Active Memory Sharing (AMS) PoolsShows the attributes of each shared memory pool defined for the CEC.
HMC Failover workspaceShows a table of the most recent HMC Failover events.
This workspace contains the following view:HMC Failover Events
Shows a table of the most recent HMC Failover events.IBM Systems Director workspace
This workspace provides the IBM Systems Director Web UI to the Director Server this agent isconfigured to use. It is only available as a workspace link target.
This workspace contains the following views:Performance Object Status
Shows a table of the attribute groups associated with the Monitoring Agent for CEC Base.IBM Systems Director
Contains the IBM Systems Director Server Web interface.Performance Object Status workspace
Shows a table of the attribute groups associated with the Monitoring Agent for CEC Base.
This workspace contains the following views:Performance Object Status
Shows a table of the attribute groups associated with the Monitoring Agent for CEC Base.Web References to System p CEC
Shows web references to the System p CEC.
20 IBM Tivoli Monitoring: CEC Base Agent User's Guide

CEC Resources Navigator itemThe workspace descriptions are organized by the Navigator item to which the workspaces are relevant.CEC View workspace
This workspace provides summary graphs of CEC resource views of CPU and memoryallocations per logical partition (LPAR).
This workspace contains the following views:CEC Number of LPARs
Shows the number of partitions (LPARS) on the CEC.CEC CPU Allocation
Shows the total allocated and unallocated CEC CPUs and the size of the CPU sharedpool.
CEC Memory AllocationShows the total allocated and unallocated CEC Memory resources.
CPU Allocation to LPARsShows the CPU allocation for each LPAR.
Memory Allocation to LPARsShows the memory allocated to each LPAR.
Monitored Partitions workspaceThis workspace provides information on partitions, CPU, and memory resources that aremonitored by IBM Tivoli Monitoring.
This workspace contains the following views:Monitored CPU Resources
Shows the distribution of CPU units among monitored and unmonitored partitions as apie chart.
Monitored Memory ResourcesShows the distribution of memory among monitored and unmonitored partitions as a piechart.
Monitored PartitionsShows a table with all of the paritions that are monitored by IBM Tivoli Monitoring.
Unmonitored Active PartitionsShows a table with all of the partitions that are active but not monitored by IBM TivoliMonitoring.
Inactive PartitionsShows a table with all of the inactive partitions.
CEC Utilization Navigator itemThe workspace descriptions are organized by the Navigator item to which the workspaces are relevant.Active Memory Expansion workspace
Shows Active Memory Expansion (AME) attributes for LPARs associated with this CEC.
This workspace contains the following views:Monitored Partition AME Details
Shows Active Memory Expansion (AME) attributes for LPARs associated with this CEC.Monitored Partition Effectve Memory
Shows the uncompressed, compressed, and deficit data layout of each partition's EffectiveMemory.
Monitored Partition AME DeficitsShows partitions that have an Effective Memory Deficit.
Monitored Partition AME PerformanceShows AME Performance indicators for each partition.
CEC Utilization workspaceThis workspace provides information about utilization of the CEC resources by partitions that aremonitored by IBM Tivoli Monitoring.
This workspace contains the following views:
Chapter 3. Workspaces reference 21

Physical CPU Busy Time for PartitionsShows a bar chart of percentage of physical CPU used by each monitored partition.
Physical Memory Consumed by PartitionsShows a bar chart of physical memory consumption by each monitored partition.
Average CPU and Memory Utilization Among Monitored PartitionsShows an average CPU and memory utilization value based on the partitions that aremonitored by IBM Tivoli Monitoring.
LPAR Summary workspaceThis workspace has views showing the top and bottom LPARs by CPU Entitlement Used Pct andPhy Busy Time Pct.
This workspace contains the following views:Top LPARs by CPU Entitlement Used Pct
Shows the top ten LPARs by CPU Entitlement Used Pct.Bottom LPARs by CPU Entitlement Used Pct
Shows the bottom ten LPARs by CPU Entitlement Used Pct.Top LPARs by CPU Utilization
Shows the top ten LPARs by CPU Utilization.Bottom LPARs by CPU Utilization
Shows the bottom ten LPARs by CPU Utilization.LPAR Utilization workspace
This workspace provides status and CPU and memory utilization information for each partitionin the CEC.
This workspace contains the following views:CPU Usage in Monitored Partitions
Shows the percentage of CPU spent in various modes by each monitored partition.Memory Usage in Monitored Partitions
Shows the percentage of allocated memory that is used by each monitored partition.Monitored Partition Status
Shows a table with detailed information for all of the monitored partitions.
22 IBM Tivoli Monitoring: CEC Base Agent User's Guide
Chapter 4. Attributes reference
Attributes are the application properties that are being measured and reported by the IBM TivoliMonitoring: CEC Base Agent.
About attributes
Attributes are organized into attribute groups. Attributes in an attribute group relate to a single objectsuch as an application, or to a single kind of data such as status information.
Attributes in a group can be used in queries, query-based views, situations, policy workflows, take actiondefinitions, and launch application definitions. Chart or table views and situations are two examples ofhow attributes in a group can be used:v Chart or table views
Attributes are displayed in chart and table views. The chart and table views use queries to specifywhich attribute values to request from a monitoring agent. You use the Properties editor to apply filtersand set styles to define the content and appearance of a view based on an existing query.
v SituationsYou use attributes to create situations that monitor the state of your operating system, database, orapplication. A situation describes a condition you want to test. When you start a situation, the valuesyou assign to the situation attributes are compared with the values collected by the CEC Base agentand registers an event if the condition is met. You are alerted to events by indicator icons that aredisplayed in the Navigator.
Additional information about attributes
For more information about using attributes and attribute groups, see the Tivoli Enterprise Portal User'sGuide.
For a list of the attribute groups, a list of the attributes in each attribute group, and descriptions of theattributes for this monitoring agent, see “Attribute groups for the monitoring agent” and “Attributes ineach attribute group” on page 24.
Attribute groups for the monitoring agentThe CEC Base agent contains the following attribute groups. The table name depends on the maximumtable name limits of the target database being used for the Tivoli Data Warehouse. If the maximum nameis 30 characters, any warehouse table name longer than 30 characters is shortened to 30 characters.v Attribute group name: AME
– Table name: KPK09AMELP– Warehouse table name: KPK_AME or KPK09AMELP
v Attribute group name: AMS Pools– Table name: KPK08MPOOL– Warehouse table name: KPK_AMS_POOLS or KPK08MPOOL
v Attribute group name: CPU Pools– Table name: KPK05CPUPL– Warehouse table name: KPK_CPU_POOLS or KPK05CPUPL
v Attribute group name: Director– Table name: KPKDIRE
© Copyright IBM Corp. 2007, 2013 23

– Warehouse table name: KPK_DIRECTOR or KPKDIREv Attribute group name: Global CEC
– Table name: KPK02GLOBA– Warehouse table name: KPK_GLOBAL_CEC or KPK02GLOBA
v Attribute group name: HMC Switch– Table name: KPK10FAIL– Warehouse table name: KPK_HMC_SWITCH or KPK10FAIL
v Attribute group name: Mon LPars– Table name: KPK05MONLP– Warehouse table name: KPK_MON_LPARS or KPK05MONLP
v Attribute group name: Mon Unmon Alloc– Table name: KPK07MUALC– Warehouse table name: KPK_MON_UNMON_ALLOC or KPK07MUALC
v Attribute group name: Per LPAR– Table name: KPK03PERLP– Warehouse table name: KPK_PER_LPAR or KPK03PERLP
v Attribute group name: Performance Object Status– Table name: KPKPOBJST– Warehouse table name: KPK_PERFORMANCE_OBJECT_STATUS or KPKPOBJST
v Attribute group name: TADDM– Table name: KPK03TADDM– Warehouse table name: KPK_TADDM or KPK03TADDM
Attributes in each attribute groupAttributes in each CEC Base agent attribute group collect data that the agent uses for monitoring.
The descriptions of the attribute groups contain the following information:
Historical groupWhether the attribute group is a historical type that you can roll off to a data warehouse.
Attribute descriptionsInformation such as description, type, source, and warehouse name, as applicable, for eachattribute in the attribute group.
Some attributes are designated as key attributes. A key attribute is an attribute that is used inwarehouse aggregation to identify rows of data that represent the same object.
The Source information sometimes uses C programming code syntax for if-then-else clauses todescribe how an attribute is derived, for example:(CPU_Pct < 0 ) || (Memory_Pct < 0 )? 0 : 1
This example means that if the CPU_Pct attribute is less than 0 or if the Memory_Pct attribute isless than 0, then the attribute is set to 0. Otherwise, the attribute is set to 1.
AME attribute groupThis attribute group contains details for the partitions monitored by IBM Tivoli Monitoring.Historical group
This attribute group is eligible for use with Tivoli Data Warehouse.Attribute descriptions
The following list contains information about each attribute in the AME attribute group:
24 IBM Tivoli Monitoring: CEC Base Agent User's Guide

Node attribute: This attribute is a key attribute.Description
The managed system name of the agent.Type
StringSource
The source for this attribute is the agent.Warehouse name
NODETimestamp attribute
DescriptionThe local time at the agent when the data was collected.
TypeString
SourceThe source for this attribute is the agent.
Warehouse nameTIMESTAMP
LPAR Name attribute: This attribute is a key attribute.Description
The name of the logical partition.Type
StringWarehouse name
LPAR_NAMELPAR Number attribute
DescriptionThe LPAR identification number assigned to this LPAR.
TypeInteger (32-bit gauge) with enumerated values. The strings are displayed in theTivoli Enterprise Portal. The warehouse and queries return the values that areshown in parentheses. The following values are defined:v Not Collected (-1)v Value Exceeds Minimum (-2147483648)v Value Exceeds Maximum (2147483647)
Any other value is the value that is returned by the agent in the Tivoli EnterprisePortal.
Warehouse nameLPAR_NUMBER or LN
Machine ID attributeDescription
The frame hardware ID to which the LPAR belongs.Type
StringWarehouse name
MACHINE_IDHostname attribute
DescriptionThe host name of the partition.
TypeString
Warehouse nameHOSTNAME
True Memory Size MB attribute
Chapter 4. Attributes reference 25

DescriptionThe amount of physical memory assigned to this LPAR.
TypeReal number (32-bit gauge) with two decimal places of precision withenumerated values. The strings are displayed in the Tivoli Enterprise Portal. Thewarehouse and queries return the values that are shown in parentheses. Thefollowing values are defined:v Not Collected (-100)v Value Exceeds Minimum (-2147483648)v Value Exceeds Maximum (2147483647)
Any other value is the value that is returned by the agent in the Tivoli EnterprisePortal.
Warehouse nameTRUE_MEMORY_SIZE_MB or TMSM
Target Expansion Factor attributeDescription
The HMC-configured AME Expansion Factor (1.00 to 10.00) used to calculate theTarget Expanded Memory Size.
TypeReal number (32-bit gauge) with two decimal places of precision withenumerated values. The strings are displayed in the Tivoli Enterprise Portal. Thewarehouse and queries return the values that are shown in parentheses. Thefollowing values are defined:v Not Collected (-100)v Value Exceeds Minimum (-2147483648)v Value Exceeds Maximum (2147483647)
Any other value is the value that is returned by the agent in the Tivoli EnterprisePortal.
Warehouse nameTARGET_MEMORY_EXPANSION_FACTOR or TMEF
Current Expansion Factor attributeDescription
The ratio of the actual effective memory achievable to the amount of TrueMemory.
TypeReal number (32-bit gauge) with two decimal places of precision withenumerated values. The strings are displayed in the Tivoli Enterprise Portal. Thewarehouse and queries return the values that are shown in parentheses. Thefollowing values are defined:v Not Collected (-100)v Value Exceeds Minimum (-2147483648)v Value Exceeds Maximum (2147483647)
Any other value is the value that is returned by the agent in the Tivoli EnterprisePortal.
Warehouse nameCURRENT_MEMORY_EXPANSION_FACTOR or CMEF
Effective Memory Size MB attributeDescription
The amount of True Memory times the Expansion Factor. This value is thememory size reported by the operating system for the partition.
TypeReal number (32-bit gauge) with two decimal places of precision with
26 IBM Tivoli Monitoring: CEC Base Agent User's Guide

enumerated values. The strings are displayed in the Tivoli Enterprise Portal. Thewarehouse and queries return the values that are shown in parentheses. Thefollowing values are defined:v Not Collected (-100)
Any other value is the value that is returned by the agent in the Tivoli EnterprisePortal.
SourceThe source for this attribute is derived: (True_Memory_Size_MB <0)?-100:(True_Memory_Size_MB * Target_Memory_Expansion_Factor)/10000.
Warehouse nameEFFECTIVE_MEMORY_SIZE_MB or EMSM
Compressed Memory Size MB attributeDescription
The size of the Compressed Pool, which is the amount of memory required toexpand all of the compressed data.
TypeReal number (32-bit gauge) with two decimal places of precision withenumerated values. The strings are displayed in the Tivoli Enterprise Portal. Thewarehouse and queries return the values that are shown in parentheses. Thefollowing values are defined:v Not Collected (-100)v Value Exceeds Minimum (-2147483648)v Value Exceeds Maximum (2147483647)
Any other value is the value that is returned by the agent in the Tivoli EnterprisePortal.
Warehouse nameCOMPRESSED_MEM_SIZE_MB or CMSM
Compressed Memory Used Pct attributeDescription
The percentage of the Compressed Pool in use.Type
Real number (32-bit gauge) with two decimal places of precision withenumerated values. The strings are displayed in the Tivoli Enterprise Portal. Thewarehouse and queries return the values that are shown in parentheses. Thefollowing values are defined:v Not Collected (-100)v Value Exceeds Minimum (-2147483648)v Value Exceeds Maximum (2147483647)
Any other value is the value that is returned by the agent in the Tivoli EnterprisePortal.
Warehouse nameCOMPRESSED_MEM_INUSE_PCT or CMIP
Compressed Memory Free Pct attributeDescription
The percentage of the Compressed Pool that is free.Type
Real number (32-bit gauge) with two decimal places of precision withenumerated values. The strings are displayed in the Tivoli Enterprise Portal. Thewarehouse and queries return the values that are shown in parentheses. Thefollowing values are defined:v Not Collected (-100)v Value Exceeds Minimum (-2147483648)v Value Exceeds Maximum (2147483647)
Chapter 4. Attributes reference 27
Any other value is the value that is returned by the agent in the Tivoli EnterprisePortal.
SourceThe source for this attribute is derived: (Compressed_Mem_Inuse_Pct <0)?-100:(10000 - Compressed_Mem_Inuse_Pct).
Warehouse nameCOMPRESSED_MEM_FREE_PCT or CMFP
Compression Ratio attributeDescription
The ratio of the amount of memory used by data before that data is compressed,to the memory required after compression.
TypeReal number (32-bit gauge) with two decimal places of precision withenumerated values. The strings are displayed in the Tivoli Enterprise Portal. Thewarehouse and queries return the values that are shown in parentheses. Thefollowing values are defined:v Not Collected (-100)v Value Exceeds Minimum (-2147483648)v Value Exceeds Maximum (2147483647)
Any other value is the value that is returned by the agent in the Tivoli EnterprisePortal.
Warehouse nameCOMPRESSION_RATIO or CR
Compressed Memory Page In Rate attributeDescription
The rate at which uncompressed memory pages are being compressed in pagesper second.
TypeInteger (32-bit gauge) with enumerated values. The strings are displayed in theTivoli Enterprise Portal. The warehouse and queries return the values that areshown in parentheses. The following values are defined:v Not Collected (-1)v Value Exceeds Minimum (-2147483648)v Value Exceeds Maximum (2147483647)
Any other value is the value that is returned by the agent in the Tivoli EnterprisePortal.
Warehouse nameCOMPRESSED_MEM_PAGEINS_PER_SEC or CMPPS
Compressed Memory Page Out Rate attributeDescription
The rate at which compressed memory pages are being expanded in pages persecond.
TypeInteger (32-bit gauge) with enumerated values. The strings are displayed in theTivoli Enterprise Portal. The warehouse and queries return the values that areshown in parentheses. The following values are defined:v Not Collected (-1)v Value Exceeds Minimum (-2147483648)v Value Exceeds Maximum (2147483647)
Any other value is the value that is returned by the agent in the Tivoli EnterprisePortal.
Warehouse nameCOMPRESSED_MEM_PAGEOUTS_PER_SEC or CMPPS0
Uncompressed Memory Size MB attribute
28 IBM Tivoli Monitoring: CEC Base Agent User's Guide

DescriptionThe size of the Uncompressed Pool, which is the amount of memory available forholding uncompressed data.
TypeReal number (32-bit gauge) with two decimal places of precision withenumerated values. The strings are displayed in the Tivoli Enterprise Portal. Thewarehouse and queries return the values that are shown in parentheses. Thefollowing values are defined:v Not Collected (-100)v Value Exceeds Minimum (-2147483648)v Value Exceeds Maximum (2147483647)
Any other value is the value that is returned by the agent in the Tivoli EnterprisePortal.
Warehouse nameUNCOMPRESSED_MEM_SIZE_MB or UMSM
Uncompressed Memory Used Pct attributeDescription
The percentage of the Uncompressed Pool in use.Type
Real number (32-bit gauge) with two decimal places of precision withenumerated values. The strings are displayed in the Tivoli Enterprise Portal. Thewarehouse and queries return the values that are shown in parentheses. Thefollowing values are defined:v Not Collected (-100)v Value Exceeds Minimum (-2147483648)v Value Exceeds Maximum (2147483647)
Any other value is the value that is returned by the agent in the Tivoli EnterprisePortal.
Warehouse nameUNCOMPRESSED_MEM_INUSE_PCT or UMIP
Uncompressed Memory Free Pct attributeDescription
The percentage of the Uncompressed Pool that is free.Type
Real number (32-bit gauge) with two decimal places of precision withenumerated values. The strings are displayed in the Tivoli Enterprise Portal. Thewarehouse and queries return the values that are shown in parentheses. Thefollowing values are defined:v Not Collected (-100)v Value Exceeds Minimum (-2147483648)v Value Exceeds Maximum (2147483647)
Any other value is the value that is returned by the agent in the Tivoli EnterprisePortal.
SourceThe source for this attribute is derived: (Uncompressed_Mem_Inuse_Pct > -100) ?(10000 - Uncompressed_Mem_Inuse_Pct): -100.
Warehouse nameUNCOMPRESSED_MEM_FREE_PCT or UMFP
CPU Used Pct attributeDescription
The percentage of the CPU resources for the LPAR that is used by AME.Type
Real number (32-bit gauge) with two decimal places of precision with
Chapter 4. Attributes reference 29
enumerated values. The strings are displayed in the Tivoli Enterprise Portal. Thewarehouse and queries return the values that are shown in parentheses. Thefollowing values are defined:v Not Collected (-100)v Value Exceeds Minimum (-2147483648)v Value Exceeds Maximum (2147483647)
Any other value is the value that is returned by the agent in the Tivoli EnterprisePortal.
Warehouse nameCPU_USED_PCT or CUP
Deficit Size MB attributeDescription
The amount of Effective Memory that cannot be used given the actualCompression Ratio achievable. Adjust the amount of True Memory and theExpansion Factor to ensure this value is zero.
TypeReal number (32-bit gauge) with two decimal places of precision withenumerated values. The strings are displayed in the Tivoli Enterprise Portal. Thewarehouse and queries return the values that are shown in parentheses. Thefollowing values are defined:v Not Collected (-100)v Value Exceeds Minimum (-2147483648)v Value Exceeds Maximum (2147483647)
Any other value is the value that is returned by the agent in the Tivoli EnterprisePortal.
Warehouse nameDEFICIT_MEMORY_SIZE_MB or DMSM
Deficit Expansion Factor attributeDescription
The Target Expansion Factor minus the Current Expansion Factor. This valueindicates the theoretical amount required to decrease the AME Expansion Factorto eliminate the deficit.
TypeReal number (32-bit gauge) with two decimal places of precision withenumerated values. The strings are displayed in the Tivoli Enterprise Portal. Thewarehouse and queries return the values that are shown in parentheses. Thefollowing values are defined:v Not Collected (-100)v Value Exceeds Minimum (-2147483648)v Value Exceeds Maximum (2147483647)
Any other value is the value that is returned by the agent in the Tivoli EnterprisePortal.
Warehouse nameDEFICIT_EXPANSION_FACTOR or DEF
Compressed Data Size MB attributeDescription
The size of compressed memory after expansion (less any memory deficit).Type
Real number (32-bit gauge) with two decimal places of precision withenumerated values. The strings are displayed in the Tivoli Enterprise Portal. Thewarehouse and queries return the values that are shown in parentheses. Thefollowing values are defined:v Not Collected (-100)
30 IBM Tivoli Monitoring: CEC Base Agent User's Guide

Any other value is the value that is returned by the agent in the Tivoli EnterprisePortal.
SourceThe source for this attribute is derived: (Effective_Memory_Size_MB < 0 ||Uncompressed_Mem_Size_MB < 0 || Deficit_Memory_MB <0)?-100:((Effective_Memory_Size_MB*100) - Uncompressed_Mem_Size_MB -Deficit_Memory_MB)/100.
Warehouse nameCOMPRESSED_DATA_SIZE_MB or CDSM
Uncompressed Data Size MB attributeDescription
The size of the uncompressed memory.Type
Real number (32-bit gauge) with two decimal places of precision withenumerated values. The strings are displayed in the Tivoli Enterprise Portal. Thewarehouse and queries return the values that are shown in parentheses. Thefollowing values are defined:v Not Collected (-100)
Any other value is the value that is returned by the agent in the Tivoli EnterprisePortal.
SourceThe source for this attribute is derived: Uncompressed_Mem_Size_MB.
Warehouse nameUNCOMPRESSED_DATA_SIZE_MB or UDSM
Type Model Serial attributeDescription
The type, model, and serial number the LPAR belongs.Type
StringWarehouse name
TYPE_MODEL_SERIAL or TMS
AMS Pools attribute groupThis attribute group contains Active Memory Sharing (AMS) pool details.Historical group
This attribute group is eligible for use with Tivoli Data Warehouse.Attribute descriptions
The following list contains information about each attribute in the AMS Pools attribute group:Node attribute: This attribute is a key attribute.
DescriptionThe managed system name of the agent.
TypeString
SourceThe source for this attribute is the agent.
Warehouse nameNODE
Timestamp attributeDescription
The local time at the agent when the data was collected.Type
StringSource
The source for this attribute is the agent.
Chapter 4. Attributes reference 31
Warehouse nameTIMESTAMP
AMS Pool ID attribute: This attribute is a key attribute.Description
AMS pool ID.Type
Integer with enumerated values. The strings are displayed in the Tivoli EnterprisePortal. The warehouse and queries return the values that are shown inparentheses. The following values are defined:v Not Collected (-1)v Value Exceeds Minimum (-2147483648)v Value Exceeds Maximum (2147483647)
Any other value is the value that is returned by the agent in the Tivoli EnterprisePortal.
Warehouse nameAMS_POOL_ID or API
AMS Mempool Size attributeDescription
Size of total physical memory of the AMS pool, in GB.Type
Real number (32-bit gauge) with two decimal places of precision withenumerated values. The strings are displayed in the Tivoli Enterprise Portal. Thewarehouse and queries return the values that are shown in parentheses. Thefollowing values are defined:v Not Collected (-100)v Value Exceeds Minimum (-2147483648)v Value Exceeds Maximum (2147483647)
Any other value is the value that is returned by the agent in the Tivoli EnterprisePortal.
Warehouse nameAMS_MEMPOOL_SIZE or AMS
AMS Total Mem Inuse attributeDescription
Total memory of the AMS pool in use (the sum of the physical memory allocatedto all LPARs in the pool), in GB
TypeReal number (32-bit gauge) with two decimal places of precision withenumerated values. The strings are displayed in the Tivoli Enterprise Portal. Thewarehouse and queries return the values that are shown in parentheses. Thefollowing values are defined:v Not Collected (-1)v Value Exceeds Minimum (-2147483648)v Value Exceeds Maximum (2147483647)
Any other value is the value that is returned by the agent in the Tivoli EnterprisePortal.
Warehouse nameAMS_TOTAL_MEM_INUSE or ATMI
LPARs Using Pool attributeDescription
The total number of partitions that share this memory pool.Type
Integer (32-bit gauge) with enumerated values. The strings are displayed in theTivoli Enterprise Portal. The warehouse and queries return the values that areshown in parentheses. The following values are defined:
32 IBM Tivoli Monitoring: CEC Base Agent User's Guide

v Not Collected (-1)v Value Exceeds Minimum (-2147483648)v Value Exceeds Maximum (2147483647)
Any other value is the value that is returned by the agent in the Tivoli EnterprisePortal.
Warehouse nameAMS_NUM_PARTIONS or ANP
Available Memory Pool Pct attributeDescription
The percentage of memory available in this AMS memory pool.Type
Integer (32-bit gauge) with enumerated values. The strings are displayed in theTivoli Enterprise Portal. The warehouse and queries return the values that areshown in parentheses. The following values are defined:v Not Collected (-1)v Value Exceeds Minimum (-2147483648)v Value Exceeds Maximum (2147483647)
Any other value is the value that is returned by the agent in the Tivoli EnterprisePortal.
Warehouse nameAVAILABLE_MEMORY_POOL_PCT or AMPP
Machine ID attributeDescription
The frame hardware ID to which the LPAR belongs.Type
StringWarehouse name
MACHINE_IDType Model Serial attribute
DescriptionThe type, model, and serial number the LPAR belongs.
TypeString
Warehouse nameTYPE_MODEL_SERIAL or TMS
CPU Pools attribute groupThis attribute group contains Shared Processor Pool details.Historical group
This attribute group is eligible for use with Tivoli Data Warehouse.Attribute descriptions
The following list contains information about each attribute in the CPU Pools attribute group:Node attribute: This attribute is a key attribute.
DescriptionThe managed system name of the agent.
TypeString
SourceThe source for this attribute is the agent.
Warehouse nameNODE
Timestamp attributeDescription
The local time at the agent when the data was collected.
Chapter 4. Attributes reference 33

TypeString
SourceThe source for this attribute is the agent.
Warehouse nameTIMESTAMP
CPU Pool ID attribute: This attribute is a key attribute.Description
The ID of the Shared Processor Pool.Type
Integer (32-bit gauge) with enumerated values. The strings are displayed in theTivoli Enterprise Portal. The warehouse and queries return the values that areshown in parentheses. The following values are defined:v Not Collected (-1)v Value Exceeds Minimum (-2147483648)v Value Exceeds Maximum (2147483647)
Any other value is the value that is returned by the agent in the Tivoli EnterprisePortal.
Warehouse namePOOLID
Available CPU Units in Pool attributeDescription
The number of physical CPU units that are available for allocation from theshared pool. (app)
TypeReal number (32-bit gauge) with two decimal places of precision withenumerated values. The strings are displayed in the Tivoli Enterprise Portal. Thewarehouse and queries return the values that are shown in parentheses. Thefollowing values are defined:v Not Collected (-100)v Value Exceeds Minimum (-2147483648)v Value Exceeds Maximum (2147483647)
Any other value is the value that is returned by the agent in the Tivoli EnterprisePortal.
Warehouse nameAVAILABLE_CPU_UNITS_IN_POOL or ACUIP
Pool Entitlement attributeDescription
The number of physical CPU units reserved for usage by this pool.Type
Real number (32-bit gauge) with two decimal places of precision withenumerated values. The strings are displayed in the Tivoli Enterprise Portal. Thewarehouse and queries return the values that are shown in parentheses. Thefollowing values are defined:v Not Collected (-100)v Undefined (-200)v Value Exceeds Minimum (-2147483648)v Value Exceeds Maximum (2147483647)
Any other value is the value that is returned by the agent in the Tivoli EnterprisePortal.
Warehouse namePOOL_ENTITLEMENT or PE
Maximum Pool Capacity attribute
34 IBM Tivoli Monitoring: CEC Base Agent User's Guide

DescriptionThe maximum number of physical CPU units this pool can use.
TypeReal number (32-bit gauge) with two decimal places of precision withenumerated values. The strings are displayed in the Tivoli Enterprise Portal. Thewarehouse and queries return the values that are shown in parentheses. Thefollowing values are defined:v Not Collected (-100)v Undefined (-200)v Value Exceeds Minimum (-2147483648)v Value Exceeds Maximum (2147483647)
Any other value is the value that is returned by the agent in the Tivoli EnterprisePortal.
Warehouse nameMAXIMUM_POOL_CAPACITY or MPC
CPU Units Consumed attributeDescription
The physical processor units consumed (physc).Type
Real number (32-bit gauge) with two decimal places of precision withenumerated values. The strings are displayed in the Tivoli Enterprise Portal. Thewarehouse and queries return the values that are shown in parentheses. Thefollowing values are defined:v Not Collected (-100)v Value Exceeds Minimum (-2147483648)v Value Exceeds Maximum (2147483647)
Any other value is the value that is returned by the agent in the Tivoli EnterprisePortal.
Warehouse nameCPU_UNITS_CONSUMED or CUC
Number Virtual CPUs attributeDescription
The number of virtual CPUs for all LPARS using this pool.Type
Integer (32-bit gauge) with enumerated values. The strings are displayed in theTivoli Enterprise Portal. The warehouse and queries return the values that areshown in parentheses. The following values are defined:v Not Collected (-1)v Value Exceeds Minimum (-2147483648)v Value Exceeds Maximum (2147483647)
Any other value is the value that is returned by the agent in the Tivoli EnterprisePortal.
Warehouse nameNUMBER_VIRTUAL_CPUS or NVC
LPARs Using Pool attributeDescription
The number of LPARS using this pool.Type
Integer (32-bit gauge) with enumerated values. The strings are displayed in theTivoli Enterprise Portal. The warehouse and queries return the values that areshown in parentheses. The following values are defined:v Not Collected (-1)v Value Exceeds Minimum (-2147483648)v Value Exceeds Maximum (2147483647)
Chapter 4. Attributes reference 35

Any other value is the value that is returned by the agent in the Tivoli EnterprisePortal.
Warehouse nameLPARS_USING_POOL or LUP
Avail Shared Pool Pct attributeDescription
The percentage of available pool processors.Type
Real number (32-bit gauge) with two decimal places of precision withenumerated values. The strings are displayed in the Tivoli Enterprise Portal. Thewarehouse and queries return the values that are shown in parentheses. Thefollowing values are defined:v Not Collected (-100)
Any other value is the value that is returned by the agent in the Tivoli EnterprisePortal.
SourceThe source for this attribute is derived: ((Available_CPU_Units_in_Pool < 0) ||(Maximum_Pool_Capacity < 0))?-100:(100 * (Available_CPU_Units_in_Pool /Maximum_Pool_Capacity)).
Warehouse nameAVAIL_SHARED_POOL_PCT or ASPP
Machine ID attributeDescription
The frame hardware ID to which the LPAR belongs.Type
StringWarehouse name
MACHINE_IDType Model Serial attribute
DescriptionThe type, model, and serial number the LPAR belongs.
TypeString
Warehouse nameTYPE_MODEL_SERIAL or TMS
Director attribute groupThis attribute group contains information about the IBM Systems Director configuration.Historical group
This attribute group is eligible for use with Tivoli Data Warehouse.Attribute descriptions
The following list contains information about each attribute in the Director attribute group:Node attribute: This attribute is a key attribute.
DescriptionThe managed system name of the agent.
TypeString
SourceThe source for this attribute is the agent.
Warehouse nameNODE
Timestamp attributeDescription
The local time at the agent when the data was collected.
36 IBM Tivoli Monitoring: CEC Base Agent User's Guide
TypeString
SourceThe source for this attribute is the agent.
Warehouse nameTIMESTAMP
DirectorServer attributeDescription
The host name of the IBM Director Server.Type
StringSource
The source for this attribute is Script data.Warehouse name
DIRECTORSERVER or DDirectorPort attribute
DescriptionThe port number for the IBM Director Server.
TypeString
SourceThe source for this attribute is Script data.
Warehouse nameDIRECTORPORT or D0
UseTEPCredential attributeDescription
Use Tivoli Enterprise Portal credentials for IBM Systems Director authentication.Type
StringSource
The source for this attribute is Script data.Warehouse name
USETEPCREDENTIAL or U
Global CEC attribute groupThis attribute group contains CEC CPU and memory information.Historical group
This attribute group is eligible for use with Tivoli Data Warehouse.Attribute descriptions
The following list contains information about each attribute in the Global CEC attribute group:Node attribute: This attribute is a key attribute.
DescriptionThe managed system name of the agent.
TypeString
SourceThe source for this attribute is the agent.
Warehouse nameNODE
Timestamp attributeDescription
The local time at the agent when the data was collected.Type
String
Chapter 4. Attributes reference 37

SourceThe source for this attribute is the agent.
Warehouse nameTIMESTAMP
Name attributeDescription
CEC name.Type
StringWarehouse name
NAMENumber of Partitions attribute
DescriptionThe number of partitions on the CEC.
TypeInteger (32-bit gauge) with enumerated values. The strings are displayed in theTivoli Enterprise Portal. The warehouse and queries return the values that areshown in parentheses. The following values are defined:v Not Collected (-1)v Value Exceeds Minimum (-2147483648)v Value Exceeds Maximum (2147483647)
Any other value is the value that is returned by the agent in the Tivoli EnterprisePortal.
Warehouse nameNUMBER_OF_PARTITIONS or NOP
CPU Total attributeDescription
Total number of CPUs in the CEC.Type
Real number (32-bit gauge) with one decimal places of precision with enumeratedvalues. The strings are displayed in the Tivoli Enterprise Portal. The warehouseand queries return the values that are shown in parentheses. The following valuesare defined:v Not Collected (-10)v Value Exceeds Minimum (-2147483648)v Value Exceeds Maximum (2147483647)
Any other value is the value that is returned by the agent in the Tivoli EnterprisePortal.
Warehouse nameCPU_TOTAL
CPU Allocated attributeDescription
The number of CPUs allocated to logical partitions.Type
Real number (32-bit gauge) with one decimal places of precision with enumeratedvalues. The strings are displayed in the Tivoli Enterprise Portal. The warehouseand queries return the values that are shown in parentheses. The following valuesare defined:v Not Collected (-10)v Value Exceeds Minimum (-2147483648)v Value Exceeds Maximum (2147483647)
Any other value is the value that is returned by the agent in the Tivoli EnterprisePortal.
38 IBM Tivoli Monitoring: CEC Base Agent User's Guide
Warehouse nameCPU_ALLOCATED or CA
CPU Unallocated attributeDescription
The number of CPUs unallocated in the CEC.Type
Real number (32-bit gauge) with one decimal places of precision with enumeratedvalues. The strings are displayed in the Tivoli Enterprise Portal. The warehouseand queries return the values that are shown in parentheses. The following valuesare defined:v Not Collected (-10)v Value Exceeds Minimum (-2147483648)v Value Exceeds Maximum (2147483647)
Any other value is the value that is returned by the agent in the Tivoli EnterprisePortal.
Warehouse nameCPU_UNALLOCATED or CU
CPU Allocated Pct attributeDescription
The percentage of allocated CPUs.Type
Integer (32-bit gauge) with enumerated values. The strings are displayed in theTivoli Enterprise Portal. The warehouse and queries return the values that areshown in parentheses. The following values are defined:v Not Collected (-1)v Value Exceeds Minimum (-2147483648)v Value Exceeds Maximum (2147483647)
Any other value is the value that is returned by the agent in the Tivoli EnterprisePortal.
Warehouse nameCPU_ALLOCATED_PCT or CAP
CPU Unallocated Pct attributeDescription
The percentage of unallocated CPUs.Type
Integer (32-bit gauge) with enumerated values. The strings are displayed in theTivoli Enterprise Portal. The warehouse and queries return the values that areshown in parentheses. The following values are defined:v Not Collected (-1)v Value Exceeds Minimum (-2147483648)v Value Exceeds Maximum (2147483647)
Any other value is the value that is returned by the agent in the Tivoli EnterprisePortal.
Warehouse nameCPU_UNALLOCATED_PCT or CUP
CPU Shared Pool Size attributeDescription
The number of CPUs in the shared pool.Type
Real number (32-bit gauge) with one decimal places of precision with enumeratedvalues. The strings are displayed in the Tivoli Enterprise Portal. The warehouseand queries return the values that are shown in parentheses. The following valuesare defined:v Not Collected (-10)
Chapter 4. Attributes reference 39

v Value Exceeds Minimum (-2147483648)v Value Exceeds Maximum (2147483647)
Any other value is the value that is returned by the agent in the Tivoli EnterprisePortal.
Warehouse nameCPU_SHARED_POOL_SIZE or CSPS
Memory Total MB attributeDescription
The total amount of memory in the CEC.Type
Integer (32-bit gauge) with enumerated values. The strings are displayed in theTivoli Enterprise Portal. The warehouse and queries return the values that areshown in parentheses. The following values are defined:v Not Collected (-1)v Value Exceeds Minimum (-2147483648)v Value Exceeds Maximum (2147483647)
Any other value is the value that is returned by the agent in the Tivoli EnterprisePortal.
Warehouse nameMEMORY_TOTAL_MB or MTM
Memory Allocated MB attributeDescription
The amount of memory allocated to logical partitions.Type
Integer (32-bit gauge) with enumerated values. The strings are displayed in theTivoli Enterprise Portal. The warehouse and queries return the values that areshown in parentheses. The following values are defined:v Not Collected (-1)v Value Exceeds Minimum (-2147483648)v Value Exceeds Maximum (2147483647)
Any other value is the value that is returned by the agent in the Tivoli EnterprisePortal.
Warehouse nameMEMORY_ALLOCATED_MB or MAM
Memory Unallocated MB attributeDescription
The amount of memory unallocated in CEC.Type
Integer (32-bit gauge) with enumerated values. The strings are displayed in theTivoli Enterprise Portal. The warehouse and queries return the values that areshown in parentheses. The following values are defined:v Not Collected (-1)v Value Exceeds Minimum (-2147483648)v Value Exceeds Maximum (2147483647)
Any other value is the value that is returned by the agent in the Tivoli EnterprisePortal.
Warehouse nameMEMORY_UNALLOCATED_MB or MUM
Memory Allocated Pct attributeDescription
The percentage of allocated memory.Type
Integer (32-bit gauge) with enumerated values. The strings are displayed in the
40 IBM Tivoli Monitoring: CEC Base Agent User's Guide

Tivoli Enterprise Portal. The warehouse and queries return the values that areshown in parentheses. The following values are defined:v Not Collected (-1)v Value Exceeds Minimum (-2147483648)v Value Exceeds Maximum (2147483647)
Any other value is the value that is returned by the agent in the Tivoli EnterprisePortal.
Warehouse nameMEMORY_ALLOCATED_PCT or MAP
Memory Unallocated Pct attributeDescription
The percentage of unallocated memory.Type
Integer (32-bit gauge) with enumerated values. The strings are displayed in theTivoli Enterprise Portal. The warehouse and queries return the values that areshown in parentheses. The following values are defined:v Not Collected (-1)v Value Exceeds Minimum (-2147483648)v Value Exceeds Maximum (2147483647)
Any other value is the value that is returned by the agent in the Tivoli EnterprisePortal.
Warehouse nameMEMORY_UNALLOCATED_PCT or MUP
Machine ID attributeDescription
The frame hardware ID to which the LPAR belongs.Type
StringWarehouse name
MACHINE_IDCPU Units Allocated attribute
DescriptionThe number of CPU units allocated to logical partitions.
TypeReal number (32-bit gauge) with two decimal places of precision withenumerated values. The strings are displayed in the Tivoli Enterprise Portal. Thewarehouse and queries return the values that are shown in parentheses. Thefollowing values are defined:v Not Collected (-100)v Value Exceeds Minimum (-2147483648)v Value Exceeds Maximum (2147483647)
Any other value is the value that is returned by the agent in the Tivoli EnterprisePortal.
Warehouse nameCPU_UNITS_ALLOCATED or CUA
CPU Units UnAllocated attributeDescription
The number of CPU units unallocated in the CEC.Type
Real number (32-bit gauge) with two decimal places of precision withenumerated values. The strings are displayed in the Tivoli Enterprise Portal. Thewarehouse and queries return the values that are shown in parentheses. Thefollowing values are defined:v Not Collected (-100)
Chapter 4. Attributes reference 41
v Value Exceeds Minimum (-2147483648)v Value Exceeds Maximum (2147483647)
Any other value is the value that is returned by the agent in the Tivoli EnterprisePortal.
Warehouse nameCPU_UNITS_UNALLOCATED or CUU
CPU Shared Pool Size Units attributeDescription
The number of CPU units in the shared pool.Type
Real number (32-bit gauge) with two decimal places of precision withenumerated values. The strings are displayed in the Tivoli Enterprise Portal. Thewarehouse and queries return the values that are shown in parentheses. Thefollowing values are defined:v Not Collected (-100)v Value Exceeds Minimum (-2147483648)v Value Exceeds Maximum (2147483647)
Any other value is the value that is returned by the agent in the Tivoli EnterprisePortal.
Warehouse nameCPU_SHARED_POOL_SIZE_UNITS or CSPSU
Shared Processor Pools attributeDescription
The number of Shared Processor Pools.Type
Integer (32-bit gauge) with enumerated values. The strings are displayed in theTivoli Enterprise Portal. The warehouse and queries return the values that areshown in parentheses. The following values are defined:v Not Collected (-1)v Value Exceeds Minimum (-2147483648)v Value Exceeds Maximum (2147483647)
Any other value is the value that is returned by the agent in the Tivoli EnterprisePortal.
Warehouse nameSHARED_PROCESSOR_POOLS or SPP
Shared Physb attributeDescription
Physical Processor Busy across all shared LPARs.Type
Real number (32-bit gauge) with two decimal places of precision withenumerated values. The strings are displayed in the Tivoli Enterprise Portal. Thewarehouse and queries return the values that are shown in parentheses. Thefollowing values are defined:v Not Collected (-100)v Value Exceeds Minimum (-2147483648)v Value Exceeds Maximum (2147483647)
Any other value is the value that is returned by the agent in the Tivoli EnterprisePortal.
Warehouse nameSHARED_PHYSB or SP
Dedicated Physb attributeDescription
Physical Processor Busy across all dedicated LPARs.
42 IBM Tivoli Monitoring: CEC Base Agent User's Guide
TypeReal number (32-bit gauge) with two decimal places of precision withenumerated values. The strings are displayed in the Tivoli Enterprise Portal. Thewarehouse and queries return the values that are shown in parentheses. Thefollowing values are defined:v Not Collected (-100)v Value Exceeds Minimum (-2147483648)v Value Exceeds Maximum (2147483647)
Any other value is the value that is returned by the agent in the Tivoli EnterprisePortal.
Warehouse nameDEDICATED_PHYSB or DP
Num Dedicated Mem LPARs attributeDescription
Total number of LPARs running with AMS mode set to dedicated.Type
Integer (32-bit gauge) with enumerated values. The strings are displayed in theTivoli Enterprise Portal. The warehouse and queries return the values that areshown in parentheses. The following values are defined:v Not Collected (-1)v Value Exceeds Minimum (-2147483648)v Value Exceeds Maximum (2147483647)
Any other value is the value that is returned by the agent in the Tivoli EnterprisePortal.
Warehouse nameNUM_DEDICATED_MEM_LPARS or NDML
Num Shared Mem LPARs attributeDescription
Total number of LPARs running with AMS mode set to shared.Type
Integer (32-bit gauge) with enumerated values. The strings are displayed in theTivoli Enterprise Portal. The warehouse and queries return the values that areshown in parentheses. The following values are defined:v Not Collected (-1)v Value Exceeds Minimum (-2147483648)v Value Exceeds Maximum (2147483647)
Any other value is the value that is returned by the agent in the Tivoli EnterprisePortal.
Warehouse nameNUM_SHARED_MEM_LPARS or NSML
Num AMS Pools attributeDescription
The total number of AMS pools in the CEC.Type
Integer (32-bit gauge) with enumerated values. The strings are displayed in theTivoli Enterprise Portal. The warehouse and queries return the values that areshown in parentheses. The following values are defined:v Not Collected (-1)v Value Exceeds Minimum (-2147483648)v Value Exceeds Maximum (2147483647)
Any other value is the value that is returned by the agent in the Tivoli EnterprisePortal.
Warehouse nameNUMBER_AMS_POOLS or NAP
Chapter 4. Attributes reference 43

Type Model Serial attributeDescription
The type, model, and serial number the LPAR belongs.Type
StringWarehouse name
TYPE_MODEL_SERIAL or TMS
HMC Switch attribute groupThis attribute group provides details for an agent that has changed SSH connection (failed over) to adifferent HMC.Historical group
This attribute group is eligible for use with Tivoli Data Warehouse.Attribute descriptions
The following list contains information about each attribute in the HMC Switch attribute group:Node attribute: This attribute is a key attribute.
DescriptionThe managed system name of the agent.
TypeString
SourceThe source for this attribute is the agent.
Warehouse nameNODE
Timestamp attributeDescription
The local time at the agent when the data was collected.Type
StringSource
The source for this attribute is the agent.Warehouse name
TIMESTAMPEvent Type attribute: This attribute is a key attribute.
DescriptionThe type of event that caused an HMC failover.
TypeInteger with enumerated values. The strings are displayed in the Tivoli EnterprisePortal. The warehouse and queries return the values that are shown inparentheses. The following values are defined:v Not Collected (-1)v Connection Failure (1)v High Latency (2)v Retry Primary (3)
Any other value is the value that is returned by the agent in the Tivoli EnterprisePortal.
Warehouse nameEVENT_TYPE
Old HMC attributeDescription
The host name of the HMC the agent was connected to before the event occured.Type
StringWarehouse name
OLD_HMC
44 IBM Tivoli Monitoring: CEC Base Agent User's Guide
New HMC attributeDescription
The host name of the HMC the agent will be connected to going forward fromthe event.
TypeString
Warehouse nameNEW_HMC
Configured Primary HMC attributeDescription
The host name of the currently configured primary HMCType
StringWarehouse name
CONFIGURED_HMC or CH
Mon LPars attribute groupThis attribute group contains details for the partitions monitored by IBM Tivoli Monitoring.Historical group
This attribute group is eligible for use with Tivoli Data Warehouse.Attribute descriptions
The following list contains information about each attribute in the Mon LPars attribute group:Node attribute: This attribute is a key attribute.
DescriptionThe managed system name of the agent.
TypeString
SourceThe source for this attribute is the agent.
Warehouse nameNODE
Timestamp attributeDescription
The local time at the agent when the data was collected.Type
StringSource
The source for this attribute is the agent.Warehouse name
TIMESTAMPLPAR Name attribute: This attribute is a key attribute.
DescriptionThe name of the logical partition.
TypeString
Warehouse nameLPAR_NAME
Machine ID attributeDescription
The frame hardware ID to which the LPAR belongs.Type
StringWarehouse name
MACHINE_IDHostname attribute
Chapter 4. Attributes reference 45

DescriptionThe host name of the partition.
TypeString
Warehouse nameHOSTNAME
OS Version attributeDescription
The version information for the operating system for the partition.Type
StringWarehouse name
OS_VERSIONAllocated Memory attribute
DescriptionThe amount of memory, in MB, allocated to this partition.
TypeInteger (32-bit gauge) with enumerated values. The strings are displayed in theTivoli Enterprise Portal. The warehouse and queries return the values that areshown in parentheses. The following values are defined:v Not Collected (-1)v Value Exceeds Minimum (-2147483648)v Value Exceeds Maximum (2147483647)
Any other value is the value that is returned by the agent in the Tivoli EnterprisePortal.
Warehouse nameALLOCATED_MEMORY or AM
Allocated Memory Used Pct attributeDescription
The percentage of allocated memory being used by this partition.Type
Integer (32-bit gauge) with enumerated values. The strings are displayed in theTivoli Enterprise Portal. The warehouse and queries return the values that areshown in parentheses. The following values are defined:v Not Collected (-1)v Value Exceeds Minimum (-2147483648)v Value Exceeds Maximum (2147483647)
Any other value is the value that is returned by the agent in the Tivoli EnterprisePortal.
Warehouse nameALLOCATED_MEMORY_USED_PCT or AMUP
Physical Memory Allocated Pct attributeDescription
The percentage of physical memory the allocation represents.Type
Real number (32-bit gauge) with one decimal places of precision with enumeratedvalues. The strings are displayed in the Tivoli Enterprise Portal. The warehouseand queries return the values that are shown in parentheses. The following valuesare defined:v Not Collected (-1)v Not Collected (-10)v Value Exceeds Minimum (-2147483648)v Value Exceeds Maximum (2147483647)
46 IBM Tivoli Monitoring: CEC Base Agent User's Guide

Any other value is the value that is returned by the agent in the Tivoli EnterprisePortal.
Warehouse namePHYSICAL_MEMORY_ALLOCATED_PCT or PMAP
Entitlement attributeDescription
The number of physical CPUs allocated to the partition.Type
Real number (32-bit gauge) with two decimal places of precision withenumerated values. The strings are displayed in the Tivoli Enterprise Portal. Thewarehouse and queries return the values that are shown in parentheses. Thefollowing values are defined:v Not Collected (-1)v Not Collected (-100)v Value Exceeds Minimum (-2147483648)v Value Exceeds Maximum (2147483647)
Any other value is the value that is returned by the agent in the Tivoli EnterprisePortal.
Warehouse nameCPU_ALLOCATED or CA
CPU Usr Pct attributeDescription
The time this LPAR spent operating in CPU user mode (percent).Type
Real number (32-bit gauge) with one decimal places of precision with enumeratedvalues. The strings are displayed in the Tivoli Enterprise Portal. The warehouseand queries return the values that are shown in parentheses. The following valuesare defined:v Not Collected (-1)v Not Collected (-10)v Value Exceeds Minimum (-2147483648)v Value Exceeds Maximum (2147483647)
Any other value is the value that is returned by the agent in the Tivoli EnterprisePortal.
Warehouse nameCPU_USR_PCT or CUP
CPU Sys Pct attributeDescription
The time this LPAR spent operating in CPU system mode (percent).Type
Real number (32-bit gauge) with one decimal places of precision with enumeratedvalues. The strings are displayed in the Tivoli Enterprise Portal. The warehouseand queries return the values that are shown in parentheses. The following valuesare defined:v Not Collected (-1)v Not Collected (-10)v Value Exceeds Minimum (-2147483648)v Value Exceeds Maximum (2147483647)
Any other value is the value that is returned by the agent in the Tivoli EnterprisePortal.
Warehouse nameCPU_SYS_PCT or CSP
CPU Idle Pct attribute
Chapter 4. Attributes reference 47
DescriptionThe time this LPAR spent operating in CPU idle mode (percent).
TypeReal number (32-bit gauge) with one decimal places of precision with enumeratedvalues. The strings are displayed in the Tivoli Enterprise Portal. The warehouseand queries return the values that are shown in parentheses. The following valuesare defined:v Not Collected (-1)v Not Collected (-10)v Value Exceeds Minimum (-2147483648)v Value Exceeds Maximum (2147483647)
Any other value is the value that is returned by the agent in the Tivoli EnterprisePortal.
Warehouse nameCPU_IDLE_PCT or CIP
CPU Wait Pct attributeDescription
The time this LPAR spent operating in CPU wait mode (percent).Type
Real number (32-bit gauge) with one decimal places of precision with enumeratedvalues. The strings are displayed in the Tivoli Enterprise Portal. The warehouseand queries return the values that are shown in parentheses. The following valuesare defined:v Not Collected (-1)v Not Collected (-10)v Value Exceeds Minimum (-2147483648)v Value Exceeds Maximum (2147483647)
Any other value is the value that is returned by the agent in the Tivoli EnterprisePortal.
Warehouse nameCPU_WAIT_PCT or CWP
CPU Entitlement Used Pct attributeDescription
The percentage of CPU entitlement being used by this LPAR. (entc)Type
Integer (32-bit gauge) with enumerated values. The strings are displayed in theTivoli Enterprise Portal. The warehouse and queries return the values that areshown in parentheses. The following values are defined:v Not Collected (-1)v Value Exceeds Minimum (-2147483648)v Value Exceeds Maximum (2147483647)
Any other value is the value that is returned by the agent in the Tivoli EnterprisePortal.
Warehouse nameCPU_PHYS_ENT_PCT or CPEP
Virt Context CPU Switches per Sec attributeDescription
The rate, per second, of Virtual CPU Context Switches.Type
Integer (32-bit gauge) with enumerated values. The strings are displayed in theTivoli Enterprise Portal. The warehouse and queries return the values that areshown in parentheses. The following values are defined:v Not Collected (-1)v Value Exceeds Minimum (-2147483648)
48 IBM Tivoli Monitoring: CEC Base Agent User's Guide

v Value Exceeds Maximum (2147483647)
Any other value is the value that is returned by the agent in the Tivoli EnterprisePortal.
Warehouse nameVIRT_CONTEXT_CPU_SWITCHES_PER_SEC or VCCSPS
Phantom Interrupts per Sec attributeDescription
The rate, per second, that CPU interrupts are received for partitions other thanthis one.
TypeInteger (32-bit gauge) with enumerated values. The strings are displayed in theTivoli Enterprise Portal. The warehouse and queries return the values that areshown in parentheses. The following values are defined:v Not Collected (-1)v Value Exceeds Minimum (-2147483648)v Value Exceeds Maximum (2147483647)
Any other value is the value that is returned by the agent in the Tivoli EnterprisePortal.
Warehouse namePHANTOM_INTERRUPTS_PER_SEC or PIPS
Shared Mode attributeDescription
The shared logical partition mode (dedicated or shared).Type
Integer with enumerated values. The strings are displayed in the Tivoli EnterprisePortal. The warehouse and queries return the values that are shown inparentheses. The following values are defined:v Not Collected (-1)v dedicated (0)v shared (1)
Any other value is the value that is returned by the agent in the Tivoli EnterprisePortal.
Warehouse nameSHARED_MODE or SM
SMT attributeDescription
Indicates whether simultaneous multi-threading mode is enabled.Type
Integer with enumerated values. The strings are displayed in the Tivoli EnterprisePortal. The warehouse and queries return the values that are shown inparentheses. The following values are defined:v Not Collected (-1)v disabled (0)v enabled (1)
Any other value is the value that is returned by the agent in the Tivoli EnterprisePortal.
Warehouse nameSMT
CPU Capacity Weight attributeDescription
The variable processor capacity weight.Type
Integer (32-bit gauge) with enumerated values. The strings are displayed in the
Chapter 4. Attributes reference 49

Tivoli Enterprise Portal. The warehouse and queries return the values that areshown in parentheses. The following values are defined:v Not Collected (-1)v Value Exceeds Minimum (-2147483648)v Value Exceeds Maximum (2147483647)
Any other value is the value that is returned by the agent in the Tivoli EnterprisePortal.
Warehouse nameCAPACITY_WEIGHT or CW
Capped Mode attributeDescription
Indicates whether the partition is operating in capped or uncapped mode.Type
Integer with enumerated values. The strings are displayed in the Tivoli EnterprisePortal. The warehouse and queries return the values that are shown inparentheses. The following values are defined:v Not Collected (-1)v uncapped (0)v capped (1)
Any other value is the value that is returned by the agent in the Tivoli EnterprisePortal.
Warehouse nameCAPPED_MODE or CM
Donating attributeDescription
Indicates whether or not the partition is donating spare CPU cycles.Type
Integer with enumerated values. The strings are displayed in the Tivoli EnterprisePortal. The warehouse and queries return the values that are shown inparentheses. The following values are defined:v Not Collected (-1)v not donating (0)v donating (1)
Any other value is the value that is returned by the agent in the Tivoli EnterprisePortal.
Warehouse nameDONATING
Phy Busy Time Pct attributeDescription
The physical busy time for the partition percentage. (pbusy)Type
Integer (32-bit gauge) with enumerated values. The strings are displayed in theTivoli Enterprise Portal. The warehouse and queries return the values that areshown in parentheses. The following values are defined:v Not Collected (-1)v Value Exceeds Minimum (-2147483648)v Value Exceeds Maximum (2147483647)
Any other value is the value that is returned by the agent in the Tivoli EnterprisePortal.
Warehouse namePHY_BUSY_TIME_PCT or PBTP
Memory Consumed MB attributeDescription
The amount of memory, in MBs, used by this partition.
50 IBM Tivoli Monitoring: CEC Base Agent User's Guide
TypeInteger (32-bit gauge) with enumerated values. The strings are displayed in theTivoli Enterprise Portal. The warehouse and queries return the values that areshown in parentheses. The following values are defined:v Not Collected (-1)v Value Exceeds Minimum (-2147483648)v Value Exceeds Maximum (2147483647)
Any other value is the value that is returned by the agent in the Tivoli EnterprisePortal.
Warehouse nameMEMORY_CONSUMED_MB or MCM
Number of Logical CPUs attributeDescription
The number of current online logical CPUs. (lcpu)Type
Integer (32-bit gauge) with enumerated values. The strings are displayed in theTivoli Enterprise Portal. The warehouse and queries return the values that areshown in parentheses. The following values are defined:v Not Collected (-1)v Value Exceeds Minimum (-2147483648)v Value Exceeds Maximum (2147483647)
Any other value is the value that is returned by the agent in the Tivoli EnterprisePortal.
Warehouse nameNUMBER_OF_LOGICAL_CPUS or NOLC
Physical CPU Units Used attributeDescription
The number of physical CPU units consumed. (physb)Type
Real number (32-bit gauge) with two decimal places of precision withenumerated values. The strings are displayed in the Tivoli Enterprise Portal. Thewarehouse and queries return the values that are shown in parentheses. Thefollowing values are defined:v Not Collected (-1)v Not Collected (-100)v Value Exceeds Minimum (-2147483648)v Value Exceeds Maximum (2147483647)
Any other value is the value that is returned by the agent in the Tivoli EnterprisePortal.
Warehouse namePHYSICAL_CPU_UNITS_USED or PCUU
Number Virtual CPUs attributeDescription
The number of virtual CPUs for this LPAR.Type
Integer (32-bit gauge) with enumerated values. The strings are displayed in theTivoli Enterprise Portal. The warehouse and queries return the values that areshown in parentheses. The following values are defined:v Not Collected (-1)v Value Exceeds Minimum (-2147483648)v Value Exceeds Maximum (2147483647)
Any other value is the value that is returned by the agent in the Tivoli EnterprisePortal.
Chapter 4. Attributes reference 51

Warehouse nameNUMBER_VIRTUAL_CPUS or NVC
Max CPU Cap Used Pct attributeDescription
The percentage of maximum physical CPU available to this LPAR that is actuallyused. For capped LPARs, this value is the same as CPU_Phys_Ent_Pct.
TypeReal number (32-bit gauge) with two decimal places of precision withenumerated values. The strings are displayed in the Tivoli Enterprise Portal. Thewarehouse and queries return the values that are shown in parentheses. Thefollowing values are defined:v Not Collected (-1)v Not Collected (-100)
Any other value is the value that is returned by the agent in the Tivoli EnterprisePortal.
SourceThe source for this attribute is derived: (Physical_CPU_Units_Used <0)?-100:(Physical_CPU_Units_Used / Number_Virtual_CPUs).
Warehouse nameMAX_CPU_CAP_USED_PCT or MCCUP
CPU Pool ID attributeDescription
The ID of the Shared Processor Pool.Type
Integer (32-bit gauge) with enumerated values. The strings are displayed in theTivoli Enterprise Portal. The warehouse and queries return the values that areshown in parentheses. The following values are defined:v Not Collected (-1)v Value Exceeds Minimum (-2147483648)v Value Exceeds Maximum (2147483647)
Any other value is the value that is returned by the agent in the Tivoli EnterprisePortal.
Warehouse namePOOLID
Physical CPU In Pool attributeDescription
The number of available physical processors in the shared pool.Type
Real number (32-bit gauge) with two decimal places of precision withenumerated values. The strings are displayed in the Tivoli Enterprise Portal. Thewarehouse and queries return the values that are shown in parentheses. Thefollowing values are defined:v Not Collected (-1)v Not Collected (-100)v Value Exceeds Minimum (-2147483648)v Value Exceeds Maximum (2147483647)
Any other value is the value that is returned by the agent in the Tivoli EnterprisePortal.
Warehouse namePHYSICAL_CPU_IN_POOL or PCIP
Pool Entitlement attributeDescription
The entitled capacity of the pool.
52 IBM Tivoli Monitoring: CEC Base Agent User's Guide
TypeReal number (32-bit gauge) with two decimal places of precision withenumerated values. The strings are displayed in the Tivoli Enterprise Portal. Thewarehouse and queries return the values that are shown in parentheses. Thefollowing values are defined:v Not Collected (-1)v Not Collected (-100)v Value Exceeds Minimum (-2147483648)v Value Exceeds Maximum (2147483647)
Any other value is the value that is returned by the agent in the Tivoli EnterprisePortal.
Warehouse namePOOL_ENTITLEMENT or PE
Maximum Pool Capacity attributeDescription
The maximum pool capacity.Type
Real number (32-bit gauge) with two decimal places of precision withenumerated values. The strings are displayed in the Tivoli Enterprise Portal. Thewarehouse and queries return the values that are shown in parentheses. Thefollowing values are defined:v Not Collected (-1)v Not Collected (-100)v Value Exceeds Minimum (-2147483648)v Value Exceeds Maximum (2147483647)
Any other value is the value that is returned by the agent in the Tivoli EnterprisePortal.
Warehouse nameMAXIMUM_POOL_CAPACITY or MPC
AMS Mode attributeDescription
Indicates whether the LPAR is in AMS shared or dedicated mode.Type
Integer with enumerated values. The strings are displayed in the Tivoli EnterprisePortal. The warehouse and queries return the values that are shown inparentheses. The following values are defined:v Not Collected (-1)v Value Exceeds Minimum (-2147483648)v Value Exceeds Maximum (2147483647)v Dedicated (0)v Shared (1)
Any other value is the value that is returned by the agent in the Tivoli EnterprisePortal.
Warehouse nameAMS_MODE
AMS Pool ID attribute: This attribute is a key attribute.Description
The pool ID associated with the LPAR. All LPARs in AMS mode have a pool IDof 0 until multiple pools are supported.
TypeInteger with enumerated values. The strings are displayed in the Tivoli EnterprisePortal. The warehouse and queries return the values that are shown inparentheses. The following values are defined:v Not Collected (-1)
Chapter 4. Attributes reference 53

v Value Exceeds Minimum (-2147483648)v Value Exceeds Maximum (2147483647)
Any other value is the value that is returned by the agent in the Tivoli EnterprisePortal.
Warehouse nameAMS_POOL_ID or API
AMS Pool Size attributeDescription
The AMS memory pool size (GB).Type
Real number (32-bit gauge) with two decimal places of precision withenumerated values. The strings are displayed in the Tivoli Enterprise Portal. Thewarehouse and queries return the values that are shown in parentheses. Thefollowing values are defined:v Not Collected (-1)v Not Collected (-100)v Value Exceeds Minimum (-2147483648)v Value Exceeds Maximum (2147483647)
Any other value is the value that is returned by the agent in the Tivoli EnterprisePortal.
Warehouse nameAMS_POOL_SIZE or APS
AMS Physical Mem attributeDescription
Physical memory supporting the partition's AMS logical memory.Type
Real number (32-bit gauge) with two decimal places of precision withenumerated values. The strings are displayed in the Tivoli Enterprise Portal. Thewarehouse and queries return the values that are shown in parentheses. Thefollowing values are defined:v Not Collected (-1)v Not Collected (-100)v Value Exceeds Minimum (-2147483648)v Value Exceeds Maximum (2147483647)
Any other value is the value that is returned by the agent in the Tivoli EnterprisePortal.
Warehouse nameAMS_PHYSICAL_MEM or APM
AMS Mem Loaned attributeDescription
AMS Logical memory loaned to the hypervisor.Type
Integer (32-bit gauge) with enumerated values. The strings are displayed in theTivoli Enterprise Portal. The warehouse and queries return the values that areshown in parentheses. The following values are defined:v Not Collected (-1)v Value Exceeds Minimum (-2147483648)v Value Exceeds Maximum (2147483647)
Any other value is the value that is returned by the agent in the Tivoli EnterprisePortal.
Warehouse nameAMS_MEM_LOANED or AML
AMS Memory Entitlement attribute
54 IBM Tivoli Monitoring: CEC Base Agent User's Guide
DescriptionMemory entitlement of the partition (MB).
TypeInteger (32-bit gauge) with enumerated values. The strings are displayed in theTivoli Enterprise Portal. The warehouse and queries return the values that areshown in parentheses. The following values are defined:v Not Collected (-1)v Value Exceeds Minimum (-2147483648)v Value Exceeds Maximum (2147483647)
Any other value is the value that is returned by the agent in the Tivoli EnterprisePortal.
Warehouse nameAMS_MEMORY_ENTITLEMENT or AME
AMS Memory Ent Inuse attributeDescription
Memory entitlement of the partition in use.Type
Real number (32-bit gauge) with two decimal places of precision withenumerated values. The strings are displayed in the Tivoli Enterprise Portal. Thewarehouse and queries return the values that are shown in parentheses. Thefollowing values are defined:v Not Collected (-1)v Not Collected (-100)v Value Exceeds Minimum (-2147483648)v Value Exceeds Maximum (2147483647)
Any other value is the value that is returned by the agent in the Tivoli EnterprisePortal.
Warehouse nameAMS_MEMORY_ENT_INUSE or AMEI
Hypervisor Page Ins attributeDescription
Number of hypervisor page-ins.Type
Real number (32-bit gauge) with two decimal places of precision withenumerated values. The strings are displayed in the Tivoli Enterprise Portal. Thewarehouse and queries return the values that are shown in parentheses. Thefollowing values are defined:v Not Collected (-1)v Value Exceeds Minimum (-2147483648)v Value Exceeds Maximum (2147483647)
Any other value is the value that is returned by the agent in the Tivoli EnterprisePortal.
Warehouse nameHYPERVISOR_PAGE_INS or HPI
Hypervisor Page Ins Time attributeDescription
Time spent waiting for hypervisor page-ins.Type
Real number (32-bit gauge) with two decimal places of precision withenumerated values. The strings are displayed in the Tivoli Enterprise Portal. Thewarehouse and queries return the values that are shown in parentheses. Thefollowing values are defined:v Not Collected (-1)v Value Exceeds Minimum (-2147483648)
Chapter 4. Attributes reference 55

v Value Exceeds Maximum (2147483647)
Any other value is the value that is returned by the agent in the Tivoli EnterprisePortal.
Warehouse nameHYPERVISOR_PAGE_INS_TIME or HPIT
AME Mode attributeDescription
Indicates whether the LPAR is using Active Memory Expansion.Type
Integer with enumerated values. The strings are displayed in the Tivoli EnterprisePortal. The warehouse and queries return the values that are shown inparentheses. The following values are defined:v Not Collected (-1)v Value Exceeds Minimum (-2147483648)v Value Exceeds Maximum (2147483647)v Disabled (0)v Enabled (1)
Any other value is the value that is returned by the agent in the Tivoli EnterprisePortal.
Warehouse nameAME_MODE
SMT Threads attributeDescription
The number of threads per CPU.Type
Integer (32-bit gauge) with enumerated values. The strings are displayed in theTivoli Enterprise Portal. The warehouse and queries return the values that areshown in parentheses. The following values are defined:v Not Collected (-1)v Value Exceeds Minimum (-2147483648)v Value Exceeds Maximum (2147483647)
Any other value is the value that is returned by the agent in the Tivoli EnterprisePortal.
Warehouse nameSMT_THREADS or ST
Type Model Serial attributeDescription
The type, model, and serial number the LPAR belongs.Type
StringWarehouse name
TYPE_MODEL_SERIAL or TMS
Mon Unmon Alloc attribute groupThis attribute group contains overall statistics for the partitions on the CEC.Historical group
This attribute group is eligible for use with Tivoli Data Warehouse.Attribute descriptions
The following list contains information about each attribute in the Mon Unmon Alloc attributegroup:Node attribute: This attribute is a key attribute.
DescriptionThe managed system name of the agent.
56 IBM Tivoli Monitoring: CEC Base Agent User's Guide

TypeString
SourceThe source for this attribute is the agent.
Warehouse nameNODE
Timestamp attributeDescription
The local time at the agent when the data was collected.Type
StringSource
The source for this attribute is the agent.Warehouse name
TIMESTAMPMonitored Shared LPARs attribute
DescriptionThe number of shared partitions that can be monitored by IBM Tivoli Monitoring.
TypeInteger (32-bit gauge) with enumerated values. The strings are displayed in theTivoli Enterprise Portal. The warehouse and queries return the values that areshown in parentheses. The following values are defined:v Not Collected (-1)v Value Exceeds Minimum (-2147483648)v Value Exceeds Maximum (2147483647)
Any other value is the value that is returned by the agent in the Tivoli EnterprisePortal.
Warehouse nameMONITORED_SHARED_LPARS or MSL
Machine ID attributeDescription
The frame hardware ID to which the LPAR belongs.Type
StringWarehouse name
MACHINE_IDMonitored Dedicated LPARs attribute
DescriptionThe number of dedicated partitions that can be monitored by IBM TivoliMonitoring.
TypeInteger (32-bit gauge) with enumerated values. The strings are displayed in theTivoli Enterprise Portal. The warehouse and queries return the values that areshown in parentheses. The following values are defined:v Not Collected (-1)v Value Exceeds Minimum (-2147483648)v Value Exceeds Maximum (2147483647)
Any other value is the value that is returned by the agent in the Tivoli EnterprisePortal.
Warehouse nameMONITORED_DEDICATED_LPARS or MDL
UnMonitored Active LPARs attributeDescription
The number of active partitions that cannot be monitored by IBM TivoliMonitoring.
Chapter 4. Attributes reference 57
TypeInteger (32-bit gauge) with enumerated values. The strings are displayed in theTivoli Enterprise Portal. The warehouse and queries return the values that areshown in parentheses. The following values are defined:v Not Collected (-1)v Value Exceeds Minimum (-2147483648)v Value Exceeds Maximum (2147483647)
Any other value is the value that is returned by the agent in the Tivoli EnterprisePortal.
Warehouse nameUNMONITORED_ACTIVE_LPARS or UAL
Inactive LPARs attributeDescription
The number of inactive partitions.Type
Integer (32-bit gauge) with enumerated values. The strings are displayed in theTivoli Enterprise Portal. The warehouse and queries return the values that areshown in parentheses. The following values are defined:v Not Collected (-1)v Value Exceeds Minimum (-2147483648)v Value Exceeds Maximum (2147483647)
Any other value is the value that is returned by the agent in the Tivoli EnterprisePortal.
Warehouse nameINACTIVE_LPARS or IL
Total Monitored Memory MB attributeDescription
The amount of memory, in MBs, used by partitions that can be monitored by IBMTivoli Monitoring.
TypeInteger (32-bit gauge) with enumerated values. The strings are displayed in theTivoli Enterprise Portal. The warehouse and queries return the values that areshown in parentheses. The following values are defined:v Not Collected (-1)v Value Exceeds Minimum (-2147483648)v Value Exceeds Maximum (2147483647)
Any other value is the value that is returned by the agent in the Tivoli EnterprisePortal.
Warehouse nameTOTAL_MONITORED_MEMORY_MB or TMMM
Total UnMonitored Memory MB attributeDescription
The amount of memory, in MBs, used by partitions that cannot be monitored byIBM Tivoli Monitoring.
TypeInteger (32-bit gauge) with enumerated values. The strings are displayed in theTivoli Enterprise Portal. The warehouse and queries return the values that areshown in parentheses. The following values are defined:v Not Collected (-1)v Value Exceeds Minimum (-2147483648)v Value Exceeds Maximum (2147483647)
Any other value is the value that is returned by the agent in the Tivoli EnterprisePortal.
58 IBM Tivoli Monitoring: CEC Base Agent User's Guide

Warehouse nameTOTAL_UNMONITORED_MEMORY_MB or TUMM
Total Monitored CPU attributeDescription
The total number of CPU units allocated to all partitions that can be monitoredby IBM Tivoli Monitoring.
TypeReal number (32-bit gauge) with one decimal places of precision with enumeratedvalues. The strings are displayed in the Tivoli Enterprise Portal. The warehouseand queries return the values that are shown in parentheses. The following valuesare defined:v Not Collected (-10)v Value Exceeds Minimum (-2147483648)v Value Exceeds Maximum (2147483647)
Any other value is the value that is returned by the agent in the Tivoli EnterprisePortal.
Warehouse nameTOTAL_MONITORED_CPU or TMC
Total Unmonitored CPU attributeDescription
The total number of CPU units across all partitions that cannot be monitored byIBM Tivoli Monitoring.
TypeReal number (32-bit gauge) with one decimal places of precision with enumeratedvalues. The strings are displayed in the Tivoli Enterprise Portal. The warehouseand queries return the values that are shown in parentheses. The following valuesare defined:v Not Collected (-10)v Value Exceeds Minimum (-2147483648)v Value Exceeds Maximum (2147483647)
Any other value is the value that is returned by the agent in the Tivoli EnterprisePortal.
Warehouse nameTOTAL_UNMONITORED_CPU or TUC
Total Monitored CPU Used Pct attributeDescription
The average CPU usage on the CEC by LPARS that are monitored by IBM TivoliMonitoring.
TypeInteger (32-bit gauge) with enumerated values. The strings are displayed in theTivoli Enterprise Portal. The warehouse and queries return the values that areshown in parentheses. The following values are defined:v Not Collected (-1)v Value Exceeds Minimum (-2147483648)v Value Exceeds Maximum (2147483647)
Any other value is the value that is returned by the agent in the Tivoli EnterprisePortal.
Warehouse nameTOTAL_MONITORED_CPU_USED_PCT or TMCUP
Total Monitored Memory Used Pct attributeDescription
The average memory usage across all partitions that can be monitored by IBMTivoli Monitoring.
Chapter 4. Attributes reference 59

TypeInteger (32-bit gauge) with enumerated values. The strings are displayed in theTivoli Enterprise Portal. The warehouse and queries return the values that areshown in parentheses. The following values are defined:v Not Collected (-1)v Value Exceeds Minimum (-2147483648)v Value Exceeds Maximum (2147483647)
Any other value is the value that is returned by the agent in the Tivoli EnterprisePortal.
Warehouse nameTOTAL_MONITORED_MEMORY_USED_PCT or TMMUP
Total Monitored attributeDescription
The total number of partitions that can be monitored by IBM Tivoli Monitoring.Type
Integer (32-bit gauge) with enumerated values. The strings are displayed in theTivoli Enterprise Portal. The warehouse and queries return the values that areshown in parentheses. The following values are defined:v Not Collected (-1)v Value Exceeds Minimum (-2147483648)v Value Exceeds Maximum (2147483647)
Any other value is the value that is returned by the agent in the Tivoli EnterprisePortal.
Warehouse nameTOTAL_MONITORED or TM
Total Unmonitored attributeDescription
The total number of partitions that cannot be monitored by IBM TivoliMonitoring.
TypeInteger (32-bit gauge) with enumerated values. The strings are displayed in theTivoli Enterprise Portal. The warehouse and queries return the values that areshown in parentheses. The following values are defined:v Not Collected (-1)v Value Exceeds Minimum (-2147483648)v Value Exceeds Maximum (2147483647)
Any other value is the value that is returned by the agent in the Tivoli EnterprisePortal.
Warehouse nameTOTAL_UNMONITORED or TU
Total Monitored CPU Used Units attributeDescription
The total number of CPU units used across all partitions that can be monitored.Type
Real number (32-bit gauge) with two decimal places of precision withenumerated values. The strings are displayed in the Tivoli Enterprise Portal. Thewarehouse and queries return the values that are shown in parentheses. Thefollowing values are defined:v Not Collected (-100)v Value Exceeds Minimum (-2147483648)v Value Exceeds Maximum (2147483647)
Any other value is the value that is returned by the agent in the Tivoli EnterprisePortal.
60 IBM Tivoli Monitoring: CEC Base Agent User's Guide
Warehouse nameTOTAL_MONITORED_CPU_USED_UNITS or TMCUU
Available CPU Units in Pool attributeDescription
The number of physical CPU units that are available for allocation from theshared pool. (app)
TypeReal number (32-bit gauge) with two decimal places of precision withenumerated values. The strings are displayed in the Tivoli Enterprise Portal. Thewarehouse and queries return the values that are shown in parentheses. Thefollowing values are defined:v Not Collected (-100)v Value Exceeds Minimum (-2147483648)v Value Exceeds Maximum (2147483647)
Any other value is the value that is returned by the agent in the Tivoli EnterprisePortal.
Warehouse nameAVAILABLE_CPU_UNITS_IN_POOL or ACUIP
CEC Name attributeDescription
The name of this CEC.Type
StringWarehouse name
CEC_NAMEType Model Serial attribute
DescriptionThe type, model, and serial number the LPAR belongs.
TypeString
Warehouse nameTYPE_MODEL_SERIAL or TMS
Per LPAR attribute groupThis attribute group contains logical partition (LPAR) details.Historical group
This attribute group is eligible for use with Tivoli Data Warehouse.Attribute descriptions
The following list contains information about each attribute in the Per LPAR attribute group:Node attribute: This attribute is a key attribute.
DescriptionThe managed system name of the agent.
TypeString
SourceThe source for this attribute is the agent.
Warehouse nameNODE
Timestamp attributeDescription
The local time at the agent when the data was collected.Type
StringSource
The source for this attribute is the agent.
Chapter 4. Attributes reference 61

Warehouse nameTIMESTAMP
Name attribute: This attribute is a key attribute.Description
The name of the partition.Type
StringWarehouse name
NAMEID attribute
DescriptionThe partition ID.
TypeInteger (32-bit gauge) with enumerated values. The strings are displayed in theTivoli Enterprise Portal. The warehouse and queries return the values that areshown in parentheses. The following values are defined:v Not Collected (-1)v Value Exceeds Minimum (-2147483648)v Value Exceeds Maximum (2147483647)
Any other value is the value that is returned by the agent in the Tivoli EnterprisePortal.
Warehouse nameID
State attributeDescription
The current runtime state of the partition.Type
StringWarehouse name
STATEEnvironment attribute
DescriptionThe operating environment of the partition.
TypeString
Warehouse nameENVIRONMENT or E
Entitlement attributeDescription
The number of entitlement units assigned to this LPAR. (ent)Type
Real number (32-bit gauge) with two decimal places of precision withenumerated values. The strings are displayed in the Tivoli Enterprise Portal. Thewarehouse and queries return the values that are shown in parentheses. Thefollowing values are defined:v Not Collected (-100)v Value Exceeds Minimum (-2147483648)v Value Exceeds Maximum (2147483647)
Any other value is the value that is returned by the agent in the Tivoli EnterprisePortal.
Warehouse nameCPU_ALLOCATED or CA
CPU Allocated Pct attributeDescription
The percentage of CEC CPU allocated to the partition.
62 IBM Tivoli Monitoring: CEC Base Agent User's Guide
TypeInteger (32-bit gauge) with enumerated values. The strings are displayed in theTivoli Enterprise Portal. The warehouse and queries return the values that areshown in parentheses. The following values are defined:v Not Collected (-1)v Value Exceeds Minimum (-2147483648)v Value Exceeds Maximum (2147483647)
Any other value is the value that is returned by the agent in the Tivoli EnterprisePortal.
Warehouse nameCPU_ALLOCATED_PCT or CAP
Memory Allocated MB attributeDescription
The amount of memory allocated to the partition.Type
Integer (32-bit gauge) with enumerated values. The strings are displayed in theTivoli Enterprise Portal. The warehouse and queries return the values that areshown in parentheses. The following values are defined:v Not Collected (-1)v Value Exceeds Minimum (-2147483648)v Value Exceeds Maximum (2147483647)
Any other value is the value that is returned by the agent in the Tivoli EnterprisePortal.
Warehouse nameMEMORY_ALLOCATED_MB or MAM
Memory Allocated Pct attributeDescription
The percentage of CEC memory allocated to the partition.Type
Integer (32-bit gauge) with enumerated values. The strings are displayed in theTivoli Enterprise Portal. The warehouse and queries return the values that areshown in parentheses. The following values are defined:v Not Collected (-1)v Value Exceeds Minimum (-2147483648)v Value Exceeds Maximum (2147483647)
Any other value is the value that is returned by the agent in the Tivoli EnterprisePortal.
Warehouse nameMEMORY_ALLOCATED_PCT or MAP
Capped Mode attributeDescription
The capped logical partition mode (uncapped or capped).Type
StringWarehouse name
CAPPED_MODE or CMShared Mode attribute
DescriptionThe shared logical partition mode (dedicated or shared).
TypeString
Warehouse nameSHARED_MODE or SM
Machine ID attribute
Chapter 4. Attributes reference 63

DescriptionThe frame hardware ID to which the LPAR belongs.
TypeString
Warehouse nameMACHINE_ID
Monitoring Status attributeDescription
Indicates whether the partition is monitored by IBM Tivoli Monitoring.Type
Integer with enumerated values. The strings are displayed in the Tivoli EnterprisePortal. The warehouse and queries return the values that are shown inparentheses. The following values are defined:v Not Collected (-1)v unmonitored (0)v monitored (1)
Any other value is the value that is returned by the agent in the Tivoli EnterprisePortal.
Warehouse nameMONITORING_STATUS or MS
OS Version attributeDescription
The version information for the operating system for the partition.Type
StringWarehouse name
OS_VERSIONHostname attribute
DescriptionThe host name of the partition.
TypeString
Warehouse nameHOSTNAME
CPU Capacity Weight attributeDescription
The variable processor capacity weight.Type
Integer (32-bit gauge) with enumerated values. The strings are displayed in theTivoli Enterprise Portal. The warehouse and queries return the values that areshown in parentheses. The following values are defined:v Not Collected (-1)v Value Exceeds Minimum (-2147483648)v Value Exceeds Maximum (2147483647)
Any other value is the value that is returned by the agent in the Tivoli EnterprisePortal.
Warehouse nameCAPACITY_WEIGHT or CW
PoolID attributeDescription
The ID of the Shared Processor Pool.Type
Integer (32-bit gauge) with enumerated values. The strings are displayed in theTivoli Enterprise Portal. The warehouse and queries return the values that areshown in parentheses. The following values are defined:
64 IBM Tivoli Monitoring: CEC Base Agent User's Guide
v Not Collected (-1)v Value Exceeds Minimum (-2147483648)v Value Exceeds Maximum (2147483647)
Any other value is the value that is returned by the agent in the Tivoli EnterprisePortal.
Warehouse namePOOLID
Physical CPU In Pool attributeDescription
The number of available physical processors in the shared pool.Type
Real number (32-bit gauge) with two decimal places of precision withenumerated values. The strings are displayed in the Tivoli Enterprise Portal. Thewarehouse and queries return the values that are shown in parentheses. Thefollowing values are defined:v Not Collected (-100)v Value Exceeds Minimum (-2147483648)v Value Exceeds Maximum (2147483647)
Any other value is the value that is returned by the agent in the Tivoli EnterprisePortal.
Warehouse namePHYSICAL_CPU_IN_POOL or PCIP
Pool Entitlement attributeDescription
The entitled capacity of the pool.Type
Real number (32-bit gauge) with two decimal places of precision withenumerated values. The strings are displayed in the Tivoli Enterprise Portal. Thewarehouse and queries return the values that are shown in parentheses. Thefollowing values are defined:v Not Collected (-100)v Value Exceeds Minimum (-2147483648)v Value Exceeds Maximum (2147483647)
Any other value is the value that is returned by the agent in the Tivoli EnterprisePortal.
Warehouse namePOOL_ENTITLEMENT or PE
Maximum Pool Capacity attributeDescription
The maximum pool capacity.Type
Real number (32-bit gauge) with two decimal places of precision withenumerated values. The strings are displayed in the Tivoli Enterprise Portal. Thewarehouse and queries return the values that are shown in parentheses. Thefollowing values are defined:v Not Collected (-100)v Value Exceeds Minimum (-2147483648)v Value Exceeds Maximum (2147483647)
Any other value is the value that is returned by the agent in the Tivoli EnterprisePortal.
Warehouse nameMAXIMUM_POOL_CAPACITY or MPC
Type Model Serial attribute
Chapter 4. Attributes reference 65

DescriptionThe type, model, and serial number the LPAR belongs.
TypeString
Warehouse nameTYPE_MODEL_SERIAL or TMS
Performance Object Status attribute groupThe Performance Object Status attribute group contains information that reflects the status of otherattribute groups so you can see the status of all of the performance objects that make up this applicationall at once. Each of these other performance attribute groups is represented by a row in this table (orother type of view). The status for an attribute group reflects the result of the last attempt to collect datafor that attribute group, which allows you to see whether the agent is performing correctly. Unlike otherattribute groups, the Performance Object Status attribute group does not reflect the state of the monitoredapplication. This attribute group is most often used to determine why data is not available for one of theperformance attribute groups.Historical group
This attribute group is eligible for use with Tivoli Data Warehouse.Attribute descriptions
The following list contains information about each attribute in the Performance Object Statusattribute group:Node attribute: This attribute is a key attribute.
DescriptionThe managed system name of the agent.
TypeString
SourceThe source for this attribute is the agent.
Warehouse nameNODE
Timestamp attributeDescription
The local time at the agent when the data was collected.Type
StringSource
The source for this attribute is the agent.Warehouse name
TIMESTAMPQuery Name attribute: This attribute is a key attribute.
DescriptionThe name of the attribute group.
TypeString
Warehouse nameQUERY_NAME or ATTRGRP
Object Name attributeDescription
The name of the performance object.Type
StringWarehouse name
OBJECT_NAME or OBJNAMEObject Type attribute
66 IBM Tivoli Monitoring: CEC Base Agent User's Guide

DescriptionThe type of the performance object.
TypeInteger with enumerated values. The strings are displayed in the Tivoli EnterprisePortal. The warehouse and queries return the values that are shown inparentheses. The following values are defined:v WMI (0)v PERFMON (1)v WMI ASSOCIATION GROUP (2)v JMX (3)v SNMP (4)v SHELL COMMAND (5)v JOINED GROUPS (6)v CIMOM (7)v CUSTOM (8)v ROLLUP DATA (9)v WMI REMOTE DATA (10)v LOG FILE (11)v JDBC (12)v CONFIG DISCOVERY (13)v NT EVENT LOG (14)v FILTER (15)v SNMP EVENT (16)v PING (17)v DIRECTOR DATA (18)v DIRECTOR EVENT (19)v SSH REMOTE SHELL COMMAND (20)
Any other value is the value that is returned by the agent in the Tivoli EnterprisePortal.
Warehouse nameOBJECT_TYPE or OBJTYPE
Object Status attributeDescription
The status of the performance object.Type
Integer with enumerated values. The strings are displayed in the Tivoli EnterprisePortal. The warehouse and queries return the values that are shown inparentheses. The following values are defined:v ACTIVE (0)v INACTIVE (1)
Any other value is the value that is returned by the agent in the Tivoli EnterprisePortal.
Warehouse nameOBJECT_STATUS or OBJSTTS
Error Code attributeDescription
The error code that is associated with the query.Type
Integer with enumerated values. The strings are displayed in the Tivoli EnterprisePortal. The warehouse and queries return the values that are shown inparentheses. The following values are defined:v NO ERROR (0)v GENERAL ERROR (1)v OBJECT NOT FOUND (2)v COUNTER NOT FOUND (3)
Chapter 4. Attributes reference 67

v NAMESPACE ERROR (4)v OBJECT CURRENTLY UNAVAILABLE (5)v COM LIBRARY INIT FAILURE (6)v SECURITY INIT FAILURE (7)v PROXY SECURITY FAILURE (9)v NO INSTANCES RETURNED (10)v ASSOCIATOR QUERY FAILED (11)v REFERENCE QUERY FAILED (12)v NO RESPONSE RECEIVED (13)v CANNOT FIND JOINED QUERY (14)v CANNOT FIND JOIN ATTRIBUTE IN QUERY 1 RESULTS (15)v CANNOT FIND JOIN ATTRIBUTE IN QUERY 2 RESULTS (16)v QUERY 1 NOT A SINGLETON (17)v QUERY 2 NOT A SINGLETON (18)v NO INSTANCES RETURNED IN QUERY 1 (19)v NO INSTANCES RETURNED IN QUERY 2 (20)v CANNOT FIND ROLLUP QUERY (21)v CANNOT FIND ROLLUP ATTRIBUTE (22)v FILE OFFLINE (23)v NO HOSTNAME (24)v MISSING LIBRARY (25)v ATTRIBUTE COUNT MISMATCH (26)v ATTRIBUTE NAME MISMATCH (27)v COMMON DATA PROVIDER NOT STARTED (28)v CALLBACK REGISTRATION ERROR (29)v MDL LOAD ERROR (30)v AUTHENTICATION FAILED (31)v CANNOT RESOLVE HOST NAME (32)v SUBNODE UNAVAILABLE (33)v SUBNODE NOT FOUND IN CONFIG (34)v ATTRIBUTE ERROR (35)v CLASSPATH ERROR (36)v CONNECTION FAILURE (37)v FILTER SYNTAX ERROR (38)v FILE NAME MISSING (39)v SQL QUERY ERROR (40)v SQL FILTER QUERY ERROR (41)v SQL DB QUERY ERROR (42)v SQL DB FILTER QUERY ERROR (43)v PORT OPEN FAILED (44)v ACCESS DENIED (45)v TIMEOUT (46)v NOT IMPLEMENTED (47)v REQUESTED A BAD VALUE (48)v RESPONSE TOO BIG (49)v GENERAL RESPONSE ERROR (50)v SCRIPT NONZERO RETURN (51)v SCRIPT NOT FOUND (52)v SCRIPT LAUNCH ERROR (53)v CONF FILE DOES NOT EXIST (54)v CONF FILE ACCESS DENIED (55)v INVALID CONF FILE (56)v EIF INITIALIZATION FAILED (57)v CANNOT OPEN FORMAT FILE (58)v FORMAT FILE SYNTAX ERROR (59)v REMOTE HOST UNAVAILABLE (60)
68 IBM Tivoli Monitoring: CEC Base Agent User's Guide

v EVENT LOG DOES NOT EXIST (61)v PING FILE DOES NOT EXIST (62)v NO PING DEVICE FILES (63)v PING DEVICE LIST FILE MISSING (64)v SNMP MISSING PASSWORD (65)v DISABLED (66)v URLS FILE NOT FOUND (67)v XML PARSE ERROR (68)v NOT INITIALIZED (69)v ICMP SOCKETS FAILED (70)v DUPLICATE CONF FILE (71)
Any other value is the value that is returned by the agent in the Tivoli EnterprisePortal.
Warehouse nameERROR_CODE or ERRCODE
TADDM attribute groupThis attribute group contains information that uniquely identifies this CEC to the Tivoli ApplicationDependency Discovery Manager (TADDM).Historical group
This attribute group is eligible for use with Tivoli Data Warehouse.Attribute descriptions
The following list contains information about each attribute in the TADDM attribute group:Node attribute: This attribute is a key attribute.
DescriptionThe managed system name of the agent.
TypeString
SourceThe source for this attribute is the agent.
Warehouse nameNODE
Timestamp attributeDescription
The local time at the agent when the data was collected.Type
StringSource
The source for this attribute is the agent.Warehouse name
TIMESTAMPCEC Mfg attribute
DescriptionThe manufacturer of this CEC.
TypeString
Warehouse nameCEC_MFG
CEC Model attributeDescription
The model number of this CEC.Type
StringWarehouse name
CEC_MODEL
Chapter 4. Attributes reference 69

CEC SN attributeDescription
The serial number for this CEC.Type
StringWarehouse name
CEC_SN
Disk capacity planning for historical dataDisk capacity planning for a monitoring agent is a prediction of the amount of disk space to beconsumed by the historical data in each attribute group that is collecting historical data. Required diskstorage is an important factor when you are defining data collection rules and your strategy for historicaldata collection.
The Capacity planning for historical data table provides the following information, which is required tocalculate disk space for this monitoring agent:
Table Table name as it is displayed in the warehouse database, if the attribute group is configured to bewritten to the warehouse. The table name listed here corresponds to the table name in “Attributegroups for the monitoring agent” on page 23.
Attribute groupName of the attribute group that is used to create the table in the warehouse database if it isshort enough to fit in the table naming constraints of the database that is being used for thewarehouse. The attribute group name listed here corresponds to the Warehouse table name in“Attribute groups for the monitoring agent” on page 23.
Bytes per row (agent)Estimate of the record length for each row or instance that is written to the agent disk forhistorical data collection. This estimate can be used for agent disk space planning purposes.
Database bytes per row (warehouse)Estimate of the record length for detailed records that are written to the warehouse database, ifthe attribute group is configured to be written to the warehouse. Detailed records are records thathave been uploaded from the agent for long-term historical data collection. This estimate can beused for warehouse disk-space planning purposes.
Aggregate bytes per row (warehouse)Estimate of the record length for aggregate records that are written to the warehouse database, ifthe attribute group is configured to be written to the warehouse. Aggregate records are created bythe Summarization agent for attribute groups that have been configured for summarization. Thisestimate can be used for warehouse disk-space planning purposes.
In addition to the information in the tables, you must know the number of rows of data that you plan tocollect. An attribute group can have single or multiple rows of data, depending on the applicationenvironment that is being monitored. For example, if your attribute group monitors each processor inyour computer and you have a dual processor computer, the number of rows is two.
Table 1. Capacity planning for historical data logged by the CEC Base agent
Table Attribute group
Bytes perrow(agent)
Databasebytes perrow(warehouse)
Aggregatebytes perrow(warehouse)
KPK09AMELP KPK_AME 452 662 1632
KPK08MPOOL KPK_AMS_POOLS 196 222 439
KPK05CPUPL KPK_CPU_POOLS 208 273 643
70 IBM Tivoli Monitoring: CEC Base Agent User's Guide

Table 1. Capacity planning for historical data logged by the CEC Base agent (continued)
Table Attribute group
Bytes perrow(agent)
Databasebytes perrow(warehouse)
Aggregatebytes perrow(warehouse)
KPKDIRE KPK_DIRECTOR 146 145 182
KPK02GLOBA KPK_GLOBAL_CEC 360 487 1451
KPK10FAIL KPK_HMC_SWITCH 230 230 267
KPK05MONLP KPK_MON_LPARS 624 853 2252
KPK07MUALC KPK_MON_UNMON_ALLOC 296 356 987
KPKPOBJST KPK_PERFORMANCE_OBJECT_STATUS 288 289 326
KPK03PERLP KPK_PER_LPAR 920 983 1458
KPK03TADDM KPK_TADDM 176 175 212
For more information about historical data collection, see “Managing historical data” in the IBM TivoliMonitoring Administrator's Guide.
Chapter 4. Attributes reference 71

72 IBM Tivoli Monitoring: CEC Base Agent User's Guide

Chapter 5. Situations reference
A situation is a logical expression involving one or more system conditions. Situations are used tomonitor the condition of systems in your network. You can manage situations from the Tivoli EnterprisePortal by using the Situation Editor or from the command-line interface using the tacmd commands forsituations. You can manage private situations in the private configuration XML file.
About situations
The monitoring agents that you use to monitor your system environment include a set of predefinedsituations that you can use as-is. You can also create new situations to meet your requirements.
Predefined situations contain attributes that check for system conditions common to many enterprises.Using predefined situations can improve the speed with which you can begin using the IBM TivoliMonitoring: CEC Base Agent. You can change the conditions or values being monitored by a predefinedsituation to the conditions or values best suited to your enterprise.
You can display predefined situations and create your own situations using the Situation editor. TheSituation editor initially lists the situations associated with the Navigator item that you selected. Whenyou click a situation name or create a situation, a panel opens with the following tabs:
FormulaFormula describing the condition being tested.
DistributionList of managed systems (operating systems, subsystems, or applications) to which the situationcan be distributed. All the CEC Base agent managed systems are assigned by default.
Expert adviceComments and instructions to be read in the event workspace.
ActionCommand to be sent to the system.
EIF Customize forwarding of the event to an Event Integration Facility receiver. (Available when theTivoli Enterprise Monitoring Server is configured to forward events.)
Until Options to close the event after a period of time, or when another situation becomes true.
Additional information about situations
The Tivoli Enterprise Portal User's Guide contains more information about predefined and customsituations and how to use them to respond to alerts.
For a list of the predefined situations and information about each individual situation for this monitoringagent, see “Predefined situations.”
Predefined situationsThe monitoring agent contains predefined situations, which are organized by Navigator item.v CEC Base
– Not applicablev CEC Resources
– KPK_Avail_Pool_Pct_Low_Warn
© Copyright IBM Corp. 2007, 2013 73
v CEC Utilization– KPK_CEC_avg_cpu_usage_Warn– KPK_CEC_avg_mem_usage_Warn– KPK_Avail_MemPool_Pct_Low_Warn– KPK_HMC_Failover_Warn– KPK_HMC_Failover_Slow_Info
Situation descriptionsEach situation description provides information about the situation that you can use to monitor thecondition of systems in your network.
The situation descriptions provide the following information:
DescriptionInformation about the conditions that the situation tests.
FormulaSyntax that contains one or more logical expressions describing the conditions for the situation tomonitor.
DistributionWhether the situation is automatically distributed to instances of the agent or is available formanual distribution.
Run at startupWhether the situation starts monitoring when the agent starts.
Sampling intervalNumber of seconds that elapse between one sample of data that the monitoring agent collects forthe server and the next sample.
Situation persistenceWhether the conditions specified in the situation evaluate to "true" for the defined number ofoccurrences in a row before the situation is raised. The default of one means that nopersistence-checking takes place.
SeveritySeverity of the predefined events: Warning, Informational, or Critical.
Clearing conditionsControls when a true situation closes: after a period of time, when another situation is true, orwhichever occurs first if both are selected.
CEC Base Navigator itemNo predefined situations are included for this Navigator item.
CEC Resources Navigator itemThe situation descriptions are organized by the Navigator item to which the situations are relevant.
KPK_Avail_Pool_Pct_Low_Warn situation
DescriptionThe percentage of available pool CPUs is low.
The situation will be evaluated for each distinct value of PoolID.
Formula*IF *VALUE KPK_CPU_POOLS.Avail_Shared_Pool_Pct *LT 5
74 IBM Tivoli Monitoring: CEC Base Agent User's Guide

See “Attributes in each attribute group” on page 24 for descriptions of the attributes inthis formula.
DistributionThis situation is automatically distributed to instances of this agent.
Run at startupYes
Sampling interval1 minute
Situation persistenceThe number of times the conditions of the situation must occur for the situation to betrue is 5.
Error conditionsWarning
Clearing conditionsThe situation clears when the condition becomes false.
CEC Utilization Navigator itemThe situation descriptions are organized by the Navigator item to which the situations are relevant.
KPK_CEC_avg_cpu_usage_Warn situation
DescriptionAverage CPU usage on the CEC is high.
The situation is evaluated for each distinct value of the LPAR_NAME attribute.
Formula*IF *VALUE KPK_MON_UNMON_ALLOC.UnMonitored_Active_LPARs *EQ 0 *AND *VALUEKPK_MON_UNMON_ALLOC.Total_Monitored_CPU_Used_Pct *GT 80
See “Attributes in each attribute group” on page 24 for descriptions of the attributes inthis formula.
DistributionThis situation is automatically distributed to instances of this agent.
Run at startupYes
Sampling interval1 minute
Situation persistenceThe number of times the conditions of the situation must occur for the situation to betrue is 5.
Error conditionsWarning
Clearing conditionsThe situation clears when the condition becomes false.
KPK_CEC_avg_mem_usage_Warn situation
DescriptionAverage Memory usage on the CEC is high.
The situation is evaluated for each distinct value of the LPAR_NAME attribute.
Chapter 5. Situations reference 75

Formula*IF *VALUE KPK_MON_UNMON_ALLOC.UnMonitored_Active_LPARs *EQ 0 *AND *VALUEKPK_MON_UNMON_ALLOC.Total_Monitored_Memory_Used_Pct *GT 80
See “Attributes in each attribute group” on page 24 for descriptions of the attributes inthis formula.
DistributionThis situation is automatically distributed to instances of this agent.
Run at startupYes
Sampling interval1 minute
Situation persistenceThe number of times the conditions of the situation must occur for the situation to betrue is 5.
Error conditionsWarning
Clearing conditionsThe situation clears when the condition becomes false.
KPK_Avail_MemPool_Pct_Low_Warn situation
DescriptionThis AMS Shared Memory Pool is almost fully used.
The situation will be evaluated for each distinct value of AMS_Pool_ID.
Formula*IF *VALUE KPK_AMS_POOLS.Available_Memory_Pool_Pct *LT 5
See “Attributes in each attribute group” on page 24 for descriptions of the attributes inthis formula.
DistributionThis situation is available for distribution.
Run at startupNo
Sampling interval1 minute
Situation persistenceThe number of times the conditions of the situation must occur for the situation to betrue is 5.
Error conditionsWarning
Clearing conditionsThe situation clears when the condition becomes false.
KPK_HMC_Failover_Warn situation
DescriptionAn HMC Failover event has occurred.
The situation will be evaluated for each distinct value of Event_Type.
76 IBM Tivoli Monitoring: CEC Base Agent User's Guide

Formula*IF *VALUE KPK_HMC_SWITCH.Event_Type *EQ ’Connection_Failure’ *UNTIL ( *TTL0:06:00:00 )
See “Attributes in each attribute group” on page 24 for descriptions of the attributes inthis formula.
DistributionThis situation is available for distribution.
Run at startupNo
Sampling intervalNone. Data is analyzed when it becomes available.
Situation persistenceNot Applicable
Error conditionsWarning
Clearing conditionsThis situation clears after 0:06:00:00.
KPK_HMC_Failover_Slow_Info situation
DescriptionAn HMC Failover event happened because of slow HMC response.
The situation will be evaluated for each distinct value of Event_Type.
Formula*IF *VALUE KPK_HMC_SWITCH.Event_Type *EQ ’High_Latency’ *UNTIL ( *TTL 0:01:00:00)
See “Attributes in each attribute group” on page 24 for descriptions of the attributes inthis formula.
DistributionThis situation is available for distribution.
Run at startupNo
Sampling intervalNone. Data is analyzed when it becomes available.
Situation persistenceNot Applicable
Error conditionsInformational
Clearing conditionsThis situation clears after 0:01:00:00.
Chapter 5. Situations reference 77

78 IBM Tivoli Monitoring: CEC Base Agent User's Guide
Chapter 6. Take Action commands reference
Take Action commands can be run from the portal client or included in a situation or a policy.
About Take Action commands
When included in a situation, the command runs when the situation becomes true. A Take Actioncommand in a situation is also referred to as reflex automation. When you enable a Take Action commandin a situation, you automate a response to system conditions. For example, you can use a Take Actioncommand to send a command to restart a process on the managed system or to send a text message to acell phone.
In advanced automation, policies are used to take actions, schedule work, and automate manual tasks. Apolicy comprises a series of automated steps called activities that are connected to create a workflow.After an activity is completed, the Tivoli Enterprise Portal receives return-code feedback, and advancedautomation logic responds with subsequent activities that are prescribed by the feedback.
A basic Take Action command shows the return code of the operation in a message box that is displayedafter the action is completed or in a log file. After you close this window, no further information isavailable for this action.
Additional information about Take Action commands
For more information about working with Take Action commands, see “Take Action commands” in theTivoli Enterprise Portal User's Guide.
Predefined Take Action commandsNot all agents have predefined Take Action commands. But you can create Take Action commands forany agent.
The IBM Tivoli Monitoring: CEC Base Agent does not provide predefined Take Action commands.
© Copyright IBM Corp. 2007, 2013 79

80 IBM Tivoli Monitoring: CEC Base Agent User's Guide

Chapter 7. Policies reference
Policies are used as an advanced automation technique for implementing more complex workflowstrategies than you can create through simple automation. All agents do not provide predefined policies,but you can create policies for any agent.
A policy is a set of automated system processes that can take actions, schedule work for users, orautomate manual tasks. You use the Workflow Editor to design policies. You control the order in whichthe policy executes a series of automated steps, which are also called activities. Policies are connected tocreate a workflow. After an activity is completed, the Tivoli Enterprise Portal receives return-codefeedback, and advanced automation logic responds with subsequent activities prescribed by the feedback.
For more information about working with policies, see “Automation with policies” in the Tivoli EnterprisePortal User's Guide.
For information about using the Workflow Editor, see the IBM Tivoli Monitoring Administrator's Guide orthe Tivoli Enterprise Portal online help.
Predefined policiesNot all agents have predefined policies. But you can create policies for any agent.
The IBM Tivoli Monitoring: CEC Base Agent does not provide predefined policies.
© Copyright IBM Corp. 2007, 2013 81

82 IBM Tivoli Monitoring: CEC Base Agent User's Guide

Chapter 8. Tivoli Common Reporting for the System pmonitoring agents
Use the agent-specific information with the Tivoli Common Reporting information in the IBM TivoliMonitoring Administrator's Guide for complete information about prerequisites, importing reports, andrunning reports.
IBM Tivoli Monitoring V6.2.2 Fix Pack 2 introduced the Cognos® data model and reports to be used inTivoli Common Reporting.
The reports in this package are historical reports, reporting against summarized data collected in TivoliData Warehouse V6.2.2. These reports are built to run against only the IBM Tivoli Monitoring VIOSPremium, CEC Base, and HMC Base agents.
The DB2®, Oracle, and SQL Server databases are supported for running all reports.
The Cognos reports can be administered, run, and edited by Tivoli Common Reporting V2.1.1 or later.For more information about Tivoli Common Reporting, see the Tivoli Common Reporting Community(https://www.ibm.com/developerworks/mydeveloperworks/groups/service/html/communityview?communityUuid=9caf63c9-15a1-4a03-96b3-8fc700f3a364).
This version of Tivoli Common Reporting includes Cognos Business Intelligence and Reporting V8.4 orlater.
More information about Tivoli Common ReportingYou can find information about Tivoli Common Reporting at the Tivoli Common Reportingdocumentation Information Center and the Tivoli Common Reporting website.
For complete documentation for the Tivoli Common Reporting tool, see the Tivoli Common Reportingdocumentation Information Center (http://pic.dhe.ibm.com/infocenter/tivihelp/v3r1/topic/com.ibm.tivoli.tcr.doc_211/ic-home.html).
The Tivoli Common Reporting website contains information and how-to videos about subjects such ashow to create IBM Tivoli Monitoring reports by dragging, import Tivoli Common Reporting and Cognosreports, and set up Cognos and Tivoli Common Reporting data connections. You can find a report catalogand information about reporting across Tivoli products at the Tivoli Common Reporting Community(https://www.ibm.com/developerworks/mydeveloperworks/groups/service/html/communityview?communityUuid=9caf63c9-15a1-4a03-96b3-8fc700f3a364).
PrerequisitesThe Cognos reports require the completion of prerequisite steps for the reports to run.
All of the following prerequisite steps must be completed or the reports cannot run:v Install Tivoli Common Reporting V2.1.1 or V3.1.v Obtain the reports from the product media.v Enable historical collection and configure summarization and pruning for CEC Base, VIOS Premium,
and HMC Base agentsv Connect to Tivoli Data Warehouse by using the database client over ODBC.
© Copyright IBM Corp. 2007, 2013 83
Install Tivoli Common Reporting V2.1.1 or V3.1Tivoli Common Reporting V2.1.1 or V3.1 must be installed and running.
Procedure1. To install and configure Tivoli Common Reporting, see the documentation in the Information Center
for the version that you are using:v Tivoli Common Reporting V2.1.1 Information Center (http://pic.dhe.ibm.com/infocenter/tivihelp/
v3r1/topic/com.ibm.tivoli.tcr.doc_211/ic-home.html)v Tivoli Common Reporting V3.1 Information Center (http://pic.dhe.ibm.com/infocenter/tivihelp/
v35r1/topic/com.ibm.tivoli.tcr.doc_31/ic-home.html)2. To ensure that Tivoli Common Reporting is running, go to https://machine_name:16311/ibm/
console/.
Obtain the reports from the product mediaThe reports must be on the same computer as the Tivoli Common Reporting server.
About this task
Procedure1. Locate the Cognos reports in the following directory: Product Media root/REPORTS.
Important: See the IBM Tivoli Monitoring Download instructions (http://pic.dhe.ibm.com/infocenter/tivihelp/v61r1/topic/com.ibm.itm.doc_6.3/dld_itm63.htm) for the part numbers for theIBM Tivoli Monitoring for System p V6.2.2 Interim Feature 3. The new package has the new reports.
2. Copy these files to any location on the same computer where the Tivoli Common Reporting server isinstalled.
Configure historical collectionHistorical collection must be enabled and summarization and pruning configured for the CEC Base, VIOSPremium, and HMC Base agents
Before you begin
Install and configure IBM Tivoli Monitoring V6.2.2 Fix Pack 2 and install and configure the CEC, VIOS,and HMC Base agents, then configure historical collection.
Also, configure the Warehouse Summarization and Pruning agent with or without shifts enabled.
For more information about how to enable historical collection and configure warehouse summarizationand pruning in IBM Tivoli Monitoring, see “Managing historical data”" in the IBM Tivoli MonitoringAdministrator's Guide.
Procedure1. Enable daily and hourly summarization for the tables listed in Table 2 on page 85.
Note: Some reports support additional summarization types such as Weekly and Monthly. Bestpractice is not to turn on these summarizations unless you want to run the reports against thesesummarization types. Running the prerequisite scanner report on a per-report basis provides you withthe list of attribute groups (and summarizations) that are used for each report.
84 IBM Tivoli Monitoring: CEC Base Agent User's Guide
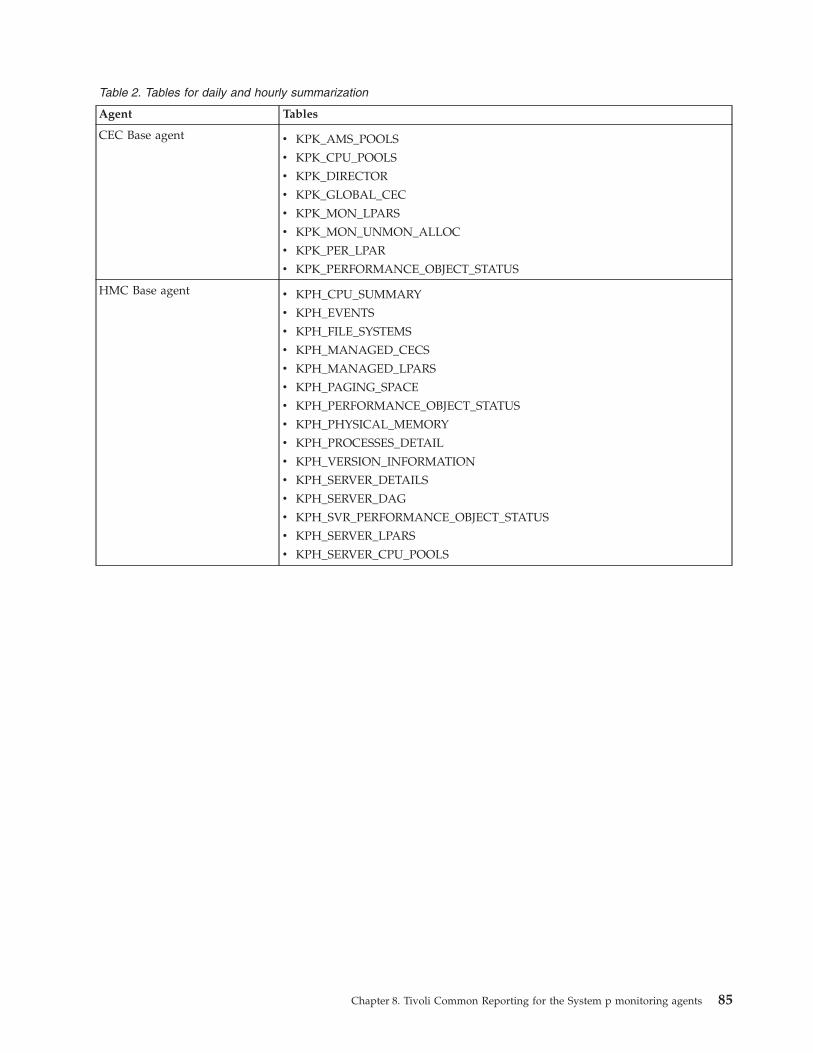
Table 2. Tables for daily and hourly summarization
Agent Tables
CEC Base agent v KPK_AMS_POOLS
v KPK_CPU_POOLS
v KPK_DIRECTOR
v KPK_GLOBAL_CEC
v KPK_MON_LPARS
v KPK_MON_UNMON_ALLOC
v KPK_PER_LPAR
v KPK_PERFORMANCE_OBJECT_STATUS
HMC Base agent v KPH_CPU_SUMMARY
v KPH_EVENTS
v KPH_FILE_SYSTEMS
v KPH_MANAGED_CECS
v KPH_MANAGED_LPARS
v KPH_PAGING_SPACE
v KPH_PERFORMANCE_OBJECT_STATUS
v KPH_PHYSICAL_MEMORY
v KPH_PROCESSES_DETAIL
v KPH_VERSION_INFORMATION
v KPH_SERVER_DETAILS
v KPH_SERVER_DAG
v KPH_SVR_PERFORMANCE_OBJECT_STATUS
v KPH_SERVER_LPARS
v KPH_SERVER_CPU_POOLS
Chapter 8. Tivoli Common Reporting for the System p monitoring agents 85

Table 2. Tables for daily and hourly summarization (continued)
Agent Tables
VIOS Premium agent v KVA_AMS_POOL
v KVA_CPU_DETAIL
v KVA_CPU_SUMMARY
v KVA_DEVICES
v KVA_DISKS
v KVA_FILE_SYSTEMS
v KVA_INTERNET_PROTOCOL_DETAIL
v KVA_INTERNET_PROTOCOL_SUMMARY
v KVA_LOGICAL_PARTITION
v KVA_LOGICAL_VOLUMES
v KVA_MPIO_ATTRIBUTES
v KVA_MPIO_STATUS
v KVA_NETWORK_ADAPTERS_RATES
v KVA_NETWORK_MAPPINGS
v KVA_PAGING_SPACE
v KVA_PHYSICAL_MEMORY
v KVA_PHYSICAL_VOLUMES
v KVA_PROCESSES_DETAIL
v KVA_PROCESSES_SUMMARY
v KVA_SYSTEM_CALL
v KVA_SYSTEM_IO
v KVA_STORAGE_MAPPINGS
v KVA_TCP
v KVA_VIRTUAL_MEMORY_MANAGEMENT
v KVA_VOLUME_GROUPS
v KVA_FC_STATS
2. To ensure that the required views are present, run the query in Table 3 for the applicable databaseagainst Tivoli Data Warehouse.
Table 3. Queries for databases
Database Query
DB2 select distinct "VIEWNAME" from SYSCAT.VIEWS where "VIEWNAME" like ’%V’
Oracle select distinct "VIEW_NAME" from USER_VIEWS where "VIEW_NAME" like ’%V’
MS SQL Server select distinct "NAME" from SYS.VIEWS where "NAME" like ’%V’
The result set contains the following views:v CEC Base agent
– KPK_AMS_POOLS_HV, KPK_AMS_POOLS_DV– KPK_CPU_POOLS_HV, KPK_CPU_POOLS_DV– KPK_DIRECTOR_HV, KPK_DIRECTOR_DV– KPK_GLOBAL_CEC_HV, KPK_GLOBAL_CEC_DV– KPK_MON_LPARS_HV, KPK_MON_LPARS_DV– KPK_MON_UNMON_ALLOC_HV, KPK_MON_UNMON_ALLOC_DV– KPKPOBJST_HV, KPKPOBJST_DV– KPK_PER_LPAR_HV, KPK_PER_LPAR_DV
v HMC Base agent– KPH_CPU_SUMMARY_HV, KPH_CPU_SUMMARY_DV
86 IBM Tivoli Monitoring: CEC Base Agent User's Guide

– KPH_EVENTS_HV, KPH_EVENTS_DV– KPH_FILE_SYSTEMS_HV, KPH_FILE_SYSTEMS_DV– KPH_MANAGED_CECS_HV, KPH_MANAGED_CECS_DV– KPH_MANAGED_LPARS_HV, KPH_MANAGED_LPARS_DV– KPHPOBJST_HV, KPHPOBJST_DV– KPH_PAGING_SPACE_HV, KPH_PAGING_SPACE_DV– KPH_PHYSICAL_MEMORY_HV, KPH_PHYSICAL_MEMORY_DV– KPH_PROCESSES_DETAIL_HV, KPH_PROCESSES_DETAIL_DV– KPH_VERSION_INFORMATION_HV, KPH_VERSION_INFORMATION_DV– KPH_SERVER_DETAILS_HV, KPH_SERVER_DETAILS_DV– KPH_SERVER_DAG_HV, KPH_SERVER_DAG_DV– KPHSVRPOS_HV, KPHSVRPOS_DV– KPH_SERVER_LPARS_HV, KPH_SERVER_LPARS_DV– KPH_SERVER_CPU_POOLS_HV, KPH_SERVER_CPU_POOLS_DV
v VIOS Premium agent– KVA28VIRTU_HV, KVA28VIRTU_DV– KVA43INTER_HV, KVA43INTER_DV– KVA44INTER_HV, KVA44INTER_DV– KVA_AMS_POOL_HV, KVA_AMS_POOL_DV– KVA_CPU_DETAIL_HV, KVA_CPU_DETAIL_DV– KVA_CPU_SUMMARY_HV, KVA_CPU_SUMMARY_DV– KVA_DEVICES_HV, KVA_DEVICES_DV– KVA_DISKS_HV, KVA_DISKS_DV– KVA_FILE_SYSTEMS_HV, KVA_FILE_SYSTEMS_DV– KVA_LOGICAL_PARTITION_HV, KVA_LOGICAL_PARTITION_DV– KVA_LOGICAL_VOLUMES_HV, KVA_LOGICAL_VOLUMES_DV– KVA_MPIO_ATTRIBUTES_HV, KVA_MPIO_ATTRIBUTES_DV– KVA_MPIO_STATUS_HV, KVA_MPIO_STATUS_DV– KVA_NETWORK_ADAPTERS_RATES_HV, KVA_NETWORK_ADAPTERS_RATES_DV– KVA_NETWORK_MAPPINGS_HV, KVA_NETWORK_MAPPINGS_DV– KVA_PAGING_SPACE_HV, KVA_PAGING_SPACE_DV– KVA_PHYSICAL_MEMORY_HV, KVA_PHYSICAL_MEMORY_DV– KVA_PHYSICAL_VOLUMES_HV, KVA_PHYSICAL_VOLUMES_DV– KVA_SYSTEM_CALL_HV, KVA_SYSTEM_CALL_DV– KVA_SYSTEM_IO_HV, KVA_SYSTEM_IO_DV– KVA_STORAGE_MAPPINGS_HV, KVA_STORAGE_MAPPINGS_DV– KVA_PROCESSES_DETAIL_HV, KVA_PROCESSES_DETAIL_DV– KVA_PROCESSES_SUMMARY_HV, KVA_PROCESSES_SUMMARY_DV– KVA_TCP_HV, KVA_TCP_DV– KVA_VOLUME_GROUPS_HV, KVA_VOLUME_GROUPS_DV– KVA_FC_STATS_HV, KVA_FC_STATS_DV
Create indexes
Database scripts are provided in the scripts folder to create indexes for enhanced reporting performancein the Tivoli Data Warehouse. If your data warehouse is not prepared with history before installation, thescripts cause errors. Before you run the scripts to create indexes, ensure that historical collection isenabled for the tables that are required to run the reports. You can manually run one the followingscripts, depending on your database type:v scripts/db2/create_index.db2v scripts/mssql/create_index.sqlv scripts/oracle/create_index.sql
Note: If you are using a schema other than ITMUSER, update the create_index scripts by replacing allinstances of ITMUSER with your schema name before you run the scripts.
Chapter 8. Tivoli Common Reporting for the System p monitoring agents 87

For example, change ITMUSER in the following script:CREATE INDEX ITMUSER.KPK_RPT_GLOBAL_CEC_H ON ITMUSER.KPK_GLOBAL_CEC_H("LAT_Machine_ID" ASC, WRITETIME ASC, SHIFTPERIOD ASC, VACATIONPERIOD ASC)PCTFREE 10 MINPCTUSED 10 ALLOW REVERSE SCANSPAGE SPLIT SYMMETRIC COLLECT SAMPLED DETAILEDSTATISTICS ;
The following script is the corrected version where ITMUSER is replaced with your schema name:CREATE INDEX Schema_Name.KPK_RPT_GLOBAL_CEC_H ON Schema_Name.KPK_GLOBAL_CEC_H("LAT_Machine_ID" ASC, WRITETIME ASC, SHIFTPERIOD ASC, VACATIONPERIOD ASC)PCTFREE 10 MINPCTUSED 10 ALLOW REVERSE SCANSPAGE SPLIT SYMMETRIC COLLECTSAMPLED DETAILED STATISTICS ;
For more information, see “Creating shared dimensions tables and populating the time dimensions table”in the IBM Tivoli Monitoring Administrator's Guide (http://pic.dhe.ibm.com/infocenter/tivihelp/v15r1/topic/com.ibm.itm.doc_6.3/adminuse/tcr_dimensions.htm).
Although indexes help in enhancing report performance, some limitations apply: Use indexes only whenyou have large tables with thousands of rows, because indexes degrade the performance of insert,update, and delete operations on a table. You can run a script to drop these indexes if you haveperformance issues:v scripts/db2/drop_index.db2v scripts/mssql/drop_index.sqlv scripts/oracle/drop_index.sql
These index scripts were tested with Tivoli Common Reporting 2.1.1 and Tivoli Common Reporting 3.1.In general, the reports perform better in Tivoli Common Reporting 3.1 with or without the indexes. Thefollowing reports showed significant performance improvements on using indexes (50% or higherreduction in run time):v CEC Base Agent LPAR Physical CPU Utilization Detailsv CEC Base Agent LPAR Physical Memory Utilization Detailsv HMC Base Agent CPU Pool Usage Detailsv HMC Base Agent LPAR Physical CPU Usage Detailsv VIOS Premium Agent Disk Capacity Detailsv VIOS Premium Agent Physical Fibre Channel Adapter Utilizationv CEC Base Agent Top or Bottom CECs by Physical Memory Utilizationv CEC Base Agent Top or Bottom LPARs by Physical CPU Utilizationv CEC Base Agent Top or Bottom LPARs by Physical Memory Utilizationv HMC Base Agent Top or Bottom LPARs by Physical CPU Usage
The results were obtained by testing the index scripts against a DB2 warehouse by using Tivoli CommonReporting 3.1 on a Windows Server 2008 R2 operating system. The warehouse had historical data thatwas collected for 15 managed servers and 213 LPARs for seven days.
Connect to the Tivoli Data WarehouseConnect to Tivoli Data Warehouse by using the database client over ODBC.
About this task
Cognos uses ODBC to connect to the database. Therefore, it is important to first install a database clienton theTivoli Common Reporting server and connect the database client to Tivoli Data Warehouse.
88 IBM Tivoli Monitoring: CEC Base Agent User's Guide

Procedure1. Make sure that you deployed a DB2, Oracle, or MS SQL Server database client on the computer where
the Cognos-based Tivoli Common Reporting engine is installed. For DB2, the client must be the sameversion as the database that Tivoli Data Warehouse is using.
2. Connect the DB2, Oracle, or MS SQL Server database client to the database server:
Database How to connect
DB2 Connect by running the Configuration Assistant, configuring the local net service nameconfiguration, and restarting your system.
Oracle Connect by running the Oracle Net Configuration Assistant, configuring the local netservice name configuration, and restarting your system.
MS SQL Server Connect by running the MS SQL Management Studio Express®, configuring the local netservice name configuration, and restarting your system.
Important: Note the name of the connection you created, because it is used in Tivoli CommonReporting by the report installer as described in “Importing and running Cognos reports.”See Connecting to the Tivoli Data Warehouse using the database client over ODBC in the IBM TivoliMonitoring Administrator's Guide V6.2.2 Fix Pack 2.
Importing and running Cognos reportsYou must import the IBM Tivoli Monitoring for System p Cognos reports to run any report from theSystem p Reports package.
Before you begin
All prerequisites must be met before importing and running the reports, or the reports cannot run. See“Prerequisites” on page 83 for the steps.
Note: With this release, the reports package name does not contain the release version such as 6.2.2, andso on. When the package name does not have a version number, the name is the same across releases, sodifferent versions of the packages cannot co-exist in the Tivoli Integrated Portal. Before installing thereports, be sure you back up the existing reports package if the name is IBM Tivoli Monitoring forSystem P Reports.
About this task
The IBM Tivoli Monitoring for System p Reports package contains an installer that performs thefollowing tasks:v Importing the reports and data model into Tivoli Common Reportingv Configuring a data source to connect to Tivoli Data Warehousev Running scripts to create and populate the common dimensions in Tivoli Data Warehouse
After completing the steps for importing and running Cognos reports, you can run any report from theIBM Tivoli Monitoring for System p Reports package.
Procedure1. You might need to point to Java 1.5+ through your system PATH. Make sure that your system PATH
contains a valid path to a Java virtual machine, for example: # PATH=$PATH:/ibmjre50/ibm-java-i386-50/jre/bin
2. From the directory where you extracted the reports package, run the file in Table 4 on page 90depending on your operating system.
Chapter 8. Tivoli Common Reporting for the System p monitoring agents 89
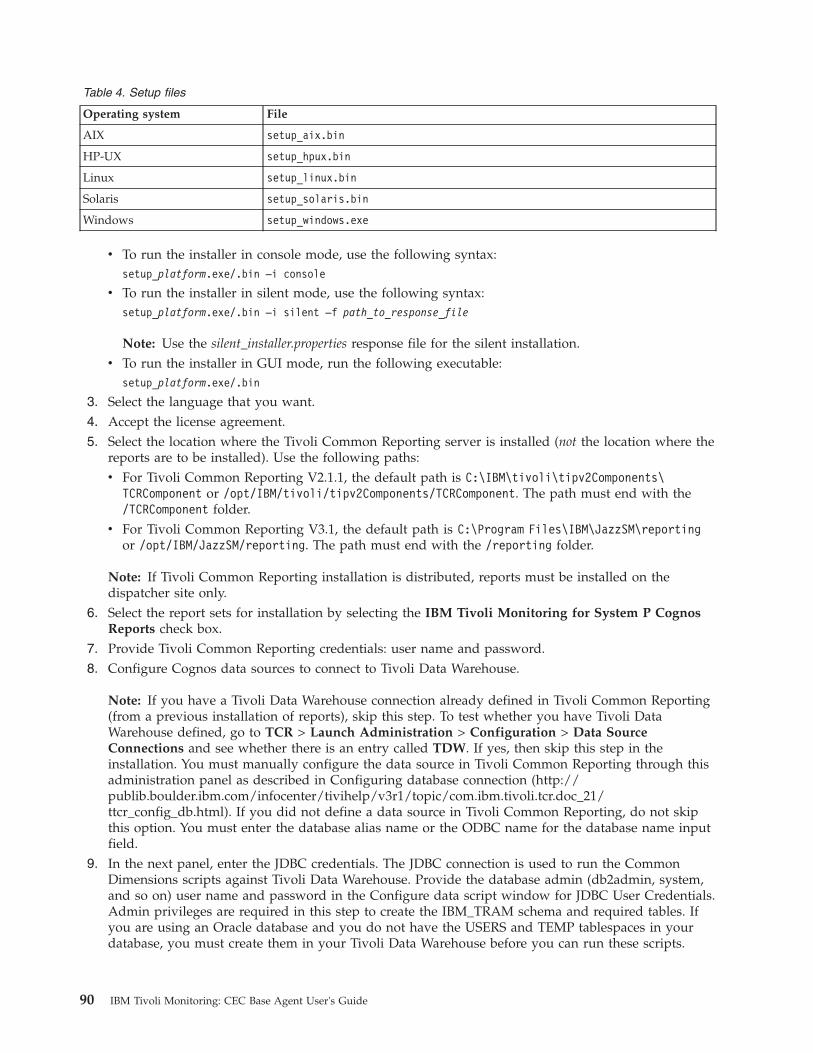
Table 4. Setup files
Operating system File
AIX setup_aix.bin
HP-UX setup_hpux.bin
Linux setup_linux.bin
Solaris setup_solaris.bin
Windows setup_windows.exe
v To run the installer in console mode, use the following syntax:setup_platform.exe/.bin –i console
v To run the installer in silent mode, use the following syntax:setup_platform.exe/.bin –i silent –f path_to_response_file
Note: Use the silent_installer.properties response file for the silent installation.v To run the installer in GUI mode, run the following executable:
setup_platform.exe/.bin
3. Select the language that you want.4. Accept the license agreement.5. Select the location where the Tivoli Common Reporting server is installed (not the location where the
reports are to be installed). Use the following paths:v For Tivoli Common Reporting V2.1.1, the default path is C:\IBM\tivoli\tipv2Components\
TCRComponent or /opt/IBM/tivoli/tipv2Components/TCRComponent. The path must end with the/TCRComponent folder.
v For Tivoli Common Reporting V3.1, the default path is C:\Program Files\IBM\JazzSM\reportingor /opt/IBM/JazzSM/reporting. The path must end with the /reporting folder.
Note: If Tivoli Common Reporting installation is distributed, reports must be installed on thedispatcher site only.
6. Select the report sets for installation by selecting the IBM Tivoli Monitoring for System P CognosReports check box.
7. Provide Tivoli Common Reporting credentials: user name and password.8. Configure Cognos data sources to connect to Tivoli Data Warehouse.
Note: If you have a Tivoli Data Warehouse connection already defined in Tivoli Common Reporting(from a previous installation of reports), skip this step. To test whether you have Tivoli DataWarehouse defined, go to TCR > Launch Administration > Configuration > Data SourceConnections and see whether there is an entry called TDW. If yes, then skip this step in theinstallation. You must manually configure the data source in Tivoli Common Reporting through thisadministration panel as described in Configuring database connection (http://publib.boulder.ibm.com/infocenter/tivihelp/v3r1/topic/com.ibm.tivoli.tcr.doc_21/ttcr_config_db.html). If you did not define a data source in Tivoli Common Reporting, do not skipthis option. You must enter the database alias name or the ODBC name for the database name inputfield.
9. In the next panel, enter the JDBC credentials. The JDBC connection is used to run the CommonDimensions scripts against Tivoli Data Warehouse. Provide the database admin (db2admin, system,and so on) user name and password in the Configure data script window for JDBC User Credentials.Admin privileges are required in this step to create the IBM_TRAM schema and required tables. Ifyou are using an Oracle database and you do not have the USERS and TEMP tablespaces in yourdatabase, you must create them in your Tivoli Data Warehouse before you can run these scripts.
90 IBM Tivoli Monitoring: CEC Base Agent User's Guide

Note: If you already have these common dimensions (Time Dimension, Weekday Lookup, MonthLookup, and Computer System under IBM_TRAM schema) in your Tivoli Data Warehouse from aprevious installation and you want to modify those dimensions to define time granularity that isdifferent from what is in the Tivoli Data Warehouse, you can skip this step and run the scriptsmanually as described in “Creating shared dimension tables and populating the time dimensionstable” in the IBM Tivoli Monitoring Administrator's Guide V6.2.2 Fix Pack 2.
10. Select the JDBC Database Credentials tab, and select database type. Edit the JDBC URL, JDBCdriver file names, and JDBC driver class for the selected database type.
Database Required driver file name
DB2 db2jcc.jar and db2jcc_license_cu.jarNote: JDBC credentials must have db2admin privileges.
Oracle oraclethin.jar
SQL Server sqljdbc.jar
11. On the pre-installation summary panel, all reports selected for installation are displayed.12. Click Install, and wait for the installer to finish. The Installation results panel shows the status of all
installation actions for every item or report.One log file and one trace file are included. Both files are in the user home directory, with thefollowing names:v Report_Installer_for_Tivoli_Common_Reporting_InstallLog.log (Log)v Report_Installer_For_TCR_Output.txt (Trace)
On Windows systems in the Run window, type %USERPROFILE% to open the file explorer to thedirectory where the log and trace files are created. If you skipped running the database scripts or ascript failed, you can run the script manually by using the instructions in “Creating shareddimension tables and populating the time dimensions table” in the IBM Tivoli MonitoringAdministrator's Guide V6.2.2 Fix Pack 2.
Results
At the end of the installation, you see 3 messages. One for the status of importing reports, one for thestatus of defining the data source, and one for the status of running database scripts. If any of thesemessages indicate a failure, look at the Report_Installer_For_TCR_Output.txt andReport_Installer_InstallLog.log file. On Windows systems, this file is located in C:\Documents andSettings\Administrator.
What to do next
Use the following steps to make sure that your installation was successful:1. Go to Tivoli Common Reporting and see whether IBM Tivoli Monitoring for System P Reports is
displayed in the Public Folders.2. Go to TCR > Launch Administration > Configuration > Data Source Connections and see whether
Tivoli Data Warehouse was defined. Click Tivoli Data Warehouse.3. On the next page, Tivoli Data Warehouse has a Test Connection icon next to it. Click the Test
connection icon to make sure that you are connected to the database.4. Go to TCR > Launch Query Studio. Select IBM Tivoli Monitoring for System P Reports. In the left
navigation, all the data is displayed.5. Browse to IBM Tivoli Monitoring for System P Reports > ITM for System P Agents (Query) > TCR
Shared Dimensions (Query) > Time.6. Drag Date into the space on the left. If no data is displayed, Time Dimension was not defined
correctly.
Chapter 8. Tivoli Common Reporting for the System p monitoring agents 91
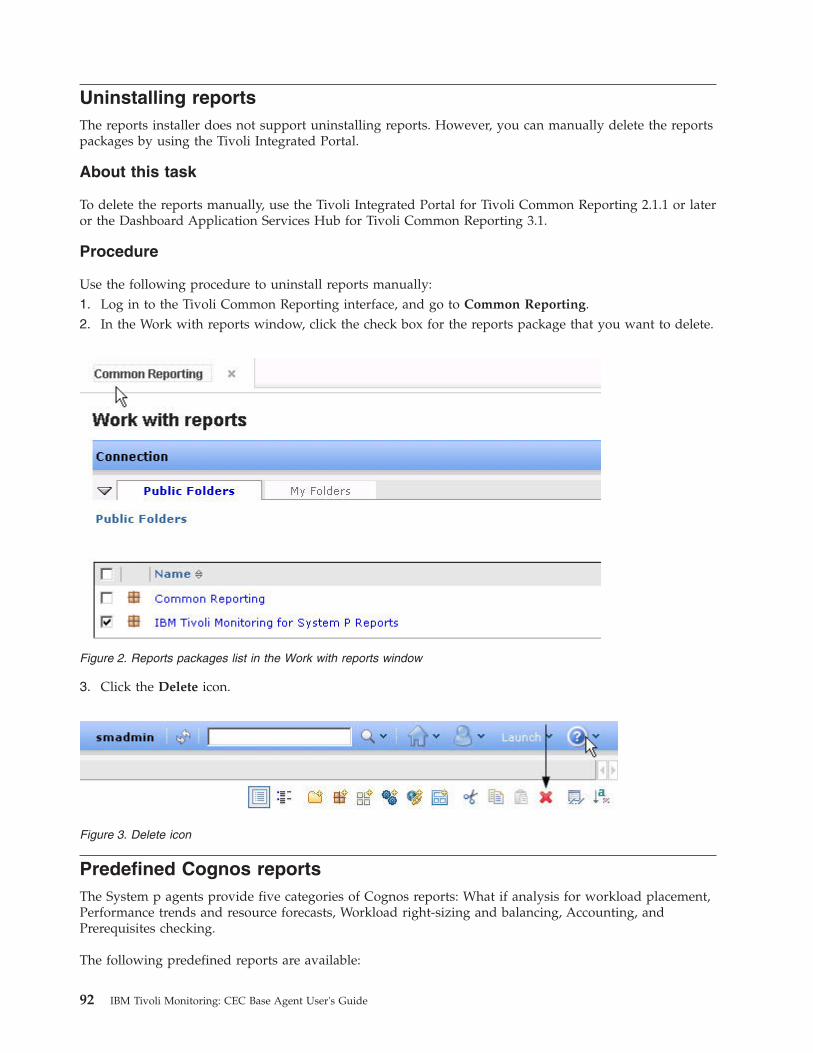
Uninstalling reportsThe reports installer does not support uninstalling reports. However, you can manually delete the reportspackages by using the Tivoli Integrated Portal.
About this task
To delete the reports manually, use the Tivoli Integrated Portal for Tivoli Common Reporting 2.1.1 or lateror the Dashboard Application Services Hub for Tivoli Common Reporting 3.1.
Procedure
Use the following procedure to uninstall reports manually:1. Log in to the Tivoli Common Reporting interface, and go to Common Reporting.2. In the Work with reports window, click the check box for the reports package that you want to delete.
3. Click the Delete icon.
Predefined Cognos reportsThe System p agents provide five categories of Cognos reports: What if analysis for workload placement,Performance trends and resource forecasts, Workload right-sizing and balancing, Accounting, andPrerequisites checking.
The following predefined reports are available:
Figure 2. Reports packages list in the Work with reports window
Figure 3. Delete icon
92 IBM Tivoli Monitoring: CEC Base Agent User's Guide

v Prerequisites checking
– System p Report Prerequisite Scannerv Accounting
– HMC Base Agent Number of Managed Servers and LPARs monitoredv Performance trends and resource forecasts
– CEC Base Agent CPU Pools Utilization Details– CEC Base Agent Frame Workload Trend and Forecast– CEC Base Agent LPAR Physical CPU Utilization Details– CEC Base Agent LPAR Physical Memory Utilization Details– CEC Base Agent LPAR Workload Trend and Forecast– HMC Base Agent CPU Pools Utilization Details– HMC Base Agent LPAR CPU Trend and Forecast– HMC Base Agent LPAR Heat Chart– HMC Base Agent LPAR Physical CPU Usage Details– HMC Base Agent Managed Server CPU Trend and Forecast– HMC Base Agent Managed Server Forecast Alerts– HMC Base Agent Managed Server Heat Chart– HMC Base Agent Managed Server Performance Trends– HMC Base Agent Managed Server Weekly Comparison– VIOS Premium Agent Disk Capacity Details– VIOS Premium Agent Physical Fibre Channel Adapter Utilization– VIOS Premium Agent Shared Ethernet Adapter Utilization
v What if analysis for workload placement
– CEC Base Agent Number of LPARs for CEC– CEC Base Agent Resources Needed for Additional LPARS on CEC– HMC Base Agent Number of LPARs for Managed Server– HMC Base Agent Resources Needed For Additional LPARs on Managed Server
v Workload right-sizing and balancing
– CEC Base Agent Balanced and Unbalanced CECs– CEC Base Agent Top or Bottom CECs by Physical CPU Utilization– CEC Base Agent Top or Bottom CECs by Physical Memory Utilization– CEC Base Agent Top or Bottom LPARs by Physical CPU Utilization– CEC Base Agent Top or Bottom LPARs by Physical Memory Utilization– HMC Base Agent Top or Bottom LPARs by Physical CPU Usage– HMC Base Agent Top or Bottom Managed Servers by Physical CPU Utilization– VIOS Premium Agent Top or Bottom VIOSs by Disk Capacity
Attribute groups
The Cognos reports use the following attribute groups (agent codes: KPH for the HMC Base agent, KPKfor the CEC Base agent, KVA for the VIOS Premium agent):v KPH_MANAGED_CECSv KPH_SERVER_DETAILS_HVv KPH_SERVER_DETAILS_DVv KPH_SERVER_DETAILS_WVv KPH_SERVER_DETAILS_MV
Chapter 8. Tivoli Common Reporting for the System p monitoring agents 93

v KPH_SERVER_LPARS_HVv KPH_SERVER_LPARS_DVv KPH_SERVER_LPARS_WVv KPH_SERVER_LPARS_MVv KPH_SERVER_CPU_POOLS_HVv KPH_SERVER_CPU_POOLS_DVv KPH_SERVER_CPU_POOLS_WVv KPH_SERVER_CPU_POOLS_MVv KPK_GLOBAL_CEC_HVv KPK_GLOBAL_CEC_DVv KPK_GLOBAL_CEC_WVv KPK_GLOBAL_CEC_MVv KPK_MON_LPARS_HVv KPK_MON_LPARS_DVv KPK_MON_LPARS_WVv KPK_MON_LPARS_MVv KPK_MON_UNMON_ALLOC_HVv KPK_MON_UNMON_ALLOC_DVv KPK_CPU_POOLS_HVv KPK_CPU_POOLS_DVv KPK_CPU_POOLS_WVv KPK_CPU_POOLS_MVv KVA_FC_STATS_DVv KVA_NETWORK_ADAPTERS_RATES_DVv KVA_PHYSICAL_VOLUMES_DVv KVA_STORAGE_MAPPINGS_DVv KVA_VOLUME_GROUPS_DV
Prerequisites Checking reportsOne predefined report is available for prerequisites checking for the System p agents.
The following report is available for prerequisites checking: System p Report Prerequisite Scanner
System p Report Prerequisite Scanner reportThis report runs against DB2, Oracle, or MS SQL Server databases and determines whether allprerequisite tables and views are present to successfully run System p reports (all reports or on aper-report basis).
Report element Details
Parameters To run the Prerequisite Scanner, ensure that you defined and tested a database (DB2, MSSQL Server, or Oracle) connection to the Tivoli Data Warehouse and choose theappropriate connection to generate the Prerequisite Scanner Report.
Database TypeDB2, MS SQL Server, or Oracle
Display OptionsCheck all reports or a specific report by choosing from a category within the reportspackage.
94 IBM Tivoli Monitoring: CEC Base Agent User's Guide

Report element Details
Tables or views usedDB2
SYSCAT.VIEWS
SYSCAT.TABLES
Oracle
SYS.ALL_VIEWS
SYS.ALL_TABLES
MS SQL Server
INFORMATION_SCHEMA.VIEWS
INFORMATION_SCHEMA.TABLES
Output A legend is displayed at the beginning of the report that shows the meaning of thesymbols that are displayed under the Status column. A red cross and a yellow exclamationpoint (!) indicate error conditions. When an error is indicated, a corrective action issuggested that includes links to the appropriate documentation. The table contains twocolumns:
v Missing Tables/Views from IBM Tivoli Monitoring for System p agent
In the first column, missing tables and views are listed in order, showing status with ared cross or a yellow exclamation point (!). Available tables and views are shown with agreen check mark.
v Missing Table/Views for Shared Dimensions
In the second column, the IBM_TRAM schema followed by TIME_DIMENSION,WEEKDAY_LOOKUP, MONTH_LOOKUP and ComputerSystem under the IBM_TRAMschema are checked for availability.
If all the tables and views are available in the warehouse, a report might not run becauseof inadequately generated timestamps. In this case, run the appropriate database scripts topopulate the TIME_DIMENSION table. When you run the prerequisite scanner to check aspecific report, the IBM Tivoli Monitoring tables that are used for implementation arechecked for availability and a status is displayed for each of the tables that are used. Sincethe TIME_DIMENSION table is used by most predefined reports, you can checkavailability by clicking a hyperlink that is provided in the report.
Note: While configuring historical collection, see “Attributes in each attribute group” on page 24 forinformation about the attribute groups.
Accounting reportsOne predefined accounting report is available for the System p agents.
The following report is available for accounting: HMC Base Agent Number of Managed Servers andLPARs monitored.
HMC Base Agent Number of Managed Servers and LPARs monitored reportThis report provides the number of managed servers, logical partitions, and processor cores that aremonitored by the HMC Base agent for the Power Hypervisor.
Report element Details
Parameters None
Tables or views used KPH_MANAGED_CECS
Chapter 8. Tivoli Common Reporting for the System p monitoring agents 95

Report element Details
Output This report contains a table that provides the following information:
v Number of managed servers, logical partitions, and processor cores that are runningagainst each server in the environment
v Total number of managed servers, logical partitions, and processor cores that aremonitored for the Power hypervisor
Performance trends and resource forecasts reportsYou can generate performance trends and forecasts for resources like CPU and memory for the System penvironment using these predefined reports.
The following reports are available for performance trends and resource forecasts:v CEC Base Agent CPU Pools Utilization Detailsv CEC Base Agent Frame Workload Trend and Forecastv CEC Base Agent LPAR Physical CPU Utilization Detailsv CEC Base Agent LPAR Physical Memory Utilization Detailsv CEC Base Agent LPAR Workload Trend and Forecastv HMC Base Agent CPU Pools Utilization Detailsv HMC Base Agent LPAR CPU Trend and Forecastv HMC Base Agent LPAR Heat Chartv HMC Base Agent LPAR Physical CPU Usage Detailsv HMC Base Agent Managed Server CPU Trend and Forecastv HMC Base Agent Managed Server Forecast Alertsv HMC Base Agent Managed Server Heat Chartv HMC Base Agent Managed Server Performance Trendsv HMC Base Agent Managed Server Weekly Comparisonv VIOS Premium Agent Disk Capacity Detailsv VIOS Premium Agent Physical Fibre Channel Adapter Utilizationv VIOS Premium Agent Shared Ethernet Adapter Utilization
96 IBM Tivoli Monitoring: CEC Base Agent User's Guide
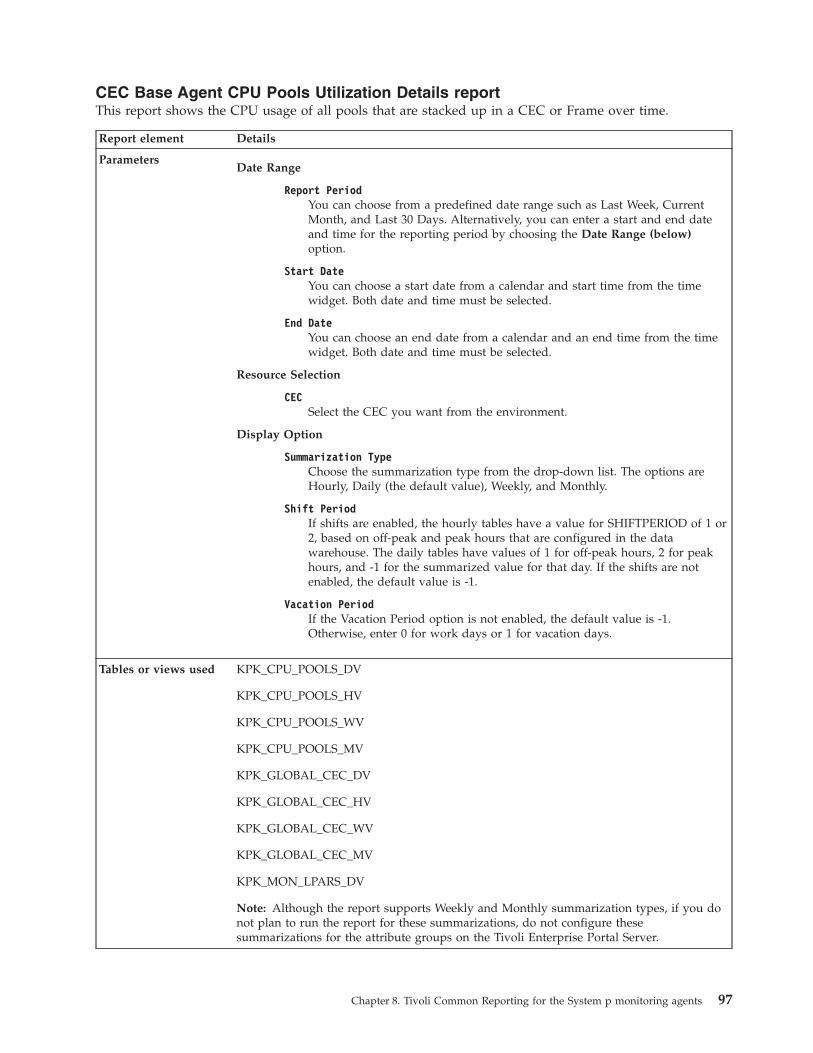
CEC Base Agent CPU Pools Utilization Details reportThis report shows the CPU usage of all pools that are stacked up in a CEC or Frame over time.
Report element Details
ParametersDate Range
Report PeriodYou can choose from a predefined date range such as Last Week, CurrentMonth, and Last 30 Days. Alternatively, you can enter a start and end dateand time for the reporting period by choosing the Date Range (below)option.
Start DateYou can choose a start date from a calendar and start time from the timewidget. Both date and time must be selected.
End DateYou can choose an end date from a calendar and an end time from the timewidget. Both date and time must be selected.
Resource Selection
CECSelect the CEC you want from the environment.
Display Option
Summarization TypeChoose the summarization type from the drop-down list. The options areHourly, Daily (the default value), Weekly, and Monthly.
Shift PeriodIf shifts are enabled, the hourly tables have a value for SHIFTPERIOD of 1 or2, based on off-peak and peak hours that are configured in the datawarehouse. The daily tables have values of 1 for off-peak hours, 2 for peakhours, and -1 for the summarized value for that day. If the shifts are notenabled, the default value is -1.
Vacation PeriodIf the Vacation Period option is not enabled, the default value is -1.Otherwise, enter 0 for work days or 1 for vacation days.
Tables or views used KPK_CPU_POOLS_DV
KPK_CPU_POOLS_HV
KPK_CPU_POOLS_WV
KPK_CPU_POOLS_MV
KPK_GLOBAL_CEC_DV
KPK_GLOBAL_CEC_HV
KPK_GLOBAL_CEC_WV
KPK_GLOBAL_CEC_MV
KPK_MON_LPARS_DV
Note: Although the report supports Weekly and Monthly summarization types, if you donot plan to run the report for these summarizations, do not configure thesesummarizations for the attribute groups on the Tivoli Enterprise Portal Server.
Chapter 8. Tivoli Common Reporting for the System p monitoring agents 97

Report element Details
Output This report contains an area chart that shows the total CPU units that are used by CPUPools over a selected period. The table shows various CPU attributes such as Average CPUPool Units Consumed, Average Maximum CPU Pool Capacity, Allocated CEC CPU Units,and Total CEC CPU Units.
CEC Base Agent Frame Workload Trend and Forecast reportThis report shows a linear forecast of CPU and memory utilization for the frame.
Report element Details
ParametersResource
CECSelect the CEC you want from the environment.
Date Range
Report PeriodYou can choose from a predefined date range such as Last Week, CurrentMonth, and Last 30 Days. Alternatively, you can enter a start and end dateand time for the reporting period by choosing the Date Range (below)option.
Forecast Period (Days)The number of days to forecast.
Display Options
Shift PeriodIf shifts are enabled, the hourly tables have a value for SHIFTPERIOD of 1 or2, based on off-peak and peak hours that are configured in the datawarehouse. The daily tables have values of 1 for off-peak hours, 2 for peakhours, and -1 for the summarized value for that day. If the shifts are notenabled, the default value is -1.
Vacation PeriodIf the Vacation Period option is not enabled, the default value is -1.Otherwise, enter 0 for work days or 1 for vacation days.
Thresholds (%)CPU and memory thresholds to compare against the forecasted values.
Tables or views used KPK_MON_UNMON_ALLOC_DV
KPK_GLOBAL_CEC_DV
Output This report contains line charts for CEC CPU and memory usage and the forecasted usagevalues.
CEC Base Agent LPAR Physical CPU Utilization Details reportThis report shows the CPU usage for all LPARs in all the CPU pools in a CEC or Frame over time ascompared to the maximum capacity of the pools.
98 IBM Tivoli Monitoring: CEC Base Agent User's Guide
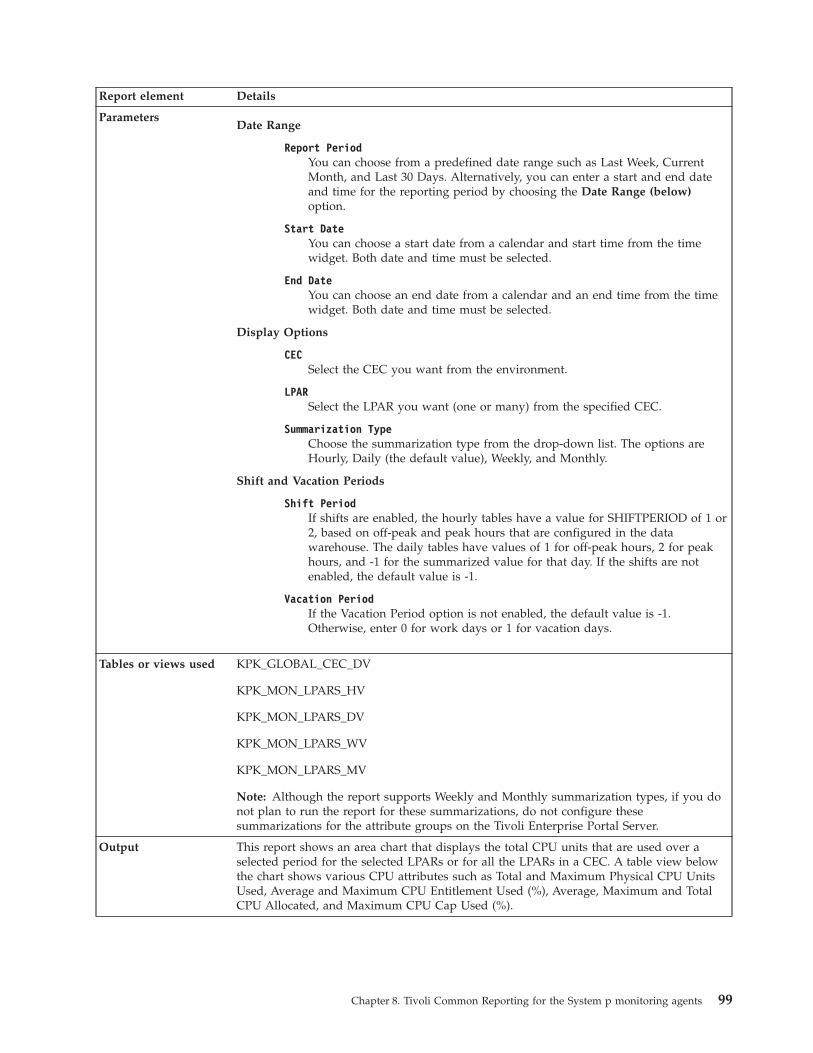
Report element Details
ParametersDate Range
Report PeriodYou can choose from a predefined date range such as Last Week, CurrentMonth, and Last 30 Days. Alternatively, you can enter a start and end dateand time for the reporting period by choosing the Date Range (below)option.
Start DateYou can choose a start date from a calendar and start time from the timewidget. Both date and time must be selected.
End DateYou can choose an end date from a calendar and an end time from the timewidget. Both date and time must be selected.
Display Options
CECSelect the CEC you want from the environment.
LPARSelect the LPAR you want (one or many) from the specified CEC.
Summarization TypeChoose the summarization type from the drop-down list. The options areHourly, Daily (the default value), Weekly, and Monthly.
Shift and Vacation Periods
Shift PeriodIf shifts are enabled, the hourly tables have a value for SHIFTPERIOD of 1 or2, based on off-peak and peak hours that are configured in the datawarehouse. The daily tables have values of 1 for off-peak hours, 2 for peakhours, and -1 for the summarized value for that day. If the shifts are notenabled, the default value is -1.
Vacation PeriodIf the Vacation Period option is not enabled, the default value is -1.Otherwise, enter 0 for work days or 1 for vacation days.
Tables or views used KPK_GLOBAL_CEC_DV
KPK_MON_LPARS_HV
KPK_MON_LPARS_DV
KPK_MON_LPARS_WV
KPK_MON_LPARS_MV
Note: Although the report supports Weekly and Monthly summarization types, if you donot plan to run the report for these summarizations, do not configure thesesummarizations for the attribute groups on the Tivoli Enterprise Portal Server.
Output This report shows an area chart that displays the total CPU units that are used over aselected period for the selected LPARs or for all the LPARs in a CEC. A table view belowthe chart shows various CPU attributes such as Total and Maximum Physical CPU UnitsUsed, Average and Maximum CPU Entitlement Used (%), Average, Maximum and TotalCPU Allocated, and Maximum CPU Cap Used (%).
Chapter 8. Tivoli Common Reporting for the System p monitoring agents 99
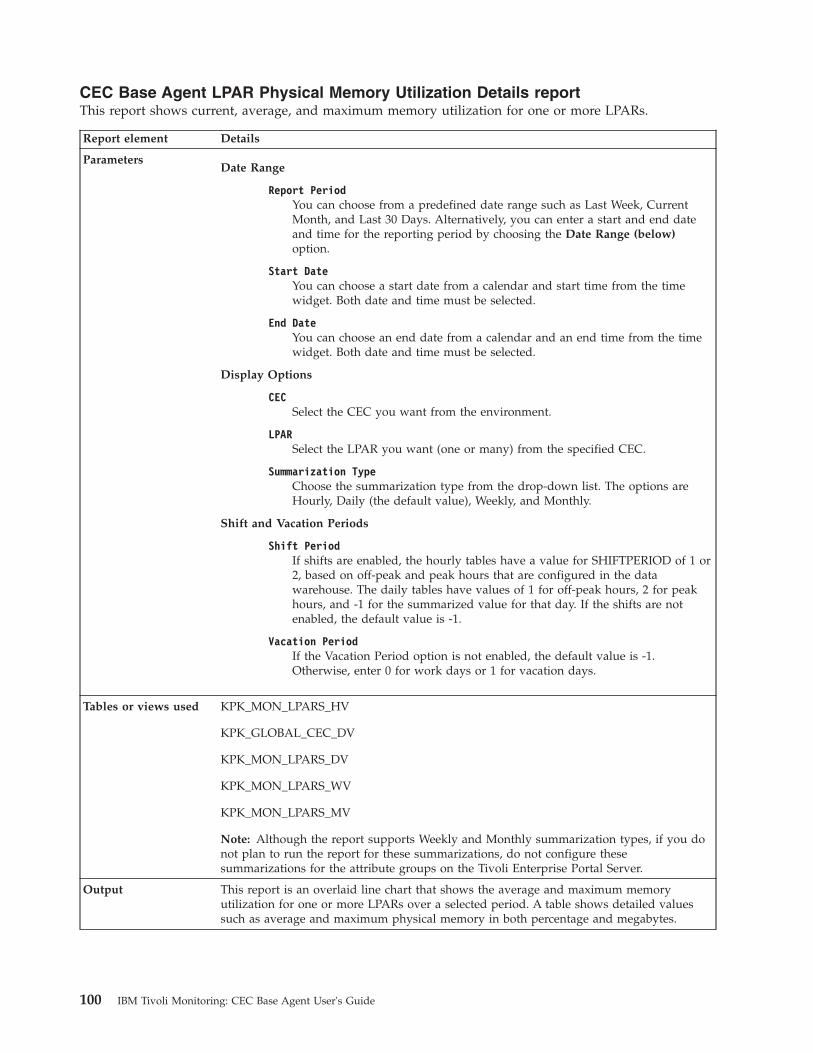
CEC Base Agent LPAR Physical Memory Utilization Details reportThis report shows current, average, and maximum memory utilization for one or more LPARs.
Report element Details
ParametersDate Range
Report PeriodYou can choose from a predefined date range such as Last Week, CurrentMonth, and Last 30 Days. Alternatively, you can enter a start and end dateand time for the reporting period by choosing the Date Range (below)option.
Start DateYou can choose a start date from a calendar and start time from the timewidget. Both date and time must be selected.
End DateYou can choose an end date from a calendar and an end time from the timewidget. Both date and time must be selected.
Display Options
CECSelect the CEC you want from the environment.
LPARSelect the LPAR you want (one or many) from the specified CEC.
Summarization TypeChoose the summarization type from the drop-down list. The options areHourly, Daily (the default value), Weekly, and Monthly.
Shift and Vacation Periods
Shift PeriodIf shifts are enabled, the hourly tables have a value for SHIFTPERIOD of 1 or2, based on off-peak and peak hours that are configured in the datawarehouse. The daily tables have values of 1 for off-peak hours, 2 for peakhours, and -1 for the summarized value for that day. If the shifts are notenabled, the default value is -1.
Vacation PeriodIf the Vacation Period option is not enabled, the default value is -1.Otherwise, enter 0 for work days or 1 for vacation days.
Tables or views used KPK_MON_LPARS_HV
KPK_GLOBAL_CEC_DV
KPK_MON_LPARS_DV
KPK_MON_LPARS_WV
KPK_MON_LPARS_MV
Note: Although the report supports Weekly and Monthly summarization types, if you donot plan to run the report for these summarizations, do not configure thesesummarizations for the attribute groups on the Tivoli Enterprise Portal Server.
Output This report is an overlaid line chart that shows the average and maximum memoryutilization for one or more LPARs over a selected period. A table shows detailed valuessuch as average and maximum physical memory in both percentage and megabytes.
100 IBM Tivoli Monitoring: CEC Base Agent User's Guide

CEC Base Agent LPAR Workload Trend and Forecast reportThis report shows a linear forecast of CPU and memory for one or more LPARs.
Report element Details
ParametersDate Range
Report PeriodYou can choose from a predefined date range such as Last Week, CurrentMonth, and Last 30 Days. Alternatively, you can enter a start and end dateand time for the reporting period by choosing the Date Range (below)option.
Forecast Period (Days)The number of days to forecast.
Display Options
Shift PeriodIf shifts are enabled, the hourly tables have a value for SHIFTPERIOD of 1 or2, based on off-peak and peak hours that are configured in the datawarehouse. The daily tables have values of 1 for off-peak hours, 2 for peakhours, and -1 for the summarized value for that day. If the shifts are notenabled, the default value is -1.
Vacation PeriodIf the Vacation Period option is not enabled, the default value is -1.Otherwise, enter 0 for work days or 1 for vacation days.
Thresholds (%)CPU and memory thresholds to compare against the forecasted values.
Tables or views used KPK_MON_LPARS_DV
KPK_GLOBAL_CEC_DV
Output This report contains line charts for CPU and memory usage and the forecasted usagevalues for the selected LPARs.
Chapter 8. Tivoli Common Reporting for the System p monitoring agents 101
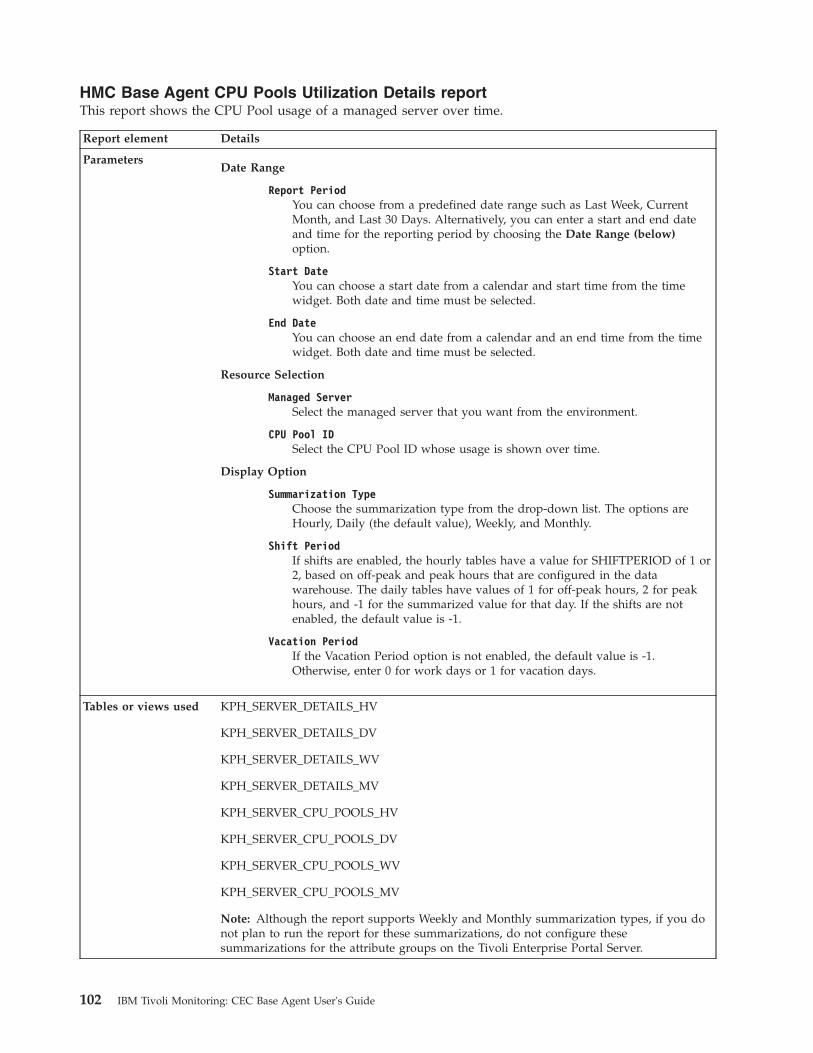
HMC Base Agent CPU Pools Utilization Details reportThis report shows the CPU Pool usage of a managed server over time.
Report element Details
ParametersDate Range
Report PeriodYou can choose from a predefined date range such as Last Week, CurrentMonth, and Last 30 Days. Alternatively, you can enter a start and end dateand time for the reporting period by choosing the Date Range (below)option.
Start DateYou can choose a start date from a calendar and start time from the timewidget. Both date and time must be selected.
End DateYou can choose an end date from a calendar and an end time from the timewidget. Both date and time must be selected.
Resource Selection
Managed ServerSelect the managed server that you want from the environment.
CPU Pool IDSelect the CPU Pool ID whose usage is shown over time.
Display Option
Summarization TypeChoose the summarization type from the drop-down list. The options areHourly, Daily (the default value), Weekly, and Monthly.
Shift PeriodIf shifts are enabled, the hourly tables have a value for SHIFTPERIOD of 1 or2, based on off-peak and peak hours that are configured in the datawarehouse. The daily tables have values of 1 for off-peak hours, 2 for peakhours, and -1 for the summarized value for that day. If the shifts are notenabled, the default value is -1.
Vacation PeriodIf the Vacation Period option is not enabled, the default value is -1.Otherwise, enter 0 for work days or 1 for vacation days.
Tables or views used KPH_SERVER_DETAILS_HV
KPH_SERVER_DETAILS_DV
KPH_SERVER_DETAILS_WV
KPH_SERVER_DETAILS_MV
KPH_SERVER_CPU_POOLS_HV
KPH_SERVER_CPU_POOLS_DV
KPH_SERVER_CPU_POOLS_WV
KPH_SERVER_CPU_POOLS_MV
Note: Although the report supports Weekly and Monthly summarization types, if you donot plan to run the report for these summarizations, do not configure thesesummarizations for the attribute groups on the Tivoli Enterprise Portal Server.
102 IBM Tivoli Monitoring: CEC Base Agent User's Guide

Report element Details
Output This report contains an area chart that shows the total CPU Units that are used by thechosen CPU Pool over a selected period. The table shows various CPU attributes such asAverage CPU Pool Units Consumed, Maximum CPU Pool Capacity, Allocated ManagedServer Capacity, and the Total Managed Server Capacity.
HMC Base Agent LPAR CPU Trend and Forecast reportThis report shows a linear forecast of CPU for one or more LPARs.
Report element Details
ParametersDate Range
Report PeriodYou can choose from a predefined date range such as Last Week, CurrentMonth, and Last 30 Days. Alternatively, you can enter a start and end dateand time for the reporting period by choosing the Date Range (below)option.
Resource Selection
Managed ServerSelect the managed server that you want from the environment
LPARsSelect one or more LPARs from the environment.
Display Options
Shift PeriodIf shifts are enabled, the hourly tables have a value for SHIFTPERIOD of 1 or2, based on off-peak and peak hours that are configured in the datawarehouse. The daily tables have values of 1 for off-peak hours, 2 for peakhours, and -1 for the summarized value for that day. If the shifts are notenabled, the default value is -1.
Vacation PeriodIf the Vacation Period option is not enabled, the default value is -1.Otherwise, enter 0 for work days or 1 for vacation days.
CPU Threshold (%)The CPU threshold to compare against the forecasted values.
Tables or views used KPH_SERVER_DETAILS_DV
KPH_SERVER_LPARS_DV
Output This report contains an area chart for CPU usage and the forecasted usage values for theselected LPARs.
HMC Base Agent LPAR Heat Chart reportThis report shows the CPU utilization pattern over a period for selected LPARs within a set of managedservers in your environment.
Chapter 8. Tivoli Common Reporting for the System p monitoring agents 103

Report element Details
ParametersResources
Managed ServersSelect one or more of the managed servers that you want from theenvironment.
LPARsSelect one of more of the LPARs that you want from the chosen list ofmanaged servers in your environment.
Date Range
Report PeriodYou can choose from a predefined date range such as Last Week, CurrentMonth, and Last 30 Days. Alternatively, you can enter a start and end dateand time for the reporting period by choosing the Date Range (below)option.
Start DateYou can choose a start date from a calendar and start time from the timewidget. Both date and time must be selected.
End DateYou can choose an end date from a calendar and an end time from the timewidget. Both date and time must be selected.
User Inputs for Analysis
Upper Limit for Good StatusSpecify the upper limit for the CPU percentage utilization value to determinethe range of values that is considered good.
Upper Limit for Fair StatusSpecify the upper limit for the CPU percentage utilization value to determinethe range of values that is considered fair.
Upper Limit for Warning StatusSpecify the upper limit for the CPU percentage utilization value to determinethe range of values that indicates a warning status.
Upper Limit for Bad Status and Lower Limit for Critical StatusSpecify the upper limit for the CPU percentage utilization value to determinethe range of values that indicates a bad status. This limit is also the lowerlimit to consider a utilization value as critical
Shift PeriodIf shifts are enabled, the hourly tables have a value for SHIFTPERIOD of 1 or2, based on off-peak and peak hours that are configured in the datawarehouse. The daily tables have values of 1 for off-peak hours, 2 for peakhours, and -1 for the summarized value for that day. If the shifts are notenabled, the default value is -1.
Vacation PeriodIf the Vacation Period option is not enabled, the default value is -1.Otherwise, enter 0 for work days or 1 for vacation days.
Tables or views used KPH_SERVER_LPARS_HV
104 IBM Tivoli Monitoring: CEC Base Agent User's Guide

Report element Details
Output This report presents a different visualization for observing patterns in hourly processorutilization. This chart is called a heat chart. In a heat chart, the X-axis shows the hoursduring the day and the Y-axis shows the dates. For each LPAR within a managed server,hourly averages for the metric are shown. This chart helps in identifying patterns, such astimes of day when the LPAR becomes busy. The chart is useful for determiningmaintenance schedules.
Different colors on the heat chart represent different percentage bands. You can modify thethreshold values for these bands.
HMC Base Agent LPAR Physical CPU Usage Details reportThis report shows the CPU usage of one or more selected LPARs from the CPU pools of a managedserver over time.
Report element Details
ParametersDate Range
Report PeriodYou can choose from a predefined date range such as Last Week, CurrentMonth, and Last 30 Days. Alternatively, you can enter a start and end dateand time for the reporting period by choosing the Date Range (below)option.
Start DateYou can choose a start date from a calendar and start time from the timewidget. Both date and time must be selected.
End DateYou can choose an end date from a calendar and an end time from the timewidget. Both date and time must be selected.
Resource Selection
Managed ServerSelect the managed server that you want from the environment.
CPU Pool(s)Select one or more CPU Pools for which usage by LPARs is shown over time
LPAR(s)Select one or more LPARs for which CPU usage is shown over time
Display Options
Summarization TypeChoose the summarization type from the drop-down list. The options areHourly, Daily (the default value), Weekly, and Monthly.
Shift PeriodIf shifts are enabled, the hourly tables have a value for SHIFTPERIOD of 1 or2, based on off-peak and peak hours that are configured in the datawarehouse. The daily tables have values of 1 for off-peak hours, 2 for peakhours, and -1 for the summarized value for that day. If the shifts are notenabled, the default value is -1.
Vacation PeriodIf the Vacation Period option is not enabled, the default value is -1.Otherwise, enter 0 for work days or 1 for vacation days.
Chapter 8. Tivoli Common Reporting for the System p monitoring agents 105
Report element Details
Tables or views used KPH_SERVER_LPARS_HV
KPH_SERVER_LPARS_DV
KPH_SERVER_LPARS_WV
KPH_SERVER_LPARS_MV
KPH_SERVER_CPU_POOLS_HV
KPH_SERVER_CPU_POOLS_DV
KPH_SERVER_CPU_POOLS_WV
KPH_SERVER_CPU_POOLS_MV
Note: Although the report supports Weekly and Monthly summarization types, if you donot plan to run the report for these summarizations, do not configure thesesummarizations for the attribute groups on the Tivoli Enterprise Portal Server.
Output This report contains a stacked area chart that shows the total CPU Units that are used bythe selected LPARs from the chosen CPU Pools over a selected period. The table containsvarious CPU attributes such as Average CPU Units Consumed by LPARs, Maximum CPUUnits Consumed by LPARs, Entitled Capacity, and the Average CPU Entitlement Used (%).
HMC Base Agent Managed Server CPU Trend and Forecast reportThis report shows a linear forecast for the CPU Utilization of the managed server.
Report element Details
ParametersDate Range
Report PeriodYou can choose from a predefined date range such as Last Week, CurrentMonth, and Last 30 Days. Alternatively, you can enter a start and end dateand time for the reporting period by choosing the Date Range (below)option.
Resource Selection
Managed ServerSelect the managed server that you want from the environment
Display Options
Shift PeriodIf shifts are enabled, the hourly tables have a value for SHIFTPERIOD of 1 or2, based on off-peak and peak hours that are configured in the datawarehouse. The daily tables have values of 1 for off-peak hours, 2 for peakhours, and -1 for the summarized value for that day. If the shifts are notenabled, the default value is -1.
Vacation PeriodIf the Vacation Period option is not enabled, the default value is -1.Otherwise, enter 0 for work days or 1 for vacation days.
CPU Threshold (%)The CPU threshold to compare against the forecasted values.
Tables or views used KPH_SERVER_DETAILS_DV
Output This report contains a line chart for managed server CPU usage and the forecasted usagevalues.
106 IBM Tivoli Monitoring: CEC Base Agent User's Guide

HMC Base Agent Managed Server Forecast Alerts reportThis report alerts you when a managed server or group of managed servers reaches its capacitylimitations. The report calculates a linear trend for the next few days, depending on the forecast periodand determines whether any of the managed servers exceed the user-defined threshold for the CPU forthe server. The threshold (%) applies to the total capacity available in the managed server.
Report element Details
ParametersDate Range
Report PeriodYou can choose from a predefined date range such as Last Week, CurrentMonth, and Last 30 Days. Alternatively, you can enter a start and end dateand time for the reporting period by choosing the Date Range (below)option.
Forecast Period (Days)The number of days to forecast.
Resource Selection
Managed ServerSelect the managed server that you want from the environment
Display Options
Shift PeriodIf shifts are enabled, the hourly tables have a value for SHIFTPERIOD of 1 or2, based on off-peak and peak hours that are configured in the datawarehouse. The daily tables have values of 1 for off-peak hours, 2 for peakhours, and -1 for the summarized value for that day. If the shifts are notenabled, the default value is -1.
Vacation PeriodIf the Vacation Period option is not enabled, the default value is -1.Otherwise, enter 0 for work days or 1 for vacation days.
CPU Threshold (%)The CPU threshold to compare against the forecasted values.
Tables or views used KPH_SERVER_DETAILS_DV
Output This report contains a table with values of Average CPU Units Used (including thehistorical average and forecasted values for the selected time period) and the total capacityagainst the chosen list of managed servers. Alerts are indicated with a green color for theCPU usage values if they fall below the threshold and a red color for the alerts that exceedthe CPU threshold (which is set to 80% by default).
HMC Base Agent Managed Server Heat Chart reportThis report shows the CPU utilization pattern over a period for selected managed servers in yourenvironment.
Chapter 8. Tivoli Common Reporting for the System p monitoring agents 107
Report element Details
ParametersDate Range
Report PeriodYou can choose from a predefined date range such as Last Week, CurrentMonth, and Last 30 Days. Alternatively, you can enter a start and end dateand time for the reporting period by choosing the Date Range (below)option.
Start DateYou can choose a start date from a calendar and start time from the timewidget. Both date and time must be selected.
End DateYou can choose an end date from a calendar and an end time from the timewidget. Both date and time must be selected.
Resources
Managed ServersSelect one or more of the managed servers that you want from theenvironment.
User Inputs for Analysis
Upper Limit for Good StatusSpecify the upper limit for the CPU percentage utilization value to determinethe range of values that is considered good.
Upper Limit for Fair StatusSpecify the upper limit for the CPU percentage utilization value to determinethe range of values that is considered fair.
Upper Limit for Warning StatusSpecify the upper limit for the CPU percentage utilization value to determinethe range of values that indicates a warning status.
Upper Limit for Bad Status and Lower Limit for Critical StatusSpecify the upper limit for the CPU percentage utilization value to determinethe range of values that indicates a bad status. This limit is also the lowerlimit to consider a utilization value as critical
Shift PeriodIf shifts are enabled, the hourly tables have a value for SHIFTPERIOD of 1 or2, based on off-peak and peak hours that are configured in the datawarehouse. The daily tables have values of 1 for off-peak hours, 2 for peakhours, and -1 for the summarized value for that day. If the shifts are notenabled, the default value is -1.
Vacation PeriodIf the Vacation Period option is not enabled, the default value is -1.Otherwise, enter 0 for work days or 1 for vacation days.
Tables or views used KPH_ SERVER _DETAILS_HV
Output This report presents a different type of visualization for observing patterns in hourlyprocessor utilization. This chart is called a heat chart. In a heat chart, the X-axis shows thehours during the day and the Y-axis shows the dates. For each managed server, hourlyaverages for the metric are shown. This chart helps in identifying patterns, such as thetimes of day when the server becomes busy. The chart is useful for determiningmaintenance schedules or observing whether the pattern of the LPAR matches the patternof its target host during LPAR placement exercises.
Different colors on the heat chart represent different percentage bands. You can modify thethreshold values for these bands.
108 IBM Tivoli Monitoring: CEC Base Agent User's Guide

HMC Base Agent Managed Server Performance Trends reportThis report shows trends for multiple performance metrics such as CPU units used and number of LPARsfor multiple managed servers in a matrix.
Report element Details
ParametersDate Range
Report PeriodYou can choose from a predefined date range such as Last Week, CurrentMonth, and Last 30 Days. Alternatively, you can enter a start and end dateand time for the reporting period by choosing the Date Range (below)option.
Start DateYou can choose a start date from a calendar and start time from the timewidget. Both date and time must be selected.
End DateYou can choose an end date from a calendar and an end time from the timewidget. Both date and time must be selected.
Resources
Managed ServerSelect the managed server that you want from the environment.
User Inputs for Analysis
Summarization TypeChoose the summarization type from the drop-down list. The options areHourly, Daily (the default value), Weekly, and Monthly.
Display OptionYou can choose to view the detailed values in a table by choosing theSummary Table option or view only the trend charts in a table by choosing theTrend Charts option. For both options, the entire table can be sorted byclicking a column.
Shift PeriodIf shifts are enabled, the hourly tables have a value for SHIFTPERIOD of 1 or2, based on off-peak and peak hours that are configured in the datawarehouse. The daily tables have values of 1 for off-peak hours, 2 for peakhours, and -1 for the summarized value for that day. If the shifts are notenabled, the default value is -1.
Vacation PeriodIf the Vacation Period option is not enabled, the default value is -1.Otherwise, enter 0 for work days or 1 for vacation days.
Chapter 8. Tivoli Common Reporting for the System p monitoring agents 109
Report element Details
Tables or views used KPH_SERVER_LPARS_HV
KPH_SERVER_LPARS_DV
KPH_SERVER_LPARS_WV
KPH_SERVER_LPARS_MV
KPH_SERVER_DETAILS_HV
KPH_SERVER_DETAILS_DV
KPH_SERVER_DETAILS_WV
KPH_SERVER_DETAILS_MV
Note: Although the report supports Weekly and Monthly summarization types, if you donot plan to run the report for these summarizations, do not configure thesesummarizations for the attribute groups on the Tivoli Enterprise Portal Server.
Output This report shows trends for multiple performance metrics for multiple managed serversin a matrix. Maximum CPU usage is plotted against the average CPU usage. Number ofLPARs that are in running state is plotted against the total number of LPARs on themanaged server. The report can be displayed in hourly, daily, weekly, and monthly format.Choose the Summary Table option while you are running the report if you want to see onlythe numbers and not the charts.
HMC Base Agent Managed Server Weekly Comparison reportThis report alerts you if the values of the key metrics for managed servers change significantly based ona weekly comparison by highlighting the corresponding field.
110 IBM Tivoli Monitoring: CEC Base Agent User's Guide
Report element Details
ParametersResources
Managed ServersSelect one or more of the managed servers that you want from theenvironment.
Date RangeYou can choose from a predefined date range such as Last Week, Current Month,and Last 30 Days. Alternatively, you can enter a start date, end date, and time forthe reporting period by choosing the one of the Date Range option.
Start DateYou can choose a start date from a calendar and start time from the timewidget. Both date and time must be selected.
End DateYou can choose an end date from a calendar and an end time from the timewidget. Both date and time must be selected.
Start Year and End Year, Start Week and End WeekIf you did not select a date range, you can choose a start and end year and astart and end week to run the report.
User Inputs for Analysis
Percent ChangeSpecify a percentage to highlight the rows when there is a significant changein values between consecutive weeks. By default, a change of 20% is used forhighlighting.
Shift PeriodIf shifts are enabled, the hourly tables have a value for SHIFTPERIOD of 1 or2, based on off-peak and peak hours that are configured in the datawarehouse. The daily tables have values of 1 for off-peak hours, 2 for peakhours, and -1 for the summarized value for that day. If the shifts are notenabled, the default value is -1.
Vacation PeriodIf the Vacation Period option is not enabled, the default value is -1.Otherwise, enter 0 for work days or 1 for vacation days.
Tables or views used KPH_SERVER_DETAILS_DV
KPH_SERVER_LPARS_DV
Output This report compares the key metrics for managed servers from week to week. If there is asignificant change in value from one week to another, that field is highlighted.
Chapter 8. Tivoli Common Reporting for the System p monitoring agents 111

VIOS Premium Agent Disk Capacity Details reportThis report shows average megabytes used and free on the disk over a selected period.
Report element Details
ParametersDate Range
Report PeriodYou can choose from a predefined date range such as Last Week, CurrentMonth, and Last 30 Days. Alternatively, you can enter a start and end dateand time for the reporting period by choosing the Date Range (below)option.
Start DateYou can choose a start date from a calendar and start time from the timewidget. Both date and time must be selected.
End DateYou can choose an end date from a calendar and an end time from the timewidget. Both date and time must be selected.
Display Options
VIOSSelect the VIOS you want from the environment.
Summarization TypeChoose the summarization type from the drop-down list. The options areHourly, Daily (the default value), Weekly, and Monthly.
Shift and Vacation Periods
Shift PeriodIf shifts are enabled, the hourly tables have a value for SHIFTPERIOD of 1 or2, based on off-peak and peak hours that are configured in the datawarehouse. The daily tables have values of 1 for off-peak hours, 2 for peakhours, and -1 for the summarized value for that day. If the shifts are notenabled, the default value is -1.
Vacation PeriodIf the Vacation Period option is not enabled, the default value is -1.Otherwise, enter 0 for work days or 1 for vacation days.
Tables or views used KVA_STORAGE_MAPPINGS_DV
KVA_VOLUME_GROUPS_DV
KVA_PHYSICAL_VOLUMES_HV
KVA_PHYSICAL_VOLUMES_WV
KVA_PHYSICAL_VOLUMES_MV
KVA_PHYSICAL_VOLUMES_DV
Note: Although the report supports Weekly and Monthly summarization types, if you donot plan to run the report for these summarizations, do not configure thesesummarizations for the attribute groups on the Tivoli Enterprise Portal Server.
Output This report shows a stacked area chart for each disk in the VIOS. The lower area of thechart shows the average megabytes used on the disk over a selected period. The upperarea shows average free megabytes on the disk over the selected period. A table showsdetailed values for all disks.
112 IBM Tivoli Monitoring: CEC Base Agent User's Guide

VIOS Premium Agent Physical Fibre Channel Adapter Utilization reportThe report shows the average bandwidth utilization details for each fibre channel adapter port over thespecified time period.
Report element Details
ParametersDate Range
Report PeriodYou can choose from a predefined date range such as Last Week, CurrentMonth, and Last 30 Days. Alternatively, you can enter a start and end dateand time for the reporting period by choosing the Date Range (below)option.
Start DateYou can choose a start date from a calendar and start time from the timewidget. Both date and time must be selected.
End DateYou can choose an end date from a calendar and an end time from the timewidget. Both date and time must be selected.
Display Options
Shift PeriodIf shifts are enabled, the hourly tables have a value for SHIFTPERIOD of 1 or2, based on off-peak and peak hours that are configured in the datawarehouse. The daily tables have values of 1 for off-peak hours, 2 for peakhours, and -1 for the summarized value for that day. If the shifts are notenabled, the default value is -1.
Vacation PeriodIf the Vacation Period option is not enabled, the default value is -1.Otherwise, enter 0 for work days or 1 for vacation days.
AggregationSelect the aggregation type that is used to aggregate the data over time. Youcan choose Maximum or Average.
Tables or views used KVA_FC_STATS_DV
Output The report displays the average bandwidth utilization details for each fibre channeladapter port over the specified time period. The table shows different metrics that arerelated to the bandwidth used by each fibre channel adapter port.
VIOS Premium Agent Shared Ethernet Adapter Utilization reportThis report shows average used megabytes and average free megabytes over the selected period of timefor the disk.
Chapter 8. Tivoli Common Reporting for the System p monitoring agents 113
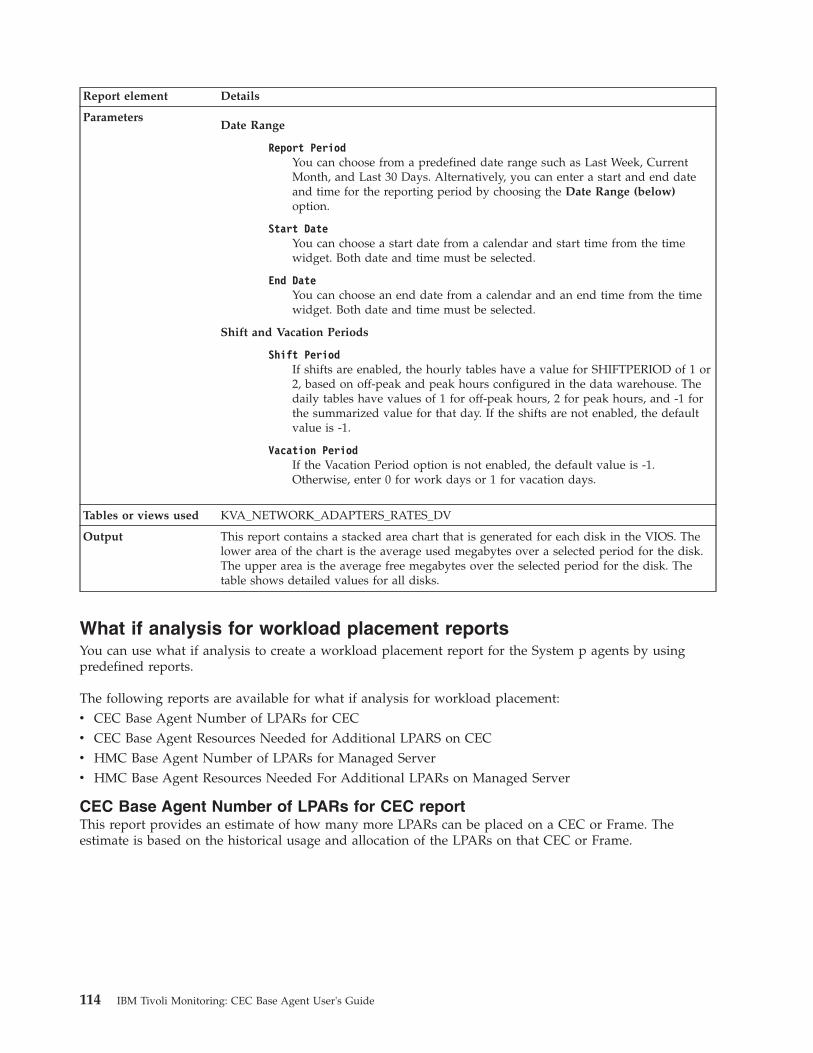
Report element Details
ParametersDate Range
Report PeriodYou can choose from a predefined date range such as Last Week, CurrentMonth, and Last 30 Days. Alternatively, you can enter a start and end dateand time for the reporting period by choosing the Date Range (below)option.
Start DateYou can choose a start date from a calendar and start time from the timewidget. Both date and time must be selected.
End DateYou can choose an end date from a calendar and an end time from the timewidget. Both date and time must be selected.
Shift and Vacation Periods
Shift PeriodIf shifts are enabled, the hourly tables have a value for SHIFTPERIOD of 1 or2, based on off-peak and peak hours configured in the data warehouse. Thedaily tables have values of 1 for off-peak hours, 2 for peak hours, and -1 forthe summarized value for that day. If the shifts are not enabled, the defaultvalue is -1.
Vacation PeriodIf the Vacation Period option is not enabled, the default value is -1.Otherwise, enter 0 for work days or 1 for vacation days.
Tables or views used KVA_NETWORK_ADAPTERS_RATES_DV
Output This report contains a stacked area chart that is generated for each disk in the VIOS. Thelower area of the chart is the average used megabytes over a selected period for the disk.The upper area is the average free megabytes over the selected period for the disk. Thetable shows detailed values for all disks.
What if analysis for workload placement reportsYou can use what if analysis to create a workload placement report for the System p agents by usingpredefined reports.
The following reports are available for what if analysis for workload placement:v CEC Base Agent Number of LPARs for CECv CEC Base Agent Resources Needed for Additional LPARS on CECv HMC Base Agent Number of LPARs for Managed Serverv HMC Base Agent Resources Needed For Additional LPARs on Managed Server
CEC Base Agent Number of LPARs for CEC reportThis report provides an estimate of how many more LPARs can be placed on a CEC or Frame. Theestimate is based on the historical usage and allocation of the LPARs on that CEC or Frame.
114 IBM Tivoli Monitoring: CEC Base Agent User's Guide

Report element Details
ParametersDate Range
Report PeriodYou can choose from a predefined date range such as Last Week, CurrentMonth, and Last 30 Days. Alternatively, you can enter a start and end dateand time for the reporting period by choosing the Date Range (below)option.
Start DateYou can choose a start date from a calendar and start time from the timewidget. Both date and time must be selected.
End DateYou can choose an end date from a calendar and an end time from the timewidget. Both date and time must be selected.
Display Options
CECSelect the CEC you want from the environment.
ProfileSelect the profile that you want to run the report against. The options areAverage (default), Peak, and User-defined.
Resource criteriaReports can be seen based on two different criteria: Resource Usage (default)or Resource Allocation.
BufferThe buffer is to indicate the resources that the user does not want to allocate.
User-defined Resource UsageEnter user-defined values to be used alongside the User-defined profile.
Shift and Vacation Periods
Shift PeriodIf shifts are enabled, the hourly tables have a value for SHIFTPERIOD of 1 or2, based on off-peak and peak hours that are configured in the datawarehouse. The daily tables have values of 1 for off-peak hours, 2 for peakhours, and -1 for the summarized value for that day. If the shifts are notenabled, the default value is -1.
Vacation PeriodIf the Vacation Period option is not enabled, the default value is -1.Otherwise, enter 0 for work days or 1 for vacation days.
Tables or views used KPK_GLOBAL_CEC_DV
KPK_GLOBAL_CEC_HV
KPK_MON_LPARS_DV
KPK_MON_UNMON_ALLOC_HV
KPK_MON UNMON_ALLOC_DV
Chapter 8. Tivoli Common Reporting for the System p monitoring agents 115

Report element Details
Output This report contains a table that shows the number of LPARs that can be added to a CEC,based on the resource usage or allocation (defined by the user) of the monitored LPARsand the available resource capacity on the CEC after allowing for user-defined buffers. Thetable shows information that is related to different resources (CPU and memory) on theselected CEC and how these resources affect the total number of LPARs that can be added.The average resources that are allocated or used is the historical average of all thedeployed LPARs on the CEC. The available resource capacity is the current resources notallocated. The number of LPARs that can be deployed is the Available ResourceCapacity/Average Resource Usage per LPAR.
CEC Base Agent Resources Needed for Additional LPARS on CEC reportThis report provides an estimate of how much more resources (CPU and memory) are needed to addmore LPARs to the CEC or Frame.
Report element Details
ParametersDate Range
Report PeriodYou can choose from a predefined date range such as Last Week, CurrentMonth, and Last 30 Days. Alternatively, you can enter a start and end dateand time for the reporting period by choosing the Date Range (below)option.
Start DateYou can choose a start date from a calendar and start time from the timewidget. Both date and time must be selected.
End DateYou can choose an end date from a calendar and an end time from the timewidget. Both date and time must be selected.
Display Options
CECSelect the CEC you want from the environment.
ProfileSelect the profile that you want to run the report against. The options areAverage (default), Peak, and User-defined.
Number of LPARs to addThe numbers of LPARs you want to add to the selected CEC.
BufferThe buffer is to indicate the resources that the user does not want to allocate.
User-defined Resource UsageEnter user-defined values to be used alongside the User-defined profile.
Shift and Vacation Periods
Shift PeriodIf shifts are enabled, the hourly tables have a value for SHIFTPERIOD of 1 or2, based on off-peak and peak hours that are configured in the datawarehouse. The daily tables have values of 1 for off-peak hours, 2 for peakhours, and -1 for the summarized value for that day. If the shifts are notenabled, the default value is -1.
Vacation PeriodIf the Vacation Period option is not enabled, the default value is -1.Otherwise, enter 0 for work days or 1 for vacation days.
116 IBM Tivoli Monitoring: CEC Base Agent User's Guide
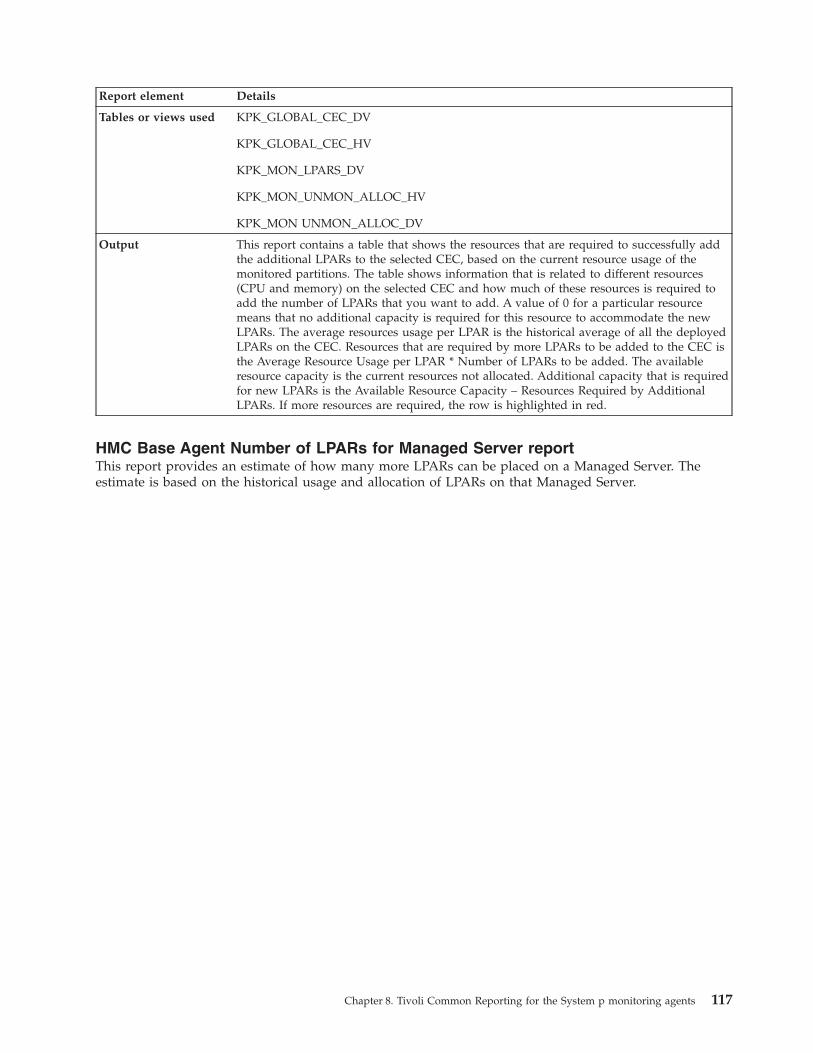
Report element Details
Tables or views used KPK_GLOBAL_CEC_DV
KPK_GLOBAL_CEC_HV
KPK_MON_LPARS_DV
KPK_MON_UNMON_ALLOC_HV
KPK_MON UNMON_ALLOC_DV
Output This report contains a table that shows the resources that are required to successfully addthe additional LPARs to the selected CEC, based on the current resource usage of themonitored partitions. The table shows information that is related to different resources(CPU and memory) on the selected CEC and how much of these resources is required toadd the number of LPARs that you want to add. A value of 0 for a particular resourcemeans that no additional capacity is required for this resource to accommodate the newLPARs. The average resources usage per LPAR is the historical average of all the deployedLPARs on the CEC. Resources that are required by more LPARs to be added to the CEC isthe Average Resource Usage per LPAR * Number of LPARs to be added. The availableresource capacity is the current resources not allocated. Additional capacity that is requiredfor new LPARs is the Available Resource Capacity – Resources Required by AdditionalLPARs. If more resources are required, the row is highlighted in red.
HMC Base Agent Number of LPARs for Managed Server reportThis report provides an estimate of how many more LPARs can be placed on a Managed Server. Theestimate is based on the historical usage and allocation of LPARs on that Managed Server.
Chapter 8. Tivoli Common Reporting for the System p monitoring agents 117

Report element Details
ParametersDate Range
Report PeriodYou can choose from a predefined date range such as Last Week, CurrentMonth, and Last 30 Days. Alternatively, you can enter a start and end dateand time for the reporting period by choosing the Date Range (below)option.
Start DateYou can choose a start date from a calendar and start time from the timewidget. Both date and time must be selected.
End DateYou can choose an end date from a calendar and an end time from the timewidget. Both date and time must be selected.
Resource Selection
Managed ServerSelect the managed server that you want from the environment.
User Inputs for Analysis
ProfileSelect the profile that you want to run the report against. The options areAverage (default), Peak, and User-defined.
Resource CriteriaReports can be run based on two different criteria: Resource Usage (default)or Resource Allocation. This criterion is not applicable to a user-definedprofile.
BufferThe buffer indicates the CPU that the user does not want to allocate.
User-defined CPU Usage per LPAREnter user-defined values in CPU units to be used with the User-definedprofile. This input is used only for the user-defined profile.
Display Options
Shift PeriodIf shifts are enabled, the hourly tables have a value for SHIFTPERIOD of 1 or2, based on off-peak and peak hours that are configured in the datawarehouse. The daily tables have values of 1 for off-peak hours, 2 for peakhours, and -1 for the summarized value for that day. If the shifts are notenabled, the default value is -1.
Vacation PeriodIf the Vacation Period option is not enabled, the default value is -1.Otherwise, enter 0 for work days or 1 for vacation days.
Peak Hours - Start and EndSelect the start and end values for the peak hour to calculate the usage onlyfor those hours while the report is running. This filter is not applicable forthe user-defined profile.
Tables or views used KPH_SERVER_DETAILS_HV
KPH_SERVER_DETAILS_DV
118 IBM Tivoli Monitoring: CEC Base Agent User's Guide

Report element Details
Output This report contains a table to indicate the number of additional LPARs that can be placedon a managed server. The number is based on the average, peak, user-defined historicalusage of CPU on active partitions and other user inputs. Available CPU capacity is thecurrent capacity the Managed Server is ready to use after considering any buffer that isdefined by the user. A value of 999,999,999 for the number of LPARs indicates that no limitexists for the number of LPARs that can be added to the Managed Server. This value isdisplayed if Average CPU Units Used per LPAR is 0.
HMC Base Agent Resources Needed For Additional LPARs on Managed ServerreportThis report provides an estimate of how much more CPU is required to add more LPARs to the managedserver.
Chapter 8. Tivoli Common Reporting for the System p monitoring agents 119

Report element Details
ParametersDate Range
Report PeriodYou can choose from a predefined date range such as Last Week, CurrentMonth, and Last 30 Days. Alternatively, you can enter a start and end dateand time for the reporting period by choosing the Date Range (below)option.
Start DateYou can choose a start date from a calendar and start time from the timewidget. Both date and time must be selected.
End DateYou can choose an end date from a calendar and an end time from the timewidget. Both date and time must be selected.
Resource Selection
Managed ServerSelect the managed server that you want from the environment.
User Inputs for Analysis
ProfileSelect the profile that you want to run the report against. The options areAverage (default), Peak, and User-defined.
Number of LPARs to add to Managed ServerThe number of LPARs you want to add to the selected managed server.
BufferThe buffer indicates the CPU that the user does not want to allocate.
User-defined CPU Usage per LPAREnter user-defined values in CPU units to be used with the User-definedprofile. This input is used only for the user-defined profile.
Display Options
Shift PeriodIf shifts are enabled, the hourly tables have a value for SHIFTPERIOD of 1 or2, based on off-peak and peak hours configured in the data warehouse. Thedaily tables have values of 1 for off-peak hours, 2 for peak hours, and -1 forthe summarized value for that day. If the shifts are not enabled, the defaultvalue is -1.
Vacation PeriodIf the Vacation Period option is not enabled, the default value is -1.Otherwise, enter 0 for work days or 1 for vacation days.
Peak Hours - Start and EndSelect the start and end values for the peak hour to calculate the usage onlyfor those hours while the report is running. This filter is not applicable forthe user-defined profile.
Tables or views used KPH_SERVER_DETAILS_HV
KPH_SERVER_DETAILS_DV
120 IBM Tivoli Monitoring: CEC Base Agent User's Guide
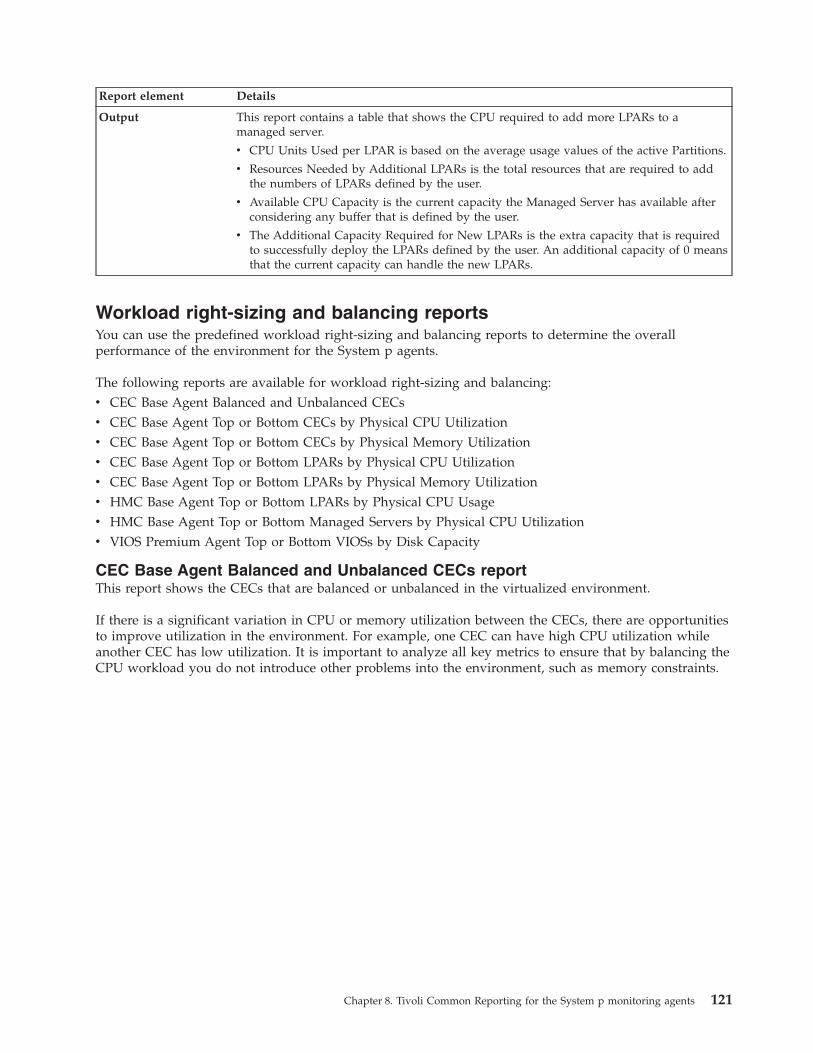
Report element Details
Output This report contains a table that shows the CPU required to add more LPARs to amanaged server.
v CPU Units Used per LPAR is based on the average usage values of the active Partitions.
v Resources Needed by Additional LPARs is the total resources that are required to addthe numbers of LPARs defined by the user.
v Available CPU Capacity is the current capacity the Managed Server has available afterconsidering any buffer that is defined by the user.
v The Additional Capacity Required for New LPARs is the extra capacity that is requiredto successfully deploy the LPARs defined by the user. An additional capacity of 0 meansthat the current capacity can handle the new LPARs.
Workload right-sizing and balancing reportsYou can use the predefined workload right-sizing and balancing reports to determine the overallperformance of the environment for the System p agents.
The following reports are available for workload right-sizing and balancing:v CEC Base Agent Balanced and Unbalanced CECsv CEC Base Agent Top or Bottom CECs by Physical CPU Utilizationv CEC Base Agent Top or Bottom CECs by Physical Memory Utilizationv CEC Base Agent Top or Bottom LPARs by Physical CPU Utilizationv CEC Base Agent Top or Bottom LPARs by Physical Memory Utilizationv HMC Base Agent Top or Bottom LPARs by Physical CPU Usagev HMC Base Agent Top or Bottom Managed Servers by Physical CPU Utilizationv VIOS Premium Agent Top or Bottom VIOSs by Disk Capacity
CEC Base Agent Balanced and Unbalanced CECs reportThis report shows the CECs that are balanced or unbalanced in the virtualized environment.
If there is a significant variation in CPU or memory utilization between the CECs, there are opportunitiesto improve utilization in the environment. For example, one CEC can have high CPU utilization whileanother CEC has low utilization. It is important to analyze all key metrics to ensure that by balancing theCPU workload you do not introduce other problems into the environment, such as memory constraints.
Chapter 8. Tivoli Common Reporting for the System p monitoring agents 121

Report element Details
ParametersResources
CECsSelect one or more CECs from the environment.
Date Range
Report PeriodYou can choose from a predefined date range such as Last Week, CurrentMonth, and Last 30 Days. Alternatively, you can enter a start and end dateand time for the reporting period by choosing the Date Range (below)option.
Start DateYou can choose a start date from a calendar and start time from the timewidget. Both date and time must be selected.
End DateYou can choose an end date from a calendar and an end time from the timewidget. Both date and time must be selected.
Display Options
MetricSelect the metric you want to see in the report. The options are CPU,Memory, or both.
Tables or views used KPK_GLOBAL_CEC_DV
KPK_MON_UNMON_ALLOC_DV
Output There are three reference lines to determine how balanced the CEC is.
v One line is the Mean, which is the average of all CECs in the environment.
v The second line is the Statistical Maximum, which is determined by the followingexpression: 75th percentile value + 1.5 * (75th percentile value - 25th percentile value).For example, if 2.5 is the 25th percentile and 7.5 is the 75th percentile, the statisticalmaximum is 15 [7.5 +1.5(5) = 15]. Statistical Maximum uses percentiles to determinevalues and might not always be displayed in the chart if the values are off the axis.
v The third line is the Statistical Minimum, which is determined by the followingexpression: 25th percentile value - 1.5 * (75th percentile value - 25th percentile value).For example, if 2.5 is the 25th percentile and 7.5 is the 75th percentile, the statisticalminimum is -5 [2.5 -1.5(5) = -5]. Statistical Minimum uses percentiles to determinevalues and might not always be displayed in the chart if the values are off the axis.
CEC Base Agent Top or Bottom CECs by Physical CPU Utilization reportThis report shows average CPU Utilization for all CECs in the environment during the report period,with bar charts that show the top and bottom n CECs based on CPU utilization.
122 IBM Tivoli Monitoring: CEC Base Agent User's Guide
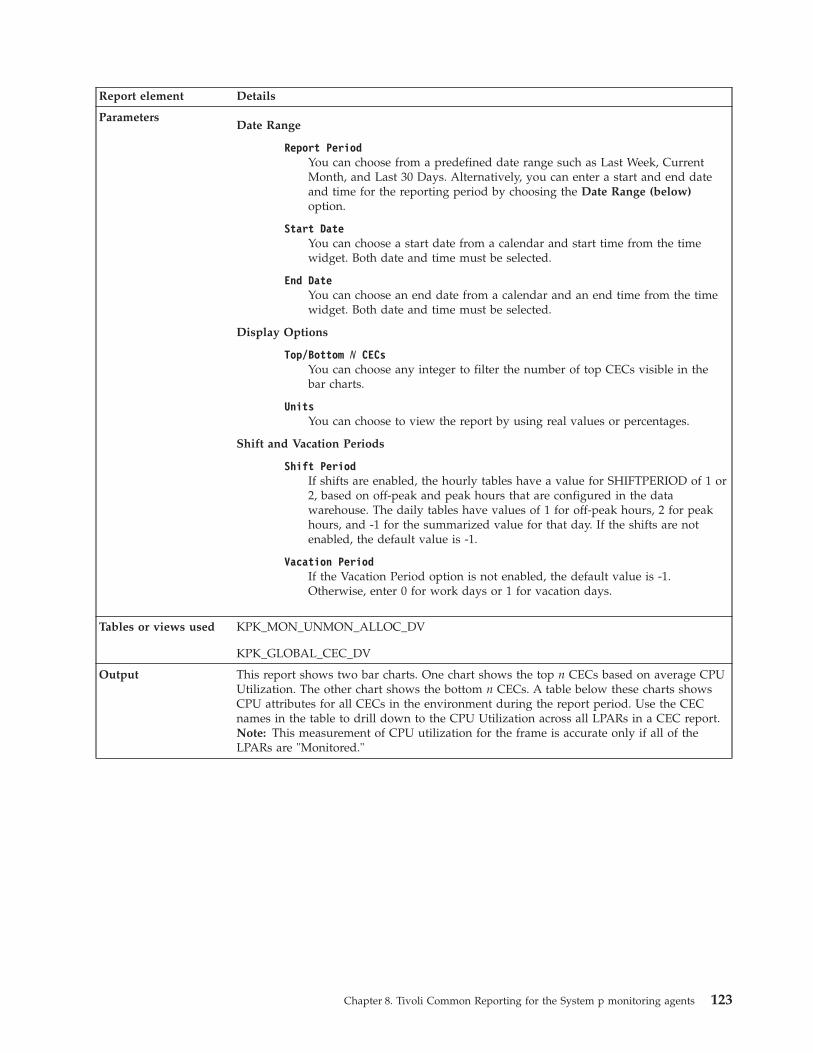
Report element Details
ParametersDate Range
Report PeriodYou can choose from a predefined date range such as Last Week, CurrentMonth, and Last 30 Days. Alternatively, you can enter a start and end dateand time for the reporting period by choosing the Date Range (below)option.
Start DateYou can choose a start date from a calendar and start time from the timewidget. Both date and time must be selected.
End DateYou can choose an end date from a calendar and an end time from the timewidget. Both date and time must be selected.
Display Options
Top/Bottom N CECsYou can choose any integer to filter the number of top CECs visible in thebar charts.
UnitsYou can choose to view the report by using real values or percentages.
Shift and Vacation Periods
Shift PeriodIf shifts are enabled, the hourly tables have a value for SHIFTPERIOD of 1 or2, based on off-peak and peak hours that are configured in the datawarehouse. The daily tables have values of 1 for off-peak hours, 2 for peakhours, and -1 for the summarized value for that day. If the shifts are notenabled, the default value is -1.
Vacation PeriodIf the Vacation Period option is not enabled, the default value is -1.Otherwise, enter 0 for work days or 1 for vacation days.
Tables or views used KPK_MON_UNMON_ALLOC_DV
KPK_GLOBAL_CEC_DV
Output This report shows two bar charts. One chart shows the top n CECs based on average CPUUtilization. The other chart shows the bottom n CECs. A table below these charts showsCPU attributes for all CECs in the environment during the report period. Use the CECnames in the table to drill down to the CPU Utilization across all LPARs in a CEC report.Note: This measurement of CPU utilization for the frame is accurate only if all of theLPARs are "Monitored."
Chapter 8. Tivoli Common Reporting for the System p monitoring agents 123

CEC Base Agent Top or Bottom CECs by Physical Memory Utilization reportThis report shows average and maximum memory usage over a specified period for the selected LPARs.
Report element Details
ParametersDate Range
Report PeriodYou can choose from a predefined date range such as Last Week, CurrentMonth, and Last 30 Days. Alternatively, you can enter a start and end dateand time for the reporting period by choosing the Date Range (below)option.
Start DateYou can choose a start date from a calendar and start time from the timewidget. Both date and time must be selected.
End DateYou can choose an end date from a calendar and an end time from the timewidget. Both date and time must be selected.
Display Options
Top/Bottom N CECsYou can choose any integer to filter the number of top or bottom CECsvisible in the bar charts.
UnitsYou can choose to view the report by using real values or percentages.
Shift and Vacation Periods
Shift PeriodIf shifts are enabled, the hourly tables have a value for SHIFTPERIOD of 1 or2, based on off-peak and peak hours that are configured in the datawarehouse. The daily tables have values of 1 for off-peak hours, 2 for peakhours, and -1 for the summarized value for that day. If the shifts are notenabled, the default value is -1.
Vacation PeriodIf the Vacation Period option is not enabled, the default value is -1.Otherwise, enter 0 for work days or 1 for vacation days.
Tables or views used KPK_GLOBAL_CEC_DV
KPK_MON_UNMON_ALLOC_DV
Output This report shows two bar charts. One chart shows the top n CECs based on averageMemory Utilization; the other chart shows the bottom n CECs. A table below these chartsshows memory attributes such as Average and Maximum Allocated Memory Used in MBand % for all CECs. For each CEC agent in the table, you can drill through to the MemoryUtilization across all LPARs in a CEC report.
124 IBM Tivoli Monitoring: CEC Base Agent User's Guide

CEC Base Agent Top or Bottom LPARs by Physical CPU Utilization reportThis report shows CPU Utilization for all LPARs in the environment.
Report element Details
ParametersDate Range
Report PeriodYou can choose from a predefined date range such as Last Week, CurrentMonth, and Last 30 Days. Alternatively, you can enter a start and end dateand time for the reporting period by choosing the Date Range (below)option.
Start DateYou can choose a start date from a calendar and start time from the timewidget. Both date and time must be selected.
End DateYou can choose an end date from a calendar and an end time from the timewidget. Both date and time must be selected.
Display Options
CECSelect the CEC you want from the environment or select % to view the topand bottom LPARs from all CECs in the environment.
Top/Bottom N LPARsYou can choose any integer to filter the number of top or bottom LPARsvisible in the bar charts.
UnitsYou can choose to view the report by using real values or percentages.
Shift and Vacation Periods
Shift PeriodIf shifts are enabled, the hourly tables have a value for SHIFTPERIOD of 1 or2, based on off-peak and peak hours that are configured in the datawarehouse. The daily tables have values of 1 for off-peak hours, 2 for peakhours, and -1 for the summarized value for that day. If the shifts are notenabled, the default value is -1.
Vacation PeriodIf the Vacation Period option is not enabled, the default value is -1.Otherwise, enter 0 for work days or 1 for vacation days.
Tables or views used KPK_MON_LPARS_DV
KPK_GLOBAL_CEC_DV
Output This report shows two bar charts. One bar shows the top n LPARs based on average CPUUtilization; the other bar shows the bottom n LPARs for the selected CEC. A table belowthese charts shows various CPU attributes for all LPARs in the environment, such as Totaland Maximum Physical CPU that is used, Average LPAR CPU Utilization (%), Total CPUUnits Allocated, and Average Physical CPU Entitlement (%). Use the LPAR names in thetable to drill down to the CPU Utilization over time for that LPAR.
CEC Base Agent Top or Bottom LPARs by Physical Memory Utilization reportThis report shows average and maximum memory utilization and physical memory that is allocated inmegabytes for all LPARs in the environment.
Chapter 8. Tivoli Common Reporting for the System p monitoring agents 125

Report element Details
ParametersDate Range
Report PeriodYou can choose from a predefined date range such as Last Week, CurrentMonth, and Last 30 Days. Alternatively, you can enter a start and end dateand time for the reporting period by choosing the Date Range (below)option.
Start DateYou can choose a start date from a calendar and start time from the timewidget. Both date and time must be selected.
End DateYou can choose an end date from a calendar and an end time from the timewidget. Both date and time must be selected.
Display Options
CECSelect the CEC you want from the environment or select % to view the topand bottom LPARs from all CECs in the environment.
Top/Bottom N LPARsYou can choose any integer to filter the number of top or bottom LPARsvisible in the bar charts.
UnitsYou can choose to view the report by using real values or percentages.
Shift and Vacation Periods
Shift PeriodIf shifts are enabled, the hourly tables have a value for SHIFTPERIOD of 1 or2, based on off-peak and peak hours that are configured in the datawarehouse. The daily tables have values of 1 for off-peak hours, 2 for peakhours, and -1 for the summarized value for that day. If the shifts are notenabled, the default value is -1.
Vacation PeriodIf the Vacation Period option is not enabled, the default value is -1.Otherwise, enter 0 for work days or 1 for vacation days.
Tables or views used KPK_MON_LPARS_DV
KPK_GLOBAL_CEC_DV
Output This report shows two bar charts. One chart shows the top n LPARs based on averagememory utilization, and the other chart shows the bottom n LPARs. A table below thesecharts shows various memory attributes for all LPARs in the environment. Use the LPARnames in the table to drill down to the Memory Utilization over time report for that LPAR.
126 IBM Tivoli Monitoring: CEC Base Agent User's Guide

HMC Base Agent Top or Bottom LPARs by Physical CPU Usage reportThis report shows the top or bottom LPARs in the environment by Physical CPU Utilization.
Report element Details
ParametersDate Range
Report PeriodYou can choose from a predefined date range such as Last Week, CurrentMonth, and Last 30 Days. Alternatively, you can enter a start and end dateand time for the reporting period by choosing the Date Range (below)option.
Start DateYou can choose a start date from a calendar and start time from the timewidget. Both date and time must be selected.
End DateYou can choose an end date from a calendar and an end time from the timewidget. Both date and time must be selected.
Resource Selection
Managed ServerSelect the managed server that you want from the environment.
Display Options
Top/Bottom N LPARsYou can choose any integer to filter the number of top or bottom LPARsvisible in the bar charts.
Shift and Vacation Periods
Shift PeriodIf shifts are enabled, the hourly tables have a value for SHIFTPERIOD of 1 or2, based on off-peak and peak hours that are configured in the datawarehouse. The daily tables have values of 1 for off-peak hours, 2 for peakhours, and -1 for the summarized value for that day. If the shifts are notenabled, the default value is -1.
Vacation PeriodIf the Vacation Period option is not enabled, the default value is -1.Otherwise, enter 0 for work days or 1 for vacation days.
Tables or views used KPH_SERVER_LPARS_DV
Output This report shows two bar charts. One bar shows the top n LPARs based on average CPUUtilization; the other shows the bottom n LPARs for the selected Managed Server. A tablebelow these charts shows various CPU attributes for all LPARs in the environment, suchas Average Physical CPU Units used and Average Physical CPU Entitlement.
Chapter 8. Tivoli Common Reporting for the System p monitoring agents 127
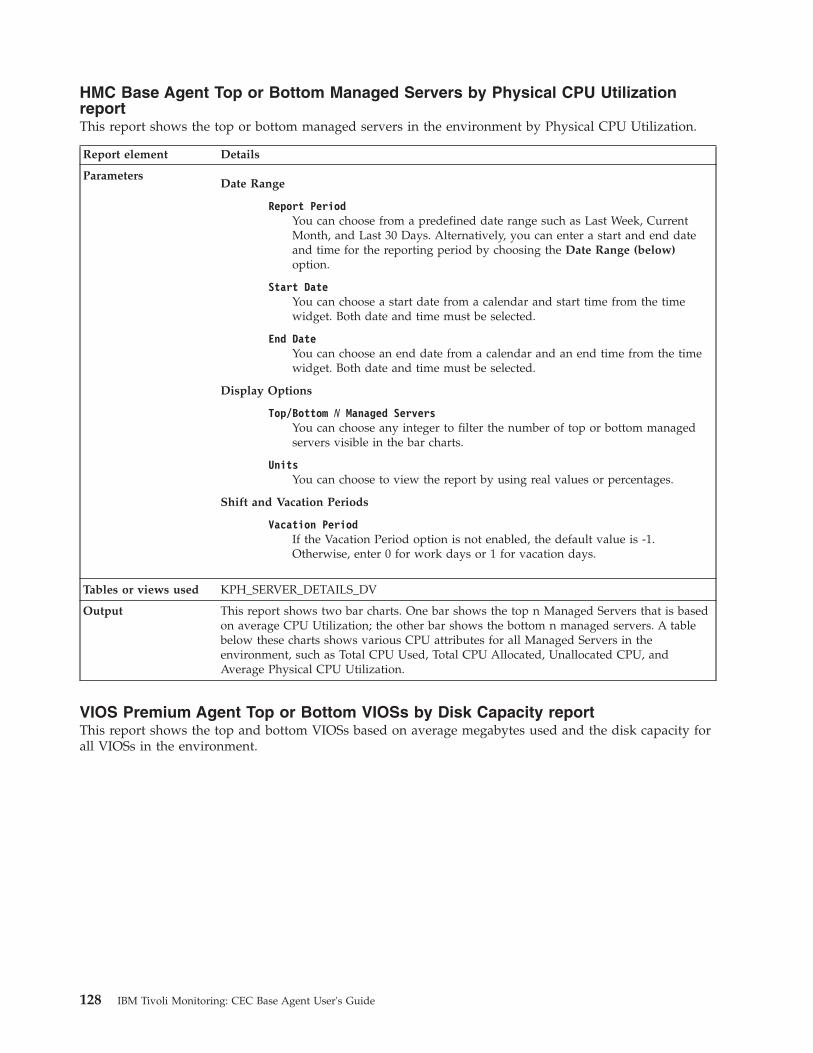
HMC Base Agent Top or Bottom Managed Servers by Physical CPU UtilizationreportThis report shows the top or bottom managed servers in the environment by Physical CPU Utilization.
Report element Details
ParametersDate Range
Report PeriodYou can choose from a predefined date range such as Last Week, CurrentMonth, and Last 30 Days. Alternatively, you can enter a start and end dateand time for the reporting period by choosing the Date Range (below)option.
Start DateYou can choose a start date from a calendar and start time from the timewidget. Both date and time must be selected.
End DateYou can choose an end date from a calendar and an end time from the timewidget. Both date and time must be selected.
Display Options
Top/Bottom N Managed ServersYou can choose any integer to filter the number of top or bottom managedservers visible in the bar charts.
UnitsYou can choose to view the report by using real values or percentages.
Shift and Vacation Periods
Vacation PeriodIf the Vacation Period option is not enabled, the default value is -1.Otherwise, enter 0 for work days or 1 for vacation days.
Tables or views used KPH_SERVER_DETAILS_DV
Output This report shows two bar charts. One bar shows the top n Managed Servers that is basedon average CPU Utilization; the other bar shows the bottom n managed servers. A tablebelow these charts shows various CPU attributes for all Managed Servers in theenvironment, such as Total CPU Used, Total CPU Allocated, Unallocated CPU, andAverage Physical CPU Utilization.
VIOS Premium Agent Top or Bottom VIOSs by Disk Capacity reportThis report shows the top and bottom VIOSs based on average megabytes used and the disk capacity forall VIOSs in the environment.
128 IBM Tivoli Monitoring: CEC Base Agent User's Guide
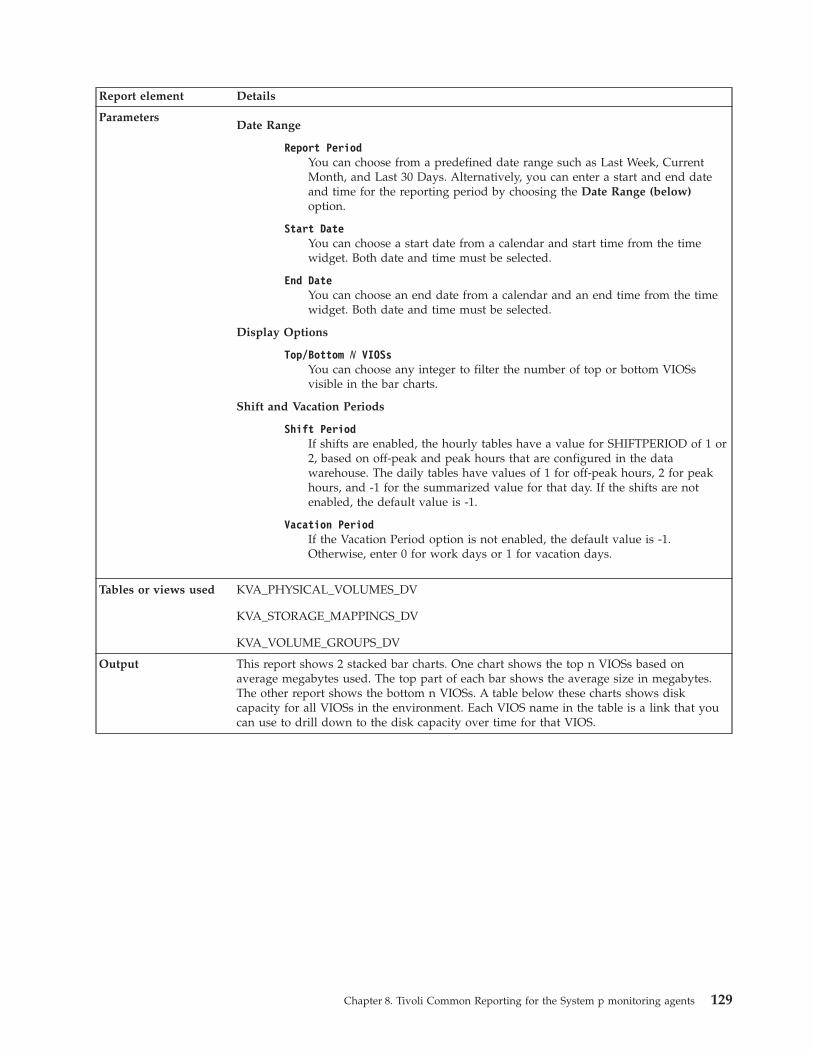
Report element Details
ParametersDate Range
Report PeriodYou can choose from a predefined date range such as Last Week, CurrentMonth, and Last 30 Days. Alternatively, you can enter a start and end dateand time for the reporting period by choosing the Date Range (below)option.
Start DateYou can choose a start date from a calendar and start time from the timewidget. Both date and time must be selected.
End DateYou can choose an end date from a calendar and an end time from the timewidget. Both date and time must be selected.
Display Options
Top/Bottom N VIOSsYou can choose any integer to filter the number of top or bottom VIOSsvisible in the bar charts.
Shift and Vacation Periods
Shift PeriodIf shifts are enabled, the hourly tables have a value for SHIFTPERIOD of 1 or2, based on off-peak and peak hours that are configured in the datawarehouse. The daily tables have values of 1 for off-peak hours, 2 for peakhours, and -1 for the summarized value for that day. If the shifts are notenabled, the default value is -1.
Vacation PeriodIf the Vacation Period option is not enabled, the default value is -1.Otherwise, enter 0 for work days or 1 for vacation days.
Tables or views used KVA_PHYSICAL_VOLUMES_DV
KVA_STORAGE_MAPPINGS_DV
KVA_VOLUME_GROUPS_DV
Output This report shows 2 stacked bar charts. One chart shows the top n VIOSs based onaverage megabytes used. The top part of each bar shows the average size in megabytes.The other report shows the bottom n VIOSs. A table below these charts shows diskcapacity for all VIOSs in the environment. Each VIOS name in the table is a link that youcan use to drill down to the disk capacity over time for that VIOS.
Chapter 8. Tivoli Common Reporting for the System p monitoring agents 129

130 IBM Tivoli Monitoring: CEC Base Agent User's Guide
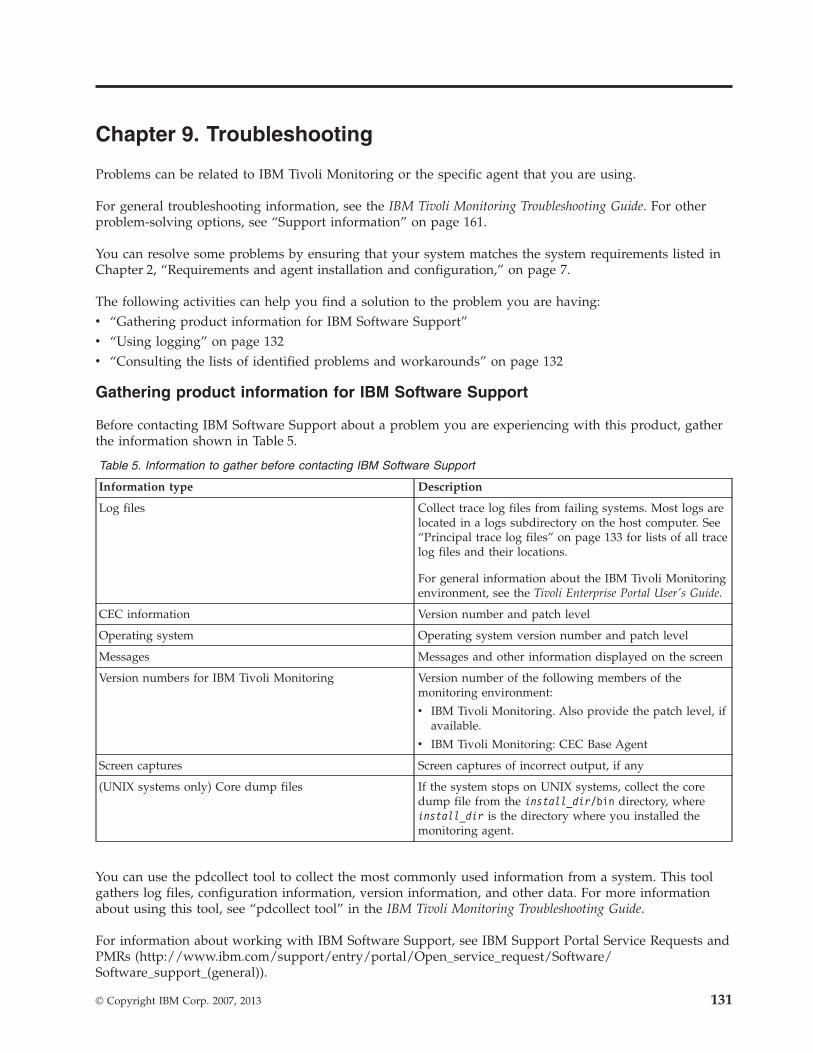
Chapter 9. Troubleshooting
Problems can be related to IBM Tivoli Monitoring or the specific agent that you are using.
For general troubleshooting information, see the IBM Tivoli Monitoring Troubleshooting Guide. For otherproblem-solving options, see “Support information” on page 161.
You can resolve some problems by ensuring that your system matches the system requirements listed inChapter 2, “Requirements and agent installation and configuration,” on page 7.
The following activities can help you find a solution to the problem you are having:v “Gathering product information for IBM Software Support”v “Using logging” on page 132v “Consulting the lists of identified problems and workarounds” on page 132
Gathering product information for IBM Software Support
Before contacting IBM Software Support about a problem you are experiencing with this product, gatherthe information shown in Table 5.
Table 5. Information to gather before contacting IBM Software Support
Information type Description
Log files Collect trace log files from failing systems. Most logs arelocated in a logs subdirectory on the host computer. See“Principal trace log files” on page 133 for lists of all tracelog files and their locations.
For general information about the IBM Tivoli Monitoringenvironment, see the Tivoli Enterprise Portal User's Guide.
CEC information Version number and patch level
Operating system Operating system version number and patch level
Messages Messages and other information displayed on the screen
Version numbers for IBM Tivoli Monitoring Version number of the following members of themonitoring environment:
v IBM Tivoli Monitoring. Also provide the patch level, ifavailable.
v IBM Tivoli Monitoring: CEC Base Agent
Screen captures Screen captures of incorrect output, if any
(UNIX systems only) Core dump files If the system stops on UNIX systems, collect the coredump file from the install_dir/bin directory, whereinstall_dir is the directory where you installed themonitoring agent.
You can use the pdcollect tool to collect the most commonly used information from a system. This toolgathers log files, configuration information, version information, and other data. For more informationabout using this tool, see “pdcollect tool” in the IBM Tivoli Monitoring Troubleshooting Guide.
For information about working with IBM Software Support, see IBM Support Portal Service Requests andPMRs (http://www.ibm.com/support/entry/portal/Open_service_request/Software/Software_support_(general)).
© Copyright IBM Corp. 2007, 2013 131

Using logging
Logging is the primary troubleshooting feature in the CEC Base agent. Logging refers to the text messagesand trace data that is generated by the CEC Base agent. Messages and trace data are sent to a file.
Trace data captures transient information about the current operating environment when a component orapplication fails to operate as designed. IBM Software Support personnel use the captured traceinformation to determine the source of an error or unexpected condition. See “Trace logging” for moreinformation.
Consulting the lists of identified problems and workarounds
Known problems are organized into types such as those in the following list to make them easier tolocate:v Installation and configurationv General usage and operationv Display of monitoring datav Take Action commands
Information about symptoms and detailed workarounds for these types of problems is located in“Problems and workarounds” on page 142.
For general troubleshooting information, see the IBM Tivoli Monitoring Troubleshooting Guide.
Trace loggingTrace logs are used to capture information about the operating environment when component softwarefails to operate as designed.
The principal log type is the RAS (Reliability, Availability, and Serviceability) trace log. These logs are inthe English language only. The RAS trace log mechanism is available for all components of IBM TivoliMonitoring. Most logs are located in a logs subdirectory on the host computer. See the followinginformation to learn how to configure and use trace logging:v “Principal trace log files” on page 133v “Examples: Using trace logs” on page 135v “Setting RAS trace parameters by using the GUI” on page 136
Note: The documentation refers to the RAS facility in IBM Tivoli Monitoring as "RAS1."
IBM Software Support personnel use the information captured by trace logging to trace a problem to itssource or to determine why an error occurred. All components in the IBM Tivoli Monitoring environmenthave a default tracing level. The tracing level can be changed on a per-component level to adjust the typeof trace information collected, the degree of trace detail, the number of trace logs to be kept, and theamount of disk space used for tracing.
Overview of log file managementKnowing the naming conventions for log files helps you to find the files.
Agent log file naming conventions
Table 6 on page 133 provides the names, locations, and descriptions of IBM Tivoli Monitoring generalRAS1 log files. The log file names for the CEC Base agent adhere to the following naming convention:
Windows systemshostname_productcode_program_HEXtimestamp-nn.log
132 IBM Tivoli Monitoring: CEC Base Agent User's Guide
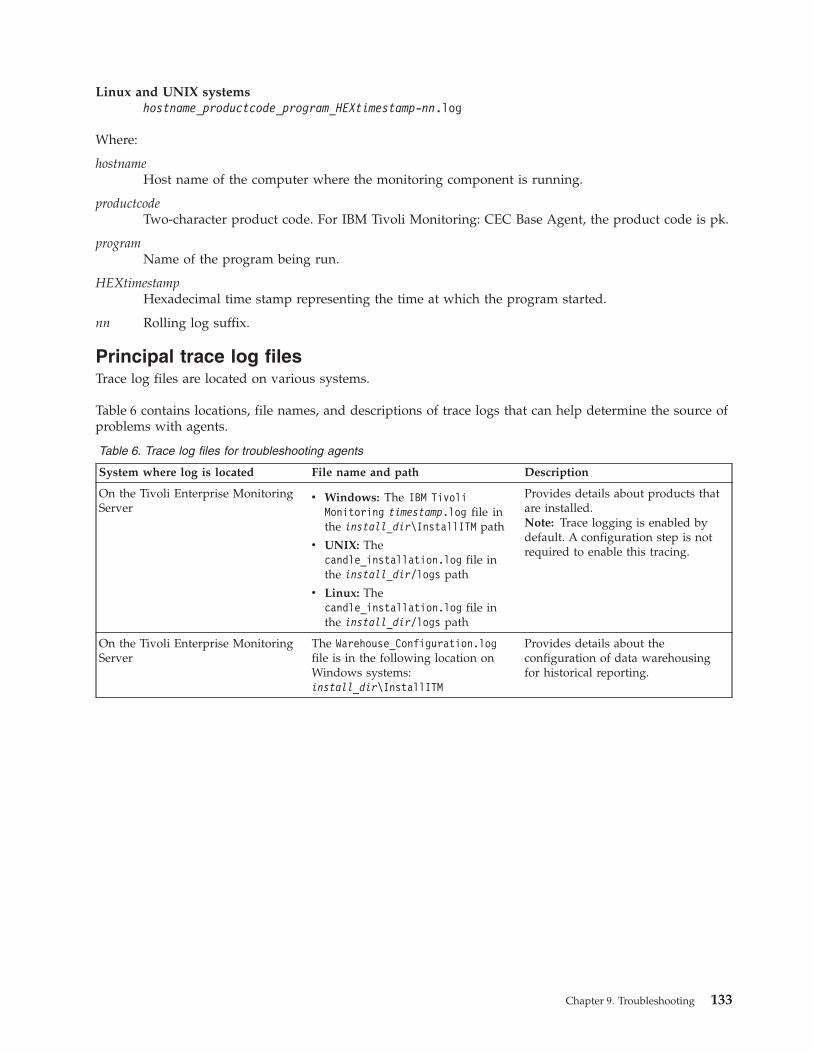
Linux and UNIX systemshostname_productcode_program_HEXtimestamp-nn.log
Where:
hostnameHost name of the computer where the monitoring component is running.
productcodeTwo-character product code. For IBM Tivoli Monitoring: CEC Base Agent, the product code is pk.
programName of the program being run.
HEXtimestampHexadecimal time stamp representing the time at which the program started.
nn Rolling log suffix.
Principal trace log filesTrace log files are located on various systems.
Table 6 contains locations, file names, and descriptions of trace logs that can help determine the source ofproblems with agents.
Table 6. Trace log files for troubleshooting agents
System where log is located File name and path Description
On the Tivoli Enterprise MonitoringServer
v Windows: The IBM TivoliMonitoring timestamp.log file inthe install_dir\InstallITM path
v UNIX: Thecandle_installation.log file inthe install_dir/logs path
v Linux: Thecandle_installation.log file inthe install_dir/logs path
Provides details about products thatare installed.Note: Trace logging is enabled bydefault. A configuration step is notrequired to enable this tracing.
On the Tivoli Enterprise MonitoringServer
The Warehouse_Configuration.logfile is in the following location onWindows systems:install_dir\InstallITM
Provides details about theconfiguration of data warehousingfor historical reporting.
Chapter 9. Troubleshooting 133
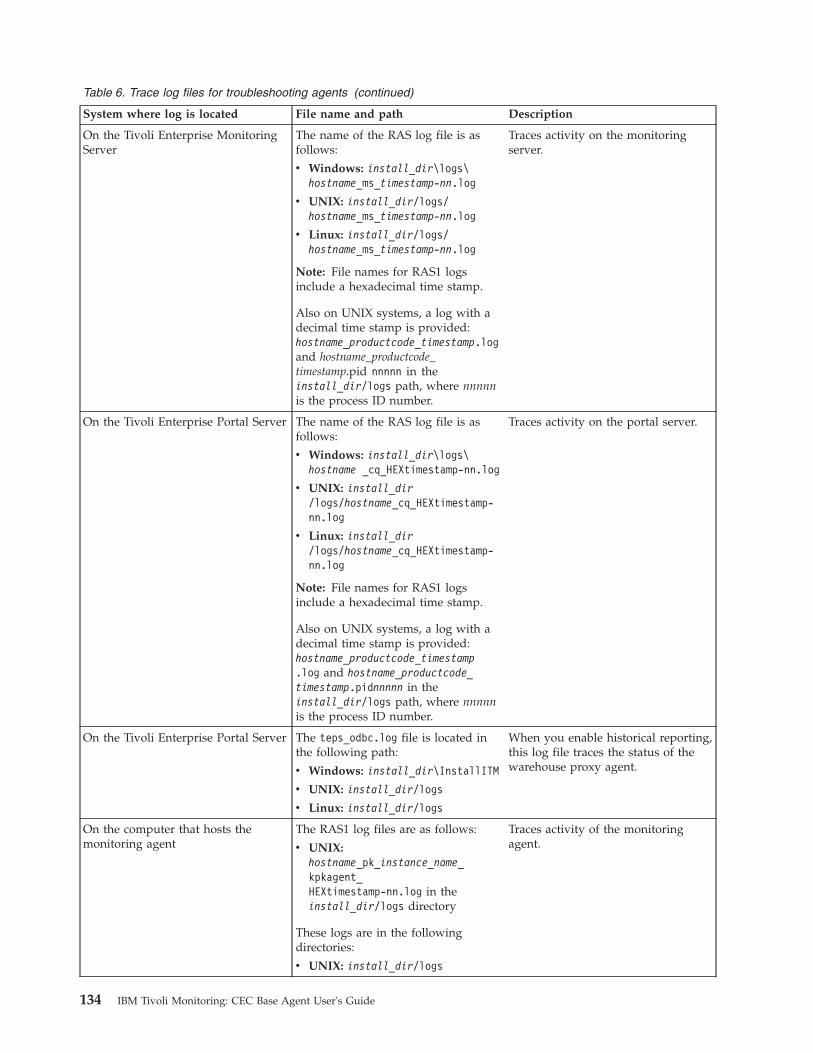
Table 6. Trace log files for troubleshooting agents (continued)
System where log is located File name and path Description
On the Tivoli Enterprise MonitoringServer
The name of the RAS log file is asfollows:
v Windows: install_dir\logs\hostname_ms_timestamp-nn.log
v UNIX: install_dir/logs/hostname_ms_timestamp-nn.log
v Linux: install_dir/logs/hostname_ms_timestamp-nn.log
Note: File names for RAS1 logsinclude a hexadecimal time stamp.
Also on UNIX systems, a log with adecimal time stamp is provided:hostname_productcode_timestamp.logand hostname_productcode_timestamp.pid nnnnn in theinstall_dir/logs path, where nnnnnis the process ID number.
Traces activity on the monitoringserver.
On the Tivoli Enterprise Portal Server The name of the RAS log file is asfollows:
v Windows: install_dir\logs\hostname _cq_HEXtimestamp-nn.log
v UNIX: install_dir/logs/hostname_cq_HEXtimestamp-nn.log
v Linux: install_dir/logs/hostname_cq_HEXtimestamp-nn.log
Note: File names for RAS1 logsinclude a hexadecimal time stamp.
Also on UNIX systems, a log with adecimal time stamp is provided:hostname_productcode_timestamp.log and hostname_productcode_timestamp.pidnnnnn in theinstall_dir/logs path, where nnnnnis the process ID number.
Traces activity on the portal server.
On the Tivoli Enterprise Portal Server The teps_odbc.log file is located inthe following path:
v Windows: install_dir\InstallITM
v UNIX: install_dir/logs
v Linux: install_dir/logs
When you enable historical reporting,this log file traces the status of thewarehouse proxy agent.
On the computer that hosts themonitoring agent
The RAS1 log files are as follows:
v UNIX:hostname_pk_instance_name_kpkagent_HEXtimestamp-nn.log in theinstall_dir/logs directory
These logs are in the followingdirectories:
v UNIX: install_dir/logs
Traces activity of the monitoringagent.
134 IBM Tivoli Monitoring: CEC Base Agent User's Guide
Table 6. Trace log files for troubleshooting agents (continued)
System where log is located File name and path Description
On the computer that hosts themonitoring agent
The agent operations log files are asfollows:
instance_hostnamePK.LG0 is thecurrent log created when the agentwas started.
instance_hostname_PK.LG1 is thebackup of the previous log.
These logs are in the followingdirectory depending on the operatingsystem that you are using:
v UNIX: install_dir/logs
Shows whether the agent couldconnect to the monitoring server.Shows which situations are startedand stopped, and shows other eventswhile the agent is running. A newversion of this file is generated everytime the agent is restarted.
IBM Tivoli Monitoring generates onebackup copy of the *.LG0 file withthe tag .LG1. View the .LG1 tag tolearn the following details regardingthe previous monitoring session:
v Status of connectivity with themonitoring server
v Situations that were running
v The success or failure status ofTake Action commands
Definitions of variables:
v timestamp is a time stamp with a format that includes year (y), month (m), day (d), hour (h), and minute (m), asfollows: yyyymmdd hhmm
v HEXtimestamp is a hexadecimal representation of the time at which the process was started.
v install_dir represents the directory path where you installed the IBM Tivoli Monitoring component. install_dir canrepresent a path on the computer that hosts the monitoring system, the monitoring agent, or the portal.
v instance refers to the name of the database instance that you are monitoring.
v instance_name refers to the name of the agent instance.
v hostname refers to the name of the computer on which the IBM Tivoli Monitoringcomponent runs.
v nn represents the circular sequence in which logs are rotated. this value includes a range from 1 - 5, by default.The first is always retained because it includes configuration parameters.
v productcode specifies the product code, for example, um for Universal Agent or nt for Windows systems.
For more information about the complete set of trace logs that are maintained on the monitoring server,see the IBM Tivoli Monitoring Installation and Setup Guide.
Examples: Using trace logsYou can open trace logs in a text editor to learn some basic facts about your IBM Tivoli Monitoringenvironment.
IBM Software Support applies specialized knowledge to analyze trace logs to determine the source ofproblems. The following examples are from the Tivoli Enterprise Monitoring Server log.
Example oneThis excerpt shows the typical log for a failed connection between a monitoring agent and amonitoring server with the host name server1a:(Thursday, August 11, 2005, 08:21:30-{94C}kdcl0cl.c,105,"KDCL0_ClientLookup") status=1c020006,"location server unavailable", ncs/KDC1_STC_SERVER_UNAVAILABLE(Thursday, August 11, 2005, 08:21:35-{94C}kraarreg.cpp,1157,"LookupProxy") Unable to connect tobroker at ip.pipe:: status=0, "success", ncs/KDC1_STC_OK(Thursday, August 11, 2005, 08:21:35-{94C}kraarreg.cpp,1402,"FindProxyUsingLocalLookup") Unableto find running CMS on CT_CMSLIST <IP.PIPE:#server1a>
Chapter 9. Troubleshooting 135
Example twoThe following excerpts from the trace log for the monitoring server show the status of an agent,identified here as "Remote node." The name of the computer where the agent is running isSERVER5B:(42C039F9.0000-6A4:kpxreqhb.cpp,649,"HeartbeatInserter") Remote node SERVER5B:PK is ON-LINE.. . .(42C3079B.0000-6A4:kpxreqhb.cpp,644,"HeartbeatInserter") Remote node SERVER5B:PK is OFF-LINE.
See the following key points about the preceding excerpts:v The monitoring server appends the PK product code to the server name to form a unique
name (SERVER5B:PK ) for this instance of the IBM Tivoli Monitoring: CEC Base Agent. Byusing this unique name, you can distinguish multiple monitoring products that might berunning on SERVER5B.
v The log shows when the agent started (ON-LINE) and later stopped (OFF-LINE) in theenvironment.
v For the sake of brevity, an ellipsis (...) represents the series of trace log entries that weregenerated while the agent was running.
v Between the ON-LINE and OFF-LINE log entries, the agent was communicating with themonitoring server.
v The ON-LINE and OFF-LINE log entries are always available in the trace log. All trace levelsthat are described in “Setting RAS trace parameters by using the GUI” provide these entries.
On Windows systems, you can use the following alternate method to view trace logs:1. In the Windows Start menu, click Program Files > IBM Tivoli Monitoring > Manage Tivoli
Enterprise Monitoring Services. The Manage Tivoli Enterprise Monitoring Services window isdisplayed.
2. Right-click a component and click Advanced > View Trace Log in the menu. For example, if youwant to view the trace log of the IBM Tivoli Monitoring: CEC Base Agent, right-click the name of thatagent in the window. You can also use the viewer to access remote logs.
Note: The viewer converts time stamps in the logs to a format that is easier to read.
RAS trace parametersPinpoint a problem by setting detailed tracing of individual components of the monitoring agent andmodules
See “Overview of log file management” on page 132 to ensure that you understand log rolling and canreference the correct log files when you manage log file generation.
Setting RAS trace parameters by using the GUIOn Windows systems, you can use the graphical user interface to set trace options.
About this task
The IBM Tivoli Monitoring: CEC Base Agent uses RAS1 tracing and generates the logs described inTable 6 on page 133. The default RAS1 trace level is ERROR.
Procedure1. Open the Manage Tivoli Enterprise Monitoring Services window.2. Select Advanced > Edit Trace Parms. The Tivoli Enterprise Monitoring Server Trace Parameters
window is displayed.3. Select a new trace setting in the pull-down menu in the Enter RAS1 Filters field or type a valid
string.
136 IBM Tivoli Monitoring: CEC Base Agent User's Guide

v General error tracing. KBB_RAS1=ERRORv Intensive error tracing. KBB_RAS1=ERROR (UNIT:kpk ALL)v Maximum error tracing. KBB_RAS1=ERROR (UNIT:kpk ALL) (UNIT:kra ALL)
Note: As this example shows, you can set multiple RAS tracing options in a single statement.4. Modify the value for Maximum Log Size Per File (MB) to change the log file size (changes LIMIT
value).5. Modify the value for Maximum Number of Log Files Per Session to change the number of log files
per startup of a program (changes COUNT value).6. Modify the value for Maximum Number of Log Files Total to change the number of log files for all
startups of a program (changes MAXFILES value).7. Optional: Click Y (Yes) in the KDC_DEBUG Setting menu to log information that can help you
diagnose communications and connectivity problems between the monitoring agent and themonitoring server. The KDC_DEBUG setting and the Maximum error tracing setting can generate a largeamount of trace logging. Use these settings only temporarily, while you are troubleshooting problems.Otherwise, the logs can occupy excessive amounts of hard disk space.
8. Click OK. You see a message reporting a restart of the monitoring agent so that your changes takeeffect.
What to do next
Monitor the size of the logs directory. Default behavior can generate a total of 45 - 60 MB for each agentthat is running on a computer. For example, each database instance that you monitor can generate 45 - 60MB of log data. See the “Procedure” section to learn how to adjust file size and numbers of log files toprevent logging activity from occupying too much disk space.
Regularly prune log files other than the RAS1 log files in the logs directory. Unlike the RAS1 log filesthat are pruned automatically, other log types can grow indefinitely, for example, the logs in Table 6 onpage 133 that include a process ID number (PID).
Use collector trace logs as an additional source of troubleshooting information.
Note: The KDC_DEBUG setting and the Maximum error tracing setting can generate a large amount of tracelogging. Use these settings only temporarily while you are troubleshooting problems. Otherwise, the logscan occupy excessive amounts of hard disk space.
Manually setting RAS trace parametersYou can manually edit the RAS1 trace logging parameters.
About this task
The CEC Base agent uses RAS1 tracing and generates the logs described in Table 6 on page 133. Thedefault RAS1 trace level is ERROR.
Procedure1. Open the trace options file:
v UNIX systems:
install_dir /config/pk.config
2. Edit the line that begins with KBB_RAS1= to set trace logging preferences. For example, if you wantdetailed trace logging, set the Maximum Tracing option: KBB_RAS1=ERROR (UNIT:kpk ALL) (UNIT:kraALL)
3. Edit the line that begins with KBB_RAS1_LOG= to manage the generation of log files:
Chapter 9. Troubleshooting 137
v MAXFILES: The total number of files that are to be kept for all startups of a specific program. Whenthis value is exceeded, the oldest log files are discarded. The default value is 9.
v LIMIT: The maximum size, in megabytes (MB) of a RAS1 log file. The default value is 5.v IBM Software Support might guide you to modify the following parameters:
– COUNT: The number of log files to keep in the rolling cycle of one program startup. The default is3.
– PRESERVE: The number of files that are not to be reused in the rolling cycle of one programstartup. The default value is 1.
Note: The KBB_RAS1_LOG parameter also provides for the specification of the log file directory, logfile name, and the inventory control file directory and name. Do not modify these values or loginformation can be lost.
4. Restart the monitoring agent so that your changes take effect.
What to do next
Monitor the size of the logs directory. Default behavior can generate a total of 45 - 60 MB for each agentthat is running on a computer. For example, each database instance that you monitor can generate 45 - 60MB of log data. See the “Procedure” section to learn how to adjust file size and numbers of log files toprevent logging activity from occupying too much disk space.
Regularly prune log files other than the RAS1 log files in the logs directory. Unlike the RAS1 log filesthat are pruned automatically, other log types can grow indefinitely, for example, the logs in Table 6 onpage 133 that include a process ID number (PID).
Use collector trace logs as an additional source of troubleshooting information.
Note: The KDC_DEBUG setting and the Maximum error tracing setting can generate a large amount of tracelogging. Use these settings only temporarily while you are troubleshooting problems. Otherwise, the logscan occupy excessive amounts of hard disk space.
Dynamic modification of trace settingsYou can dynamically modify the trace settings for an IBM Tivoli Monitoring component, such as, TivoliEnterprise Monitoring Server, Tivoli Enterprise Portal Server, most monitoring agents, and othercomponents. You can access these components, except for a few monitoring agents, from the tracingutility.
Dynamic modification of the trace settings is the most efficient method, because you can do it withoutrestarting the component. Settings take effect immediately. Modifications by this method are notpersistent.
Note: When the component is restarted, the trace settings are read again from the .env file. Dynamicallymodifying these settings does not change the settings in the .env files. To modify these trace settingspermanently, modify them in the .env files.
ras1
Run this command to modify the trace settings for a Tivoli Monitoring component.
The syntax is as follows:ras1 set|list (UNIT|COMP: class_name ANY|ALL|Detail|ERROR|Flow|INPUT|Metrics|OUTPUT|STATE){(UNIT|COMP: class_name ANY|ALL|Detail|ERROR|Flow|INPUT|Metrics|OUTPUT|STATE)}
You can specify more than one component class to which to apply the trace settings.
138 IBM Tivoli Monitoring: CEC Base Agent User's Guide

Command options
setTurns on or off tracing depending upon the value of its parameters. If the parameter is ANY, it turns itoff. All other parameters turn on tracing based on the specified type or level.
listDisplays the default level and type of tracing that is set by default.
Parameters
The parameters that determine the component classes to which to apply the trace settings are as follows:
COMP: class_nameModifies the trace setting for the name of the component class, as specified by class_name , forexample, COMP:KDH. The output contains trace for the specified class.
UNIT: class_nameModifies the trace setting for any unit that starts with the specified class_name value, for example,UNIT: kra. The output contains trace for any unit that begins with the specified filter pattern.
The parameters that determine the trace level and type are as follows:
ALLDisplays all trace levels, including every trace point defined for the component. This setting mightresult in a large amount of trace, so specify other parameters to exclude unwanted trace. You mightrequire the ALL parameter to isolate a problem, which is the equivalent to setting "Error Detail FlowState Input Output Metrics".
ANYTurns off tracing.
DetailDisplays detailed information about each function.
When entered with the list option, the trace is tagged with Det.
ERRORLogs internal error conditions.
When entered with the list option, the trace is tagged with ER. The output can also be tagged withEVERYE+EVERYU+ER.
FlowDisplays control flow data for each function entry and exit.
When entered with the list option, the trace is tagged with Fl.
INPUTDisplays input data for each function.
When entered with the list option, the trace is tagged with IN.
MetricsDisplays metrics on each function.
When entered with the list option, the trace is tagged with ME.
OUTPUTDisplays output data for each function.
When entered with the list option, the trace is tagged with OUT.
StateDisplays the status for each function.
Chapter 9. Troubleshooting 139

When entered with the list option, the trace is tagged with St.
Example
If you enter ras1 set (COMP:KDH ALL) (COMP:ACF1 ALL) (COMP:KDE ALL), the trace utility turns on alllevels of tracing for all the files and functions for which KDH, ACF1, and KDE are the classes.kbbcre1.c, 400, May 29 2007, 12:54:43, 1.1, *kbbcrn1.c, 400, May 29 2007, 12:54:42, 1.1, *kdhb1de.c, 400, May 29 2007, 12:59:34, 1.1, KDHkdh0med.c, 400, May 29 2007, 12:59:24, 1.1, KDHkdhsrej.c, 400, May 29 2007, 13:00:06, 1.5, KDHkdhb1fh.c, 400, May 29 2007, 12:59:33, 1.1, KDHkdhb1oe.c, 400, May 29 2007, 12:59:38, 1.2, KDHkdhs1ns.c, 400, May 29 2007, 13:00:08, 1.3, KDHkbbacdl.c, 400, May 29 2007, 12:54:27, 1.2, ACF1kbbaclc.c, 400, May 29 2007, 12:54:27, 1.4, ACF1kbbac1i.c, 400, May 29 2007, 12:54:28, 1.11, ACF1vkdhsfcn.c, 400, May 29 2007, 13:00:11, 1.1, KDHkdhserq.c, 400, May 29 2007, 12:59:53, 1.1, KDHkdhb1pr.c, 400, May 29 2007, 12:59:39, 1.1, KDHkdhsgnh.c, 400, May 29 2007, 12:59:49, 1.1, KDHkdh0uts.c, 400, May 29 2007, 12:59:23, 1.1, KDHkdhsrsp.c, 400, May 29 2007, 13:00:13, 1.2, KDHkdhs1rp.c, 400, May 29 2007, 13:00:12, 1.1, KDHkdhscsv.c, 400, May 29 2007, 12:59:58, 1.9, KDHkdebbac.c, 400, May 29 2007, 12:56:50, 1.10, KDE...
Turning on tracingTo use the tracing utility, you must use a local logon credential for the computer. This tracing methoduses the IBM Tivoli Monitoring Service Console. Access the Service Console by using a web browser.
About this task
When you start the Service Console, information is displayed about the components that are currentlyrunning on that computer. For example, these components are listed as follows:v Tivoli Enterprise Portal Server: cnpv Monitoring Agent for Windows OS: ntv Tivoli Enterprise Monitoring Server: ms
After you log on, you can type a question mark (?) to display a list of the supported commands. Use theras1 command to modify trace settings. If you type this command in the field provided in the ServiceConsole window and click Submit, the help for this command is displayed.
Procedure1. Open a web browser and enter the URL to access the Service Console.
http://hostname:1920
where hostname is the IP address or host name of the computer on which the IBM Tivoli Monitoringcomponent is running.
2. Click the hyperlink associated with the component for which you want to modify its trace settings.
Note: In the previous view, if you want to modify tracing for the Tivoli Enterprise Monitoring Server,select IBM Tivoli Monitoring Service Console under Service Point: system.your host name_ms.
3. Enter a user ID and password to access the system. This ID is any valid user that has access to thesystem.
4. Enter the command to turn on the required level of trace for the specified component classes or units.
140 IBM Tivoli Monitoring: CEC Base Agent User's Guide

ras1 set (UNIT|COMP: class_name ALL|Flow|ERROR|Detail|INPUT|Metrics|OUTPUT|STATE){(UNIT|COMP: class_name ALL|Flow|ERROR|Detail|INPUT|Metrics|OUTPUT|STATE)}
For example, to turn on the control flow trace for the KDE, the command is:ras1 (COMP:KDE Flow)
Turning off tracingYou can use the IBM Tivoli Monitoring Service Console to run the ras1 command and dynamically turnoff tracing.
Procedure1. Open a web browser and enter the URL to access the Service Console.
http://hostname:1920
where hostname is the IP address or host name of the computer on which the IBM Tivoli Monitoringcomponent is running.
2. Click the hyperlink associated with the component for which you want to modify its trace settings.3. Enter a user ID and password to access the system. This ID is any valid user that has access to the
system.4. Enter the command to turn off the required level of trace for the specified component classes or units.
ras1 set (UNIT|COMP: class_name ANY){(UNIT|COMP: class_name ANY)}
For example, to turn off tracing for the kbbcrcd class of the Windows OS agent, the command is:ras1 set (UNIT:kbbcrcd ANY)
Setting trace parameters for the Tivoli Enterprise Console serverIn addition to the trace information captured by IBM Tivoli Monitoring, you can also collect additionaltrace information for the Tivoli Enterprise Console components that gather event server metrics.
About this task
To collect this information, modify the .tec_diag_config file on the Tivoli Enterprise Console eventserver. Use the steps in the following procedure to modify the event server trace parameters.
Procedure1. Open the $BINDIR/TME/TEC/.tec_diag_config file in an ASCII editor.2. Locate the entries that configure trace logging for the agent components on the event server. Two
entries are included, one for tec_reception and one for tec_rule:# to debug Agent Utilstec_reception Agent_Utils error /tmp/tec_receptionSP# to debug Agent Utilstec_rule Agent_Utils error /tmp/tec_rule
3. To gather additional trace information, modify these entries to specify a trace level of trace2:# to debug Agent Utilstec_reception Agent_Utils trace2 /tmp/tec_receptionSP# to debug Agent Utilstec_rule Agent_Utils trace2 /tmp/tec_rule
4. In addition, modify the Highest_level entries for tec_rule and tec_reception:tec_reception Highest_level trace2SPtec_rule Highest_level trace2
Chapter 9. Troubleshooting 141

Problems and workaroundsThe known problems and workarounds are organized into types of problems that might occur with theCEC Base agent, for example installation and configuration problems and workspace problems.
Note: You can resolve some problems by ensuring that your system matches the system requirementslisted in Chapter 2, “Requirements and agent installation and configuration,” on page 7.
For general troubleshooting information, see the IBM Tivoli Monitoring Troubleshooting Guide.
Installation and configuration troubleshootingProblems can occur during installation, configuration, and uninstallation of the agent.
The problems and solutions in Table 7 can occur during installation, configuration, and uninstallation ofthe agent.
Table 7. Problems and solutions for installation and configuration
Problem Solution
(UNIX only) During a command-line installation, youchoose to install a component that is currently installed,and you see the following warning: WARNING - you areabout to install the SAME version of"component_name" where component_name is the name ofthe component that you are attempting to install.Note: This problem affects UNIX command-lineinstallations. If you monitor only Windowsenvironments, you see this problem if you choose toinstall a product component (for example, a monitoringserver) on a UNIX system.
You must exit and restart the installation process. Youcannot return to the list where you selected componentsto install. When you run the installer again, do notattempt to install any component that is currentlyinstalled.
A message similar to "Unable to find running CMS onCT_CMSLIST" in the log file is displayed.
If a message similar to "Unable to find running CMS onCT_CMSLIST" is displayed in the log file, the agent cannotconnect to the monitoring server. Confirm the followingpoints:
v Do multiple network interface cards (NICs) exist onthe system?
v If multiple NICs exist on the system, find out whichone is configured for the monitoring server. Ensurethat you specify the correct host name and portsettings for communication in the IBM TivoliMonitoring environment.
The system is experiencing high CPU usage. Agent process: View the memory usage of the KPKCMAprocess. If CPU usage seems to be excessive, restart themonitoring agent.
Network cards: The network card configurations candecrease the performance of a system. Each stream ofpackets that a network card receives (assuming that it isa broadcast or destined for the under-performing system)must generate a CPU interrupt and transfer the datathrough the I/O bus. If the network card in question is abus-mastering card, work can be offloaded and a datatransfer between memory and the network card cancontinue without using CPU processing power.Bus-mastering cards are 32-bit and are based on PCI orEISA bus architectures.
142 IBM Tivoli Monitoring: CEC Base Agent User's Guide

Table 7. Problems and solutions for installation and configuration (continued)
Problem Solution
The artwork in the installation panels in the Japaneseenvironment are missing, and some panels have atruncation problem.
No solution is available for this problem at this time.
In the Install Prerequisites panel during agentinstallation, the following extra string displays inRussian: \r
No solution is available for this problem at this time.
In the Select Features panel during agent installation, theDescription of each feature is in English only.
No solution is available for this problem at this time.
The following warning message is displayed duringapplication support installation KCIIN1421W WARNING -unable to copy eclipse agent plugin file
$CANDLEHOME/$ITM_BINARCH/cw/iehs/kpc/eclipse/plugins/com.ibm.kpc.doc
where, pc is your two character product code.
Manually rename or delete the agent plug-in file and runthe application support installation again.
Cannot find the agent support files for the Linuxoperating system.
Support files for all IBM Tivoli Monitoring supportedoperating systems are located on the support file image.Support files for the AIX operating system are located onthe agent image.
The configuration panel is blank on 64-bit Windowssystems where the Tivoli Enterprise Monitoring AgentFramework (component GL) is version 06.23.00.00 or06.23.01.00.
Check the GL component version by running kincinfo -tGL from a Windows command line. Example:
%CANDLE_HOME%\InstallITM\kincinfo -t GL
If the GL component version is 06.23.00.00 or 06.23.01.00,take one of the following actions:
v Preferred action: Upgrade the Windows OS Agent toVersion 6.2.3 Fix Pack 2.
v Alternate action: Install the Agent Compatibility (AC)component from the IBM Tivoli Monitoring V6.2.3 FixPack 1 media. See Installing the Agent Compatibility(AC) component (http://pic.dhe.ibm.com/infocenter/tivihelp/v15r1/topic/com.ibm.itm.doc_6.2.3fp1/itm623FP1_install199.htm#acpinstall).
On VIOS, for the cfgsvc command to use the lsrsrccommand, you must configure port 657 to open forTCP/UDP. If Port 657 is blocked by a firewall, the cfgsvccommand fails with the following message:
"Find HMC IP with ISRSRC"was last subcommand run.Command did not complete.
You must ensure that the following ports are open andnot blocked:
v UDP port 2279 to allow for communication betweenthe CEC Base agent system and the monitored LPARsfor xmservd / xmtopas.
v TCP port 1918 that is used for communication betweenTivoli Enterprise Portal Server and the agent system.
v TCP/UDP port 657 for VIOS environments to allowcommunication between VIOS and HMC.
v TCP port for communication to the Tivoli EnterpriseMonitoring Server based on the Tivoli EnterpriseMonitoring Server listening port.
Chapter 9. Troubleshooting 143

Table 8. General problems and solutions for uninstallation
Problem Solution
The way to remove inactive managed systems (systemswhose status is OFFLINE) from the Navigator tree in theportal is not obvious.
Use the following steps to remove, but not uninstall, anoffline managed system from the Navigator tree:
1. Click the Enterprise icon in the Navigator tree.
2. Right-click, and then click Workspace > ManagedSystem Status.
3. Right-click the offline managed system, and selectClear offline entry.
To uninstall the monitoring agent, use the proceduredescribed in the IBM Tivoli Monitoring Installation andSetup Guide.
While running ./uninstall.sh to uninstall the agent, oneof its components, or both, you receive the followingerror message and the uninstallation does not complete:uninstall.sh failure: KCI0766E could not find arch"aix536" in a JRE version file.
Use the following separate, manual procedure foruninstalling the system monitor agent that monitors theLinux or UNIX operating system:
1. Stop the agent by running the following command:InstDir/bin/itmcmd agent stop all
2. Stop any other agents running from the same InstDirdirectory.
3. Issue the following command: InstDir/bin/uninstall.sh REMOVE EVERYTHING
Note: Running the uninstall.sh script with REMOVEEVERYTHING removes all agent files and deletes theinstallation subdirectory tree.
The software inventory tag for the agent on UNIX andLinux systems is not removed during uninstallation ofthe agent.
After uninstalling the agent, manually remove the filenamed full name of agent.cmptag from the$CANDLEHOME/properties/version/ directory.
Remote deployment troubleshootingProblems can occur with remote deployment and removal of agent software using the Agent RemoteDeploy process.
Table 9 contains problems and solutions related to remote deployment.
Table 9. Remote deployment problems and solutions
Problem Solution
While you are using the remote deployment feature toinstall the IBM Tivoli Monitoring: CEC Base Agent, anempty command window is displayed on the targetcomputer. This problem occurs when the target of remotedeployment is a Windows computer. (For moreinformation about the remote deployment feature, seethe IBM Tivoli Monitoring Installation and Setup Guide.)
Do not close or modify this window. It is part of theinstallation process and is dismissed automatically.
The removal of a monitoring agent fails when you usethe remote removal process in the Tivoli EnterprisePortal desktop or browser.
This problem might occur when you attempt the remoteremoval process immediately after you restart the TivoliEnterprise Monitoring Server. You must allow time forthe monitoring agent to refresh its connection with theTivoli Enterprise Monitoring Server before you begin theremote removal process.
144 IBM Tivoli Monitoring: CEC Base Agent User's Guide
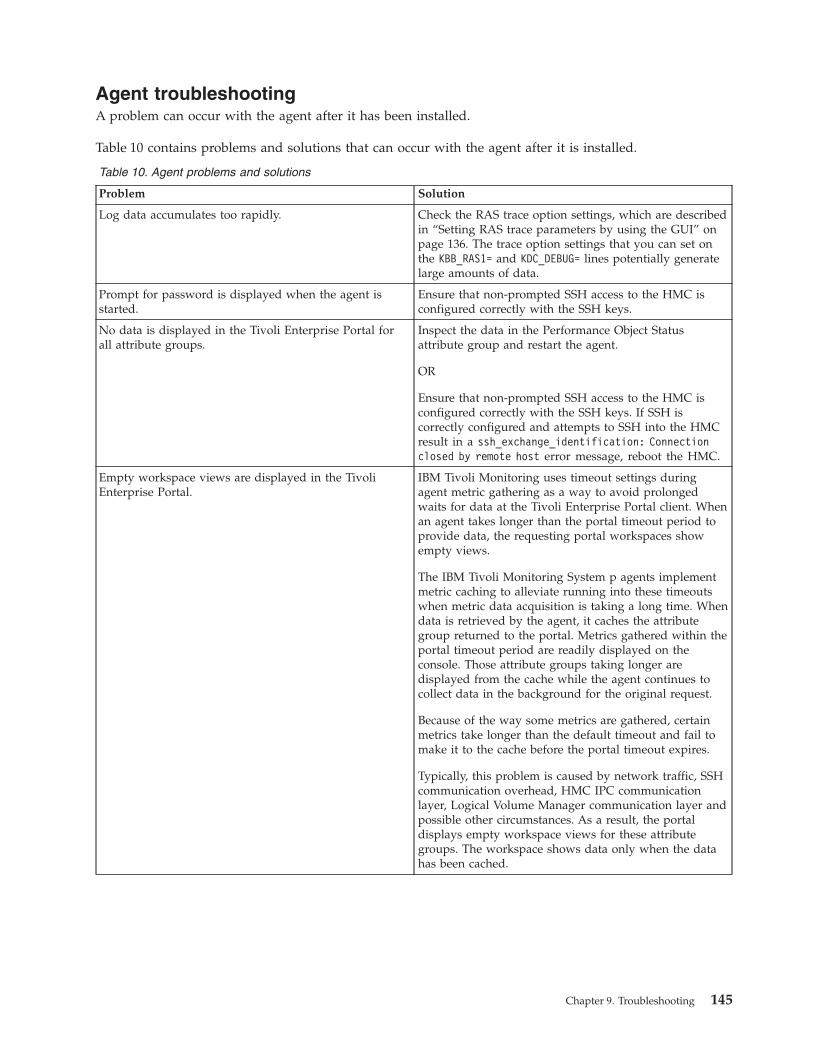
Agent troubleshootingA problem can occur with the agent after it has been installed.
Table 10 contains problems and solutions that can occur with the agent after it is installed.
Table 10. Agent problems and solutions
Problem Solution
Log data accumulates too rapidly. Check the RAS trace option settings, which are describedin “Setting RAS trace parameters by using the GUI” onpage 136. The trace option settings that you can set onthe KBB_RAS1= and KDC_DEBUG= lines potentially generatelarge amounts of data.
Prompt for password is displayed when the agent isstarted.
Ensure that non-prompted SSH access to the HMC isconfigured correctly with the SSH keys.
No data is displayed in the Tivoli Enterprise Portal forall attribute groups.
Inspect the data in the Performance Object Statusattribute group and restart the agent.
OR
Ensure that non-prompted SSH access to the HMC isconfigured correctly with the SSH keys. If SSH iscorrectly configured and attempts to SSH into the HMCresult in a ssh_exchange_identification: Connectionclosed by remote host error message, reboot the HMC.
Empty workspace views are displayed in the TivoliEnterprise Portal.
IBM Tivoli Monitoring uses timeout settings duringagent metric gathering as a way to avoid prolongedwaits for data at the Tivoli Enterprise Portal client. Whenan agent takes longer than the portal timeout period toprovide data, the requesting portal workspaces showempty views.
The IBM Tivoli Monitoring System p agents implementmetric caching to alleviate running into these timeoutswhen metric data acquisition is taking a long time. Whendata is retrieved by the agent, it caches the attributegroup returned to the portal. Metrics gathered within theportal timeout period are readily displayed on theconsole. Those attribute groups taking longer aredisplayed from the cache while the agent continues tocollect data in the background for the original request.
Because of the way some metrics are gathered, certainmetrics take longer than the default timeout and fail tomake it to the cache before the portal timeout expires.
Typically, this problem is caused by network traffic, SSHcommunication overhead, HMC IPC communicationlayer, Logical Volume Manager communication layer andpossible other circumstances. As a result, the portaldisplays empty workspace views for these attributegroups. The workspace shows data only when the datahas been cached.
Chapter 9. Troubleshooting 145

Table 10. Agent problems and solutions (continued)
Problem Solution
A configured and running instance of the monitoringagent is not displayed in the Tivoli Enterprise Portal, butother instances of the monitoring agent on the samesystem are displayed in the portal.
IBM Tivoli Monitoring products use Remote ProcedureCall (RPC) to define and control product behavior. RPCis the mechanism that a client process uses to make asubroutine call (such as GetTimeOfDay orShutdownServer) to a server process somewhere in thenetwork. Tivoli processes can be configured to useTCP/UDP, TCP/IP, SNA, and SSL as the protocol (ordelivery mechanism) for RPCs that you want.
IP.PIPE is the name given to Tivoli TCP/IP protocol forRPCs. The RPCs are socket-based operations that useTCP/IP ports to form socket addresses. IP.PIPEimplements virtual sockets and multiplexes all virtualsocket traffic across a single physical TCP/IP port(visible from the netstat command).
A Tivoli process derives the physical port for IP.PIPEcommunications based on the configured, well-knownport for the hub Tivoli Enterprise Monitoring Server.(This well-known port or BASE_PORT is configured byusing the 'PORT:' keyword on the KDC_FAMILIES /KDE_TRANSPORT environment variable and defaults to'1918'.)
The physical port allocation method is defined as(BASE_PORT + 4096*N), where N=0 for a TivoliEnterprise Monitoring Server process and N={1, 2, ..., 15}for another type of monitoring server process. Twoarchitectural limits result as a consequence of thephysical port allocation method:
v No more than one Tivoli Enterprise Monitoring Serverreporting to a specific Tivoli Enterprise MonitoringServer hub can be active on a system image.
v No more than 15 IP.PIPE processes can be active on asingle system image.
A single system image can support any number of TivoliEnterprise Monitoring Server processes (address spaces)if each Tivoli Enterprise Monitoring Server on that imagereports to a different hub. By definition, one TivoliEnterprise Monitoring Server hub is available permonitoring enterprise, so this architecture limit has beenreduced to one Tivoli Enterprise Monitoring Server persystem image.
No more than 15 IP.PIPE processes or address spaces canbe active on a single system image. With the first limitexpressed earlier, this second limitation refers specificallyto Tivoli Enterprise Monitoring Agent processes: no morethan 15 agents per system image.
Continued on next row.
146 IBM Tivoli Monitoring: CEC Base Agent User's Guide

Table 10. Agent problems and solutions (continued)
Problem Solution
Continued from previous row. This limitation can be circumvented (at currentmaintenance levels, IBM Tivoli Monitoring V6.1, Fix Pack4 and later) if the Tivoli Enterprise Monitoring Agentprocess is configured to use the EPHEMERAL IP.PIPEprocess. (This process is IP.PIPE configured with the'EPHEMERAL:Y' keyword in the KDC_FAMILIES /KDE_TRANSPORT environment variable). The number ofephemeral IP.PIPE connections per system image has nolimitation. If ephemeral endpoints are used, theWarehouse Proxy agent is accessible from the TivoliEnterprise Monitoring Server associated with the agentsusing ephemeral connections either by running theWarehouse Proxy agent on the same computer or byusing the Firewall Gateway feature. (The FirewallGateway feature relays the Warehouse Proxy agentconnection from the Tivoli Enterprise Monitoring Servercomputer to the Warehouse Proxy agent computer if theWarehouse Proxy agent cannot coexist on the samecomputer.)
The CEC Base agent shows "shared" LPAR clients as"dedicated." The agent does not show the same value asthe Topas CEC monitor for "Monitored Partition Status."
The IBM Tivoli Monitoring: CEC Base agent does notsupport Dynamic Allocation or DLPAR, and requires arestart of the agent to detect changes in LPAR statusfrom shared to dedicated or dedicated to shared. TheCEC Base agent uses information gathered at startup,and if there are changes in the LPAR status, the CECBase agent must be restarted.
The CEC Base agent shows "shared" LPAR clients as"dedicated." The agent does not show the same value asthe Topas CEC monitor for "Monitored Partition Status."
The IBM Tivoli Monitoring: CEC Base Agent does notsupport Dynamic Allocation or DLPAR, and requires arestart of the agent to detect changes in LPAR statusfrom shared to dedicated or dedicated to shared. TheCEC Base agent uses information gathered at startup,and if there are changes in the LPAR status, the CECBase agent must be restarted.
Workspace troubleshootingProblems can occur with general workspaces and agent-specific workspaces.
Table 11 on page 148 contains problems and solutions related to workspaces.
Chapter 9. Troubleshooting 147

Table 11. Workspace problems and solutions
Problem Solution
The process application components are available, butthe Availability status shows PROCESS_DATA_NOT_AVAILABLE.
This problem occurs because the PerfProc performanceobject is disabled. When this condition exists, IBM TivoliMonitoring cannot collect performance data for thisprocess. Use the following steps to confirm that thisproblem exists and to resolve it:
1. In the Windows Start menu, click Run.
2. Type perfmon.exe in the Open field of the Runwindow. The Performance window is displayed.
3. Click the plus sign (+) in the toolbar. The AddCounters window is displayed.
4. Look for Process in the Performance object menu.
5. Complete one of the following actions:
v If you see Process in the menu, the PerfProcperformance object is enabled and the problem iscoming from a different source. You might need tocontact IBM Software Support.
v If you do not see Process in the menu, use theMicrosoft utility from the Microsoft.com Operationswebsite to enable the PerfProc performance object.
The Process performance object becomes visible inthe Performance object menu of the Add Counterswindows, and IBM Tivoli Monitoring is able todetect Availability data.
6. Restart the monitoring agent.
The name of the attribute does not display in a bar chartor graph view.
When a chart or graph view that includes the attribute isscaled to a small size, a blank space is displayed insteadof a truncated name. To see the name of the attribute,expand the view of the chart until sufficient space isavailable to display all characters of the attribute name.
You start collection of historical data but the data cannotbe seen.
Use the following managing options for historical datacollection:
v Basic historical data collection populates theWarehouse with raw data. This type of data collectionis turned off by default. For information aboutmanaging this feature including how to set the intervalat which data is collected, see “Managing historicaldata” in the IBM Tivoli Monitoring Administrator'sGuide. By setting a more frequent interval for datacollection, you reduce the load on the system incurredevery time data is uploaded.
v Use the Summarization and Pruning agent to collectspecific amounts and types of historical data.Historical data is not displayed until theSummarization and Pruning monitoring agent beginscollecting the data. By default, this agent beginscollection at 2 a.m. daily. At that point, data is visiblein the workspace view. For information about how tomodify the default collection settings, see “Managinghistorical data” in the IBM Tivoli MonitoringAdministrator's Guide.
148 IBM Tivoli Monitoring: CEC Base Agent User's Guide
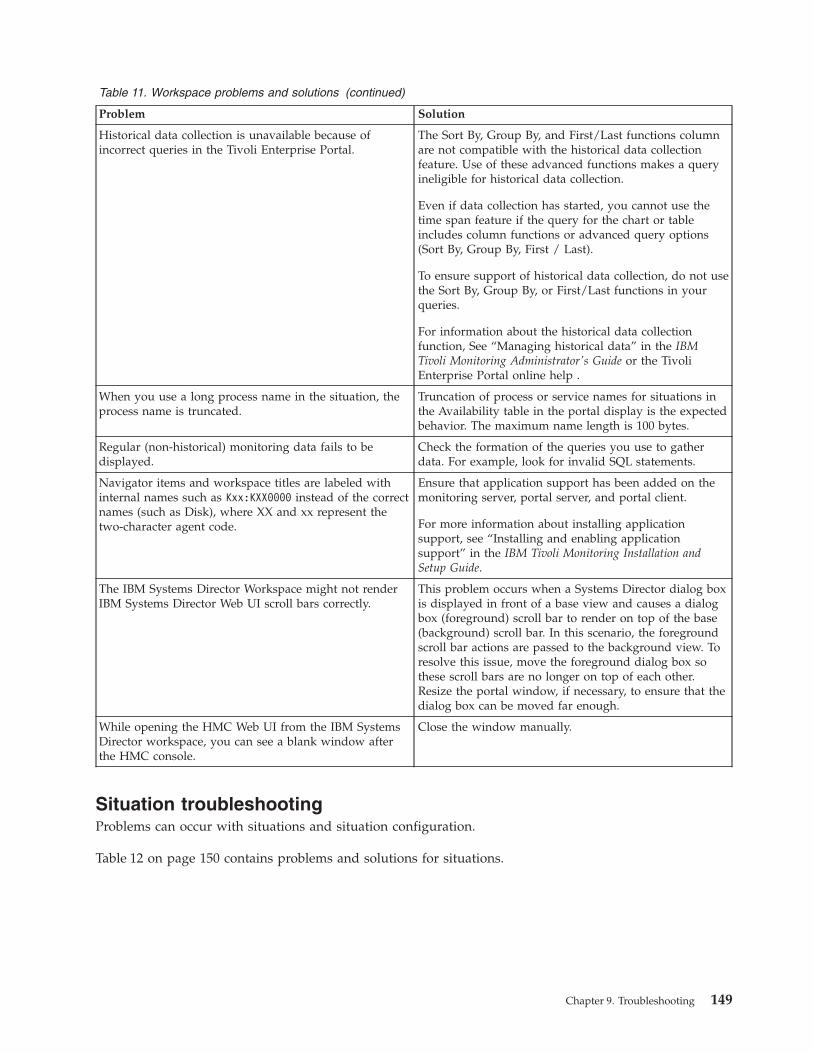
Table 11. Workspace problems and solutions (continued)
Problem Solution
Historical data collection is unavailable because ofincorrect queries in the Tivoli Enterprise Portal.
The Sort By, Group By, and First/Last functions columnare not compatible with the historical data collectionfeature. Use of these advanced functions makes a queryineligible for historical data collection.
Even if data collection has started, you cannot use thetime span feature if the query for the chart or tableincludes column functions or advanced query options(Sort By, Group By, First / Last).
To ensure support of historical data collection, do not usethe Sort By, Group By, or First/Last functions in yourqueries.
For information about the historical data collectionfunction, See “Managing historical data” in the IBMTivoli Monitoring Administrator's Guide or the TivoliEnterprise Portal online help .
When you use a long process name in the situation, theprocess name is truncated.
Truncation of process or service names for situations inthe Availability table in the portal display is the expectedbehavior. The maximum name length is 100 bytes.
Regular (non-historical) monitoring data fails to bedisplayed.
Check the formation of the queries you use to gatherdata. For example, look for invalid SQL statements.
Navigator items and workspace titles are labeled withinternal names such as Kxx:KXX0000 instead of the correctnames (such as Disk), where XX and xx represent thetwo-character agent code.
Ensure that application support has been added on themonitoring server, portal server, and portal client.
For more information about installing applicationsupport, see “Installing and enabling applicationsupport” in the IBM Tivoli Monitoring Installation andSetup Guide.
The IBM Systems Director Workspace might not renderIBM Systems Director Web UI scroll bars correctly.
This problem occurs when a Systems Director dialog boxis displayed in front of a base view and causes a dialogbox (foreground) scroll bar to render on top of the base(background) scroll bar. In this scenario, the foregroundscroll bar actions are passed to the background view. Toresolve this issue, move the foreground dialog box sothese scroll bars are no longer on top of each other.Resize the portal window, if necessary, to ensure that thedialog box can be moved far enough.
While opening the HMC Web UI from the IBM SystemsDirector workspace, you can see a blank window afterthe HMC console.
Close the window manually.
Situation troubleshootingProblems can occur with situations and situation configuration.
Table 12 on page 150 contains problems and solutions for situations.
Chapter 9. Troubleshooting 149
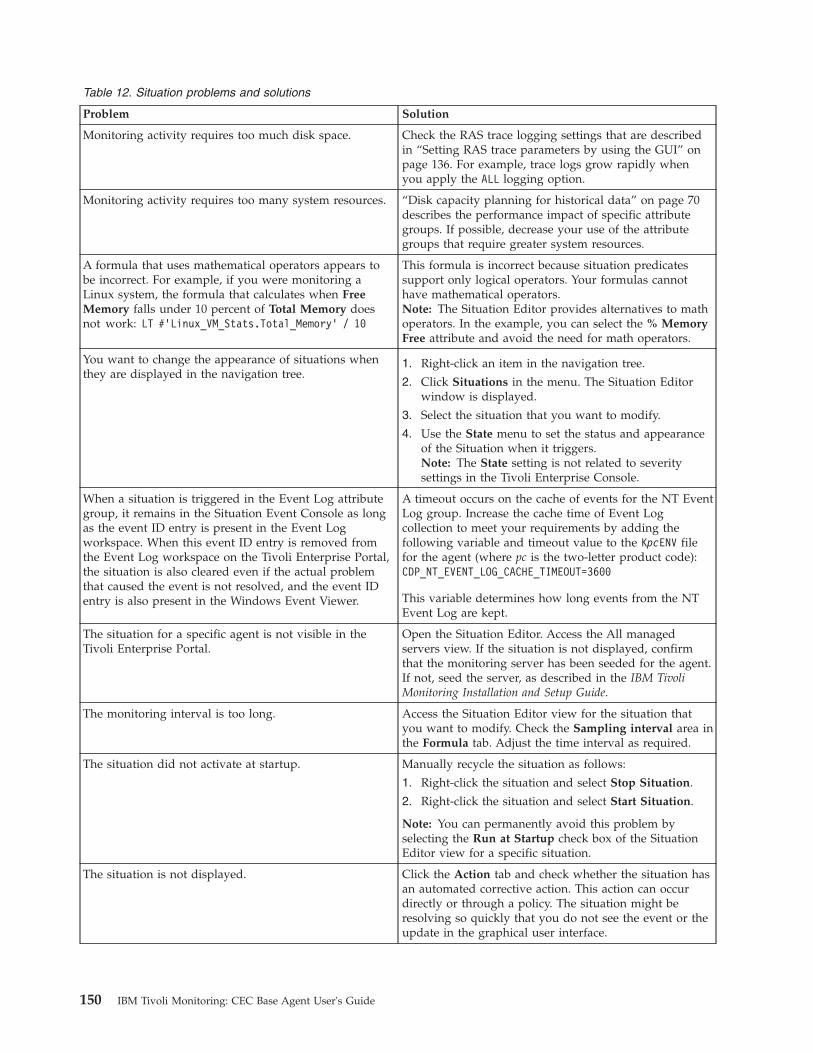
Table 12. Situation problems and solutions
Problem Solution
Monitoring activity requires too much disk space. Check the RAS trace logging settings that are describedin “Setting RAS trace parameters by using the GUI” onpage 136. For example, trace logs grow rapidly whenyou apply the ALL logging option.
Monitoring activity requires too many system resources. “Disk capacity planning for historical data” on page 70describes the performance impact of specific attributegroups. If possible, decrease your use of the attributegroups that require greater system resources.
A formula that uses mathematical operators appears tobe incorrect. For example, if you were monitoring aLinux system, the formula that calculates when FreeMemory falls under 10 percent of Total Memory doesnot work: LT #’Linux_VM_Stats.Total_Memory’ / 10
This formula is incorrect because situation predicatessupport only logical operators. Your formulas cannothave mathematical operators.Note: The Situation Editor provides alternatives to mathoperators. In the example, you can select the % MemoryFree attribute and avoid the need for math operators.
You want to change the appearance of situations whenthey are displayed in the navigation tree.
1. Right-click an item in the navigation tree.
2. Click Situations in the menu. The Situation Editorwindow is displayed.
3. Select the situation that you want to modify.
4. Use the State menu to set the status and appearanceof the Situation when it triggers.Note: The State setting is not related to severitysettings in the Tivoli Enterprise Console.
When a situation is triggered in the Event Log attributegroup, it remains in the Situation Event Console as longas the event ID entry is present in the Event Logworkspace. When this event ID entry is removed fromthe Event Log workspace on the Tivoli Enterprise Portal,the situation is also cleared even if the actual problemthat caused the event is not resolved, and the event IDentry is also present in the Windows Event Viewer.
A timeout occurs on the cache of events for the NT EventLog group. Increase the cache time of Event Logcollection to meet your requirements by adding thefollowing variable and timeout value to the KpcENV filefor the agent (where pc is the two-letter product code):CDP_NT_EVENT_LOG_CACHE_TIMEOUT=3600
This variable determines how long events from the NTEvent Log are kept.
The situation for a specific agent is not visible in theTivoli Enterprise Portal.
Open the Situation Editor. Access the All managedservers view. If the situation is not displayed, confirmthat the monitoring server has been seeded for the agent.If not, seed the server, as described in the IBM TivoliMonitoring Installation and Setup Guide.
The monitoring interval is too long. Access the Situation Editor view for the situation thatyou want to modify. Check the Sampling interval area inthe Formula tab. Adjust the time interval as required.
The situation did not activate at startup. Manually recycle the situation as follows:
1. Right-click the situation and select Stop Situation.
2. Right-click the situation and select Start Situation.
Note: You can permanently avoid this problem byselecting the Run at Startup check box of the SituationEditor view for a specific situation.
The situation is not displayed. Click the Action tab and check whether the situation hasan automated corrective action. This action can occurdirectly or through a policy. The situation might beresolving so quickly that you do not see the event or theupdate in the graphical user interface.
150 IBM Tivoli Monitoring: CEC Base Agent User's Guide

Table 12. Situation problems and solutions (continued)
Problem Solution
An Alert event did not occur even though the predicatewas correctly specified.
Check the logs, reports, and workspaces.
A situation fires on an unexpected managed object. Confirm that you distributed and started the situation onthe correct managed system.
The product did not distribute the situation to amanaged system.
Click the Distribution tab and check the distributionsettings for the situation.
The situation does not fire. This problem can be caused when incorrect predicatesare present in the formula that defines the situation. Forexample, the managed object shows a state that normallytriggers a monitoring event, but the situation is not truebecause the wrong attribute is specified in the formula.
In the Formula tab, analyze predicates as follows:
1. Click the fx icon in the Formula area. The Showformula window is displayed.
a. Confirm the following details in the Formula areaof the window:
v The attributes that you intend to monitor arespecified in the formula.
v The situations that you intend to monitor arespecified in the formula.
v The logical operators in the formula match yourmonitoring goal.
v The numeric values in the formula match yourmonitoring goal.
b. (Optional) Select the Show detailed formulacheck box to see the original names of attributesin the application or operating system that youare monitoring.
c. Click OK to dismiss the Show formula window.
2. (Optional) In the Formula area of the Formula tab,temporarily assign numeric values that immediatelytrigger a monitoring event. The triggering of theevent confirms that other predicates in the formulaare valid.Note: After you complete this test, you must restorethe numeric values to valid levels so that you do notgenerate excessive monitoring data based on yourtemporary settings.
For additional information about situations that do notfire, see “Situations are not firing” in the IBM TivoliMonitoring Troubleshooting Guide.
Situation events are not displayed in the Events Consoleview of the workspace.
Associate the situation with a Navigator item.Note: The situation does not need to be displayed in theworkspace. It is sufficient that the situation is associatedwith any Navigator item.
Chapter 9. Troubleshooting 151
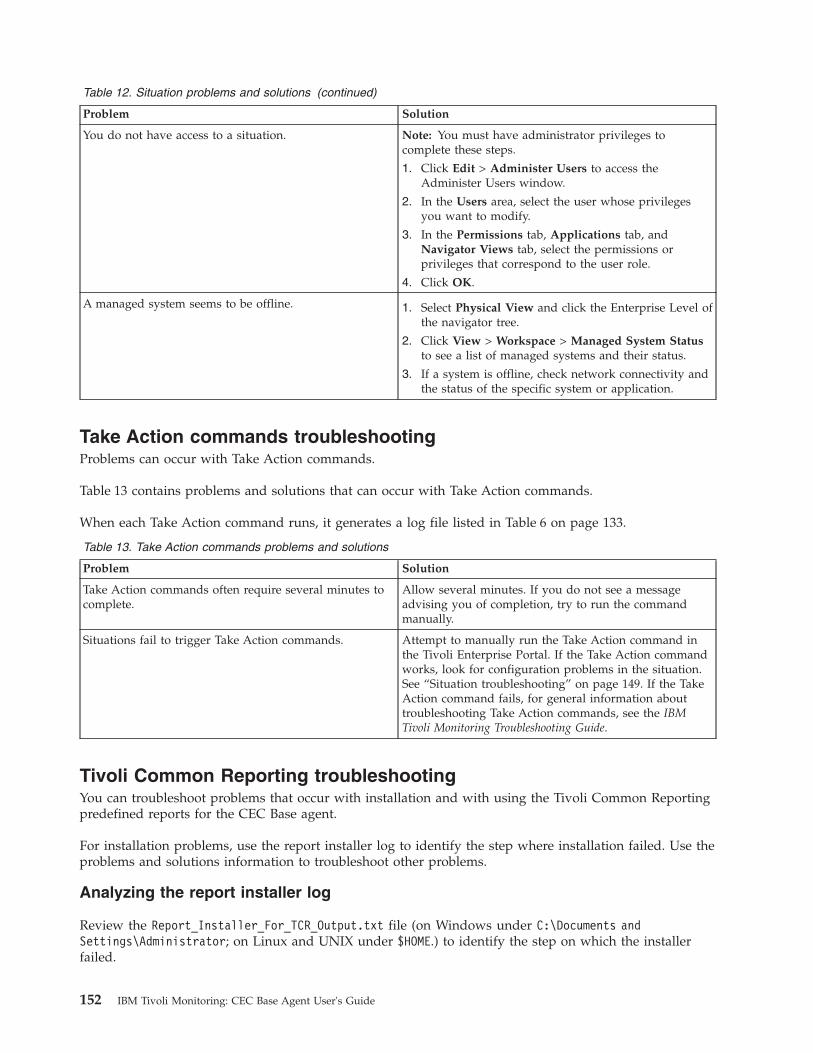
Table 12. Situation problems and solutions (continued)
Problem Solution
You do not have access to a situation. Note: You must have administrator privileges tocomplete these steps.
1. Click Edit > Administer Users to access theAdminister Users window.
2. In the Users area, select the user whose privilegesyou want to modify.
3. In the Permissions tab, Applications tab, andNavigator Views tab, select the permissions orprivileges that correspond to the user role.
4. Click OK.
A managed system seems to be offline. 1. Select Physical View and click the Enterprise Level ofthe navigator tree.
2. Click View > Workspace > Managed System Statusto see a list of managed systems and their status.
3. If a system is offline, check network connectivity andthe status of the specific system or application.
Take Action commands troubleshootingProblems can occur with Take Action commands.
Table 13 contains problems and solutions that can occur with Take Action commands.
When each Take Action command runs, it generates a log file listed in Table 6 on page 133.
Table 13. Take Action commands problems and solutions
Problem Solution
Take Action commands often require several minutes tocomplete.
Allow several minutes. If you do not see a messageadvising you of completion, try to run the commandmanually.
Situations fail to trigger Take Action commands. Attempt to manually run the Take Action command inthe Tivoli Enterprise Portal. If the Take Action commandworks, look for configuration problems in the situation.See “Situation troubleshooting” on page 149. If the TakeAction command fails, for general information abouttroubleshooting Take Action commands, see the IBMTivoli Monitoring Troubleshooting Guide.
Tivoli Common Reporting troubleshootingYou can troubleshoot problems that occur with installation and with using the Tivoli Common Reportingpredefined reports for the CEC Base agent.
For installation problems, use the report installer log to identify the step where installation failed. Use theproblems and solutions information to troubleshoot other problems.
Analyzing the report installer log
Review the Report_Installer_For_TCR_Output.txt file (on Windows under C:\Documents andSettings\Administrator; on Linux and UNIX under $HOME.) to identify the step on which the installerfailed.
152 IBM Tivoli Monitoring: CEC Base Agent User's Guide

Sample log output========================================INSTALLATION COMPLETED.========================================The status of installation steps:TCRRunDBScripts(runDbScript): FAILEDINFORMATION: /tmp/450480.tmp/reports/itmfvs/build.xml:31:The <fileset> type doesn’t support the "erroronmissingdir" attribute.InstallReportsAction(IBM Tivoli Monitoring forVirtual Environments Reports v7.1): SUCCESSCognosDataSource(TDW): SUCCESS========================================
AnalysisIn the sample log, the success or failure of each step is evident:1. InstallReportsAction (Step 1 - Importing Reports) succeeded.2. CognosDataSource(TDW) (Step 2 - Defining the Tivoli Data Warehouse data source in Cognos)
succeeded.3. RunDBScripts (Step 3 - Updating schema by running scripts against the Tivoli Data
Warehouse) failed.
Step 2: Define the Tivoli Data Warehouse data source in Cognos.Possible causes of the failure:v The database alias that is specified during installation did not match the cataloged DB2
database alias, the Oracle local TNS service name, or the MS SQL Server ODBC data sourcename.
v The credentials are incorrect for connecting to the Tivoli Data Warehouse.
Solution:v Ensure that you installed the database client on the same server as Tivoli Common Reporting
and cataloged the database. If you are using Oracle, the TNS service name must be defined inthe tnsnames.ora file. If you are using MS SQL server, the ODBC data source must be defined .See Connecting to the Tivoli Data Warehouse using the database client over ODBC in the IBMTivoli Monitoring Administrator's Guide (http://publib.boulder.ibm.com/infocenter/tivihelp/v15r1/topic/com.ibm.itm.doc_6.2.3/tcr_tdwconnect.htm). If you already have a Tivoli DataWarehouse data source that is defined, adding another one overwrites the existing data source.
Step 3: Make schema updatesPossible causes of failure:v Database administrative privileges (such as db2admin or sys) are required for this step; if user
is specified as ITMUSER, the schema cannot be updated.v Database issues such as connectivity problems, full logs, space issues, or any other performance
problems that prevent writing to the database.
Solution:v An error at Step 3 is accompanied by an informational message that contains SQL errors with
SQL codes. You can search on the SQL code to determine the problem.v If Time Dimension tables are present in the database, you can choose to skip the schema
update (JDBC) step while you are running the dashboard installer. If you want to create timedimension with a different granularity, you must edit the following sql file:1. Go to reports package\reports\cognos_reports\itmfvs\db_scripts.2. Open call_proc_DB2.sql , call_proc_MSSQL.sql, or call_proc_ORACLE.sql depending on
the database that is used.3. Edit the last parameter in the call to IBM_TRAM.CREATE_TIME_DIMENSION.
Notes
Chapter 9. Troubleshooting 153
v The database scripts for creating indexes are provided for enhanced reporting performance inthe Tivoli Data Warehouse. If your data warehouse is not prepared with history beforeinstallation, this step is skipped by the installer. You can manually run one the followingscripts, depending on your database type:– create_index_DB2.sql
– create_index_MSSQL.sql
– create_index_ORACLE.sql
For more information, see Creating shared dimensions tables and populating the timedimensions table in the IBM Tivoli Monitoring Administrator's Guide (http://pic.dhe.ibm.com/infocenter/tivihelp/v15r1/topic/com.ibm.itm.doc_6.2.3fp1/adminuse/tcr_reports_dimensionsshared.htm).
v Although indexes help to enhance report performance, some limitations apply: Use indexesonly on large tables with thousands of rows; because indexes degrade the performance ofinsert, update, and delete operations on a table.You can run a script to drop these indexes if you run into either of these performance issues:– drop_index_DB2.sql
– drop_index_MSSQL.sql
– drop_index_ORACLE.sql
v Connections under the Tivoli Data Warehouse are overwritten by the report installer.Overwriting these connections is a limitation of the current installer.
v The privileges that are required while you are running the installer are ITMUSER (database user)for the Tivoli Data Warehouse creation step and ADMIN (database administrator) for the schemaupdate step. The Database Test connection for the schema update panel does not check forprivileges of the database user. Installation fails at the schema update step if the database userdoes not have administrative privileges.
Problems and solutions
Table 14 on page 155 contains problems and solutions that can occur with the Tivoli Common Reportingpredefined reports for IBM Tivoli Monitoring: CEC Base Agent. See the Tivoli Common ReportingInformation Center (http://pic.dhe.ibm.com/infocenter/tivihelp/v3r1/topic/com.ibm.tivoli.tcr.doc_211/ic-home.html) for more information about troubleshooting for the Tivoli Common Reporting tool.
For timeout problems, if the default timeout values for the Tivoli Common Reporting or the Cognosconsole login is too short, you can change the settings. If your Java virtual machine runs out of memory,you can increase the heap size.
154 IBM Tivoli Monitoring: CEC Base Agent User's Guide
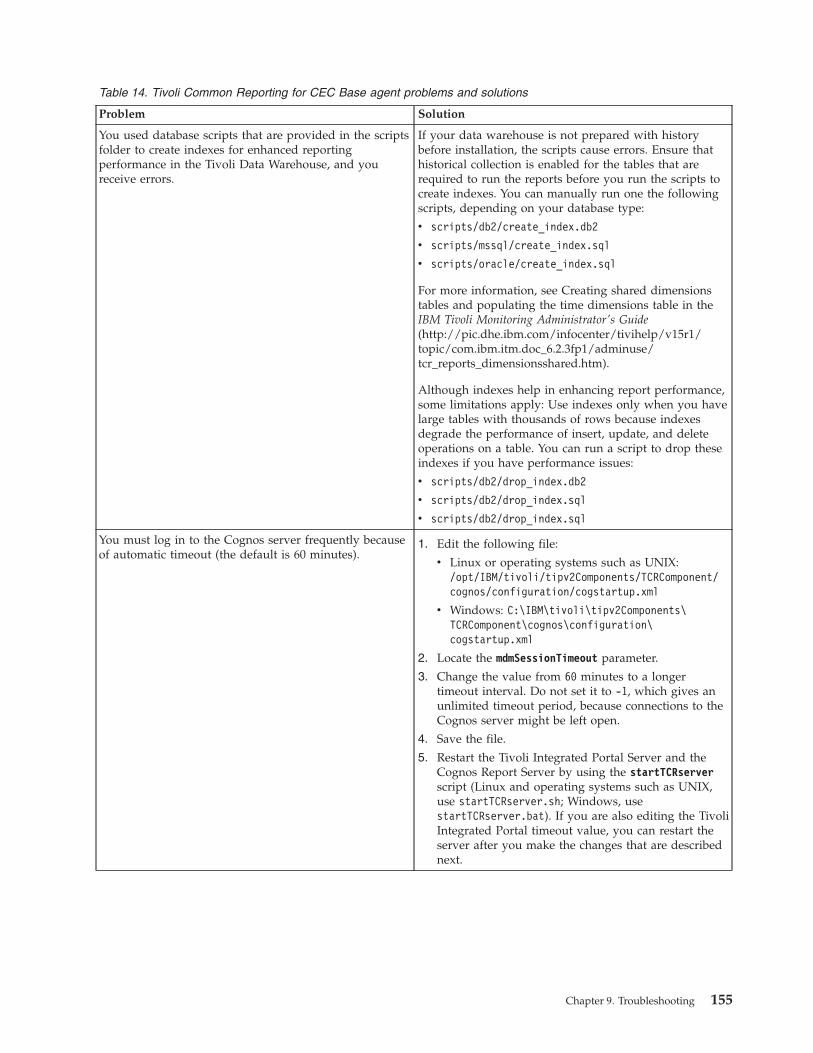
Table 14. Tivoli Common Reporting for CEC Base agent problems and solutions
Problem Solution
You used database scripts that are provided in the scriptsfolder to create indexes for enhanced reportingperformance in the Tivoli Data Warehouse, and youreceive errors.
If your data warehouse is not prepared with historybefore installation, the scripts cause errors. Ensure thathistorical collection is enabled for the tables that arerequired to run the reports before you run the scripts tocreate indexes. You can manually run one the followingscripts, depending on your database type:
v scripts/db2/create_index.db2
v scripts/mssql/create_index.sql
v scripts/oracle/create_index.sql
For more information, see Creating shared dimensionstables and populating the time dimensions table in theIBM Tivoli Monitoring Administrator's Guide(http://pic.dhe.ibm.com/infocenter/tivihelp/v15r1/topic/com.ibm.itm.doc_6.2.3fp1/adminuse/tcr_reports_dimensionsshared.htm).
Although indexes help in enhancing report performance,some limitations apply: Use indexes only when you havelarge tables with thousands of rows because indexesdegrade the performance of insert, update, and deleteoperations on a table. You can run a script to drop theseindexes if you have performance issues:
v scripts/db2/drop_index.db2
v scripts/db2/drop_index.sql
v scripts/db2/drop_index.sql
You must log in to the Cognos server frequently becauseof automatic timeout (the default is 60 minutes).
1. Edit the following file:
v Linux or operating systems such as UNIX:/opt/IBM/tivoli/tipv2Components/TCRComponent/cognos/configuration/cogstartup.xml
v Windows: C:\IBM\tivoli\tipv2Components\TCRComponent\cognos\configuration\cogstartup.xml
2. Locate the mdmSessionTimeout parameter.
3. Change the value from 60 minutes to a longertimeout interval. Do not set it to -1, which gives anunlimited timeout period, because connections to theCognos server might be left open.
4. Save the file.
5. Restart the Tivoli Integrated Portal Server and theCognos Report Server by using the startTCRserverscript (Linux and operating systems such as UNIX,use startTCRserver.sh; Windows, usestartTCRserver.bat). If you are also editing the TivoliIntegrated Portal timeout value, you can restart theserver after you make the changes that are describednext.
Chapter 9. Troubleshooting 155

Table 14. Tivoli Common Reporting for CEC Base agent problems and solutions (continued)
Problem Solution
You are prompted to log in again to the Tivoli IntegratedPortal after being logged in for a while, so you wouldlike to increase the session timeout.
Use the WebSphere Administrative Console to set thesession timeout and LTPA timeout values to largervalues. To open the administrative console from withinthe Tivoli Integrated Portal, select Settings > WebSphereAdministrative Console in the navigation tree and clickLaunch WebSphere administrative console.
1. Set the session timeout for Tivoli Integrated Portalapplication (ISC):
a. In the left panel, expand Applications andApplication Types, click Websphere Enterpriseapplications.
b. In the list of Enterprise Applications, select isc.
c. On the Configuration tab, click Sessionmanagement.
d. For the Session timeout setting, specify thenumber of minutes you want for the timeout orspecify No timeout.
e. Click OK; click Save to save the changes.
2. Set the LTPA timeout:
a. In the left panel of the WebSphere AdministrativeConsole, expand Security and click Globalsecurity.
b. In the Global security panel, Authenticationsection, click LTPA.
c. Enter the LTPA timeout value that you want inminutes.
d. Click OK; click Save to save the changes.
Important: Use high or unlimited values for timeoutswith caution because such values can lead to poor serverperformance or out of memory conditions. Thesetimeouts are used by the server to release storage that isassociated with sessions that are no longer active. Suchsessions can occur when you close your browser withoutlogging off or are disconnected from the server becauseof network disruptions.
156 IBM Tivoli Monitoring: CEC Base Agent User's Guide

Table 14. Tivoli Common Reporting for CEC Base agent problems and solutions (continued)
Problem Solution
You get Java core dumps when you are running out ofJava virtual machine (JVM) memory.
If your JVM runs out of memory within the TivoliIntegrated Portal, you receive a Java core dump. TheJava core files are in the /opt/IBM/tivoli/tipv2/profiles/TIPProfile directory on Linux and operatingsystems such as UNIX, and in C:\ibm\tivoli\tipv2\profiles\TIPProfile on Windows. This problem iscommon on AIX because the default maximum heap sizefor Java 1.6 on AIX is low. Set the maximum heap size to512 MB or higher.
Use the following steps to update the maximum heapsize for the Tivoli Integrated Portal JVM:
1. Edit the server.xml file in the following directory:
v Linux and operating systems such as UNIX:/data/IBM/tivoli/tipv2/profiles/TIPProfile/config/cells/TIPCell/nodes/TIPNode/servers/server1
v Windows: C:\IBM\tivoli\tipv2\profiles\TIPProfile\config\cells\TIPCell\nodes\TIPNode\servers\server1
2. Locate the genericJvmArguments=""> parameter nearthe end of the file. Notice that there are no defaultJVM heap settings.
3. Add –Xmx512m or –Xmx1024m to thegenericJvmArguments, depending on how muchsystem memory you have on your server. Forexample, genericJvmArguments="-Xmx1024m">
4. Restart the Tivoli Integrated Portal Server and theCognos Report Server by using the startTCRserverscript (Linux and operating systems such as UNIX,use startTCRserver.sh; Windows, usestartTCRserver.bat).
Note: . The values that are given here are appropriatefor typical cases, but be aware that the heap size mightalready be set for other applications. The heap sizeadjustment must be finely tuned. If set too high, the Javaprocess can use too much memory and slow the system.See IBM developerWorks Roadmap for WebSphereApplication Server - Tuning (http://www.ibm.com/developerworks/websphere/zones/was/roadmaps/roadmap_was70.html#Tuning) for more information.
Chapter 9. Troubleshooting 157

Table 14. Tivoli Common Reporting for CEC Base agent problems and solutions (continued)
Problem Solution
When you run Tivoli Common Reporting reports or testthe database connection in Cognos, you get errors (suchas The logon failed) that reference libdb2.a.
Ensure that you set up the correct library pathenvironment variables. Complete the following steps.The example uses LD_LIBRARY_PATH, which might beLIBPATH on some operating systems.
1. Stop Tivoli Common Reporting:
/opt/IBM/tivoli/tipv2Components/TCRComponent/bin/stopTCRserver.sh tipadmin tippass
2. Open the /opt/IBM/tivoli/tipv2Components/TCRComponent/bin/startTCRserver.sh file in a texteditor and add the following two lines at line 26 ofthe script (before WebSphere being started):
export LD_LIBRARY_PATH=/opt/ibm/db2/V9.7/lib32:$LD_LIBRARY_PATH .updated troubleshooting/home/db2inst1/sqllib/db2profile
3. Start Tivoli Common Reporting:
/opt/IBM/tivoli/tipv2Components/TCRComponent/bin/startTCRserver.sh tipadmin tippass
Another option is to add these environment variables toyour .bashrc/.profile so that the variables are set upevery time you log in to the system.
The reports schema update fails. An SQL error message isin the Report_Installer_For_TCR_Output.txt log file.
The error message indicates that the transaction log fileran out of space. Set the following database parametersto increase the size of the transaction log file:
v LOGBUFSIZE: 1024
v BUFFPAGE: 2000 or 3000
v Number of primary log files: 20
v Log file size: 8192
v Number of secondary log files: 10
158 IBM Tivoli Monitoring: CEC Base Agent User's Guide

Table 14. Tivoli Common Reporting for CEC Base agent problems and solutions (continued)
Problem Solution
You have trouble with the database connection. The Tivoli Monitoring reports must connect to the TivoliData Warehouse to run. The data source that is calledTDW is defined in Cognos.
Test the Database Connection to the Tivoli DataWarehouse:
1. Depending on the database type, make sure the TivoliData Warehouse is cataloged locally in the databaseclient (DB2), the local TNS service name is defined intnsnames.ora (Oracle), or the ODBC data source wascreated (Microsoft SQL Server). The alias/tns servicename or odbc data source name is used in the datasource connection.
2. Test the connection to the data warehouse:
a. Select TCR > Launch > Administration >Configuration > Data Sources > TDW.
b. Click TDW to discover the data sourceconnections (also called TDW).
c. Click the test icon next to TDW to test theconnection.
3. If TDW is not defined, manually define the datasource in Cognos:
a. Use the database client to catalog the Tivoli DataWarehouse database.
b. Log in to the Tivoli Integrated Portal.
c. In the navigation tree, select Reporting >Common Reporting.
d. Follow the instructions under Configuringdatabase connection (http://publib.boulder.ibm.com/infocenter/tivihelp/v3r1/topic/com.ibm.tivoli.tcr.doc_211/ttcr_config_db.html) in the Tivoli CommonReporting information center to create the datasource in Cognos. Make sure that you call thisdata source TDW.
You are able to connect to Tivoli Data Warehouse byusing the database client but, when you run a report,you are asked to enter your database credentials again.
In the Work with reports page, you are prompted toType a user ID and password and you get the followingmessage: An attempt to connect to the data sourcefailed.
If you get this prompt while you are attempting to run areport, the database connection under TDW is notconfigured properly.
Some common causes might be that the connection is toan invalid DSN, or an incorrect user ID was given, or thedatabase server might be down. Confirm that youcreated the correct database connection and configure theTivoli Data Warehouse correctly before you run thereport again. For details, see Configuring databaseconnection (http://pic.dhe.ibm.com/infocenter/tivihelp/v3r1/topic/com.ibm.tivoli.tcr.doc_211/ttcr_config_db.html).
Chapter 9. Troubleshooting 159
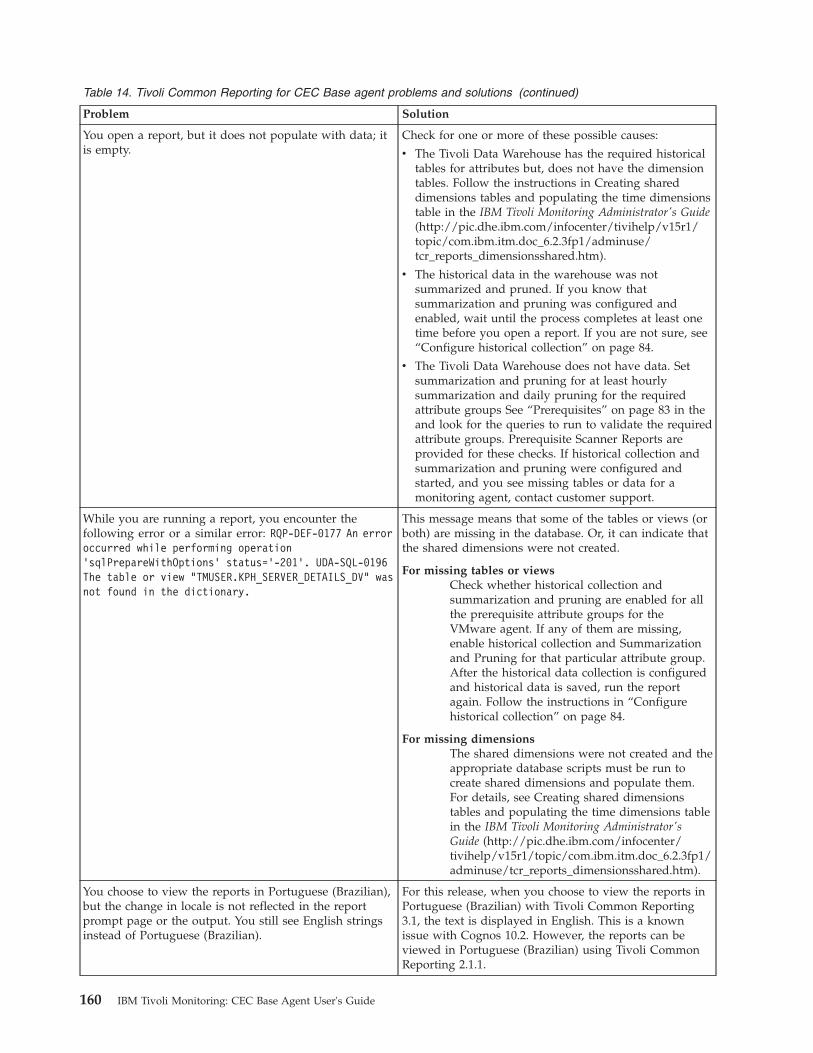
Table 14. Tivoli Common Reporting for CEC Base agent problems and solutions (continued)
Problem Solution
You open a report, but it does not populate with data; itis empty.
Check for one or more of these possible causes:
v The Tivoli Data Warehouse has the required historicaltables for attributes but, does not have the dimensiontables. Follow the instructions in Creating shareddimensions tables and populating the time dimensionstable in the IBM Tivoli Monitoring Administrator's Guide(http://pic.dhe.ibm.com/infocenter/tivihelp/v15r1/topic/com.ibm.itm.doc_6.2.3fp1/adminuse/tcr_reports_dimensionsshared.htm).
v The historical data in the warehouse was notsummarized and pruned. If you know thatsummarization and pruning was configured andenabled, wait until the process completes at least onetime before you open a report. If you are not sure, see“Configure historical collection” on page 84.
v The Tivoli Data Warehouse does not have data. Setsummarization and pruning for at least hourlysummarization and daily pruning for the requiredattribute groups See “Prerequisites” on page 83 in theand look for the queries to run to validate the requiredattribute groups. Prerequisite Scanner Reports areprovided for these checks. If historical collection andsummarization and pruning were configured andstarted, and you see missing tables or data for amonitoring agent, contact customer support.
While you are running a report, you encounter thefollowing error or a similar error: RQP-DEF-0177 An erroroccurred while performing operation’sqlPrepareWithOptions’ status=’-201’. UDA-SQL-0196The table or view "TMUSER.KPH_SERVER_DETAILS_DV" wasnot found in the dictionary.
This message means that some of the tables or views (orboth) are missing in the database. Or, it can indicate thatthe shared dimensions were not created.
For missing tables or viewsCheck whether historical collection andsummarization and pruning are enabled for allthe prerequisite attribute groups for theVMware agent. If any of them are missing,enable historical collection and Summarizationand Pruning for that particular attribute group.After the historical data collection is configuredand historical data is saved, run the reportagain. Follow the instructions in “Configurehistorical collection” on page 84.
For missing dimensionsThe shared dimensions were not created and theappropriate database scripts must be run tocreate shared dimensions and populate them.For details, see Creating shared dimensionstables and populating the time dimensions tablein the IBM Tivoli Monitoring Administrator'sGuide (http://pic.dhe.ibm.com/infocenter/tivihelp/v15r1/topic/com.ibm.itm.doc_6.2.3fp1/adminuse/tcr_reports_dimensionsshared.htm).
You choose to view the reports in Portuguese (Brazilian),but the change in locale is not reflected in the reportprompt page or the output. You still see English stringsinstead of Portuguese (Brazilian).
For this release, when you choose to view the reports inPortuguese (Brazilian) with Tivoli Common Reporting3.1, the text is displayed in English. This is a knownissue with Cognos 10.2. However, the reports can beviewed in Portuguese (Brazilian) using Tivoli CommonReporting 2.1.1.
160 IBM Tivoli Monitoring: CEC Base Agent User's Guide

Table 14. Tivoli Common Reporting for CEC Base agent problems and solutions (continued)
Problem Solution
In the Reports Installer, when you complete thefollowing steps to install reports, you have someproblems:
1. On the Choose the reports for the installation page,select all reports that you want to install, and thenclick Next. The Cognos Engine Configuration page isdisplayed.
2. On the Cognos Engine Configuration page, clickPrevious to return to the Choose the InstallationFolder page.
3. On the Choose the Installation Folder page, clickNext.
Problem: The Choose the reports for the installationpage that contains selected check boxes for all reportsis displayed, and Next is disabled.
4. Clear all check boxes for the reports, and select thereports to install again. The Next button becomesavailable.
5. Click Next.
Problem: The following message is displayed on thenext page: THERE ARE NO ITEMS SELECTED FOR THEINSTALLATION.
Restart the Reports Installer.
Labels are not displayed on the installation panels or inthe dialog boxes on an AIX operating system withTurkish locales when the Report Installer was run onJava 6.
This problem occurs because both the background colorand the font color are white. Use one of the followingworkarounds:
v Change the style palette to defaultmono when theReport Installer is running (if it is not set todefaultmono by default). This solution works for Java5 and Java 6 and is the solution that is preferred.
v Run the Report Installer by using Java 5. You canspecify Java by using the following command:
setup_aix.bin lax_vm/opt/ibm/java5/jre/bin/java
Support informationIf you have a problem with your IBM software, you want to resolve it quickly.
IBM provides the following ways for you to obtain the support you need:
OnlineThe following websites contain troubleshooting information:v Go to the IBM Software Support website (http://www.ibm.com/support/entry/portal/
software) and follow the instructions.v Go to the Application Performance Management Wiki (http://www.ibm.com/developerworks/
servicemanagement/apm/index.html). Feel free to contribute to this wiki.
IBM Support AssistantThe IBM Support Assistant (ISA) is a free local software serviceability workbench that helps youresolve questions and problems with IBM software products. The ISA provides quick access to
Chapter 9. Troubleshooting 161

support-related information and serviceability tools for problem determination. To install the ISAsoftware, go to the IBM Support Assistant website (http://www.ibm.com/software/support/isa).
162 IBM Tivoli Monitoring: CEC Base Agent User's Guide

Appendix A. Event mapping
The Tivoli Event Integration Facility (EIF) interface is used to forward situation events to TivoliNetcool/OMNIbus or Tivoli Enterprise Console.
EIF events specify an event class, and the event data is specified as name-value pairs that identify thename of an event slot and the value for the slot. An event class can have subclasses. IBM TivoliMonitoring provides the base event class definitions and a set of base slots that are included in allmonitoring events. Agents extend the base event classes to define subclasses that include agent-specificslots. For CEC Base agent events, the event classes correspond to the agent attribute groups, and theagent-specific slots correspond to the attributes in the attribute group.
The situation editor in the Tivoli Enterprise Portal can be used to perform custom mapping of data to EIFslots instead of using the default mapping described in this topic. For more information about EIF slotcustomization, see the Tivoli Enterprise Portal User's Guide.
Tivoli Enterprise Console requires that event classes and their slots are defined in BAROC (Basic Recorderof Objects in C) files. Each agent provides a BAROC file that contains event class definitions for the agentand is installed on the Tivoli Enterprise Monitoring Server in the TECLIB directory (install_dir/cms/TECLIB for Windows systems and install_dir/tables/TEMS_hostname/TECLIB for UNIX systems) whenapplication support for the agent is installed. The BAROC file for the agent and the base BAROC filesprovided with Tivoli Monitoring must also be installed onto the Tivoli Enterprise Console. For details, see“Setting up event forwarding to Tivoli Enterprise Console” in the IBM Tivoli Monitoring Installation andSetup Guide.
Each of the event classes is a child of KPK_Base and is defined in the kpk.baroc (version 06.22.02) file.The KPK_Base event class can be used for generic rules processing for any event from the IBM TivoliMonitoring: CEC Base Agent.
For events that are generated by situations in the AME attribute group, events are sent by using theITM_KPK_AME event class. This event class contains the following slots:v node: STRINGv timestamp: STRINGv lpar_name: STRINGv lpar_number: REALv lpar_number_enum: STRINGv machine_id: STRINGv kpk_hostname: STRINGv true_memory_size_mb: REALv true_memory_size_mb_enum: STRINGv target_memory_expansion_factor: REALv target_memory_expansion_factor_enum: STRINGv current_memory_expansion_factor: REALv current_memory_expansion_factor_enum: STRINGv effective_memory_size_mb: REALv effective_memory_size_mb_enum: STRINGv compressed_mem_size_mb: REALv compressed_mem_size_mb_enum: STRING
© Copyright IBM Corp. 2007, 2013 163

v compressed_mem_inuse_pct: REALv compressed_mem_inuse_pct_enum: STRINGv compressed_mem_free_pct: REALv compressed_mem_free_pct_enum: STRINGv compression_ratio: REALv compression_ratio_enum: STRINGv compressed_mem_pageins_per_sec: REALv compressed_mem_pageins_per_sec_enum: STRINGv compressed_mem_pageouts_per_sec: REALv compressed_mem_pageouts_per_sec_enum: STRINGv uncompressed_mem_size_mb: REALv uncompressed_mem_size_mb_enum: STRINGv uncompressed_mem_inuse_pct: REALv uncompressed_mem_inuse_pct_enum: STRINGv uncompressed_mem_free_pct: REALv uncompressed_mem_free_pct_enum: STRINGv cpu_used_pct: REALv cpu_used_pct_enum: STRINGv deficit_memory_size_mb: REALv deficit_memory_size_mb_enum: STRINGv deficit_expansion_factor: REALv deficit_expansion_factor_enum: STRINGv compressed_data_size_mb: REALv compressed_data_size_mb_enum: STRINGv uncompressed_data_size_mb: REALv uncompressed_data_size_mb_enum: STRINGv type_model_serial: STRING
For events that are generated by situations in the AMS Pools attribute group, events are sent by using theITM_KPK_AMS_POOLS event class. This event class contains the following slots:v node: STRINGv timestamp: STRINGv ams_pool_id: REALv ams_pool_id_enum: STRINGv ams_mempool_size: REALv ams_mempool_size_enum: STRINGv ams_total_mem_inuse: REALv ams_total_mem_inuse_enum: STRINGv ams_num_partions: REALv ams_num_partions_enum: STRINGv available_memory_pool_pct: REALv available_memory_pool_pct_enum: STRINGv machine_id: STRINGv type_model_serial: STRING
164 IBM Tivoli Monitoring: CEC Base Agent User's Guide
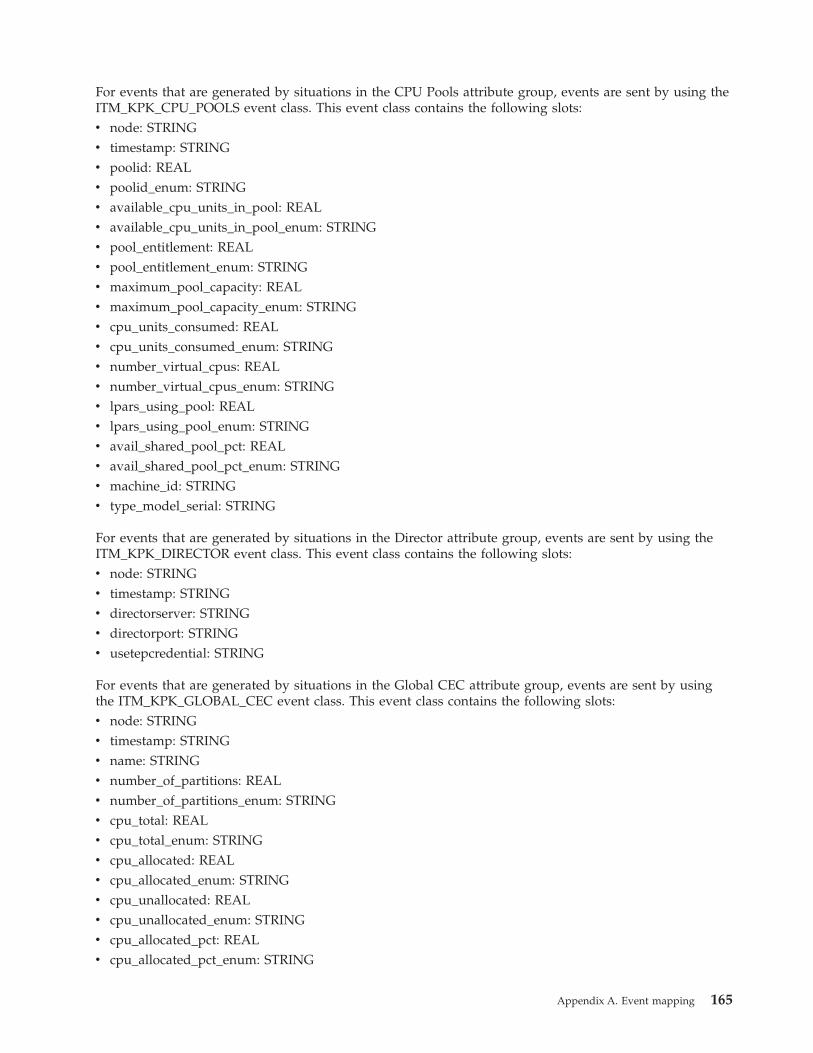
For events that are generated by situations in the CPU Pools attribute group, events are sent by using theITM_KPK_CPU_POOLS event class. This event class contains the following slots:v node: STRINGv timestamp: STRINGv poolid: REALv poolid_enum: STRINGv available_cpu_units_in_pool: REALv available_cpu_units_in_pool_enum: STRINGv pool_entitlement: REALv pool_entitlement_enum: STRINGv maximum_pool_capacity: REALv maximum_pool_capacity_enum: STRINGv cpu_units_consumed: REALv cpu_units_consumed_enum: STRINGv number_virtual_cpus: REALv number_virtual_cpus_enum: STRINGv lpars_using_pool: REALv lpars_using_pool_enum: STRINGv avail_shared_pool_pct: REALv avail_shared_pool_pct_enum: STRINGv machine_id: STRINGv type_model_serial: STRING
For events that are generated by situations in the Director attribute group, events are sent by using theITM_KPK_DIRECTOR event class. This event class contains the following slots:v node: STRINGv timestamp: STRINGv directorserver: STRINGv directorport: STRINGv usetepcredential: STRING
For events that are generated by situations in the Global CEC attribute group, events are sent by usingthe ITM_KPK_GLOBAL_CEC event class. This event class contains the following slots:v node: STRINGv timestamp: STRINGv name: STRINGv number_of_partitions: REALv number_of_partitions_enum: STRINGv cpu_total: REALv cpu_total_enum: STRINGv cpu_allocated: REALv cpu_allocated_enum: STRINGv cpu_unallocated: REALv cpu_unallocated_enum: STRINGv cpu_allocated_pct: REALv cpu_allocated_pct_enum: STRING
Appendix A. Event mapping 165

v cpu_unallocated_pct: REALv cpu_unallocated_pct_enum: STRINGv cpu_shared_pool_size: REALv cpu_shared_pool_size_enum: STRINGv memory_total_mb: REALv memory_total_mb_enum: STRINGv memory_allocated_mb: REALv memory_allocated_mb_enum: STRINGv memory_unallocated_mb: REALv memory_unallocated_mb_enum: STRINGv memory_allocated_pct: REALv memory_allocated_pct_enum: STRINGv memory_unallocated_pct: REALv memory_unallocated_pct_enum: STRINGv machine_id: STRINGv cpu_units_allocated: REALv cpu_units_allocated_enum: STRINGv cpu_units_unallocated: REALv cpu_units_unallocated_enum: STRINGv cpu_shared_pool_size_units: REALv cpu_shared_pool_size_units_enum: STRINGv shared_processor_pools: REALv shared_processor_pools_enum: STRINGv shared_physb: REALv shared_physb_enum: STRINGv dedicated_physb: REALv dedicated_physb_enum: STRINGv num_dedicated_mem_lpars: REALv num_dedicated_mem_lpars_enum: STRINGv num_shared_mem_lpars: REALv num_shared_mem_lpars_enum: STRINGv number_ams_pools: REALv number_ams_pools_enum: STRINGv type_model_serial: STRING
For events that are generated by situations in the HMC Switch attribute group, events are sent by usingthe ITM_KPK_HMC_SWITCH event class. This event class contains the following slots:v node: STRINGv timestamp: STRINGv event_type: REALv event_type_enum: STRINGv old_hmc: STRINGv new_hmc: STRINGv configured_hmc: STRING
166 IBM Tivoli Monitoring: CEC Base Agent User's Guide
For events that are generated by situations in the Mon LPars attribute group, events are sent by using theITM_KPK_MON_LPARS event class. This event class contains the following slots:v node: STRINGv timestamp: STRINGv lpar_name: STRINGv machine_id: STRINGv kpk_hostname: STRINGv os_version: STRINGv allocated_memory: REALv allocated_memory_enum: STRINGv allocated_memory_used_pct: REALv allocated_memory_used_pct_enum: STRINGv physical_memory_allocated_pct: REALv physical_memory_allocated_pct_enum: STRINGv cpu_allocated: REALv cpu_allocated_enum: STRINGv cpu_usr_pct: REALv cpu_usr_pct_enum: STRINGv cpu_sys_pct: REALv cpu_sys_pct_enum: STRINGv cpu_idle_pct: REALv cpu_idle_pct_enum: STRINGv cpu_wait_pct: REALv cpu_wait_pct_enum: STRINGv cpu_phys_ent_pct: REALv cpu_phys_ent_pct_enum: STRINGv virt_context_cpu_switches_per_sec: REALv virt_context_cpu_switches_per_sec_enum: STRINGv phantom_interrupts_per_sec: REALv phantom_interrupts_per_sec_enum: STRINGv shared_mode: REALv shared_mode_enum: STRINGv smt: REALv smt_enum: STRINGv capacity_weight: REALv capacity_weight_enum: STRINGv capped_mode: REALv capped_mode_enum: STRINGv donating: REALv donating_enum: STRINGv phy_busy_time_pct: REALv phy_busy_time_pct_enum: STRINGv memory_consumed_mb: REALv memory_consumed_mb_enum: STRINGv number_of_logical_cpus: REAL
Appendix A. Event mapping 167

v number_of_logical_cpus_enum: STRINGv physical_cpu_units_used: REALv physical_cpu_units_used_enum: STRINGv number_virtual_cpus: REALv number_virtual_cpus_enum: STRINGv max_cpu_cap_used_pct: REALv max_cpu_cap_used_pct_enum: STRINGv poolid: REALv poolid_enum: STRINGv physical_cpu_in_pool: REALv physical_cpu_in_pool_enum: STRINGv pool_entitlement: REALv pool_entitlement_enum: STRINGv maximum_pool_capacity: REALv maximum_pool_capacity_enum: STRINGv ams_mode: REALv ams_mode_enum: STRINGv ams_pool_id: REALv ams_pool_id_enum: STRINGv ams_pool_size: REALv ams_pool_size_enum: STRINGv ams_physical_mem: REALv ams_physical_mem_enum: STRINGv ams_mem_loaned: REALv ams_mem_loaned_enum: STRINGv ams_memory_entitlement: REALv ams_memory_entitlement_enum: STRINGv ams_memory_ent_inuse: REALv ams_memory_ent_inuse_enum: STRINGv hypervisor_page_ins: REALv hypervisor_page_ins_enum: STRINGv hypervisor_page_ins_time: REALv hypervisor_page_ins_time_enum: STRINGv ame_mode: REALv ame_mode_enum: STRINGv smt_threads: REALv smt_threads_enum: STRINGv type_model_serial: STRING
For events that are generated by situations in the Mon Unmon Alloc attribute group, events are sent byusing the ITM_KPK_MON_UNMON_ALLOC event class. This event class contains the following slots:v node: STRINGv timestamp: STRINGv monitored_shared_lpars: REALv monitored_shared_lpars_enum: STRING
168 IBM Tivoli Monitoring: CEC Base Agent User's Guide

v machine_id: STRINGv monitored_dedicated_lpars: REALv monitored_dedicated_lpars_enum: STRINGv unmonitored_active_lpars: REALv unmonitored_active_lpars_enum: STRINGv inactive_lpars: REALv inactive_lpars_enum: STRINGv total_monitored_memory_mb: REALv total_monitored_memory_mb_enum: STRINGv total_unmonitored_memory_mb: REALv total_unmonitored_memory_mb_enum: STRINGv total_monitored_cpu: REALv total_monitored_cpu_enum: STRINGv total_unmonitored_cpu: REALv total_unmonitored_cpu_enum: STRINGv total_monitored_cpu_used_pct: REALv total_monitored_cpu_used_pct_enum: STRINGv total_monitored_memory_used_pct: REALv total_monitored_memory_used_pct_enum: STRINGv total_monitored: REALv total_monitored_enum: STRINGv total_unmonitored: REALv total_unmonitored_enum: STRINGv total_monitored_cpu_used_units: REALv total_monitored_cpu_used_units_enum: STRINGv available_cpu_units_in_pool: REALv available_cpu_units_in_pool_enum: STRINGv cec_name: STRINGv type_model_serial: STRING
For events that are generated by situations in the Per LPAR attribute group, events are sent by using theITM_KPK_PER_LPAR event class. This event class contains the following slots:v node: STRINGv timestamp: STRINGv name: STRINGv id: REALv id_enum: STRINGv state: STRINGv environment: STRINGv cpu_allocated: REALv cpu_allocated_enum: STRINGv cpu_allocated_pct: REALv cpu_allocated_pct_enum: STRINGv memory_allocated_mb: REALv memory_allocated_mb_enum: STRING
Appendix A. Event mapping 169

v memory_allocated_pct: REALv memory_allocated_pct_enum: STRINGv capped_mode: STRINGv shared_mode: STRINGv machine_id: STRINGv monitoring_status: REALv monitoring_status_enum: STRINGv os_version: STRINGv kpk_hostname: STRINGv capacity_weight: REALv capacity_weight_enum: STRINGv poolid: REALv poolid_enum: STRINGv physical_cpu_in_pool: REALv physical_cpu_in_pool_enum: STRINGv pool_entitlement: REALv pool_entitlement_enum: STRINGv maximum_pool_capacity: REALv maximum_pool_capacity_enum: STRINGv type_model_serial: STRING
For events that are generated by situations in the Performance Object Status attribute group, events aresent by using the ITM_KPK_PERFORMANCE_OBJECT_STATUS event class. This event class contains thefollowing slots:v node: STRINGv timestamp: STRINGv query_name: STRINGv object_name: STRINGv object_type: REALv object_type_enum: STRINGv object_status: REALv object_status_enum: STRINGv error_code: REALv error_code_enum: STRING
For events that are generated by situations in the TADDM attribute group, events are sent by using theITM_KPK_TADDM event class. This event class contains the following slots:v node: STRINGv timestamp: STRINGv cec_mfg: STRINGv cec_model: STRINGv cec_sn: STRING
170 IBM Tivoli Monitoring: CEC Base Agent User's Guide

Appendix B. Discovery Library Adapter for the CEC Baseagent
The Tivoli Management Services Discovery Library Adapter (DLA) discovers resources and relationships,and creates a Discovery Library Book file for the agent.
About the DLA
The Book file follows the Discovery Library IdML schema and is used to populate the ConfigurationManagement Database (CMDB) and Tivoli Business Service Manager products. The Tivoli ManagementServices DLA discovers all LPARs in this CEC and related operating systems. For all systems with theCEC Base agent that are active and online at the Tivoli Enterprise Portal Server, information is includedin the discovery book for those resources. The Tivoli Management Services DLA discovers activeresources. It is run on demand and can be run periodically to discover resources that were not activeduring previous discoveries.
The DLA discovers the CEC Base agent components.
More information about DLAs
The following sources contain additional information about using the DLA program with all monitoringagents:v The IBM Tivoli Monitoring Administrator's Guide contains information about using the Tivoli
Management Services Discovery Library Adapter.v For information about using a DLA with Tivoli Application Dependency Discovery Manager (TADDM),
see the TADDM Information Center (http://publib.boulder.ibm.com/infocenter/tivihelp/v10r1/topic/com.ibm.taddm.doc_7.2/welcome_page/welcome.html).
DLA data model class types represented in CDMThe source application data objects map to classes in the Common Data Model (CDM) for the CEC Baseagent.
The following information is provided for each class:
CDM class nameClass name for which the agent is providing information
RelationshipsCDM relationships (hierarchical) between currently identified model objects
CDM attributes, agent attributes, descriptions, and examplesCDM and agent attributes that are required to create an instance of a resource, descriptions of theattributes, and examples of the attributes
DLA data model classes for the CEC Base agentEach agent that uses the Discovery Library Adapter has DLA data model classes defined for the agent.
The CEC Base agent has the following Discovery Library Adapter data model classes:v CECv LPARv VIOS
© Copyright IBM Corp. 2007, 2013 171

v AIXv VIOS OSv TMSAgent
CEC classThe CEC class represents the System p Central Electronics Complex (CEC).
CDM class namesys.SystemPComputerSystem
RelationshipsThis class has no relationships.
CDM attributes, agent attributes, descriptions, and examples
v CDM attribute: TypeDescription: A string used to appropriately render the desired icon in the TADDM UserInterface.Example: ComputerSystem
v CDM attribute: ManagedSystemNameAgent attribute: INODESTS.NODEDescription: The name of the IBMTivoli Monitoring component that provides data for themanagement of the CEC Base agent instance.Example: p7e07:PK
v CDM attribute: NameAgent attribute: KPH09MANAC.CEC_NAMEDescription: The name for the computer system as it is commonly known in the data center.This attribute is used by internal mechanisms of IBM Tivoli Application DependencyDiscovery Manager.Example: venus
v CDM attribute: LabelAgent attribute: KPH09MANAC.CEC_NAMEDescription: A system-generated, descriptive string used for displaying the instance.Example: venus
v CDM attribute: SerialNumberAgent attribute: KPH09MANAC.CEC_SNDescription: The serial number of the physical computer system, as it is provided by themanufacturer of the device.Example: 06E05C1
v CDM attribute: ManufacturerAgent attribute: KPH09MANAC.CEC_MFGDescription: The name of the manufacturer of the physical computer system.Example: IBM
v CDM attribute: ModelAgent attribute: KPH09MANAC.CEC_MODELDescription: The model number of the physical computer system, as it is provided by themanufacturer of the device.Example: 9117-MMA
v CDM attribute: HardwarePlatformDescription: Identifies the server to be an IBM PowerVM server.Example: pSeries
LPAR classAn LPAR is a logical partition of the physical hardware where an operating system instance can run.
172 IBM Tivoli Monitoring: CEC Base Agent User's Guide

CDM class namesys.ComputerSystem
Relationships
v virtualizesSource: KPH02VERSI.HOSTNAME:KPH10MANAL.CEC_NAME-KPH10MANAL.LPAR_NAME-LPARTarget: KPH02VERSI.HOSTNAME:KPH10MANAL.CEC_NAME-CECExample: virtualizes source="ipv4-151.austin.ibm.com:venus:ipv4-241-LPAR"target="ipv4-151.austin.ibm.com:venus-CEC"
CDM attributes, agent attributes, descriptions, and examples
v CDM attribute: TypeDescription: A string used to appropriately render the desired icon in the TADDM UserInterface.Example: ComputerSystem
v CDM attribute: NameAgent attribute: KPH10MANAL.LPAR_NAMEDescription: The name for the computer system as it is commonly known in the data center.This attribute is used by internal mechanisms of IBM Tivoli Application DependencyDiscovery Manager.Example: ipv4-241
v CDM attribute: LabelAgent attribute: KPH10MANAL.LPAR_NAMEDescription: A system-generated, descriptive string used for displaying the instance.Example: ipv4-241
v CDM attribute: SerialNumberAgent attribute: KPH10MANAL.CEC_SNDescription: The serial number of the physical computer system, as it is provided by themanufacturer of the device.Example: 06E05C1
v CDM attribute: ManufacturerAgent attribute: KPH10MANAL.CEC_MFGDescription: The name of the manufacturer of the physical computer system.Example: IBM
v CDM attribute: ModelAgent attribute: KPH10MANAL.CEC_MODELDescription: The model number of the physical computer system, as it is provided by themanufacturer of the device.Example: 9117-MMA
v CDM attribute: FqdnAgent attribute: KPK03PERLP.HOSTNAMEDescription: The fully-qualified host name of the HMC.Example: p7e17.austin.ibm.com
v CDM attribute: VMID– Agent attribute: KPH10MANAL.PI– Description: The unique identifier for a virtual machine. This attribute is the ID for the
LPAR.– Example:
42
v CDM attribute: VirtualDescription: Set to true because this is a virtual computer system.
Appendix B. Discovery Library Adapter for the CEC Base agent 173

Example: truev CDM attribute: IsVMIDanLPAR
Description: Set to true because this computer system is a logical partition.Example: true
VIOS classThe VIOS (Virtual I/O Server) runs a customized version of the AIX operating system. VIOS provides thevirtual storage and shared Ethernet resources to the other logical partitions on the server. VIOS isinstalled on a logical partition in the place of a general purpose operating system, and is used solely toprovide virtual I/O resources to the other logical partitions.
CDM class namesys.VIOS
Relationships
v providesSource: KPH02VERSI.HOSTNAME:KPH10MANAL.CEC_NAME-KPH10MANAL.LPAR_NAME-LPARTarget: KPH02VERSI.HOSTNAME:KPH10MANAL.CEC_NAME-KPH10MANAL.LPAR_NAME-VIOSExample: source="ipv4-151.austin.ibm.com:galileo:ipv4-176vios-LPAR" target="ipv4-151.austin.ibm.com:galileo:ipv4-176vios-VIOS"
CDM attributes, agent attributes, descriptions, and examples
v CDM attribute: NameDescription: The name for the computer system as it is commonly known in the data center.This attribute is used by internal mechanisms of IBM Tivoli Application DependencyDiscovery Manager.Example: VIOS
v CDM attribute: LabelAgent attribute: KPH10MANAL.LPAR_NAMEDescription: A system-generated, descriptive string used for displaying the instance.Example: p7e-vios2
AIX classThe IBM AIX class represents the operating system that is installed on each LPAR.
CDM class namesys.aix.Aix
Relationships
v runsOn– Source: KPH02VERSI.HOSTNAME:KPH10MANAL.HOSTNAME-OS– Target: KPH02VERSI.HOSTNAME:KPH10MANAL.CEC_NAME-
KPH10MANAL.LPAR_NAME-LPAR– Example: runsOn source="ipv4-151.austin.ibm.com:ipv4-179.austin.ibm.com-OS"
target="ipv4-151.austin.ibm.com:galileo:ipv4-179-LPAR"v installedOn
– Source: KPH02VERSI.HOSTNAME:KPH10MANAL.HOSTNAME-OS– Target: KPH02VERSI.HOSTNAME:KPH10MANAL.CEC_NAME-
KPH10MANAL.LPAR_NAME-LPAR– Example: installedOn source="ipv4-151.austin.ibm.com:ipv4-179.austin.ibm.com-OS"
target="ipv4-151.austin.ibm.com:galileo:ipv4-179-LPAR"
CDM attributes, agent attributes, descriptions, and examples
174 IBM Tivoli Monitoring: CEC Base Agent User's Guide
v CDM attribute: NameDescription: The name for the computer system as it is commonly known in the data center.This attribute is used by internal mechanisms of IBM Tivoli Application DependencyDiscovery Manager.Example: AIX
v CDM attribute: OSNameDescription: The operating system name.Example: AIX
v CDM attribute: FQDNAgent attribute: KPH10MANAL.HOSTNAMEDescription: The fully-qualified host name of the LPAR.Example: ipv4-179.austin.ibm.com
v CDM attribute: OSVersionAgent attribute: KPH10MANAL.OS_VERSIONDescription: The operating system version.Example: AIX6.1
VIOS OS classThe IBM AIX class represents the operating system that is installed on each LPAR.
CDM class namesys.ControlSoftware
Relationships
v runsOnSource: KPH02VERSI.HOSTNAME:KPH10MANAL.HOSTNAME-OSTarget: KPH02VERSI.HOSTNAME:KPH10MANAL.CEC_NAME-KPH10MANAL.LPAR_NAME-LPARExample: runsOn source="ipv4-151.austin.ibm.com:ipv4-176.austin.ibm.com-OS"target="ipv4-151.austin.ibm.com:galileo:ipv4-176vios-LPAR"
v installedOnSource: KPH02VERSI.HOSTNAME:KPH10MANAL.HOSTNAME-OSTarget: KPH02VERSI.HOSTNAME:KPH10MANAL.CEC_NAME-KPH10MANAL.LPAR_NAME-LPARExample: installedOn source="ipv4-151.austin.ibm.com:ipv4-176.austin.ibm.com-OS"target="ipv4-151.austin.ibm.com:galileo:ipv4-176vios-LPAR"
CDM attributes, agent attributes, descriptions, and examples
v CDM attribute: NameDescription: Formed by the host name of the IBM AIX operating system.Example: VIOS
v CDM attribute: OSNameDescription: The operating system name.Example: VIOS
v CDM attribute: FQDNAgent attribute: KPK03PERLP.HOSTNAMEDescription: The fully-qualified host name of the LPAR.Example: p7e-vios.austin.ibm.com
TMSAgent classThe TMSAgent class represents the Tivoli Monitoring Services Agent.
Appendix B. Discovery Library Adapter for the CEC Base agent 175

CDM class nameapp.TMSAgent
Relationships
v monitorsSource: INODESTS.NODE-TMSAgentTarget: KPK02GLOBA.NAME-CECExample: monitors source="p7e07:PK-TMSAgent" target="p7e-SN100148P-CEC
CDM attributes, agent attributes, descriptions, and examples
v CDM attribute: ManagedSystemNameAgent attribute: INODESTS.NODEDescription: The name of the IBM Tivoli Monitoring component that provides data for themanagement of the CEC Base agent instance.Example: p7e07:PK
v CDM attribute: ManagedObjectNameAgent attribute: INODESTS.NODEDescription: The name of the IBM Tivoli Monitoring component that provides data for themanagement of the CEC Base agent instance.Example: p@p7e07:PK
v CDM attribute: SoftwareVersionAgent attribute: INODESTS.VERSIONDescription: The version of the CEC Base agent.Example: 06.22.00
v CDM attribute: ProductCodeAgent attribute: INODESTS.PRODUCTDescription: The product code of the CEC Base agent.Example: PK
v CDM attribute: AffinityAgent attribute: INODESTS.AFFINITIESDescription: The affinity of the CEC Base agent.Example: 0000000000000G000000000000000000100000yw0a7
v CDM attribute: LabelAgent attribute: INODESTS.NODE-VIOSDescription: The label of the CEC Base agent.Example: p7e07:PK - CEC
176 IBM Tivoli Monitoring: CEC Base Agent User's Guide

Appendix C. Integration with Tivoli Business Service Manager
The CEC Base agent provides data to create, update the status of, and view IBM Tivoli Business ServiceManager services.
The Tivoli Management Services Discovery Library Adapter (DLA) and Discovery Library Toolkitprovides data for the Tivoli Business Service Manager service models. The Tivoli Integration Facility (EIF)probe updates the status of these services, and you use the Tivoli Enterprise Portal to view the data forthe services. To implement the integration of the agent with Tivoli Business Service Manager, perform theintegration tasks.
Components for integrating with Tivoli Business Service ManagerThe data for integrating with Tivoli Business Service Manager is supplied through the followingcomponents: Tivoli Management Services Discovery Library Adapter (DLA) and Discovery LibraryToolkit, Tivoli Integration Facility (EIF) probe, and Tivoli Enterprise Portal.
Tivoli Management Services Discovery Library Adapter (DLA) and DiscoveryLibrary Toolkit
By using data from the Tivoli Management Services Discovery Library Adapter, you can build TivoliBusiness Service Manager service models that include resources monitored by the CEC Base agent.
The DLA files can be imported directly into Tivoli Business Service Manager using the Discovery LibraryToolkit or they can be loaded into IBM Tivoli Application Dependency Discovery Manager (TADDM) andthen fed into Tivoli Business Service Manager using the Discovery Library Toolkit.
See the following sources for more information about the DLA and Discovery Library Toolkit:v Resources and relationships that are discovered by the CEC Base agent and included in Tivoli
Management Services DLA files: Appendix B, “Discovery Library Adapter for the CEC Base agent,” onpage 171
v Using the Tivoli Management Services DLA: IBM Tivoli Monitoring Administrator's Guide
v Using the Discovery Library Toolkit: Tivoli Business Service Manager Customization Guide
Tivoli Integration Facility (EIF) probe
Situation events detected by the CEC Base agent can update the status of services in Tivoli BusinessService Manager.
The situation events are forwarded from IBM Tivoli Monitoring to the Netcool/OMNIbus Probe for theTivoli Event Integration Facility. The EIF probe then forwards the events to the Netcool/OMNIbusObjectServer. Tivoli Business Service Manager monitors the Netcool/OMNIbus ObjectServer for newevents and updates the status of affected services.
See the following sources for more information about event integration:v Installation (using an existing EIF probe and Netcool/OMNIbus ObjectServer installation or using
Tivoli Business Service Manager to install these components): Netcool/OMNIbus Information Center orthe Tivoli Business Service Manager Installation Guide.
v Setting up event integration between IBM Tivoli Monitoring, the EIF probe, and the Netcool/OMNIbusObjectServer: IBM Tivoli Monitoring Installation and Setup Guide.
© Copyright IBM Corp. 2007, 2013 177
Tivoli Enterprise Portal
You can use the integration of the Tivoli Enterprise Portal with Tivoli Business Service Manager to viewthe services in the Tivoli Business Service Manager console.
For more detailed examination and analysis, you can easily link from the Tivoli Business Service Managerconsole to the Tivoli Enterprise Portal to view the data within the CEC Base agent.
Tasks to integrate the agent with Tivoli Business Service ManagerTo integrate the CEC Base agent with Tivoli Business Service Manager, you must install and configure therequired components. Then, you can view the data in the Tivoli Integrated Portal
To integrate the CEC Base agent with Tivoli Business Service Manager and view the data, complete thefollowing tasks:v Install the Discovery Library Toolkit on the Tivoli Business Service Manager server.v Configure the Tivoli Event Integration Facility (EIF) probe to enrich CEC Base agent events.v Create a service in the Tivoli Business Service Manager console that you want to monitor.v Create a data source mapping for each data source that you want to access within the Tivoli Business
Service Manager.v Configure an additional IBM Tivoli Monitoring web service for each Tivoli Enterprise Portal Server.v View data in the Tivoli Enterprise Portal for the services that you have created to monitor through
Tivoli Business Service Manager.
Installing the Discovery Library Toolkit on the Tivoli Business ServiceManagerYou must install the Discovery Library Toolkit on the Tivoli Business Service Manager server.
The Discovery Library Toolkit imports data from the DLA files and TADDM, which includes informationabout the hardware and the applications that are discovered by the source.
See “Installing the Discovery Library Toolkit” in the Tivoli Business Service Manager Installation Guide.
Configuring the Tivoli Event Integration Facility (EIF) probe to enricheventsThe Netcool/OMNIbus Probe for Tivoli Event Integration Facility (EIF) forwards the CEC Base agentevents that are received from IBM Tivoli Monitoring to the Netcool/OMNIbus ObjectServer. TivoliBusiness Service Manager monitors the Netcool/OMNIbus ObjectServer for new events, and updates thestatus of affected services.
Install and configure the Netcool/OMNIbus ObjectServer and EIF probe and set up event integrationbetween IBM Tivoli Monitoring and Netcool/OMNIbus. The probe rules files provided with IBM TivoliMonitoring enrich CEC Base agent events to identify the affected service.
Creating a service in Tivoli Business Service ManagerYou must create a service in the Tivoli Business Service Manager console for each service that you wantto monitor.
To create the services that you want to monitor in the Tivoli Business Service Manager console, see“Configuring services” in the IBM Tivoli Business Service Manager Service Configuration Guide.
178 IBM Tivoli Monitoring: CEC Base Agent User's Guide

Creating a data source mapping for each data sourceYou can create a data source mapping for each data source that you want to access within Tivoli BusinessService Manager.
Also, you can create the data fetchers and use the data to create incoming status rules that are populatedin your service templates.
For more information, see “Data sources” and “Data fetchers” in the IBM Tivoli Business Service ManagerService Configuration Guide.
Configuring additional IBM Tivoli Monitoring web servicesYou can configure additional IBM Tivoli Monitoring web services for each Tivoli Enterprise Portal Server.
To configure an additional IBM Tivoli Monitoring web service for each Tivoli Enterprise Portal server, see“Configure TBSM charts” in the IBM Tivoli Business Service Manager Scenarios Guide.
Viewing data in the Tivoli Enterprise PortalFrom Tivoli Business Service Manager, you can open the Tivoli Enterprise Portal and view the CEC Baseagent.
You can also launch Tivoli Business Service Manager from the Tivoli Enterprise Portal.
For more information about launching applications, see “Launching to and from applications” in theTivoli Business Service Manager Customization Guide.
Appendix C. Integration with Tivoli Business Service Manager 179

180 IBM Tivoli Monitoring: CEC Base Agent User's Guide

Appendix D. Documentation library
Various publications are relevant to the use of the IBM Tivoli Monitoring: CEC Base Agent.
For information about how to access and use the publications, see Using the publications(http://pic.dhe.ibm.com/infocenter/tivihelp/v61r1/topic/com.ibm.itm.doc_6.3/common/using_publications.htm).
To find publications from the previous version of a product, click Previous versions under the name ofthe product in the Contents pane.
IBM Tivoli Monitoring: CEC Base Agent library
The documentation for this agent and other product components is in the IBM Tivoli MonitoringInformation Center (http://pic.dhe.ibm.com/infocenter/tivihelp/v61r1/topic/com.ibm.itm.doc_6.3/welcome.htm).
One document is specific to the CEC Base agent. The IBM Tivoli Monitoring: CEC Base Agent User’sGuide provides agent-specific information for configuring, using, and troubleshooting the CEC Baseagent.
Use the information in the user's guide for the agent with the Tivoli Enterprise Portal User's Guide tomonitor CEC resources.
Prerequisite publicationsTo use the information in this publication effectively, you must have some prerequisite knowledge.
See the following publications to gain the required prerequisite knowledge:v IBM Tivoli Monitoring Administrator's Guide
v IBM Tivoli Monitoring Agent Builder User's Guide
v IBM Tivoli Monitoring Command Reference
v IBM Tivoli Monitoring Installation and Setup Guide
v IBM Tivoli Monitoring High Availability Guide for Distributed Systems
v IBM Tivoli Monitoring: Messages
v IBM Tivoli Monitoring Troubleshooting Guide
v IBM Tivoli Monitoring Universal Agent User's Guide
v IBM Tivoli Universal Agent API and Command Programming Reference Guide
v IBM Tivoli Monitoring: i5/OS™ Agent User's Guide
v IBM Tivoli Monitoring: Linux OS Agent User's Guide
v IBM Tivoli Monitoring: UNIX OS Agent User's Guide
v IBM Tivoli Monitoring: UNIX Logs OS Agent User's
v IBM Tivoli Monitoring: Windows OS Agent User's Guide
v Tivoli Enterprise Portal User's Guide
v IBM Tivoli Performance Analyzer User's Guide
v IBM Tivoli Warehouse Proxy Agent User's Guide
v IBM Tivoli Warehouse Summarization and Pruning Agent User's Guide
© Copyright IBM Corp. 2007, 2013 181

Related publicationsThe publications in related information centers provide useful information.
See the following information centers, which you can find by accessing Tivoli Documentation Central(http://www.ibm.com/tivoli/documentation):v Tivoli Monitoringv Tivoli Application Dependency Discovery Managerv Tivoli Business Service Managerv Tivoli Common Reportingv Tivoli Enterprise Console
Other sources of documentationYou can obtain additional technical documentation about monitoring products from other sources.
See the following sources of technical documentation about monitoring products:v Service Management Connect (SMC)
For introductory information about SMC, see IBM Service Management Connect (http://www.ibm.com/developerworks/servicemanagement/).For information about Tivoli products, see the Application Performance Management community onSMC (http://www.ibm.com/developerworks/servicemanagement/apm/index.html).Connect, learn, and share with Service Management professionals. Get access to developers andproduct support technical experts who provide their perspectives and expertise. You can use SMC forthese purposes:– Become involved with transparent development, an ongoing, open engagement between external
users and developers of Tivoli products where you can access early designs, sprint demos, productroadmaps, and pre-release code.
– Connect one-on-one with the experts to collaborate and network about Tivoli and Integrated ServiceManagement.
– Benefit from the expertise and experience of others using blogs.– Collaborate with the broader user community using wikis and forums.
v IBM Integrated Service Management Library (http://www.ibm.com/software/brandcatalog/ismlibrary/) is an online catalog that contains integration documentation as well as otherdownloadable product extensions.
v IBM Redbook publications (http://www.redbooks.ibm.com/) include Redbooks® publications,Redpapers, and Redbooks technotes that provide information about products from platform andsolution perspectives.
v Technotes (http://www.ibm.com/support/entry/portal/software), which are found through the IBMSoftware Support website, provide the latest information about known product limitations andworkarounds.
182 IBM Tivoli Monitoring: CEC Base Agent User's Guide

Notices
This information was developed for products and services offered in the U.S.A. IBM may not offer theproducts, services, or features discussed in this document in other countries. Consult your local IBMrepresentative for information on the products and services currently available in your area. Anyreference to an IBM product, program, or service is not intended to state or imply that only that IBMproduct, program, or service may be used. Any functionally equivalent product, program, or service thatdoes not infringe any IBM intellectual property right may be used instead. However, it is the user'sresponsibility to evaluate and verify the operation of any non-IBM product, program, or service.
IBM may have patents or pending patent applications covering subject matter described in thisdocument. The furnishing of this document does not give you any license to these patents. You can sendlicense inquiries, in writing, to:
IBM Director of LicensingIBM CorporationNorth Castle DriveArmonk, NY 10504-1785 U.S.A.
For license inquiries regarding double-byte (DBCS) information, contact the IBM Intellectual PropertyDepartment in your country or send inquiries, in writing, to:
Intellectual Property LicensingLegal and Intellectual Property LawIBM Japan Ltd.19-21, Nihonbashi-Hakozakicho, Chuo-kuTokyo 103-8510, Japan
The following paragraph does not apply to the United Kingdom or any other country where suchprovisions are inconsistent with local law:
INTERNATIONAL BUSINESS MACHINES CORPORATION PROVIDES THIS PUBLICATION "AS IS"WITHOUT WARRANTY OF ANY KIND, EITHER EXPRESS OR IMPLIED, INCLUDING, BUT NOTLIMITED TO, THE IMPLIED WARRANTIES OF NON-INFRINGEMENT, MERCHANTABILITY ORFITNESS FOR A PARTICULAR PURPOSE.
Some states do not allow disclaimer of express or implied warranties in certain transactions, therefore,this statement might not apply to you.
This information could include technical inaccuracies or typographical errors. Changes are periodicallymade to the information herein; these changes will be incorporated in new editions of the publication.IBM may make improvements and/or changes in the product(s) and/or the program(s) described in thispublication at any time without notice.
Any references in this information to non-IBM Web sites are provided for convenience only and do not inany manner serve as an endorsement of those Web sites. The materials at those Web sites are not part ofthe materials for this IBM product and use of those Web sites is at your own risk.
IBM may use or distribute any of the information you supply in any way it believes appropriate withoutincurring any obligation to you.
© Copyright IBM Corp. 2007, 2013 183
Licensees of this program who wish to have information about it for the purpose of enabling: (i) theexchange of information between independently created programs and other programs (including thisone) and (ii) the mutual use of the information which has been exchanged, should contact:
IBM Corporation2Z4A/10111400 Burnet RoadAustin, TX 78758 U.S.A.
Such information may be available, subject to appropriate terms and conditions, including in some casespayment of a fee.
The licensed program described in this document and all licensed material available for it are providedby IBM under terms of the IBM Customer Agreement, IBM International Program License Agreement orany equivalent agreement between us.
Any performance data contained herein was determined in a controlled environment. Therefore, theresults obtained in other operating environments may vary significantly. Some measurements may havebeen made on development-level systems and there is no guarantee that these measurements will be thesame on generally available systems. Furthermore, some measurement may have been estimated throughextrapolation. Actual results may vary. Users of this document should verify the applicable data for theirspecific environment.
Information concerning non-IBM products was obtained from the suppliers of those products, theirpublished announcements or other publicly available sources. IBM has not tested those products andcannot confirm the accuracy of performance, compatibility or any other claims related to non-IBMproducts. Questions on the capabilities of non-IBM products should be addressed to the suppliers ofthose products.
All statements regarding IBM's future direction or intent are subject to change or withdrawal withoutnotice, and represent goals and objectives only.
All IBM prices shown are IBM's suggested retail prices, are current and are subject to change withoutnotice. Dealer prices may vary.
This information is for planning purposes only. The information herein is subject to change before theproducts described become available.
This information contains examples of data and reports used in daily business operations. To illustratethem as completely as possible, the examples include the names of individuals, companies, brands, andproducts. All of these names are fictitious and any similarity to the names and addresses used by anactual business enterprise is entirely coincidental.
COPYRIGHT LICENSE:
This information contains sample application programs in source language, which illustrate programmingtechniques on various operating platforms. You may copy, modify, and distribute these sample programsin any form without payment to IBM, for the purposes of developing, using, marketing or distributingapplication programs conforming to the application programming interface for the operating platform forwhich the sample programs are written. These examples have not been thoroughly tested under allconditions. IBM, therefore, cannot guarantee or imply reliability, serviceability, or function of theseprograms. You may copy, modify, and distribute these sample programs in any form without payment toIBM for the purposes of developing, using, marketing, or distributing application programs conformingto IBM‘s application programming interfaces.
184 IBM Tivoli Monitoring: CEC Base Agent User's Guide
Each copy or any portion of these sample programs or any derivative work, must include a copyrightnotice as follows:
© IBM 2009. Portions of this code are derived from IBM Corp. Sample Programs. © Copyright IBM Corp.2009. All rights reserved.
If you are viewing this information in softcopy form, the photographs and color illustrations might not bedisplayed.
TrademarksIBM, the IBM logo, and ibm.com® are trademarks or registered trademarks of International BusinessMachines Corp., registered in many jurisdictions worldwide. Other product and service names might betrademarks of IBM or other companies. A current list of IBM trademarks is available on the web atCopyright and trademark information (www.ibm.com/legal/copytrade.shtml).
Intel, Intel logo, and Intel Xeon, are trademarks or registered trademarks of Intel Corporation or itssubsidiaries in the United States and other countries.
Java and all Java-based trademarks and logos are trademarks or registered trademarks of Oracle and/orits affiliates.
Linux is a registered trademark of Linus Torvalds in the United States, other countries, or both.
Microsoft and Windows are trademarks of Microsoft Corporation in the United States, other countries, orboth.
UNIX is a registered trademark of The Open Group in the United States and other countries.
Notices 185

186 IBM Tivoli Monitoring: CEC Base Agent User's Guide

Index
Aaccounting reports 95Active Memory Expansion workspace 21activities 81additional information
attributes 23situations 73Take Action commands 79Workspaces 19
agentfunctions 1problems and workarounds 145
Agent Management Services 4AIX class
CDM class name 174FQDN 175installedOn 174Name 175OSName 175OSVersion 175Relationships 174runsOn 174
Allocated Memory attribute 46Allocated Memory Used Pct attribute 46AME attribute group 24AME Mode attribute 56AMS Mem Loaned attribute 54AMS Memory Ent Inuse attribute 55AMS Memory Entitlement attribute 55AMS Mempool Size attribute 32AMS Mode attribute 53AMS Physical Mem attribute 54AMS Pool ID attribute 32, 53AMS Pool Size attribute 54AMS Pools attribute group 31AMS Total Mem Inuse attribute 32attribute group 24attribute groups
AME 24AMS Pools 31CPU Pools 33Director 36Global CEC 37HMC Switch 44list of all 23Mon LPars 45Mon Unmon Alloc 56overview 23Per LPAR 61Performance Object Status 66TADDM 69
attributes 24additional information 23Allocated Memory 46Allocated Memory Used Pct 46AME 24AME Mode 56AMS Mem Loaned 54AMS Memory Ent Inuse 55AMS Memory Entitlement 55AMS Mempool Size 32
attributes (continued)AMS Mode 53AMS Physical Mem 54AMS Pool ID 32, 53AMS Pool Size 54AMS Pools 31AMS Total Mem Inuse 32Avail Shared Pool Pct 36Available CPU Units in Pool 34, 61Available Memory Pool Pct 33Capped Mode 50, 63CEC Mfg 69CEC Model 69CEC Name 61CEC SN 70Compressed Data Size MB 30Compressed Memory Free Pct 27Compressed Memory Page In Rate 28Compressed Memory Page Out Rate 28Compressed Memory Size MB 27Compressed Memory Used Pct 27Compression Ratio 28Configured Primary HMC 45CPU Allocated 38CPU Allocated Pct 39, 62CPU Capacity Weight 49, 64CPU Entitlement Used Pct 48CPU Idle Pct 48CPU Pool ID 34, 52CPU Pools 33CPU Shared Pool Size 39CPU Shared Pool Size Units 42CPU Sys Pct 47CPU Total 38CPU Unallocated 39CPU Unallocated Pct 39CPU Units Allocated 41CPU Units Consumed 35CPU Units UnAllocated 41CPU Used Pct 29CPU Usr Pct 47CPU Wait Pct 48Current Expansion Factor 26Dedicated Physb 42Deficit Expansion Factor 30Deficit Size MB 30Director 36DirectorPort 37DirectorServer 37Donating 50Effective Memory Size MB 26Entitlement 47, 62Environment 62Error Code 67Event Type 44Global CEC 37HMC Switch 44Hostname 25, 46, 64Hypervisor Page Ins 55Hypervisor Page Ins Time 55ID 62
© Copyright IBM Corp. 2007, 2013 187

attributes (continued)Inactive LPARs 58LPAR Name 25, 45LPAR Number 25LPARs Using Pool 32, 35Machine ID 25, 33, 36, 41, 45, 57, 64Max CPU Cap Used Pct 52Maximum Pool Capacity 35, 53, 65Memory Allocated MB 40, 63Memory Allocated Pct 40, 63Memory Consumed MB 50Memory Total MB 40Memory Unallocated MB 40Memory Unallocated Pct 41Mon LPars 45Mon Unmon Alloc 56Monitored Dedicated LPARs 57Monitored Shared LPARs 57Monitoring Status 64Name 38, 62New HMC 45Node 25, 31, 33, 36, 37, 44, 45, 56, 61, 66, 69Num AMS Pools 43Num Dedicated Mem LPARs 43Num Shared Mem LPARs 43Number of Logical CPUs 51Number of Partitions 38Number Virtual CPUs 35, 51Object Name 66Object Status 67Object Type 67Old HMC 44OS Version 46, 64overview 23Per LPAR 61Performance Object Status 66Phantom Interrupts per Sec 49Phy Busy Time Pct 50Physical CPU In Pool 52, 65Physical CPU Units Used 51Physical Memory Allocated Pct 46Pool Entitlement 34, 52, 65PoolID 64Query Name 66Shared Mode 49, 63Shared Physb 42Shared Processor Pools 42SMT 49SMT Threads 56State 62TADDM 69Target Expansion Factor 26Timestamp 25, 31, 33, 36, 37, 44, 45, 57, 61, 66, 69Total Monitored 60Total Monitored CPU 59Total Monitored CPU Used Pct 59Total Monitored CPU Used Units 60Total Monitored Memory MB 58Total Monitored Memory Used Pct 59Total Unmonitored 60Total Unmonitored CPU 59Total UnMonitored Memory MB 58True Memory Size MB 26Type Model Serial 31, 33, 36, 44, 56, 61, 66Uncompressed Data Size MB 31Uncompressed Memory Free Pct 29Uncompressed Memory Size MB 29
attributes (continued)Uncompressed Memory Used Pct 29UnMonitored Active LPARs 57UseTEPCredential 37Virt Context CPU Switches per Sec 48
Avail Shared Pool Pct attribute 36Available CPU Units in Pool attribute 34, 61Available Memory Pool Pct attribute 33
Ccalculate historical data disk space 70capacity planning for historical data 70Capped Mode attribute 50, 63CEC Base
situations 74workspaces
descriptions 20CEC Base agent
performance considerations 149CEC Base Agent Balanced and Unbalanced CECs report 121CEC Base Agent CPU Pools Utilization Details report 97CEC Base Agent Frame Workload Trend and Forecast
report 98CEC Base Agent LPAR Physical CPU Utilization Details
report 99CEC Base Agent LPAR Physical Memory Utilization Details
report 100CEC Base Agent LPAR Workload Trend and Forecast
report 101CEC Base Agent Number of LPARs for CEC report 115CEC Base Agent Resources Needed for Additional LPARS on
CEC report 116CEC Base Agent Top or Bottom CECs by Physical CPU
Utilization report 123CEC Base Agent Top or Bottom CECs by Physical Memory
Utilization report 124CEC Base Agent Top or Bottom LPARs by Physical CPU
Utilization report 125CEC Base Agent Top or Bottom LPARs by Physical Memory
Utilization report 126CEC class
CDM class name 172HardwarePlatform 172Label 172Manufacturer 172Model 172Name 172SerialNumber 172Type 172
CEC Mfg attribute 69CEC Model attribute 69CEC Name attribute 61CEC Resource Inventory workspace 20CEC Resources
situations 74workspaces
descriptions 21CEC SN attribute 70CEC Utilization
situations 75workspaces
descriptions 21CEC Utilization workspace 21CEC View workspace 21cfgsvc command 11
188 IBM Tivoli Monitoring: CEC Base Agent User's Guide

Cognos-based report packagesSee also Tivoli Common Reportingimporting 89running 89
Cognos-based reportsSee also Tivoli Common Reportingattribute groups 92CEC Base Agent Balanced and Unbalanced CECs 121CEC Base Agent CPU Pools Utilization Details 97CEC Base Agent Frame Workload Trend and Forecast 98CEC Base Agent LPAR Physical CPU Utilization
Details 99CEC Base Agent LPAR Physical Memory Utilization
Details 100CEC Base Agent LPAR Workload Trend and Forecast 101CEC Base Agent Number of LPARs for CEC 115CEC Base Agent Resources Needed for Additional LPARS
on CEC 116CEC Base Agent Top or Bottom CECs by Physical CPU
Utilization 123CEC Base Agent Top or Bottom CECs by Physical Memory
Utilization 124CEC Base Agent Top or Bottom LPARs by Physical CPU
Utilization 125CEC Base Agent Top or Bottom LPARs by Physical
Memory Utilization 126HMC Base Agent CPU Pools Utilization Details 102HMC Base Agent LPAR CPU Trend and Forecast 103HMC Base Agent LPAR Heat Chart 104HMC Base Agent LPAR Physical CPU Usage 105HMC Base Agent Managed Server CPU Trend and
Forecast 106HMC Base Agent Managed Server Forecast Alerts 107HMC Base Agent Managed Server Heat Chart 108HMC Base Agent Managed Server Performance
Trends 109HMC Base Agent Managed Server Weekly
Comparison 111HMC Base Agent Number of LPARs for Managed
Server 118HMC Base Agent Number of Managed Servers and LPARs
monitored 95HMC Base Agent Resources Needed For Additional LPARs
on Managed Server 120HMC Base Agent Top or Bottom LPARs by Physical CPU
Usage 127HMC Base Agent Top or Bottom Managed Servers by
Physical CPU Utilization 128predefined 92System p Report Prerequisite Scanner 94VIOS Premium Agent Disk Capacity Details 112VIOS Premium Agent Physical Fibre Channel Adapter
Utilization 113VIOS Premium Agent Shared Ethernet Adapter
Utilization 114VIOS Premium Agent Shared Ethernet Adapter Utilization
report 114VIOS Premium Agent Top or Bottom VIOSs by Disk
Capacity 129command
cfgsvc 11itmcmd 11key.pl 11lssvc 11startsvc 11stopsvc 11
commandsTake Action 79
components 3IBM Tivoli Monitoring 3
Compressed Data Size MB attribute 30Compressed Memory Free Pct attribute 27Compressed Memory Page In Rate attribute 28Compressed Memory Page Out Rate attribute 28Compressed Memory Size MB attribute 27Compressed Memory Used Pct attribute 27Compression Ratio attribute 28configuration
agent 11problems and workarounds 142
Configured Primary HMC attribute 45CPU Allocated attribute 38CPU Allocated Pct attribute 39, 62CPU Capacity Weight attribute 49, 64CPU Entitlement Used Pct attribute 48CPU Idle Pct attribute 48CPU Pool ID attribute 34, 52CPU Pools attribute group 33CPU Shared Pool Size attribute 39CPU Shared Pool Size Units attribute 42CPU Sys Pct attribute 47CPU Total attribute 38CPU Unallocated attribute 39CPU Unallocated Pct attribute 39CPU Units Allocated attribute 41CPU Units Consumed attribute 35CPU Units UnAllocated attribute 41CPU Used Pct attribute 29CPU Usr Pct attribute 47CPU Wait Pct attribute 48Current Expansion Factor attribute 26
Ddata sources 7Dedicated Physb attribute 42Deficit Expansion Factor attribute 30Deficit Size MB attribute 30descriptions 74detailed 136developerWorks website 182Director attribute group 36DirectorPort attribute 37DirectorServer attribute 37Discovery Library Adapter 177
See also DLAAIX class
CDM class name 174FQDN 175installedOn 174Name 175OSName 175OSVersion 175Relationships 174runsOn 174
CEC classCDM class name 172HardwarePlatform 172Label 172Manufacturer 172Model 172Name 172SerialNumber 172
Index 189

Discovery Library Adapter (continued)CEC class (continued)
Type 172LPAR class
CDM class name 173Fqdn 173IsVMIDanLPAR 174Label 173Manufacturer 173Model 173Name 173SerialNumber 173Type 173Virtual 173VMID 173
TMSAgent classAffinity 176CDM class name 176Label 176ManagedObjectName 176ManagedSystemName 176monitors 176ProductCode 176Relationships 176SoftwareVersion 176
VIOS classCDM class name 174Label 174Name 174provides 174Relationships 174
VIOS OS classCDM class name 175installedOn 175Name 175Relationships 175runsOn 175
Discovery Library Toolkit 177installing 178
disk capacity planning for historical data 70disk space 7DLA 171, 177
data model 171classes 171
DLA (Discovery Library Adapter)AIX class
CDM class name 174FQDN 175installedOn 174Name 175OSName 175OSVersion 175Relationships 174runsOn 174
CEC classCDM class name 172HardwarePlatform 172Label 172Manufacturer 172Model 172Name 172SerialNumber 172Type 172
LPAR classCDM class name 173Fqdn 173IsVMIDanLPAR 174
DLA (Discovery Library Adapter) (continued)LPAR class (continued)
Label 173Manufacturer 173Model 173Name 173SerialNumber 173Type 173Virtual 173VMID 173
TMSAgent classAffinity 176Label 176ManagedObjectName 176ManagedSystemName 176monitors 176ProductCode 176Relationships 176SoftwareVersion 176
TMXAgent classCDM class name 176
VIOS classCDM class name 174Label 174Name 174provides 174Relationships 174
VIOS OS classCDM class name 175installedOn 175Name 175Relationships 175runsOn 175
documentationSee publications
Donating attribute 50
EEffective Memory Size MB attribute 26enhancements 3Entitlement attribute 47, 62Environment attribute 62Error Code attribute 67event
mapping 163Event Type attribute 44
GGlobal CEC attribute group 37
Hhistorical data
calculate disk space 70disk capacity planning 70
HMC Base Agent CPU Pools Utilization Details report 102HMC Base Agent LPAR CPU Trend and Forecast report 103HMC Base Agent LPAR Heat Chart report 104HMC Base Agent LPAR Physical CPU Usage report 105HMC Base Agent Managed Server CPU Trend and Forecast
report 106HMC Base Agent Managed Server Forecast Alertsreport 107HMC Base Agent Managed Server Heat Chart report 108
190 IBM Tivoli Monitoring: CEC Base Agent User's Guide

HMC Base Agent Managed Server Performance Trendsreport 109
HMC Base Agent Managed Server Weekly Comparisonreport 111
HMC Base Agent Number of LPARs for Managed Serverreport 118
HMC Base Agent Number of Managed Servers and LPARsmonitored report 95
HMC Base Agent Resources Needed For Additional LPARs onManaged Server report 120
HMC Base Agent Top or Bottom LPARs by Physical CPUUsage report 127
HMC Base Agent Top or Bottom Managed Servers by PhysicalCPU Utilization report 128
HMC Failover workspace 20HMC Switch attribute group 44Hostname attribute 25, 46, 64Hypervisor Page Ins attribute 55Hypervisor Page Ins Time attribute 55
IIBM Systems Director workspace 20IBM Tivoli Monitoring 3
overview 1IBM Tivoli Monitoring version 7ID attribute 62Inactive LPARs attribute 58include file 178indexes for reports 87install-dir/install.sh script 11installation
agent 11problems and workarounds 142
installing language packs 8Integrated Service Management Library documentation 182interface
user 5itmcmd command 11
Kkey.pl command 11key.pl script 11KPK_Avail_MemPool_Pct_Low_Warn situation 76KPK_Avail_Pool_Pct_Low_Warn situation 74KPK_CEC_avg_cpu_usage_Warn situation 75KPK_CEC_avg_mem_usage_Warn situation 75KPK_HMC_Failover_Slow_Info situation 77KPK_HMC_Failover_Warn situation 76
Llanguage packs 8
installing 8silent installation 8
LPAR classCDM class name 173Fqdn 173IsVMIDanLPAR 174Label 173Manufacturer 173Model 173Name 173SerialNumber 173Type 173
LPAR class (continued)Virtual 173VMID 173
LPAR Name attribute 25, 45LPAR Number attribute 25LPAR Summary workspace 22LPAR Utilization workspace 22LPARs Using Pool attribute 32, 35lssvc command 11
MMachine ID attribute 25, 33, 36, 41, 45, 57, 64Max CPU Cap Used Pct attribute 52Maximum Pool Capacity attribute 35, 53, 65Memory Allocated MB attribute 40, 63Memory Allocated Pct attribute 40, 63Memory Consumed MB attribute 50Memory Total MB attribute 40Memory Unallocated MB attribute 40Memory Unallocated Pct attribute 41Mon LPars attribute group 45Mon Unmon Alloc attribute group 56Monitored Dedicated LPARs attribute 57Monitored Partitions workspace 21Monitored Shared LPARs attribute 57Monitoring Status attribute 64
NName attribute 38, 62New HMC attribute 45new in this release 3Node attribute 25, 31, 33, 36, 37, 44, 45, 56, 61, 66, 69Num AMS Pools attribute 43Num Dedicated Mem LPARs attribute 43Num Shared Mem LPARs attribute 43Number of Logical CPUs attribute 51Number of Partitions attribute 38Number Virtual CPUs attribute 35, 51
OObject Name attribute 66Object Status attribute 67Object Type attribute 67ODBC 88Old HMC attribute 44operating systems 7OS Version attribute 46, 64overview
IBM Tivoli Monitoring 1overview of System p agents 1
PPer LPAR attribute group 61performance considerations 149Performance Object Status attribute group 66Performance Object Status workspace 20performance trends and resource forecasts reports 96Phantom Interrupts per Sec attribute 49Phy Busy Time Pct attribute 50Physical CPU In Pool attribute 52, 65Physical CPU Units Used attribute 51
Index 191
Physical Memory Allocated Pct attribute 46policies 81Pool Entitlement attribute 34, 52, 65PoolID attribute 64prerequisite publications 181prerequisites
Cognos-based report packages 83prerequisites checking reports 94probe rules file
include 178problems and workarounds 142
agent-specific 145agent-specific workspaces 147configuration 142install 142remote deployment 144situations 149Take Action commands 152Tivoli Common Reporting 152workspaces 147
publications 181, 182developerWorks website 182IBM Tivoli Monitoring 181Integrated Service Management Library 182prerequisite 181Redbooks 182related 182Technotes 182wikis 182
Qqueries, using attributes 23Query Name attribute 66
Rras1 138Redbooks 182remote deployment
problems and workarounds 144report installer log 152reports
accounting 95performance trends and resource forecasts 96prerequisites checking 94uninstalling 92what if analysis for workload placement 114workload right-sizing and balancing 121
requirements 7configuration 7installation 7
response file template 8
Sscript
install-dir/install.sh 11key.pl 11
Shared Mode attribute 49, 63Shared Physb attribute 42Shared Processor Pools attribute 42silent installation 8silent installation of language packs 8situations 74
situations (continued)additional information
predefined, defined 73KPK_Avail_MemPool_Pct_Low_Warn 76KPK_Avail_Pool_Pct_Low_Warn 74KPK_CEC_avg_cpu_usage_Warn 75KPK_CEC_avg_mem_usage_Warn 75KPK_HMC_Failover_Slow_Info 77KPK_HMC_Failover_Warn 76overview 73predefined 73problems and workarounds 149Situation Editor 73
situations, using attributes 23SMT attribute 49SMT Threads attribute 56startsvc command 11State attribute 62stopsvc command 11System p agents
overview 1System P Report Prerequisite Scanner report 94
TTADDM attribute group 69Take Action commands
additional information 79overview 79predefined 79, 81problems and workarounds 152
Target Expansion Factor attribute 26Technotes 182Timestamp attribute 25, 31, 33, 36, 37, 44, 45, 57, 61, 66, 69Tivoli Business Service Manager
components for integrating with 177configuring additional IBM Tivoli Monitoring web
services 179creating a service 178creating data source mapping 179installing Discovery Library Toolkit 178integration 177launching from Tivoli Enterprise Portal 179Tivoli Enterprise Portal
Tivoli Integration Facility (EIF) probe 177viewing data in Tivoli Enterprise Portal 179
Tivoli Business Service Managerintegration tasks 178Tivoli Common Reporting
configuring historical collection 84connecting to Tivoli Data Warehouse 88create indexes 87documentation 83installing 84obtaining packages and extracting reports 84prerequisites 83problems and workarounds 152tables requiring summarization and pruning 84Tivoli Data Warehouse 88uninstalling reports 92views required 84
Tivoli Common Reporting Community 83Tivoli Common Reporting documentation 83Tivoli Enterprise Console
event mapping 163Tivoli Event Integration Facility (EIF) probe
configuring 178
192 IBM Tivoli Monitoring: CEC Base Agent User's Guide
TMSAgent classAffinity 176CDM class name 176Label 176ManagedObjectName 176ManagedSystemName 176monitors 176ProductCode 176Relationships 176SoftwareVersion 176
Total Monitored attribute 60Total Monitored CPU attribute 59Total Monitored CPU Used Pct attribute 59Total Monitored CPU Used Units attribute 60Total Monitored Memory MB attribute 58Total Monitored Memory Used Pct attribute 59Total Unmonitored attribute 60Total Unmonitored CPU attribute 59Total UnMonitored Memory MB attribute 58trace
turn off 141turn on 140
trace settings 138tracing 136troubleshooting 131
agent-specific 145agent-specific workspaces 147installation 142problems and workarounds 142remote deployment 144report installer log 152situations 149Take Action commands 152Tivoli Common Reporting 152turn off trace 141turn on trace 140uninstallation 142workspaces 147
True Memory Size MB attribute 26Type Model Serial attribute 31, 33, 36, 44, 56, 61, 66
UUncompressed Data Size MB attribute 31Uncompressed Memory Free Pct attribute 29Uncompressed Memory Size MB attribute 29Uncompressed Memory Used Pct attribute 29uninstalling reports 92UnMonitored Active LPARs attribute 57user interface options 5UseTEPCredential attribute 37
Vviews
Active Memory Expansion workspace 21CEC Resource Inventory workspace 20CEC Utilization workspace 21CEC View workspace 21HMC Failover workspace 20IBM Systems Director workspace 20LPAR Summary workspace 22LPAR Utilization workspace 22Monitored Partitions workspace 21Performance Object Status workspace 20
VIOS classCDM class name 174Label 174Name 174provides 174Relationships 174
VIOS OS classCDM class name 175installedOn 175Name 175Relationships 175runsOn 175
VIOS Premium Agent Disk Capacity Details report 112VIOS Premium Agent Physical Fibre Channel Adapter
Utilization report 113VIOS Premium Agent Top or Bottom VIOSs by Disk Capacity
report 129Virt Context CPU Switches per Sec attribute 48
Wwhat if analysis reports 114wikis 182workarounds 142Workflow Editor 81workload right-sizing and balancing reports 121workspaces
Active Memory Expansion 21CEC Base 20CEC Resource Inventory 20CEC Resources 21CEC Utilization 21CEC View 21descriptions 20HMC Failover 20IBM Systems Director 20LPAR Summary 22LPAR Utilization 22Monitored Partitions 21Performance Object Status 20predefined 19problems and workarounds 147
Workspacesadditional information 19overview 19
Index 193

194 IBM Tivoli Monitoring: CEC Base Agent User's Guide


����
Printed in USA
SC23-5239-08