ibm almaden, oct 2000 automating assessment of web site usability marti hearst university of...
Post on 20-Dec-2015
216 views
TRANSCRIPT

IBM Almaden, Oct 2000
Automating Assessment of
Web Site Usability
Marti HearstUniversity of California, Berkeley

IBM Almaden, Oct 2000
The Usability Gap
196M new Web sites in the next 5 years [Nielsen99]
~20,000 user interface professionals [Nielson99]

IBM Almaden, Oct 2000
The Usability Gap
Most sites have inadequate usability [Forrester, Spool, Hurst]
(users can’t find what they want 39-66% of the time)
196 M new Web sites in the next 5 years [Nielsen99]
A shortage of user interface professionals [Nielson99]
IBM Almaden, Oct 2000
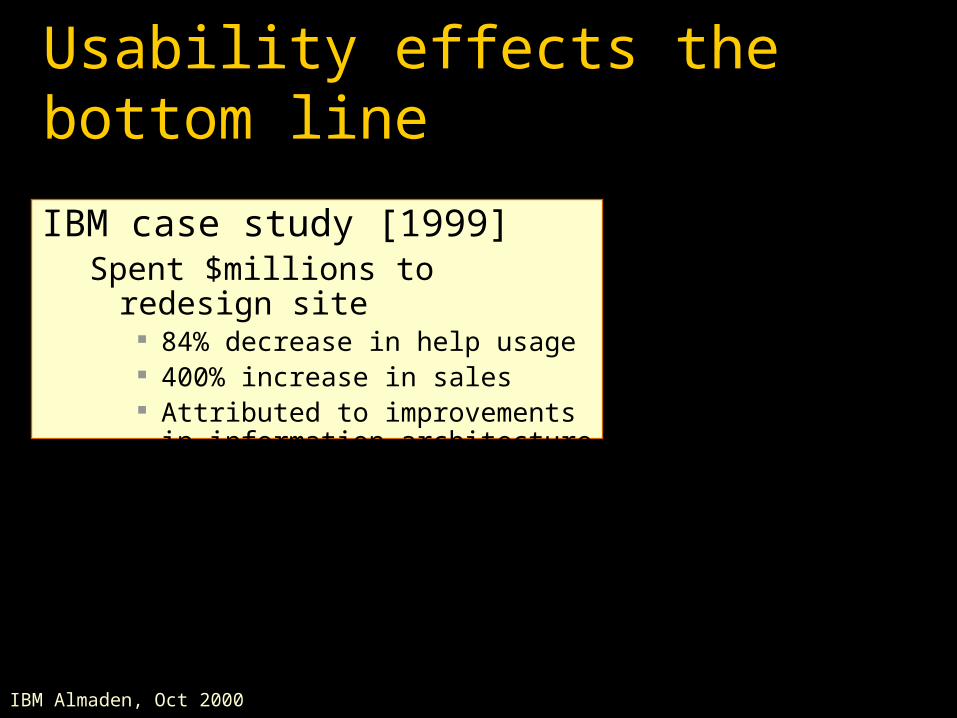
Usability effects the bottom line
IBM case study [1999]Spent $millions to redesign
site 84% decrease in help usage 400% increase in sales Attributed to improvements in
information architecture

IBM Almaden, Oct 2000
Usability effects the bottom line
IBM case study [1999]Spent $millions to redesign
site 84% decrease in help usage 400% increase in sales Attributed to improvements in
information architectureCreative Good Study [1999]
Studied 10 e-commerce sites59% attempts failedIf 25% of these had succeeded ->
estimated additional $3.9B in sales
IBM Almaden, Oct 2000
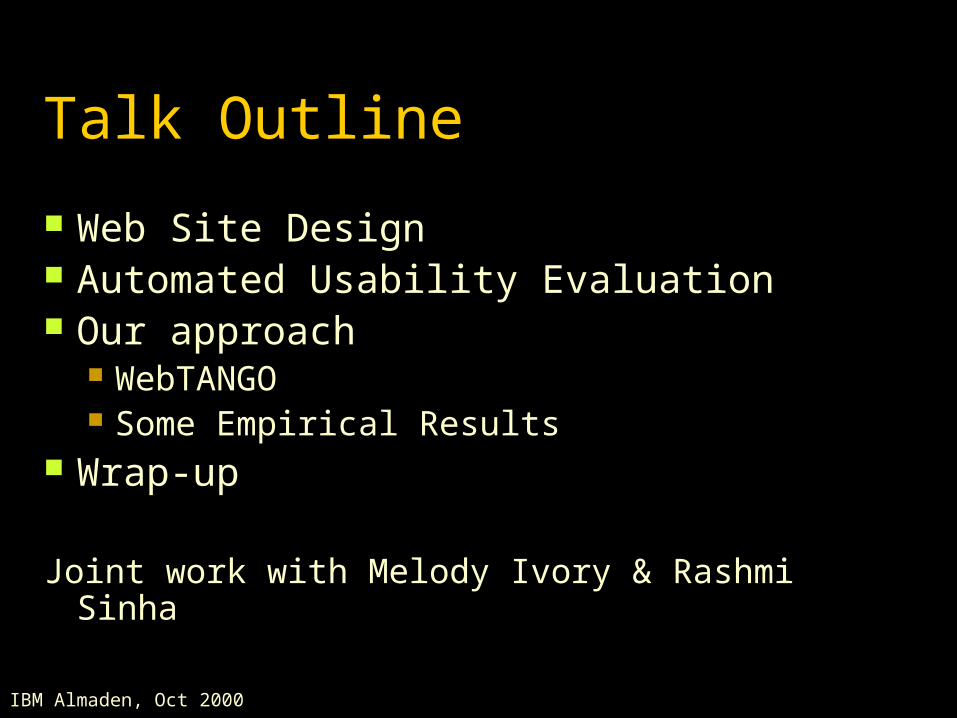
Talk Outline
Web Site Design Automated Usability Evaluation Our approach
WebTANGO Some Empirical Results
Wrap-up
Joint work with Melody Ivory & Rashmi Sinha

IBM Almaden, Oct 2000
Web Site Design (Newman et al. 00)
Information design structure, categories of
information
Navigation design interaction with
information structure
Graphic design visual presentation of
information and navigation (color, typography, etc.)
Courtesy of Mark Newman

IBM Almaden, Oct 2000
Information Architecture includes management
and more responsibility for content
User Interface Design includes testing and
evaluation
Web Site Design(Newman et al. 00)
Courtesy of Mark Newman

IBM Almaden, Oct 2000
Web Site Design Process
Discovery Assemble information relevant to project
Design Exploration
Explore alternative design approaches (information, navigation, and graphic)
Design Refinement
Select one approach and iteratively refine it
Production Create prototypes and specifications
Courtesy of Mark Newman
Start

IBM Almaden, Oct 2000
Iteration
Design
Prototype
Evaluate

IBM Almaden, Oct 2000
Usability EvaluationStandard Techniques
User studies Potential users use the interface to complete
some tasks Requires an implemented interface
"Discount" Usability Evaluation Heuristic Evaluation
Usability expert assesses guidelines
IBM Almaden, Oct 2000
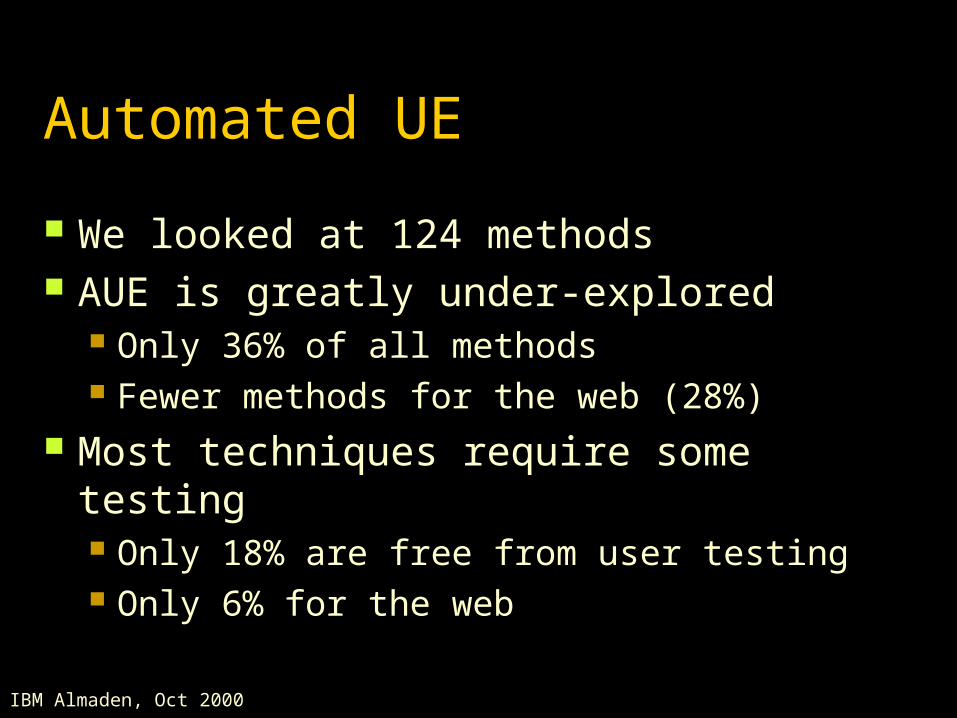
Automated UE
We looked at 124 methods AUE is greatly under-explored
Only 36% of all methods Fewer methods for the web (28%)
Most techniques require some testing Only 18% are free from user testing Only 6% for the web

IBM Almaden, Oct 2000
Survey of Automated UE
Predominant methods (Web) Structural analysis (4)
Bobby, Scholtz & Laskowski 98, Stein 97
Guideline Reviews (11) Log file analysis (9)
Chi et al. 00, Drott 98, Fuller & de Graaff 96, Guzdial et al., Sullivan 97, Theng & Marsden 98
Simulation (2) Webcriteria (Max), Chi et al. 00

IBM Almaden, Oct 2000
Existing Metrics
Web metric analysis tools report on what is easy to measure Predicted download time Depth/breadth of site
We want to worry about Content User goals/tasks
We also want to compare alternative designs.

IBM Almaden, Oct 2000
Web TANGOTool for Assessing NaviGation & Organization
Goal: automated support for comparing design alternatives
How: Assess usability of the information architecture
Approximate information-seeking behavior Output quantitative usability metrics

IBM Almaden, Oct 2000
Benefits/Tradeoffs
Benefits Less expensive than traditional methods Use early in design process
Tradeoffs Accuracy?
Validate methodology with user studies Illustrate different problems than traditional methods
For comparison purposes only Does not capture subjective measures

IBM Almaden, Oct 2000
Information-Centric Sites
museum, history
news, magazines
government info

IBM Almaden, Oct 2000
Guidelines
There are many usability guidelines A survey of 21 sets of web guidelines
found little overlap (Ratner et al. 96) Why?
Our hypothesis: not empirically validated So … let’s figure out what works!

IBM Almaden, Oct 2000
An Empirical Study:
Which features distinguish well-designed web pages?

IBM Almaden, Oct 2000
Methodology
Collect quantitative measures from 2 groups Ranked: Sites rated favorably via expert review or
user ratings Unranked: Sites that have not been rated favorably
Statistically compare the groups Predict group membership

IBM Almaden, Oct 2000
Quantitative Measures
Identified 42 aspects from the literature Page Composition (e.g., words, links, images) Page Formatting (e.g., fonts, lists, colors) Overall Page Characteristics
(e.g., information & layout quality, download speed)

IBM Almaden, Oct 2000
Metrics
Word Count Body Text Percentage Emphasized Body
Text Percentage Text Positioning Count Text Cluster Count Link Count
Page Size Graphic Percentage Graphics Count Color Count Font Count Reading Complexity

IBM Almaden, Oct 2000
Data Collection
Collected data for 2,015 information-centric pages from 463 sites Education, government, newspaper, etc.
Data constraints At least 30 words No e-commerce pages Exhibit high self-containment (i.e., no style sheets,
scripts, applets, etc.) 1,054 pages fit constraints (52%)

IBM Almaden, Oct 2000
Data Collection
Ranked pages Favorably assessed by expert review or user rating
on expert-chosen sites Sources:
Yahoo! 101 (ER) Web 100 (UR) PC Mag Top 100 (ER) WiseCat’s Top 100 (ER) Webby Awards (ER) & Peoples Voice (UR)

IBM Almaden, Oct 2000
Data Collection
Unranked Not favorably assessed by expert review or user
rating on expert-chosen sites Do not assume unranked = unfavorable Sources:
WebCriteria’s Industry Benchmark Yahoo Business & Economy Category Others

IBM Almaden, Oct 2000
Data Analysis
428 pages 214 ranked pages 840 unranked pages
214 chosen randomly

IBM Almaden, Oct 2000
Findings
Several features are significantly associated with ranked sites
Several pairs of features correlate strongly Correlations mean different things in ranked
vs. unranked pages Significant features are partially successful
at predicting if site is ranked

IBM Almaden, Oct 2000
Significant Differences
Metric Ranked Unranked Ranked Unranked Sig.Word Count 790.5 585.8 1604.5 1315.7 0.150Body Text % 73.7 73.2 22.4 24.5 0.824Emphasized Body Text % 26.1 25 27.2 25.7 0.672Text Positioning Count 4.4 5.4 4.8 11.2 0.244Text Cluster Count 17.9 10.8 22.1 17.4 0.000Link Count 58.8 39.2 56.6 44.2 0.000Page Size (Bytes) 57341.2 39614.9 72024.3 34312 0.001Graphic % 53.6 52.8 27.9 29.3 0.756Graphics Count 25.1 17.5 28.1 22.5 0.002Color Count 8.6 7.4 3.8 3.1 0.001Font Count 4.6 4.6 2.7 2.9 0.836Reading Complexity (GFI) 15.8 19.6 7.8 21.1 0.014
Mean Standard Deviation

IBM Almaden, Oct 2000
Significant Differences
Ranked pages More text clustering (facilitates scanning) More links (facilitate info-seeking) More bytes (more content facilitate info seeking) More images (clustering graphics facilitates
scanning) More colors (facilitates scanning) Lower reading complexity (close to best numbers in
Spool study facilitates scanning)
IBM Almaden, Oct 2000
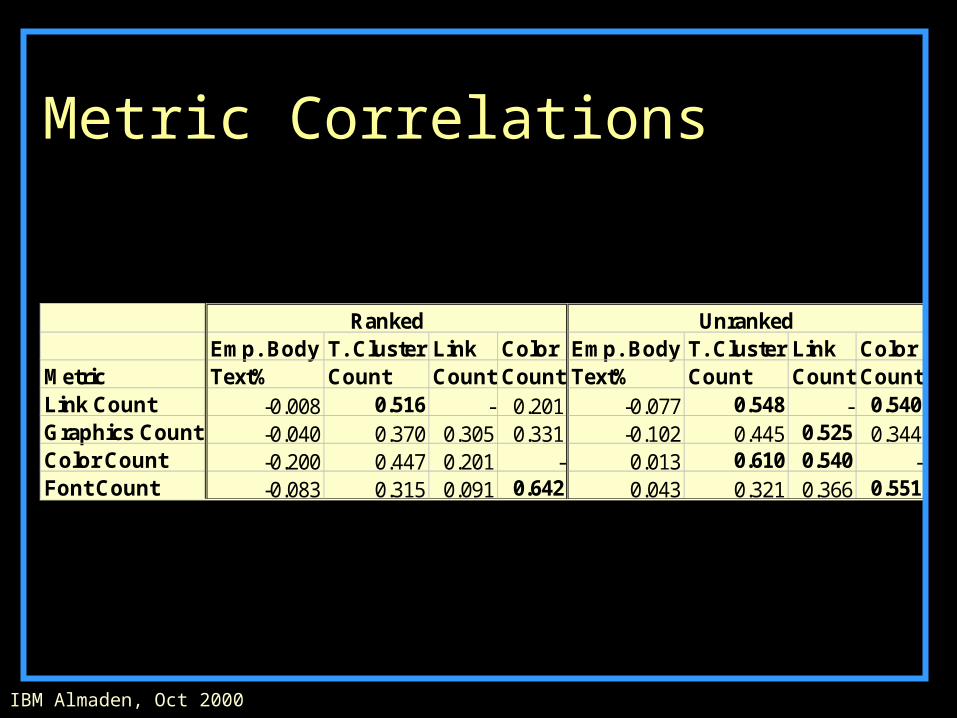
Metric Correlations
Emp. Body T. Cluster Link Color Emp. Body T. Cluster Link ColorMetric Text% Count Count Count Text% Count Count CountLink Count -0.008 0.516 - 0.201 -0.077 0.548 - 0.540Graphics Count -0.040 0.370 0.305 0.331 -0.102 0.445 0.525 0.344Color Count -0.200 0.447 0.201 - 0.013 0.610 0.540 -Font Count -0.083 0.315 0.091 0.642 0.043 0.321 0.366 0.551
Ranked Unranked

IBM Almaden, Oct 2000
Metric Correlations
Created hypotheses based on correlations: Ranked Pages
Colored display text Link clustering Both patterns on all pages in random sample
Unranked Pages Display text coloring plus body text emphasis or clustering Link coloring or clustering Image links, simulated image maps, bulleted links At least 2 patterns in 70% of random sample
Confirmed by sampling

IBM Almaden, Oct 2000
Two Examples
Metric Example Mean Std. Dev. Example Mean Std. Dev.Emphasized Body Text % 7.2 26.1 27.2 46.7 25 25.7Text Cluster Count 17 17.9 22.1 11 10.8 17.4Link Count 59 58.8 56.6 24 39.2 44.2Graphics Count 4 25.1 28.1 15 17.5 22.5Color Count 10 8.6 3.8 6 7.4 3.1Font Count 7 4.6 2.7 12 4.6 2.9
Ranked Unranked

IBM Almaden, Oct 2000
Ranked PageColored display textLink clustering

IBM Almaden, Oct 2000
UnRanked PageBody text emphasisImage links

IBM Almaden, Oct 2000
Predicting Web Page Rating
Linear Regression Explains 10% of difference between groups 63% Accuracy (better at unranked prediction)

IBM Almaden, Oct 2000
Predicting Web Page Rating
Home vs. Non-home pages Text cluster count predicts home page
ranking 66% accuracy Consistent with primary goal of home pages
Non-home page prediction Consistent with full sample results 4 of 6 metrics (link count, text positioning count,
color count, reading complexity)

IBM Almaden, Oct 2000
Second study (new results)
Better rating data Webby Awards Sites organized into categories
New metrics computation tool More quantitative measures Process style sheets, inline frames
Larger sample of pages

IBM Almaden, Oct 2000
Webby Awards 2000
27 categories We used finance, education, community,
living, health, services 100 judges 6 criteria 3 rounds of judging
We used first round only 2000 sites initially

IBM Almaden, Oct 2000
Webby Awards 2000 6 criteria
Content Structure & navigation Visual design Functionality Interactivity Overall experience
Factor analysis: first factor accounted for 91% of the variance
Judgements somewhat normally distributed, with skew

IBM Almaden, Oct 2000
New Metrics

IBM Almaden, Oct 2000
Methodology
Data collection 1108 pages 163 sites 3 levels per site
14 metrics About 85% accurate Text cluster and text positioning counts less
accurate

IBM Almaden, Oct 2000
Preliminary Results
Linear regression to predict Webby judges ratings
Top 30% vs bottom 30% Prediction accuracy:
72% if categories not taken into account 83% if categories assessed separately

IBM Almaden, Oct 2000
Significant Metrics by Category

IBM Almaden, Oct 2000
Category-based Profiles
K-means clustering of good sites, according to the metrics
Preliminary results suggest the sites do cluster
Can use clusters to create profiles of good and poor sites for each category
These can be used as empircally verified guidelines

IBM Almaden, Oct 2000
Ramifications
It is remarkable that such simple metrics predict so well Perhaps good design is good overall There may be other factors
A foundation for a new methodology Empircal, bottom up Does this reflect cognitive principles?
But, no one path to good design

IBM Almaden, Oct 2000
Longer Term Goal: A Simulator for
Comparing Site Design

IBM Almaden, Oct 2000
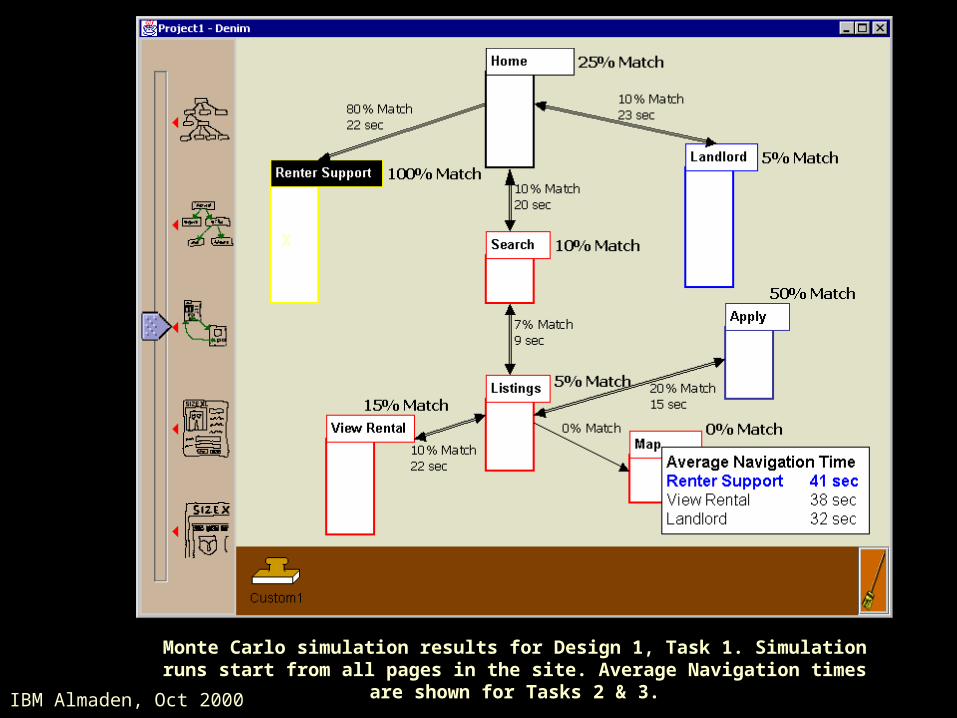
Monte Carlo Simulation
Have a model of information structure Have a set of user goals Want to assess navigation structure
Compare alternatives/tradeoffs Identify bottlenecks Identify critically important pages/links Check all pairs of start/end points Check overall reachability before and after a change.

IBM Almaden, Oct 2000
One Monte Carlo simulation step for Design 1, Task 1. Simulation starts from the home page and the target information is at Renter Support.
X
IBM Almaden, Oct 2000
Monte Carlo simulation results for Design 1, Task 1. Simulation runs start from all pages in the site. Average Navigation times are shown for Tasks 2 & 3.
X

IBM Almaden, Oct 2000
Monte Carlo Simulation
At each step in the simulation Assume a probability distribution over a set of next
choices. The next choice is a function of:
The current goal The understandability of the choice Prior interaction history The overall complexity of the page
Varying the distribution corresponds to varying properties of the links
Spot-check important choices

IBM Almaden, Oct 2000
In Summary
Automated Usability Assessment should help close the Web Usability Gap
We can empirically distinguish between highly rated web pages and other pages Empirical validation of design guidelines Can build profiles of good vs. poor sites Are validating expert judgements with usability
assessments via a user study Web use simulation is an under-explored and
promising new approach
IBM Almaden, Oct 2000
Current Projects
Automating Web Usability (Tango) Melody Ivory, Rashmi Sinha
Text Data Mining (Lindi) Barbara Rosario, Steve Tu
Metadata in Search Interfaces (Flamenco) Ame Elliott, Andy Chou
Web Intranet Search (Cha-Cha) Mike Chen, Jamie Laflen

IBM Almaden, Oct 2000
More information: http://www.cs.berkeley.edu/~ivory/web http://www.sims.berkeley.edu/~hearst

IBM Almaden, Oct 2000