ibisworld industry report o8710 child care services in ... · pdf file child care services in...
TRANSCRIPT

2 About this Industry
2 Industry Definition
2 Main Activities
2 Similar Industries
2 Additional Resources
3 Industry at a Glance
4 Industry Performance
4 Executive Summary
4 Key External Drivers
5 Current Performance
8 Industry Outlook
11 Industry Life Cycle
13 Products & Markets
13 Supply Chain
13 Products & Services
14 Demand Determinants
15 Major Markets
16 International Trade
17 Business Locations
19 Competitive Landscape
19 Market Share Concentration
19 Key Success Factors
20 Cost Structure Benchmarks
21 Basis of Competition
21 Barriers to Entry
22 Industry Globalisation
23 Major Companies
23 Goodstart Childcare Limited
25 Operating Conditions
25 Capital Intensity
26 Technology & Systems
26 Revenue Volatility
27 Regulation & Policy
27 Industry Assistance
28 Key Statistics
28 Industry Data
28 Annual Change
28 Key Ratios
29 Jargon & Glossary
IBISWorld Industry Report O8710Child Care Services in AustraliaApril 2011 Paul McMillan
Baby steps: Revenue bounces back while profits remain small
www.ibisworld.com.au | (03) 9655 3881 | [email protected]

WWW.IBISWORLD.COM.AU Child Care Services in Australia April 2011 2
Companies in this industry provide child care. Child care services are principally provided for children under 12 and include long day care centres, family day care, occasional care, after-
school hours care, and vacation care. Increasingly, child care is being incorporated with education and vacation care, as parents work longer hours and rely more on care services.
The primary activities of this industry are
Child care service
Childminding centre operation (except home or school)
Children’s nursery operation (except preschool)
Industry Definition
Main Activities
Similar Industries
Additional Resources
The major products and services in this industry are
Community-based long day care centres
Family day care
Outside school-hours care
Private long day care centres
Vacation care
About this Industry
N Education
Schools can provide care services before and after classes, which are often outsourced to child care providers.
N8410 Preschool Education in Australia
Kindergarten provides between one and four hours of care per week.
O8722 Crisis and Care Accommodation in Australia
This industry includes orphanages, which by definition provide round-the-clock care for children without parents.
For additional information on this industry
www.abs.gov.au
Australian Bureau of Statistics
www.aihw.gov.au
Australian Institute of Health and Welfare
www.fahcsia.gov.au
Department of Families, Housing, Community Services and Indigenous Affairs

WWW.IBISWORLD.COM.AU Child Care Services in Australia April 2011 3
Market Share
Goodstart Childcare Limited 7.1%
Key External DriversFemales in the
labour force
Population aged
14 or younger
Real household
disposable income
Total employees in
the labour force
Key Statistics Snapshot
Industry at a GlanceChild Care Services in 2011
Revenue
$7.3bnProfit
$22.0mWages
$4.7bnBusinesses
15,265
Annual Growth 11-16
4.7%Annual Growth 06-11
2.1%
Industry Structure Life Cycle Stage Mature
Revenue Volatility Low
Capital Intensity Low
Industry Assistance High
Concentration Level Low
Regulation Level Heavy
Technology Change Low
Barriers to Entry Medium
Industry Globalisation Low
Competition Level Low
FOR ADDITIONAL STATISTICS AND TIME SERIES SEE THE APPENDIX ON PAGE 28
p. 23
p. 4
SOURCE: WWW.IBISWORLD.COM.AU

WWW.IBISWORLD.COM.AU Child Care Services in Australia April 2011 4
Key External Drivers Females in the labour forceThe workforce participation rate of women with dependent children affects demand for child care services.
Population aged 14 or youngerChildcare centre demand, occupancy and profitability will all be affected by changes in the population of dependent children under the age of 12 years, and particularly under the age of 5 years,
within the catchment area of the centre.
Real household disposable incomeHouseholds with higher disposable incomes are more likely to afford and utilise child care services.
Total employees in the labour forceEconomy-wide employment levels reflect the availability of paid work, and hence affect demand for work-related child care.
Executive Summary
The industry has been aided and encouraged by increasing Federal Government assistance for parents looking to put their children into day care. Under the Howard Government, an effort to increase the nation’s birthrate resulted in initiatives such as the Baby Bonus. Meanwhile, several family payments to assist in affording child care, principally the Child Care Benefit, were paid out to encourage parents back into the workforce. Commonwealth Government budget papers suggest that appropriations for child care support were $1.8 billion in 2008-09, or about
$2,250 per child enrolled in care. Over 800,000 children are expected to use government subsidised child care in 2010-11. As a result, the industry has gone from strength to strength. In 2010-11, the industry is set to be worth about $7.3 billion, having grown by 2.1% each year in real terms since 2005-06. The industry has exhibited strong growth over the past decade, even taking into account the recent shake-up of consumer confidence during the global financial crisis, which temporarily affected growth.
In 2008-09, the industry went backwards for the first time in over a decade, as consumers reduced the
amount of time their children were in care, and relied on family and babysitters instead. As unemployment rose in 2009, families had less money to spend on care, and more time to provide care themselves. The increase in part-time work also gave parents greater freedom to care for their own children. In 2009-10, the industry made some headway, though revenue grew by just 0.7%. A similar increase in industry revenue is expected for 2010-11 at 0.6%, as households find more room in their budgets for child care, and confidence returns following the collapse of former player ABC Learning.
The future of child care in Australia remains bright. Demand is strong and expected to grow over the coming five years. Continued government support and a mini baby boom will contribute to 4.7% average real growth in revenue over the five years through 2015-16 to reach a total of $9.2 billion. However, this good news is conditional on shrinking margins for operators. Government regulation mandating higher staff-to-child ratios and higher levels of staff qualifications are likely to increase wage costs for operators. As wages make up the single largest cost for child care providers, operators trying to make a profit in the industry will find themselves increasingly pressured. This is a key factor leading to the dominance of non-profit operators, which promises to be the defining story of the industry in the long-term.
Industry PerformanceExecutive Summary | Key External Drivers | Current Performance
Industry Outlook | Life Cycle Stage
Government regulations will increase wages and put pressure on profit margins

WWW.IBISWORLD.COM.AU Child Care Services in Australia April 2011 5
Industry Performance
ABC Learning closures At the beginning of 2008, ABC Learning controlled about 1,200 centres (of about 15,000 childcare centres nationally), and receivers could not find buyers for all of these centres. As the ABC collapse played out in the national media, the Federal Government was compelled to step into the breach and prop up many unprofitable centres, which curbed falls in establishment numbers. Despite this, 55 former ABC centres were forced to close by the end of 2008. In 2009-10, slowing demand resulted in some small operators being forced to close, despite demand transferring from closing ABC centres. This drop will be more than offset by a
4.3% jump in establishment numbers over 2010-11, as economic conditions improve and it becomes clear that the ABC collapse has not endangered long-term demand for child care services. Establishment numbers have grown at an annualised rate of 3.1% over the five years through 2010-11, even taking into account contractions of 1.2% in 2008-09 and 2.1% in 2009-10. Toward the end of 2009, it became more apparent that only a small number of ABC centres would close, as some would receive ongoing government support and others would find buyers. Earlier expectations, based on a collapsing international economy, assumed that few
Current Performance
While the Australian economy dodged a bullet in 2009, childcare centres did not benefit. Due to international economic fears, a drop in sentiment led to a sharp increase in part-time employment as companies attempted to cut costs without shedding staff. This gave a number of parents the time to care for children themselves. Furthermore, many parents who lost their jobs but still required child care were unable to pay for it. Instead, those falling on hard times tended to look to relatives and friends for help. The same trend applied to working parents concerned about
their finances. While there were early indications that unemployment would rise throughout 2010, Australia’s economy remained resilient, and unemployment stayed below 6.0%. During 2010-11, unemployment is expected to fall half a percent. The collapse of ABC Learning created a sharp drop in confidence in the viability of childcare centres, which limited new business starts. The reduction in total centres in 2009, due to ABC’s eventual dismantling and sale, meant that revenue per establishment was more resilient than revenue itself.
Key External Driverscontinued

WWW.IBISWORLD.COM.AU Child Care Services in Australia April 2011 6
Industry Performance
ABC Learning closurescontinued
would be willing to invest in new business. Government intervention and a resurgent non-profit involvement in child care have allayed these fears. In addition, early
indications suggest that new charity-backed GoodStart Childcare, the largest single buyer of former ABC centres, is performing well.
Tough conditions During the second half of 2008, ABC Learning’s collapse came as a surprise: the failure of the US business was generally regarded to be no threat to ongoing Australian operations. The eventual sale of 60% of the company’s US business was assumed to be the result of being too highly leveraged when the credit crunch hit. Local centres were thought to be profitable, but this assumption has since been called into serious doubt. As it turned out, ABC was operating unsustainably in the domestic market and the loss of centres, and subsequent lower fees for care in crowded centres, ensured that overall industry revenue during 2009-10 grew by only 0.7%. Despite these difficulties, industry revenue is set to grow at an average annual rate of 2.1% over the five years through 2010-11, reaching $7.33 billion. Industry revenue shot up in 2005-06, with growth above 7.0%, as many Australians took advantage of the newly affordable services, and providers simultaneously increased care standards and fees. In 2007-08, growth fell below 6.0% for the first time since funding was increased. Industry revenue will be boosted by a greater reliance on child care services, a real increase in child care fees, and greater government involvement and subsidisation.
The proportion of children in formal care decreased across the three years to 2008, from 23% to 22%, reversing a
long-term trend of increasing preference for formal care over informal care (provided by friends and family). The drop occurred before global economic troubles became an issue for Australian consumers, suggesting that the problems facing ABC Learning caused serious concerns among parents and guardians. This trend was exacerbated by poorly performing economic indicators, such as employment and disposable income. As the Australian economy recovers from the economic slowdown and employment levels improve, more parents are expected to seek paid child care. This trend will strengthen as the ABC collapse fades from the public memory and legislation comes into place to further ease consumer concerns regarding the quality of service provided by formal child care.
Government funding Real expenditure by the Commonwealth Government on child care will increase at an average annualised real rate of 2.1% in the five years through 2010-11. This will mean that families will assume a greater responsibility for the cost of formal child care. In particular, as a great deal of
government funding is directed to care providers as opposed to parents, it has had a mildly inflationary effect on private child care. However, the increasing cost of child care comes with rising personal incomes (excluding drops in 2008-09 and 2009-10), meaning the increased cost to

WWW.IBISWORLD.COM.AU Child Care Services in Australia April 2011 7
Industry Performance
Government fundingcontinued
families will be negligible. Demand for services is only marginally affected by price, as many parents consider child care a necessity in order to continue working. During the downturn, families that had two jobs were more focused on retaining employment, which increased their desire to pay for child care. The Commonwealth Government budget papers indicate relatively strong growth in approved child care places in 2005-06 (up 8.6%) and 2006-07 (4.4%). This growth was a symptom of a trigger to encourage further industry expansion as many spots were rapidly filled, particularly in community-based care centres. An increase in the number of child care places between 2002-03 and 2008-09 occurred, despite virtually static growth in the population of Australian children aged 0 to 4 years, and a decline in the population of children aged 5 to 9 years (averaging 0.5% growth per year). The increase in child care places over the past five years will be
influenced by a relatively high female workforce participation rate and by Commonwealth Government policy.
Growth in government spending on the Child Care Benefit scheme has been relatively slow since 2002-03, due mainly to low growth in the supply and use of long day care, and weak growth in the supply of family day care (more expensive types of child care). As child care became more accepted by families, the desire to spend on care has grown, alleviating the pressure on government to encourage growth. Industry revenue has been bolstered in the past five years by a significant real increase in child care fees. However, higher fees and a fall in affordability may have caused slow growth in demand for child care services, which would offset some revenue growth. In the five years through 2010-11, the rate of growth in child care prices will be more than three times as fast as the rate of growth in overall consumer prices.
Profitability problems ABC’s troubles raise questions about the long-term profitability of child care providers. High occupancy rates are required and ABC’s failure indicates that running multiple centres is no solution, as costs are not limited by this business model. The industry as a whole is barely profitable, primarily due to the presence of not-for-profit community-based centres, and a lack of economies of scale. The collapse of ABC Learning showed that opening multiple centres does not provide sufficient cost savings to justify the expense. As such, the industry’s profit margin fell from about 0.5% in 2008-09 to 0.3% in 2010-11, as a significant number of former ABC centres passed into the hands of non-profit organisations. That said, profitability of private childcare centres varies by state and territory and is sensitive to state and territory government regulations. These regulations can relate to staff-to-child ratios, the required level of staff qualification, and requirements relating
to the age mix of children. Where regulations demand higher ratios of staff to children or greater qualifications, costs can be significantly higher than other areas, driving profits down. Volunteer labour is commonly found in occasional care (as opposed to full day care), where it constitutes 25% of staff. Profitability can also be affected by the availability of state and territory government funding. The introduction of the Federal Government child care Quality Framework will bring a larger degree of standardisation to industry regulation.
Profitability can be sensitive to the capacity of the childcare centre and occupancy levels. Large centres can provide a wider range of services (defraying the cost of these services over larger capacity), and promote the benefit of these services to bolster occupancy levels. Generally, long day care centres require occupancy rates of at least 70% to be profitable. However, there have been recent large increases in wages for child

WWW.IBISWORLD.COM.AU Child Care Services in Australia April 2011 8
Industry Performance
Profitability problemscontinued
care workers in most states, and this has had an impact on profitability. In May 2006, the Australian Industrial Relations Commission awarded wage increases for child care workers in Victoria and the Australian Capital Territory; the increases were phased in over the ensuing 18 months. In March 2006, the
Industrial Relations Commission in New South Wales awarded a 16% increase in wages for child care workers. The introduction of the Federal Government child care Quality Framework is expected to put upward pressure on wages, as it asks operators to employ more staff per child, and more qualified staff overall.
Industry Outlook
With a help from the government and the private sector, the industry has pulled through ABC’s collapse and the threat of an economic crisis, and is set for prolonged growth over the next five years. As the dust settles and the industry realigns itself after the lessons learned from ABC’s failure, all industry performance indicators are positive: government funding remains a priority, the unemployment rate is set to remain low by historical standards, the share of women in the workforce will grow, and incomes will continue to rise. IBISWorld forecasts that industry revenue will
increase at an average annualised real rate of 4.7% in the five years through 2015-16, despite sluggish growth of 0.6% in 2010-11. However, profitability is likely to suffer, as non-profit operators continue to proliferate and increases in labour costs resulting from more stringent regulation cannot be fully passed on in the form of higher child care fees. Government handouts will seek to reduce the effect of rising child care costs on households, but tightening profit margins will remain the major obstacle facing child care operators in the next five years.
Demand trends Over the next five years, there will be an increase in the population of children aged under 10 years, which will have a positive effect on demand for child care services. This is a turnaround from the past five years, when young population growth was stagnant. The country has recently undergone a mini baby boom, which will help drive future demand, particularly as the job market continues to pick up over 2011-12. Changes in the population of children in the 0 to 4 years age group will vary significantly by region, which will provide varying growth profiles by region. Low first-home affordability and rising residential rents will affect family decisions on the location of their home, and limit the room in household budgets for child care. However, child care is increasingly regarded as a necessary expense in households where both parents work, and also single parent households. Long day care and family day care, the most
expensive types of care, are principally provided for the 0 to 4 years age group.
Periods of higher unemployment and part-time employment will increase the likelihood that households with children will have at least one parent or relative staying at home to care for their children. The Commonwealth Government Family Tax Benefit initiatives may provide an incentive for many families to have one parent stay at home to care for young children. In areas where there is negative or low employment growth, child care services will experience lower demand. IBISWorld expects unemployment levels to remain in the 4.0% to 5.0% band for the next five years, which is historically low. Demand for paid child care services
Child care will be in weak demand in areas with low employment levels

WWW.IBISWORLD.COM.AU Child Care Services in Australia April 2011 9
Industry Performance
Demand trendscontinued
is likely to remain strong in these conditions. Relatively high rates of female workforce participation and growth in the number of single-parent families have combined to result in large levels of unaccounted demand for outside school-hours care. Increased reliance on informal care from friends and family has created a climate whereby informal carers are less willing to continue providing help
in the long-term, increasing demand for formal care. Continued government support for the industry and its customers will continue over the next five years. The Federal Government has a history of offering significant tax rebates to parents in order to aid child care affordability. Funding child care services is seen as popular politics and encourages greater participation in the workforce.
Sustainable child care The collapse of ABC has indicated the difficulty in maintaining profitable centres. IBISWorld estimates that an occupancy rate of between 70% and 80% is required for a centre to maintain profitability. One of the most drastic outcomes of the ABC collapse has been a marked increase in non-profit child care providers. Indeed, the majority of former ABC centres are now run on a not-for-profit basis, often by charity or community groups. Private child care providers in the industry are small, and often run for philanthropic or community purposes. This means that the industry is unlikely to reach the profit levels prior to ABC’s collapse, and IBISWorld expects overall industry profit to remain below 1.0% to 2015-16. Individual operators hoping to earn a profit in the industry may find it possible by seeking out a niche, or by operating in locations where demographic and competitive factors are particularly favourable.
New regulations aimed at increasing staff-to-child ratios and mandating child care workers’ levels of qualifications will be introduced progressively over the next five years. All employees in the industry will be required to have Certificate III-level qualifications, and at least one employee with University-level teaching qualifications will be required to be present during all operating hours. Reportedly, there are large qualified labour shortages looming for operators, and this shortfall will certainly lead to increased wage costs, which will also grow as operators have to employ more people to meet the new mandatory staffing levels. Indeed, many providers are likely to face considerable difficulties complying with legislative requirements, especially in remote and regional areas where access to education is reduced. As wages make up the bulk of operating costs in the industry, wage pressures are one of the key reasons operators rely on government assistance

WWW.IBISWORLD.COM.AU Child Care Services in Australia April 2011 10
Industry Performance
Sustainable child care continued
to stay in business. Over the next five years, the industry’s labour force is projected to grow 4.9% a year, and operators will also have to contend with
the industry’s average wage growing by an average of 1.4% every year. The result will be labour costs growing by 6.4% every year to 2015-16.
Paid parental leave In early 2011, the Australian Federal Government introduced a paid parental leave scheme. Under the scheme, Australian parents became eligible for an 18 week period of paid leave, at the national minimum wage, during the first year of their child being born or adopted. There was some speculation that this would have a detrimental effect on the child care industry’s performance. However, most families have at least one carer stay home for an extended period following childbirth, regardless of such
incentives, and are unlikely to seek paid care for their newborn during this time. As the allowance only applies for an 18 week period, over a time when most parents would not use the industry’s services regardless, this is unlikely to have a superficial influence on the demand for the industry’s services. Indeed, it is likely to further normalise the concept of households with two working parents, and thus act as an incentive for parents to stay in paid employment over the longer term, driving overall demand for childcare.

WWW.IBISWORLD.COM.AU Child Care Services in Australia April 2011 11
Industry Performance
The industry relies heavily on government funding
Governments have promoted the use of work-related child care services
The industry’s share of GDP will stabilise
Life Cycle Stage
SOURCE: WWW.IBISWORLD.COM.AU
30
25
20
15
10
5
0
–5
–10–10 100 20–5 155 25 30
% G
row
th o
f p
rofi
t/G
DP
% Growth of establishments
DeclineCrash or Grow?
Potential Hidden GemsFuture Industries
Quality GrowthHigh growth in economic importance; weaker companies close down; developed technology and markets
Time WastersHobby Industries
MaturityCompany consolidation;level of economic importance stable
Shakeout
Sh
ake
ou
t
Quantity GrowthMany new companies; minor growth in economic importance; substantial technology change
Key Features of a Mature Industry
Revenue grows at same pace as economyCompany numbers stabilise; M&A stageEstablished technology & processesTotal market acceptance of product & brandRationalisation of low margin products & brands
Education
Toy and Game Retailing
hakeoutPreschool Education
Newspaper, Book and Stationery Retailing
Crisis and Care Accommodation
Child Care Services

WWW.IBISWORLD.COM.AU Child Care Services in Australia April 2011 12
Industry Performance
Industry Life Cycle Much of the industry’s growth has been predicated on steadily increasing funding in the form of public money. Successive governments have offered cash incentives to encourage women back to work by placing children in care; this has occurred to increase the national participation rate. Over the past decade, attendance at childcare centres has been steadily increasing, save for a drop in 2008, as poor economic conditions constrained family budgets. The ongoing trend is likely to remain positive as far as total industry revenue is concerned. However,
after years of encouragement by the government, the proportion of families using child care providers may reach a level of saturation, causing establishment growth to moderate. Following the collapse of ABC Learning Centres, the consolidation that often takes place in a mature industry is absent. The apparent lack of profitability in the industry means that large companies are unwilling to enter the industry via acquisition, and existing players will be cautious to expand; ABC demonstrated the inability of economies of scale to increase profits.
This industry is Mature

WWW.IBISWORLD.COM.AU Child Care Services in Australia April 2011 13
Products & Services Long day care centres represent the largest share of industry revenue. These providers offer care primarily for below school-age children with working parents. IBISWorld estimates there are 410,500 children in long day care in 2009-10. All-day care is provided by a network of individuals (care givers) who provide care in their own homes for other people’s children. Based on the Australian Government Census of Child Care Services (AGCCCS), IBISWorld
estimates that in 2010-11 there will be about 110,000 children in family day care. Outside school-hours carers mainly provide services to primary school children before and after school. These services, provided by non-profit and for-profit organisations and state and local governments, cater for the needs of families who require short-term care for their children. In 2010-11, there are likely to be about 207,000 children in outside school-hours care. Vacation
KEY BUYING INDUSTRIES
Z9901 Consumers in Australia
Australian parents who work often require child care services to ensure their children are supervised during work hours.
KEY SELLING INDUSTRIES
G5242 Toy and Game Retailing in Australia
Children require some autonomous tools for fun and learning as well as personalised care.
G5243 Newspaper, Book and Stationery Retailing in Australia
Along with toys, children’s books are an ideal means of entertaining and occupying children in care.
M8111 Central Government Administration in Australia
The government is becoming an increasingly important source of funding, as it encourages families to place children in care.
M8112 State Government Administration in Australia
State governments, while not placing money directly in the hands of child care users, actively fund community centres, along with local councils.
N8410 Preschool Education in Australia
Preschool education is provided in long day care centres. As such, many teachers are seconded from the education system.
Products & MarketsSupply Chain | Products & Services | Demand Determinants
Major Markets | International Trade | Business Locations
Supply Chain

WWW.IBISWORLD.COM.AU Child Care Services in Australia April 2011 14
Products & Markets
DemandDeterminants
The Federal Government has made a point over the past decade of encouraging parents to return to the workforce. In pursuit of this, the level of public money devoted to child care and other parenting initiatives has increased. These include the $4,000 baby bonus, valued at $1.3 billion, which has increased annually by an average of about 10% since it was implemented. Government spending has also come in the form of direct funding to child care providers and rebates to families with children in child care. However, these rebates have not acted as a definite remedy for struggling parents, instead the industry itself has been the main beneficiary.
An increase in the supply of child care places can satisfy unmet demand, and increase underlying demand. The availability of flexible session times can bolster demand, particularly from families who work shifts or overtime. The presence of a new childcare centre in a region previously lacking one is likely to stimulate industry demand in that particular geographic region. However, increasing competition by adding new centres to an area with several already there is unlikely to boost demand for services. Any increase in household disposable income is likely to boost demand for child care. However, an
increase in such income is most likely the result of a second householder returning to work, which suggests that the children have already been placed in care for some time each week. Further to this, increases in disposable income tend to increase discretionary spending on luxury items; child care is increasingly being viewed as compulsory. As a result, growth in household income is becoming less likely to prompt demand as it has been in the past. As it stands, around 48% of Australian children attend some form of child care.
The availability (or supply), and cost of alternative informal child caring arrangements has a pronounced impact on industry demand. The presence of a high number of students or adolescents in a geographic area often indicates a higher than normal percentage of non-
Products & Servicescontinued
care, which provides child care services during school holidays, is increasing in popularity, picking up on a trend that has been prominent in the United States for some time.
Private centres generate nearly three times the revenue of public centres. This has occurred with a shift toward centralised Federal Government funding, directed equally at providers and parents. This is a trend likely to continue, despite the reluctance of major companies to enter the market after ABC’s troubles. Small organisations, often with a similar business model to community centres, will still operate as private due to more
easily accessed funding. The popularity of school holiday-based camps as a means of child care is rising. Parents with flexible hours during the school year often lack the available holidays to remain at home with their children, so camps become an option. Federal Government funding has been directed toward private operators, reducing the number of community-based care centres per child as private operators have capitalised on increased income. However, much government funding has also been in the form of rebates for parents, which has caused private centres to increase fees to match.
Percentage of work-related child care
Type Hours of care (%)
Family day care 88
Long day care 90
Outside school-hours care 97
Occasional care 49
Vacation care 93
SOURCE: DEPARTMENT OF HEALTH AND FAMILY SERVICES
WWW.IBISWORLD.COM.AU Child Care Services in Australia April 2011 15
Products & Markets
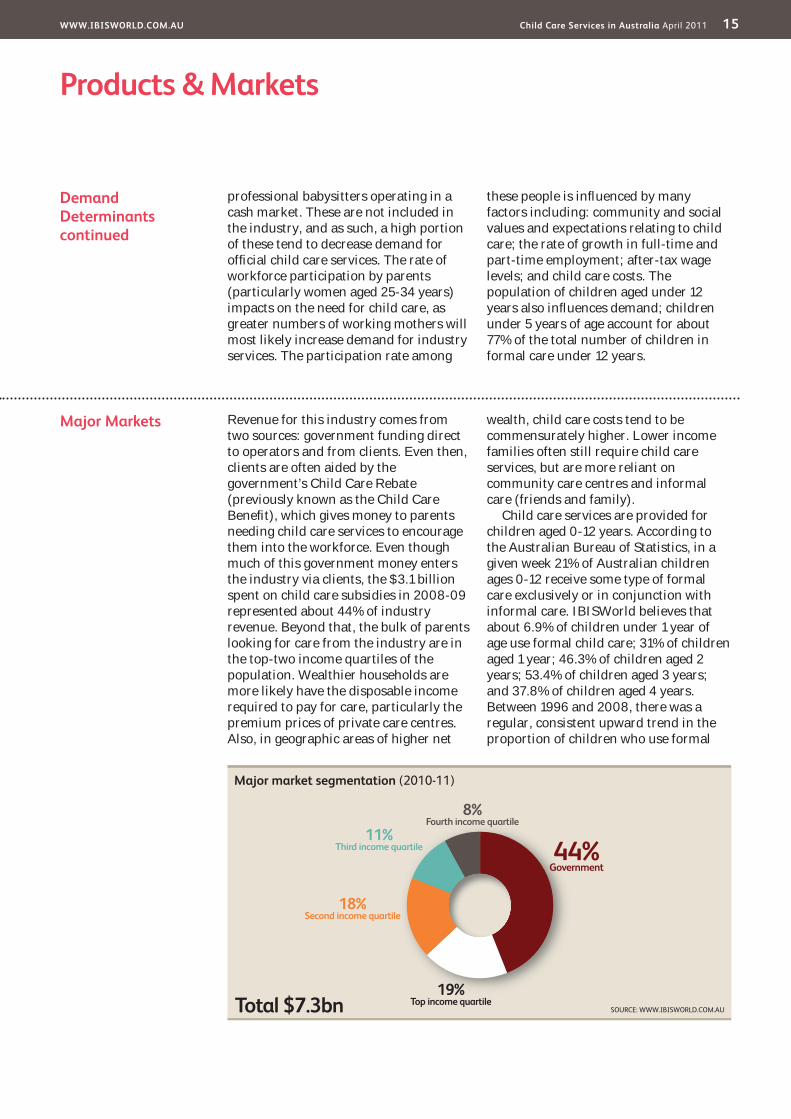
Major Markets Revenue for this industry comes from two sources: government funding direct to operators and from clients. Even then, clients are often aided by the government’s Child Care Rebate (previously known as the Child Care Benefit), which gives money to parents needing child care services to encourage them into the workforce. Even though much of this government money enters the industry via clients, the $3.1 billion spent on child care subsidies in 2008-09 represented about 44% of industry revenue. Beyond that, the bulk of parents looking for care from the industry are in the top-two income quartiles of the population. Wealthier households are more likely have the disposable income required to pay for care, particularly the premium prices of private care centres. Also, in geographic areas of higher net
wealth, child care costs tend to be commensurately higher. Lower income families often still require child care services, but are more reliant on community care centres and informal care (friends and family).
Child care services are provided for children aged 0-12 years. According to the Australian Bureau of Statistics, in a given week 21% of Australian children ages 0-12 receive some type of formal care exclusively or in conjunction with informal care. IBISWorld believes that about 6.9% of children under 1 year of age use formal child care; 31% of children aged 1 year; 46.3% of children aged 2 years; 53.4% of children aged 3 years; and 37.8% of children aged 4 years. Between 1996 and 2008, there was a regular, consistent upward trend in the proportion of children who use formal
DemandDeterminantscontinued
professional babysitters operating in a cash market. These are not included in the industry, and as such, a high portion of these tend to decrease demand for official child care services. The rate of workforce participation by parents (particularly women aged 25-34 years) impacts on the need for child care, as greater numbers of working mothers will most likely increase demand for industry services. The participation rate among
these people is influenced by many factors including: community and social values and expectations relating to child care; the rate of growth in full-time and part-time employment; after-tax wage levels; and child care costs. The population of children aged under 12 years also influences demand; children under 5 years of age account for about 77% of the total number of children in formal care under 12 years.

WWW.IBISWORLD.COM.AU Child Care Services in Australia April 2011 16
Products & Markets
International Trade There is no international trade in this industry.
Major Marketscontinued
care. In 2008-09, children aged 0-4 years accounted for 96.7% of children attending community-based long day care centres, 89.5% of children attending private long day centres, and 75.2% of children in family day care schemes. In outside school-hour services, 95.4% of children attending are between the age of 5 years and 11 years. The market for child care services can be segmented by family type; families with two working parents
or a sole parent, and family income. The vast majority of care is provided for children of parents as they work. About 54% of all revenue is derived for work-related care. This proportion slid during 2008-09 and 2009-10, as unemployment rose and incomes fell. However, as the economy began to recover in 2011, economic growth became the predominant cause for parents demanding care.

WWW.IBISWORLD.COM.AU Child Care Services in Australia April 2011 17
Products & Markets
SOURCE: WWW.IBISWORLD.COM.AU
TAS2.5
WA7.0
QLD25.5
VIC21.5
NSW31.5
NT1.0
SA8.5
ACT2.52.5
Children in attendance (%)
Cold Zone (<10)
<25
<50
Hot Zone (<100)
Not applicable
Business Locations 2011

WWW.IBISWORLD.COM.AU Child Care Services in Australia April 2011 18
Products & Markets
Business Locations The geographic distribution of industry activity largely reflects variations in the population of children and is also influenced by: the cost and supply of child care; labour, income and housing affordability patterns; and child care subsidy policies. The population of children aged 0-4 years is a significant determinant of demand for long day care and family day care services. Victoria and South Australia account for a disproportionate share of the number of children in outside school-hours care (27.5% and 11.7% respectively) when taking into consideration the population of children in these states.
IBISWorld estimates that revenue generated per establishment in New South Wales and Victoria is greater than the national average, as these states have a higher average wage and more families with two working parents. This also indicates that these states have a greater share of private centres, rather than community-based providers. These states’ average cost of childcare is comparatively high, with New South Wales being the most expensive. Economic growth in Western Australia is less likely to increase child care activity, primarily due to growth being overwhelmingly centred on mining operations, which themselves mainly employ men. Also, there is a moderately
smaller share of single parents in that state. However, increasing wages, population and government support suggest that Western Australia will experience a modest increase in the national industry revenue share over the next five years. The collapse of ABC Learning had the potential to significantly alter the geographic balance of this industry, but consumer demand and government assistance has ensured that there have been fewer closures than originally anticipated. In terms of centres and revenue, the industry is still spread nationally along roughly similar lines to the population of young children.

WWW.IBISWORLD.COM.AU Child Care Services in Australia April 2011 19
Key Success Factors Ability to take advantage of government subsidiesGovernment assistance is available to child care operators and crucial to the viability of many childcare centres.
Easy access for clientsLocation is an important factor affecting the profitability of child care services. Supply-demand factors affect occupancy rates and the fees that can be charged.
Ability to attract local supportMarketing skills are important in filling places at childcare centres operating in this industry. Having and maintaining a good public reputation will ensure repeat custom.
Compliance with government regulationsIndustry operators must apply with the National Childcare Accreditation Council and complete the accreditation program within 18 months. The level of regulation within the industry is increasing.
Ability to alter mix of inputs in line with costAn optimum number of places and age mix of children will help ensure profitability for operators in this industry.
Optimum capacity utilisationThe maintenance of high occupancy rates is crucial to success in this industry. In order to be profitable, a centre must have an occupancy rate of at least 70%.
Market Share Concentration
Prior to the collapse of former industry powerhouse, ABC Learning, the industry was highly concentrated with the company commanding a 30% share of revenue in 2007-08. Following ABC’s collapse, the industry has returned to the low level of concentration prevalent before the company’s rise. Sole major player, GoodStart, is estimated to have a market share of 7.1%. The collapse of ABC Learning has lead to a drastic rethink of how the industry operates within the community. In submissions to a senate report into the provision of child care which came about following the ABC collapse, community and industry groups advocated regulatory changes to prevent future concentration of market share in the hands of one proprietor. In particular, concerns were raised about ABC’s receivers selling large blocks of ABC’s former centres as a ‘job lot’ to a single purchaser.
Although a job lot sale did go through,
with new major player GoodStart purchasing 678 former ABC centres, the end result of the ABC collapse has been far more fragmented. The majority of ABC’s former centres have been taken over in smaller lots by a mix of small independent operators and community and charity groups. This shows that the industry is reverting to a more traditional model, with a substantial proportion of non-profit operators in the mix. The failure of ABC suggests that a multi-centre business model does not deliver operators significant cost savings. Wages are required at all childcare centres, and there are few products required that can be purchased in bulk to generate savings. This suggests smaller, less-profitable operators and non-profit groups will dominate the industry in the future; especially in locations where demographic factors make running a profitable childcare centre unviable.
Competitive LandscapeMarket Share Concentration | Key Success Factors | Cost Structure Benchmarks
Basis of Competition | Barriers to Entry | Industry Globalisation
Level
Concentration in this industry is Low
IBISWorld identifies 250 Key Success Factors for a business. The most important for this industry are:

WWW.IBISWORLD.COM.AU Child Care Services in Australia April 2011 20
Competitive Landscape
Cost Structure Benchmarks
By a substantial margin, wages are the largest cost for players in the Child Care Services industry. IBISWorld estimates that staff-related costs account for 63.5% of industry revenue. Staff-related costs relative to revenue are lower for long day care centres compared with other types of child care. These other types of care tend to have lower property and depreciation expenses: for example, holiday care. Community-based long day care centres have high costs relating to revenue when compared with private centres. This is partly due to community centres caring for more young children, and having more qualified and experienced staff. Many private centre owner-operators do work that community centres normally pay staff to do.
The other major costs for childcare centres include property-related expenses such as rent and holding costs of owned property. IBISWorld estimates that rent constitutes about 12.8% of total revenue, as location can be of great importance to the success of a childcare centre. Ideal locations for a centre are near workplace hubs, where parents and guardians are most likely to use the industry’s services (high wage earners); it is probable that rent in these areas will be higher. Another prime location is near schools where potential clients send their children. Land and property prices are increasing across Australia in regions near private schools, which has driven up rental costs for industry players.
The level of profitability in the industry has recently been called into dispute. ABC Learning’s stated profit margins have been described by other operators in the industry as implausible, and are under investigation by regulators. As ABC represented about 30% of the industry, any falsity in their figures suggests that industry-wide profit estimates are likely to have been skewed. The closure of some former ABC centres suggests that the falling supply of centres will increase occupancy rates across the country, which might have a positive effect on industry profits. Low wages earned by the industry’s carers suggests that costs are significant and margins are tight. Recent regulatory changes, especially those mandating staff qualification levels and higher staff-to-child ratios, are likely to increase labour costs and tighten profit margins further. Coupled with the fact that a large proportion of former ABC centres are now being operated on a not-for-profit basis, the profit margin for an average child care operator sits at about 0.3% of revenue.
In the long-term, it appears that without further substantial increases in government funding, profit levels in excess of 2.0% may be difficult to achieve for any individual operator. This will be mainly due to the industry becoming highly competitive, and consumers have been conditioned to expect care at low prices. For-profit firms in the industry will find it difficult to raise their prices without losing clients.
Industry Costs and Average Sector Costs■ Profi t
■ Rent
■ Utilities
■ Depreciation
■ Other
■ Wages
■ Purchases
Industry
Costs
(2011)
Average Costs
of all Industries
in sector (2011)
0 100%
0.3Profit
10.863.58.2
2.2
2.212.8
8.1Profit
15.253.515.63.5
1.0SOURCE: WWW.IBISWORLD.COM.AU
3.1

WWW.IBISWORLD.COM.AU Child Care Services in Australia April 2011 21
Competitive Landscape
Barriers to Entry Entering this industry has grown easier over time in some respects and harder for others. The end of the ABC Learning era has resulted in a proliferation of small centre operators. The threat of a large major player has been removed, making entering easier than ever before. Government assistance is plentiful, demand remains strong, and there are cheap centres on the market that are available for either purchase or rent. Family day care is provided in the home of the carer with registration required from coordinating units, which is in turn registered with the Commonwealth
Government to obtain funding. Regulation of home carers is increasing, as parental concerns dictate the government regulatory environment.
Among day care centres, new industry entrants also have a substantial regulatory environment to contend with, and copious registration guidelines controlling the size, location and operations of new establishments. This environment is set to become more stringent over the next few years as new changes come into effect. The cost and time required to obtain local council approval and a state government license
Basis of Competition Parents can be attracted to superior child care staff qualifications, staff-to-child ratios, the quality level of centre facilities, and aesthetic surroundings. Some long day care centres provide preschool education services. This is a trend that is expected to continue, as centres attempt to add value to their services. Many players today refer to themselves as learning centres rather than day care or childcare centres, in order to promote this notion. According to the Australian Bureau of Statistics (ABS), while customers of the industry are conditioned to expect low-cost care they are mostly driven by a centre’s reputation for quality care. After the likelihood of quality care, the location of a childcare centre is of pivotal importance to potential clients. The bulk of parents place their children in care while they are engaged in an activity that the children cannot attend: such as work. It stands to reason that the most convenient location for a centre would lie on a commonly travelled route between a populated area (with young families) and a concentrated commercial centre such as the central business district of a major city. As child care is in essence a service that offers convenience, there is a level of travel time to and from dropping off and picking up a child that would negate the benefits of paying for the service. As such, locating a facility in a region with a large
proportion of young families is crucial to remaining competitive.
In 1991, private long day care services were granted Child Care Assistance Rebate subsidies, which had the effect of reducing the net amount of fees payable by some parents at private centres. This resulted in large increases in demand and supply of places available in these centres. Long day care generally charge higher fees compared with family day care. The method of government subsidising of child care has varied across the ensuing two decades. However, the bulk of child care funding is paid direct to consumers, while community centres receive direct funding and other child care providers are given tax concessions. Access to tax concessions and funding are a key means of competing with other local providers. Employers are able to provide child care as part of a salary package, and hence reduce the after-tax cost of child care to some employees (mainly employees with high incomes). This ties in with the location of a centre. A centre that is located near a high-density area with many young working families with two incomes and children will most likely need to offer long day care services. However, if the average age of the children nearby is between 5 and 12 years, then before and after school services will most likely be more important.
Level & Trend
Competition in this industry is Low and the trend is Increasing
Level & Trend
Barriers to Entry in this industry are Medium and Decreasing

WWW.IBISWORLD.COM.AU Child Care Services in Australia April 2011 22
Competitive Landscape
Industry Globalisation
Previously, this industry moved from exhibiting a low level of globalisation to a moderate level. While Australian industry operators are almost entirely Australian controlled and provide services to Australian residents, ABC Learning Centres became a global company. The collapse of ABC and the sale of its US and UK operations means that the industry has reverted to its prior domestic-oriented nature. As such, the globalisation level is again low. ABC
Learning Centres expanded to New Zealand and made acquisitions in the United States and the United Kingdom. Following the consummation of proposed acquisitions announced in December 2006, ABC expected to have at least half of its childcare centres located outside of Australia. After the transactions, ABC was set to become the world’s largest publicly traded provider of child care services and the second-largest private child care provider in the United States.
Barriers to Entrycontinued
for the centre can be a significant strain on new businesses; approval must also be sought from the Commonwealth Government so that customers continue to be eligible for Commonwealth Child Care Benefits. The cost of purchasing or building centre accommodation, together with the cost of facilities and equipment, can be prohibitive to a new entrant. In order to provide services to parents’ satisfaction, substantial costs may be incurred, as modern facilities are considered essential, while play and learning equipment must also be sourced; this must be considered in line with current notions of what is best for children of a certain age group. Numerous age groups of children often have differing needs, all of which must be catered for before the children’s parents enrol them in a new centre.
Obtaining a suitable location can also be costly, while gaining relevant local council permits to establish a childcare centre can be expensive and time-consuming. Choosing an appropriate location may only be successful in the medium-term. For example, a suburb of a major city may be replete with young families in need of care, but in five to 10
years those children would have moved on to school, and the benefit of that location would be mitigated. This is an ongoing concern for any new-starter, and location choices must address this issue. Furthermore, larger operators and large centres are in a stronger position to: attract qualified staff; to adjust the staff mix; and to defray the costs of specialist staff (dieticians, psychologists) and facilities (swimming pools). Larger players should benefit from stricter regulation and an evolution in the concept of child care from child minding to child development, care and education. However, the experience of ABC Learning has shown that economies of scale do not necessarily deliver great value to larger operators.
Barriers to entry checklist Level
Competition LowConcentration LowLife cycle stage MatureCapital intensity LowTechnology change LowRegulation and policy HeavyIndustry assistance High
SOURCE: WWW.IBISWORLD.COM.AU
Level & Trend
Globalisation in this industry is Low and the trend is Steady

WWW.IBISWORLD.COM.AU Child Care Services in Australia April 2011 23
Other Companies KU Children’s ServicesEstimated market share: Less than 1.0%Established in 1895 as the Kindergarten Union of New South Wales, KU is the largest non-government, not-for-profit employer of staff for children’s services in New South Wales, employing more than 1,000 permanent staff. KU manages 150 children’s services across New South Wales and Victoria meeting the needs of 14,000 children. KU offers a diverse range of services from occasional care to
preschool and long day care. KU has been growing consistently and robustly for some years, with growth almost uniformly in the double digits for the past five years. Even in 2008, as the industry struggled, KU grew by 9.6% due to continued expansion. It also took some business from ABC. In 2009, KU experienced 13% growth as it continued to capitalise on new opportunities emerging from the vacuum of the ABC Learning collapse. However, these expansions have come at
Player Performance In February 2010, GoodStart, a consortium between non-profits Mission Australia, Social Ventures Australia, the Benevolent Society and the Brotherhood of St Lawrence, purchased 678 former ABC childcare centres. Established in October 2009, GoodStart operates childcare centres in all Australian states and territories on a not-for-profit basis, with operating surpluses invested back into its centres. GoodStart was established through a combination of grants and a range of other funding sources, including loans from the Federal Government and the National Australia Bank and contributions from private
philanthropists. At the time of publishing, the company has yet to complete a full year of operation, but has released financial data for the nine month period up to June 2010. In that time, the company had generated $49.1 million, achieving a surplus of $3.1 million. This places it as the largest single player in the industry.
As yet, the company has retained the ABC Learning branding for most of its centres, but a rebranding is possible in the coming few years. The company provides childcare to over 75,000 children nationally, and has a presence in all states.
Major CompaniesGoodstart Childcare Limited | Other
Major players(Market share)
92.9%Other
Goodstart Childcare Limited 7.1%SOURCE: WWW.IBISWORLD.COM.AU
Goodstart Childcare Limited Market share: 7.1%
KU Children’s Services – fi nancial performance
Year*
Revenue
($ million) (% change)NPAT
($ million) (% change)
2005 49.8 34.2 0.79 119.42006 57.5 15.5 2.76 249.42007 63.8 11.0 3.81 38.02008 69.9 9.6 -2.90 N/C2009 79.0 13.0 0.04 N/C
*Year end DecemberSOURCE: ANNUAL REPORT

WWW.IBISWORLD.COM.AU Child Care Services in Australia April 2011 24
Major Companies
Other Companiescontinued
a cost. Despite producing surpluses in 2006 and 2007, the following two years resulted in losses, despite greater attendance and solid growth. 2009-10 is likely to have been more favourable environment for the company.
Family day care and outside school-hours careOrganisations that can be approved to provide family day care include incorporated non-profit community organisations, state or local governments, religious and charitable organisations, and trustees of a trust for charitable or benevolent purposes. Other operators, including private for-profit organisations, and community-based operators, are also able to apply to the Department of Families, Housing, Community Services and Indigenous
Affairs, through the planning system for new family day care places in identified areas of need.
Until recently, most Commonwealth-funded, stand-alone, outside school-hours care services were provided by community-based, non-profit organisations. From 1 July 1999, private for-profit operators were eligible to take over existing community-based outside school-hours care services. Many primary schools offer outside school-hours care before and after classes, to assist working parents. These are sometimes provided by the school, which charges parents and sources qualified carers, but the care work is more often outsourced to another child care firm. Other providers of outside school-hours and vacation care include childcare centres, local councils and not-for-profit organisations.

WWW.IBISWORLD.COM.AU Child Care Services in Australia April 2011 25
Capital Intensity The Child Care Services industry has very low capital intensity. Unlike a manufacturing industry, a service industry such as this one does not require machinery. The only depreciable assets include toys and equipment used by the children or staff such as kitchen equipment to prepare food. The level of capital intensity for the industry is unlikely to alter significantly over the next five years. Wages account for an average 63.5% of revenue, which represents a significantly larger proportion of revenue than depreciation, with a typical organisation in the industry using about 28.8 units of labour for each unit of capital. Accommodation represents the only capital requirement to facility-based child care services. However, managed funds are providing a vehicle to sell and lease back free-hold property. Beyond that, the vast bulk of property in the industry can be rented,
which limits capital spending and depreciation levels.
This is highly unlikely to impact on the industry’s labour intensity; although capital use is essentially negligible and for every dollar spent on capital IBISWorld estimates that about $28.86 is spent on
Operating ConditionsCapital Intensity | Technology & Systems | Industry Volatility
Regulation & Policy | Industry Assistance
Tools of the Trade: Growth Strategies for Success
SOURCE: WWW.IBISWORLD.COM.AU
La
bo
ur
Inte
nsi
veC
ap
ital In
ten
sive
Change in Share of the Economy
New Age Economy
Recreation, Personal Services,
Health and Education. Firms benefi t from personal wealth so stable macroeconomic conditions are imperative. Brand awareness and niche labour skills are key to product differentiation.
Traditional Service Economy
Wholesale and Retail. Reliant on labour rather than capital to sell goods. Functions cannot be outsourced therefore fi rms must use new technology or improve staff training to increase revenue growth.
Old Economy
Agriculture and Manufacturing.
Traded goods can be produced using cheap labour abroad. To expand fi rms must merge or acquire others to exploit economies of scale, or specialise in niche, high-value products.
Investment Economy
Information, Communications,
Mining, Finance and Real
Estate. To increase revenue fi rms need superior debt management, a stable macroeconomic environment and a sound investment plan.
Education Toy and Game Retailing
Preschool Education
yyyyyyyyyyyyyyyyyyyyyy gggyyyyyyyyy
Newspaper, Book and Stationery Retailing
Crisis and Care AccommodationSeSeSeervrvrvrviiiiciciciceeee EEEEcEcEcEcoooonomononnnoooeeerr
EEEduEChild Care Services
Level
The level of capital intensity required is Low

WWW.IBISWORLD.COM.AU Child Care Services in Australia April 2011 26
Operating Conditions
Revenue Volatility The population of young children is not volatile and government funding is high and increasing, which helps to reduce volatility. However, female labour participation has been historically more volatile than that of men; women are more inclined to exit the workforce when
becoming a parent than men. This creates a slightly more volatile factor that industry firms must face. Despite this, the rate at which young women are entering the workforce is more than counteracting such trends, which acts as a substantial stabilising factor for revenue.
Technology& Systems
There is relatively low use of technology in this industry. Some long day care centres are introducing computer-based education to children. Other large day care operators have instituted virtual private networks and company-wide management information systems including customer relationship management.
Capital Intensitycontinued
labour and associated costs. Substantial regulatory pressure (more or less in line with community concerns) is being applied to operators to maximise the staff-to-child ratio and ensure suitably qualified staff are hired, which will inevitably maintain high wage costs. Wage costs are likely to increase as a proportion of revenue, as the National Quality Framework for Early Childhood Education and Care is progressively implemented up until 2015-16. Child care staff employment
expenses are affected by staff-to-child ratios; the average age of children (with older children requiring less labour resources); the average length of stay of children (costs increase as the average length of stay declines); and the mix and flexibility of staff. Private centres may have more flexible staff arrangements that perform administrative and core activities. Staff members in private centres tend to work longer hours per week than staff in community centres.
Level
The level of Technology Change is Low
SOURCE: WWW.IBISWORLD.COM.AU
Volatility vs. growth
Re
ven
ue
vo
lati
lity
* (%
)
1000
100
10
1
0.1
Five year annualised revenue growth (%)
–30 –10 10 30 50 70
Hazardous
Stagnant
Rollercoaster
Blue chip
* Axis is in logarithmic scale
tili
Child Care Services
A higher level of revenue volatility implies greater industry risk. Volatility can negatively affect long-term strategic decisions, such as the time frame for capital investment.
When a fi rm makes poor investment decisions it may face underutilised capacity if demand suddenly falls, or capacity constraints if it rises quickly.
Level
The level of Volatility is Low

WWW.IBISWORLD.COM.AU Child Care Services in Australia April 2011 27
Operating Conditions
Industry Assistance Government funding for child care has become increasingly important to industry growth. As of 2005, the maximum assistance for a formal child care service was $144 per week, per child for 50 hours of care. During the 2004 election campaign, a 30% Child Care Tax Rebate (CCTR) was introduced for out-of-pocket child care costs up to a maximum of $4,000 per child. The Commonwealth Department of Family
and Community Services also provides financial support to child care operators through: access to set-up grants; training grants; establishment funding for new services in rural and remote areas; equipment grants; and fee assistance paid as a block grant. These fall under the auspices of the National Child Care Management System, which is intended to encourage new players to enter the market.
Regulation & Policy Federal and state government regulation tends to focus on administering an appropriate duty of care for children placed in childcare centres, which revolves primarily around providing qualified and properly trained staff; this applies more closely for community care centres that rely heavily on government funding. Private companies, often only partially assisted via tax concessions, have been more free to employ any staff they see fit. This lower level of regulation has led to lower wage costs for private operations, but will likely change under the Federal Government’s new Quality Framework. Local governments regulate the planning and development aspects of childcare centres. State and territory governments have enacted legislation to regulate childcare centres. The major areas of regulation relate to: the number of children that can be cared for by a centre at any one time; staff qualifications; the number of children that must be separately cared for by at least one qualified member of staff; indoor space per child; and staff-to-child ratios.
The National Quality Framework for Early Childhood Education and Care, which is being implemented
progressively from June 2010, will affect all industry operators. It aims to impose compulsory standards on industry operators in regards to staff-to-child ratios and staff qualification requirements; it also mandates a new national body to ensure the quality of child care services provided across the country. To be eligible for the Child Care Benefit Scheme, long day care centres must: operate for at least eight hours per working day for at least 48 hours per week; be licensed by the relevant state or territory licensing authority; register with the National Child Care Accreditation Council; and participate in the Quality Improvement and Accreditation System. The Child Care Fraud and Investigations Unit is able to enter child care premises unannounced, and examine centre documents such as parent sign-in books. Commonwealth and state government ministers have agreed on nationally consistent staffing standards for community-based long day care, family day care and out of school-hours care. Home-based carers, for whom the Child Care Benefit Scheme is claimed, must be registered with the Health Insurance Commission, must be aged 18 years and over, and have a tax file number.
Level & Trend
The level of Regulation is Heavy and the trend is Increasing
Level & Trend
The level of Industry Assistance is High and the trend is Steady

WWW.IBISWORLD.COM.AU Child Care Services in Australia April 2011 28
Key Statistics
Revenue ($m)
Industry Value Added
($m) Establishments Enterprises Employment Exports ImportsWages ($m)
Domestic Demand
2001-02 4,981.9 3,557.1 9,142 8,661 81,734 -- -- 3,337.9 N/A2002-03 5,372.9 3,836.3 10,368 9,848 86,837 -- -- 3,589.1 N/A2003-04 5,730.5 4,074.5 11,403 10,848 92,699 -- -- 3,805.1 N/A2004-05 6,148.0 4,402.1 12,651 12,055 97,844 -- -- 4,076.2 N/A2005-06 6,590.0 4,659.1 13,782 13,151 101,675 -- -- 4,369.2 N/A2006-07 6,990.3 4,900.2 14,922 14,253 107,556 -- -- 4,620.6 N/A2007-08 7,230.7 5,020.6 15,919 15,211 114,337 -- -- 4,762.0 N/A2008-09 7,225.3 4,801.8 15,735 15,070 115,412 -- -- 4,626.6 N/A2009-10 7,279.3 4,777.9 15,406 14,761 115,594 -- -- 4,576.4 N/A2010-11 7,326.2 4,763.5 16,068 15,265 120,565 -- -- 4,652.7 N/A
2011-12 7,802.4 5,005.7 16,902 15,212 131,919 -- -- 5,218.1 N/A2012-13 8,286.1 5,239.5 17,883 16,339 139,443 -- -- 5,631.6 N/A2013-14 8,783.3 5,487.8 18,670 16,959 147,644 -- -- 6,070.1 N/A2014-15 8,923.8 5,643.9 19,062 17,662 149,468 -- -- 6,175.8 N/A2015-16 9,227.2 5,888.9 19,331 18,312 153,131 -- -- 6,339.8 N/ASector Rank 6/19 5/19 3/19 2/19 4/19 N/A N/A 3/19 N/A
Economy Rank 133/506 69/506 44/506 36/505 33/506 N/A N/A 38/506 N/A
IVA/Revenue (%)
Imports/Demand (%)
Exports/Revenue (%)
Revenue per Employee
($’000)Wages/Revenue
(%)Employees
per Est.Average Wage
($)
Share of the Economy
(%)2001-02 71.40 N/A N/A 60.95 67.00 8.94 40,838.57 0.352002-03 71.40 N/A N/A 61.87 66.80 8.38 41,331.46 0.372003-04 71.10 N/A N/A 61.82 66.40 8.13 41,047.91 0.382004-05 71.60 N/A N/A 62.83 66.30 7.73 41,660.19 0.392005-06 70.70 N/A N/A 64.81 66.30 7.38 42,972.22 0.402006-07 70.10 N/A N/A 64.99 66.10 7.21 42,959.95 0.412007-08 69.43 N/A N/A 63.24 65.86 7.18 41,648.81 0.412008-09 66.46 N/A N/A 62.60 64.03 7.33 40,087.69 0.382009-10 65.64 N/A N/A 62.97 62.87 7.50 39,590.29 0.372010-11 65.02 N/A N/A 60.77 63.51 7.50 38,590.80 0.36
2011-12 64.16 N/A N/A 59.15 66.88 7.80 39,555.33 0.372012-13 63.23 N/A N/A 59.42 67.96 7.80 40,386.39 0.372013-14 62.48 N/A N/A 59.49 69.11 7.91 41,113.08 0.372014-15 63.25 N/A N/A 59.70 69.21 7.84 41,318.54 0.372015-16 63.82 N/A N/A 60.26 68.71 7.92 41,401.15 0.38Sector Rank 15/19 N/A N/A 18/19 5/19 11/19 14/19 5/19
Economy Rank 44/506 N/A N/A 494/506 8/506 276/506 361/506 69/506
Figures are inflation-adjusted 2011 dollars. Rank refers to 2011 data.
Revenue (%)
Industry Value Added
(%)Establishments
(%)Enterprises
(%)Employment
(%)Exports
(%)Imports
(%)Wages
(%)
Domestic Demand
(%)2002-03 7.8 7.8 13.4 13.7 6.2 N/A N/A 7.5 N/A2003-04 6.7 6.2 10.0 10.2 6.8 N/A N/A 6.0 N/A2004-05 7.3 8.0 10.9 11.1 5.6 N/A N/A 7.1 N/A2005-06 7.2 5.8 8.9 9.1 3.9 N/A N/A 7.2 N/A2006-07 6.1 5.2 8.3 8.4 5.8 N/A N/A 5.8 N/A2007-08 3.4 2.5 6.7 6.7 6.3 N/A N/A 3.1 N/A2008-09 -0.1 -4.4 -1.2 -0.9 0.9 N/A N/A -2.8 N/A2009-10 0.7 -0.5 -2.1 -2.1 0.2 N/A N/A -1.1 N/A2010-11 0.6 -0.3 4.3 3.4 4.3 N/A N/A 1.7 N/A
2011-12 6.5 5.1 5.2 -0.3 9.4 N/A N/A 12.2 N/A2012-13 6.2 4.7 5.8 7.4 5.7 N/A N/A 7.9 N/A2013-14 6.0 4.7 4.4 3.8 5.9 N/A N/A 7.8 N/A2014-15 1.6 2.8 2.1 4.1 1.2 N/A N/A 1.7 N/A2015-16 3.4 4.3 1.4 3.7 2.5 N/A N/A 2.7 N/ASector Rank 18/19 19/19 1/19 1/19 2/19 N/A N/A 18/19 N/A
Economy Rank 366/506 354/506 25/506 30/505 50/506 N/A N/A 206/506 N/A
Annual Change
Key Ratios
Industry Data
SOURCE: WWW.IBISWORLD.COM.AU

WWW.IBISWORLD.COM.AU Child Care Services in Australia April 2011 29
Jargon & Glossary
BARRIERS TO ENTRY Barriers to entry can be High, Medium or Low. High means new companies struggle to enter an industry, while Low means it is easy for a firm to enter an industry.
CAPITAL/LABOUR INTENSITY An indicator of how much capital is used in production as opposed to labour. Level is stated as High, Medium or Low. High is a ratio of less than $3 of wage costs for every $1 of depreciation; Medium is $3-$8 of wage costs to $1 of depreciation; Low is greater than $8 of wage costs for every $1 of depreciation.
DOMESTIC DEMAND The use of goods and services within Australia; the sum of imports and domestic production minus exports.
EARNINGS BEFORE INTEREST AND TAX (EBIT) IBISWorld uses EBIT as an indicator of a company’s profitability. It is calculated as revenue minus expenses, excluding tax and interest.
EMPLOYMENT The number of working proprietors, partners, permanent, part-time, temporary and casual employees, and managerial and executive employees.
ENTERPRISE A division that is separately managed and keeps management accounts. The most relevant measure of the number of firms in an industry.
ESTABLISHMENT The smallest type of accounting unit within an Enterprise; usually consists of one or more locations in a state or territory of the country in which it operates.
EXPORTS The total sales and transfers of goods produced by an industry that are exported.
IMPORTS The value of goods and services imported with the amount payable to non-residents.
INDUSTRY CONCENTRATION IBISWorld bases concentration on the top four firms. Concentration is identified as High, Medium or Low. High means the top four players account for over 70% of revenue; Medium is 40 –70% of revenue; Low is less than 40%.
INDUSTRY REVENUE The total sales revenue of the industry, including sales (exclusive of excise and sales tax) of goods and services; plus transfers to other firms of the same business; plus subsidies on production; plus all other operating income from outside the firm (such as commission income, repair and service income, and rent, leasing and hiring income); plus capital work done by rental or lease. Receipts from interest royalties, dividends and the sale of fixed tangible assets are excluded.
INDUSTRY VALUE ADDED The market value of goods and services produced by an industry minus the cost of goods and services used in the production process, which leaves the gross product of the industry (also called its Value Added).
INTERNATIONAL TRADE The level is determined by: Exports/Revenue: Low is 0-5%; Medium is 5-20%; High is over 20%. Imports/Domestic Demand: Low is 0-5%; Medium is 5-35%; and High is over 35%.
LIFE CYCLE All industries go through periods of Growth, Maturity and Decline. An average life cycle lasts 70 years. Maturity is the longest stage at 40 years with Growth and Decline at 15 years each.
NON-EMPLOYING ESTABLISHMENT Businesses with no paid employment and payroll are known as non-employing establishments. These are mostly set-up by self employed individuals.
VOLATILITY The level of volatility is determined by the percentage change in revenue over the past five years. Volatility levels: Very High is greater than ±20%; High Volatility is between ±10% and ±20%; Moderate Volatility is between ±3% and ±10%; and Low Volatility is less than ±3%.
WAGES The gross total wages and salaries of all employees of the establishment.
Industry Jargon
IBISWorld Glossary
BABY BONUS A payment from the Federal Government that is provided with the birth of a child.
CHILD CARE ASSISTANCE REBATE (CCAR) A tax rebate paid by the government to parents who place children in child care.
COMMUNITY-BASED CENTRE Non-profit childcare centre, funded by government, which is designed to meet demand in particular communities.
LONG DAY CARE CENTRE A childcare centre that specialises in providing care for children during work hours.
OCCUPANCY RATE The number of possible places in a given childcare centre that are filled by children requiring care.
OUTSIDE SCHOOL-HOURS CARE Care provided to children before and after school, but within business hours.

Disclaimer
This product has been supplied by IBISWorld Pty Ltd. (‘IBISWorld’) solely for use by its authorised licenses strictly in accordance with their license agreements with IBISWorld. IBISWorld makes no representation to any other person with regard to the completeness or accuracy of the data or information contained herein, and it accepts no responsibility and disclaims all liability (save for liability which cannot be lawfully disclaimed) for loss or damage whatsoever suffered or incurred by any other person resulting from
the use of, or reliance upon, the data or information contained herein. Copyright in this publication is owned by IBISWorld Pty Ltd. The publication is sold on the basis that the purchaser agrees not to copy the material contained within it for other than the purchasers own purposes. In the event that the purchaser uses or quotes from the material in this publication – in papers, reports, or opinions prepared for any other person – it is agreed that it will be sourced to: IBISWorld Pty Ltd
At IBISWorld we know that industry intelligence is more than assembling factsIt is combining data with analysis to answer the questions that successful businesses askIdentify high growth, emerging & shrinking markets
Arm yourself with the latest industry intelligence
Assess competitive threats from existing & new entrants
Benchmark your performance against the competition
Make speedy market-ready, profit-maximising decisions
Who is IBISWorld?
We are strategists, analysts, researchers, and marketers. We provide answers to information-hungry, time-poor businesses. Our goal is to provide real world answers that matter to your business in our 500 Australian industry reports. When tough strategic, budget, sales and marketing decisions need to be made, our suite of Industry and Risk intelligence products give you deeply-researched answers quickly.
IBISWorld Membership
IBISWorld offers tailored membership packages to meet your needs.
Copyright 2011 IBISWorld Pty Ltd
www.ibisworld.com.au | (03) 9655 3881 | [email protected]