ibisworld industry report 62411 adoption & child … adoption & child welfare services in...
TRANSCRIPT

WWW.IBISWORLD.COM Adoption & Child Welfare Services in the US February 2015 1
IBISWorld Industry Report 62411Adoption & Child Welfare Services in the USFebruary 2015 Dmitry Diment
In good hands: Government funding will remain lax as corporate and private donations increase
2 About this Industry2 Industry Definition
2 Main Activities
2 Similar Industries
3 Additional Resources
4 Industry at a Glance
5 Industry Performance5 Executive Summary
5 Key External Drivers
7 Current Performance
9 Industry Outlook
11 Industry Life Cycle
13 Products & Markets13 Supply Chain
13 Products & Services
15 Demand Determinants
16 Major Markets
17 International Trade
18 Business Locations
21 Competitive Landscape21 Market Share Concentration
21 Key Success Factors
21 Cost Structure Benchmarks
24 Basis of Competition
25 Barriers to Entry
25 Industry Globalization
27 Major Companies
29 Operating Conditions29 Capital Intensity
30 Technology & Systems
30 Revenue Volatility
31 Regulation & Policy
32 Industry Assistance
33 Key Statistics33 Industry Data
33 Annual Change
33 Key Ratios
34 Jargon & Glossary
www.ibisworld.com | 1-800-330-3772 | [email protected]
WWW.IBISWORLD.COM Adoption & Child Welfare Services in the US February 2015 2
This industry includes nonresidential social assistance services for children and young adults. Private sector and nonprofit establishments in this industry offer services in the areas of adoption, foster care placement, drug prevention,
guidance and self-help, life skills training and positive social development. This industry excludes orphanages and group homes, day care services, youth recreational sports centers, sports teams and leagues and scouting organizations.
The primary activities of this industry are
Adoption placement services
Abandoned infant assistance
Foster care placement services
Child guidance services
Child abuse prevention services
Youth community center services
Self-help programs for teens
Teen outreach services
Youth guidance services
61171 Testing & Educational Support in the USEducation services are an important adjunct to child welfare services.
62399 Orphanages & Group Homes in the USOrganizations that provide foster care to children are related to the adoption industry.
62412 Elderly & Disabled Services in the USElderly and disabled services providers offer care for the elderly and disabled.
62441 Day Care in the USThis industry provides day care of infants or children.
Industry Definition
Main Activities
Similar Industries
About this Industry
The major products and services in this industry are
Adoption services
Foster & guardianship services
Shelter services
Youth counseling & developmental services
Youth service programs
Other social assistance services

WWW.IBISWORLD.COM Adoption & Child Welfare Services in the US February 2015 3
About this Industry
For additional information on this industry
www.adoption.com Adoption Information
www.childwelfare.gov Child Welfare Information Gateway
www.hhs.gov US Department of Health and Human Services
Additional Resources
IBISWorld writes over 700 US industry reports, which are updated up to four times a year. To see all reports, go to www.ibisworld.com

WWW.IBISWORLD.COM Adoption & Child Welfare Services in the US February 2015 4
% c
hang
e
16
−8
−4
0
4
8
12
2008 10 12 14 16 18Year
Federal funding for social services
SOURCE: WWW.IBISWORLD.COM
% c
hang
e
6
−6
−4
−2
0
2
4
2107 09 11 13 15 17 19Year
Revenue Employment
Revenue vs. employment growth
Products and services segmentation (2015)
26.8%Youth service programs
5.3%Shelter services
25.4%Foster & guardianship services
24.3%Other social assistance services
10.0%Youth counseling &
developmental services
8.2%Adoption services
SOURCE: WWW.IBISWORLD.COM
Key Statistics Snapshot
Industry at a GlanceAdoption & Child Welfare Services in 2015
Industry Structure Life Cycle Stage Mature
Revenue Volatility Low
Capital Intensity Low
Industry Assistance High
Concentration Level Low
Regulation Level Heavy
Technology Change Low
Barriers to Entry Medium
Industry Globalization Low
Competition Level Medium
Revenue
$14.1bnProfit
$380.9mWages
$6.7bnBusinesses
35,895
Annual Growth 15-20
2.2%Annual Growth 10-15
0.9%
Key External DriversFederal funding for social servicesDemand from donations, grants and endowmentPer capita disposable incomePoverty rateCorporate profit
Market ShareThere are no Major Players in this industry
p. 27
p. 5
FOR ADDITIONAL STATISTICS AND TIME SERIES SEE THE APPENDIX ON PAGE 33
SOURCE: WWW.IBISWORLD.COM

WWW.IBISWORLD.COM Adoption & Child Welfare Services in the US February 2015 5
Key External Drivers Federal funding for social servicesFederal funding for social services provide support for foster care and adoption services, youth counseling programs, child welfare centers, job training programs and other services. This industry receives support from federal social services funding, which benefits revenue growth. Federal funding for social services is anticipated to
increase in 2015, representing an opportunity for the industry.
Demand from donations, grants and endowmentThe Donations, Grants and Endowment industry is composed of grantmaking foundations, also known as charitable trusts, which provide grants and private contributions to social services
Executive Summary
The Adoption and Child Welfare Services industry contracted slightly in the years following the recession as a result of declining government funding for social services and slow disposable income growth. However, while funding for the industry suffered, demand for its services surged as the share of children living below the poverty line hovered near 22.0% through 2012. However, at the same time the industry’s client base struggled, so did its funding sources. Each of the budgets of the Administration for Children and Families, the Foster Care and Adoption Assistance and the
Temporary Assistance for Needy Families programs declined early in the period as funding levels fell. Consequently, industry revenue and profit plummeted as operators drew on endowments to keep up with the growing need for child welfare services. However, since then, funding for industry operators has picked up as economic growth accelerated. Disposable income surpassed prerecession levels in 2013, stimulating donations for industry operators, while government funding has returned to growth. As a result, IBISWorld expects
revenue to grow at an average annual rate of 0.9% to $14.1 billion in the five years to 2015.
The industry benefited from diverse revenue streams in recent years. After several years of declining tax receipts, federal funding bowed under the pressure of falling tax revenue, declining in 2011 and 2012. On the other hand, corporate profit levels and per capita disposable income recovered, making up for a portion of the shortfall in public spending. Industry revenue is expected to grow 2.7% in 2015 due to steady growth in public and private sector funding for industry services.
In the five years to 2020, this industry is anticipated to return to stable growth as downstream revenue sources recover. Over the next five years, corporate profit is expected to grow healthily, as is disposable income, fueling private sector donations in turn. During this period, donations, grants and endowment funding is projected to expand at an annualized rate of 3.6%. Government budgetary growth is also anticipated to slowly increase at an annualized rate of 1.9%. As recovery in government spending coincides with growth in private sector giving, the industry is expected to experience consistent revenue growth. The Adoption and Child Welfare Services industry is projected to grow at an annualized rate of 2.2% to $15.7 billion in the five years to 2020.
Industry PerformanceExecutive Summary | Key External Drivers | Current Performance Industry Outlook | Life Cycle Stage
The industry is expected to return to stable growth as downstream revenue sources recover

WWW.IBISWORLD.COM Adoption & Child Welfare Services in the US February 2015 6
Industry Performance
Key External Driverscontinued
organizations in this industry. This industry’s performance is measured by the total level of charitable contributions, grants and investment income. An expanding Donations, Grants and Endowment industry indicates heightened levels of charitable donations and grant funding, which benefits child welfare service providers. In 2015, the Donations, Grants and Endowment industry is expected to grow.
Per capita disposable incomeThis industry is dependent on charitable contributions and membership fees for funding. When disposable income increases, individuals are more willing to contribute to social services organizations in this industry. Additionally, demand for adoption services increases when per capita disposable income rises, as adoption can be costly. Per capita disposable income is anticipated to increase in 2015.
Poverty rateThe poverty rate measures the percentage of the population that is below the federal poverty line. When the poverty rate increases, families have greater difficulty providing for children. Social research has also indicated that poverty is positively correlated with incidences of child abuse. Both of these factors bolster demand for child welfare and adoption services provided by industry operators. In 2015, the poverty rate is expected to fall, representing a potential threat to the industry.
Corporate profitCorporations are a major source of charitable donations for this industry. When profit is high, corporations are more likely to contribute to social services programs provided by this industry. As a result, increasing corporate profit fuels revenue growth. Corporate profit is anticipated to increase in 2015.
% c
hang
e
24
−24
−12
0
12
2008 10 12 14 16 18Year
Demand from donations, grants and endowment
SOURCE: WWW.IBISWORLD.COM
% c
hang
e
16
−8
−4
0
4
8
12
2008 10 12 14 16 18Year
Federal funding for social services

WWW.IBISWORLD.COM Adoption & Child Welfare Services in the US February 2015 7
Industry Performance
Revenue streams The industry benefits from diverse revenue streams, which minimizes revenue volatility from year to year. However, from 2010 to 2011, each of the budgets of the Administration for Children and Families, the Foster Care and Adoption Assistance and the Temporary Assistance for Needy Families programs declined. In 2011, federal government social services funding contracted 1.6% over the year. While government funding for social services at the federal level declined more slowly due to an injection of funding from stimulus, local and state government investment fell at an even faster rate as municipal governments were strained by falling tax revenue and the need to balance budgets. Consequently, industry revenue contracted in 2011 under the strain of
declining government funding, despite an increase in private donations.
While government funding is typically steady, the Budget Control Act of 2011 introduced some funding uncertainty for the industry, as discretionary spending may be cut as much as $1.5 trillion from 2013 to 2022. In 2012, federal funding for social services was cut an estimated 5.3%, causing revenue to contract an additional 1.7% over the year. Since then, funding for industry programs has begun to recover. Private donations are expected to increase for a sixth consecutive year as the economy grows, while government social services funding is expected to grow for a third consecutive year, providing additional grants and resources for industry operators.
Current Performance
The Adoption and Child Welfare Services industry includes a diverse array of nonprofit and for-profit adoption, foster care placement and other youth services. The majority of industry operators receive some portion of their funding through public and private institutional donations, with the remainder collected through service and membership fees. As government spending at the local and state levels stagnated and disposable income inched upward as a result of the recession, industry revenue suffered into the beginning of the current-five year period.
On the other hand, according to US Census data, the percentage of under-18 children living below the poverty line rose during the past five years as a result of difficult economic conditions. This has fueled demand growth for the industry’s child welfare and youth services. Rising demand
coincided with the economic recovery, which bolstered federal funding for social services and private donations for the industry. As a result, industry revenue is expected to grow at an average annual rate of 0.9% to $14.1 billion in the five years to 2015.
% c
hang
e
6
−6
−4
−2
0
2
4
2107 09 11 13 15 17 19Year
Industry revenue
SOURCE: WWW.IBISWORLD.COM
WWW.IBISWORLD.COM Adoption & Child Welfare Services in the US February 2015 8
Industry Performance
Shifts within the industry
Regulatory changes at the federal level in recent years have initiated a dramatic shift in the industry. Legislative initiatives enacted since 2008 have decreased the foster care population, therefore decreasing the need for this industry’s foster care placement services while increasing the volume of US adoptions and the need for the industry’s adoption services. The Fostering Connections to Success and Increasing Adoptions Act focused on placing children with relatives instead of in foster care. The legislation also supported counseling services for families to reduce the need for foster care. Consequently, the number of children in foster care declined during the current past five years. According to the latest available data from the Administration for Children and Families (ACF) “Child Welfare Outcomes 2009-2012” report to Congress, there were an estimated 397,000 children in foster care at the
conclusion of 2012. This downward trend is expected to continue through 2015, benefiting this industry’s counseling service providers, but hurting foster care placement agencies.
Additionally, the federal government implemented financial incentives to states for increasing adoption; as a result, adoptions increased in 2009. However, the program has since expired, causing adoptions to quickly decline. Furthermore, international adoptions, which typically have higher placement fees, rapidly fell over the past five years. As a result, demand for adoption services has declined, hampering industry revenue growth.
Profit recovers While the bulk of this industry is composed of nonprofit operators, some adoption agencies operate as for-profit placement services for families. Immediately following the recession, profit declined for adoption and child welfare service providers due to stagnant growth in federal government funding and state government budget constraints. In general, children and youths receiving industry services are unable to significantly contribute to fees, making industry operators dependent on government funding. Additionally, slow disposable income growth made it difficult for many families to afford expensive adoption services, which is estimated to range from $5,000 to $40,000 by the Administration for Children and Families (ACF).
As a result, losses reached 0.6% of revenue in 2010. Since then, profit margins have recovered as economic growth picked up and disposable income grew. However, the growth experienced over the past five years is largely due to the recovery of government funding from the recession. In 2015, profit is anticipated to total 2.7% of revenue, which remains below prerecession levels. As a result of falling revenue during the early part of the current five-year period, wages’ have grown to account for 47.5% of industry revenue in 2015. In the five years to 2015, wages are expected to increase at an average annual rate of 1.8% to $6.7 billion. The number of industry participants, meanwhile, has also grown. Over the five years to 2015, the number of operators is anticipated to increase at an average annual rate of 2.5% to 35,895.
Demand for adoption services has declined, hampering industry revenue growth

WWW.IBISWORLD.COM Adoption & Child Welfare Services in the US February 2015 9
Industry Performance
Private and public funding growth
In the five years to 2020, government funding for children and youth services is anticipated to grow, although a number of factors may limit growth. At the federal level, the Budget Control Act of 2011 and other budget and deficit reforms have the potential to reduce discretionary spending, responsible for funding many industry programs, by $1.5 trillion over the next decade. Nonetheless, federal funding for social services is projected to increase at an annualized rate of 1.6% per year over the five-year period, positively impacting the industry’s revenue streams.
Similarly, lingering recessionary effects are anticipated to constrain state-level budgets. While local and state government investment is projected to increase at an average annual rate of 1.6% during the next five years, investment is not anticipated to eclipse prerecession levels over the period. IBISWorld estimates that state funds for foster care placement and other child welfare services will be among the many programs affected by the cuts
necessitated to reduce budgetary gaps in the coming five years.
From 2015 to 2020, privately funded donations, grants and endowments are projected to increase at an average annual rate of 3.6%, driven by the growth of per capita disposable income and a robust increase in corporate profit levels. Since growth in public sector funding is forecast to be weak in the coming five years, private sector support will increase in significance, contributing a greater share to industry revenue going forward. On average, steadily growing private charitable donations and slowly increasing government funding is projected to fuel stable growth for this industry. In 2016, private sector donations, grants and endowment are anticipated to increase 4.8%, resulting in revenue growth of 2.0% over the year.
A shift toward adoption services
The number of children in foster care has declined over the past five years and is expected to continue to decline in the five years to 2020, thanks to government incentives to promote the adoption of foster children. At the same time, projected increases in average
disposable income in the United States will heighten demand for adoption placement services. From 2015 to 2020, IBISWorld anticipates consumer disposable income will increase at an average annual rate of 2.5%. This will permit a greater number of potential
Industry Outlook
Over the next five years, industry revenue growth is expected to steadily increase due to stable federal government social services funding. Government funding for social services is expected to grow during the next five years, although a slight drop is projected in 2016. Simultaneously, other key funding
drivers for the industry, including corporate profit and private donations, are projected to increase over the next five years. As a result, in the five years to 2020, revenue for the Adoption and Child Welfare Services industry is projected to increase at an average annual rate of 2.2% to $15.7 billion.
Federal funding for social services will increase, positively impacting revenue streams

WWW.IBISWORLD.COM Adoption & Child Welfare Services in the US February 2015 10
Industry Performance
A shift toward adoption servicescontinued
adopters to meet federally mandated caretaker criteria. More generally, growth in disposable income will make
adoption more financially feasible for parents, increasing adoption services’ share of industry revenue.
Profitability improves Profit is anticipated to improve for for-profit operators in this industry. Over the next five years, industry profit is forecast to increase to 4.6% of revenue, allowing industry organizations to fund growth. Improving profit margins combined with low barriers to entry will provide an incentive for operators to enter this industry. IBISWorld projects the number of operators to grow at an average annual rate of 2.4% to 40,474 over the five years to 2020. However, employment will grow more slowly, as many organizations will rely on volunteer
labor to manage wage costs. In the five years to 2020, employment is forecast to increase at an annualized rate of 2.1% to 230,575 workers. Although the youth poverty rate is expected to decline slightly over the period, there will always be demand for the crucial child welfare services that this industry provides.
Many organizations will rely on volunteer labor to manage wage costs

WWW.IBISWORLD.COM Adoption & Child Welfare Services in the US February 2015 11
Industry PerformanceIndustry value added is growing at a slightly faster pace than GDPThe number of companies in the industry is stable and steadily increasingThere is widespread acceptance of the services offered, limiting the potential for dramatic growth or decline
Life Cycle Stage
SOURCE: WWW.IBISWORLD.COM
20
15
10
5
0
-5
-10
% G
row
th in
sha
re o
f eco
nom
y
% Growth in number of establishments
-10 -5 0 5 10 15 20
DeclineShrinking economicimportance
Quality GrowthHigh growth in economic importance; weaker companies close down; developed technology and markets
MaturityCompany consolidation;level of economic importance stable
Quantity GrowthMany new companies; minor growth in economic importance; substantial technology change
Key Features of a Mature Industry
Revenue grows at same pace as economyCompany numbers stabilize; M&A stageEstablished technology & processesTotal market acceptance of product & brandRationalization of low margin products & brands
Testing & Educational Support
Donations, Grants & Endowment
Brand Name Pharmaceutical Manufacturing
Orphanages & Group Homes
Generic Pharmaceutical Manufacturing
Adoption & Child Welfare Services

WWW.IBISWORLD.COM Adoption & Child Welfare Services in the US February 2015 12
Industry Performance
Industry Life Cycle The Adoption and Child Welfare Services industry is in the mature stage of its industry life cycle. In the 10 years to 2020, industry value added, which measures this industry’s contribution to the economy, is projected to increase at an average annual rate of 3.1%. Over the same period, gross domestic product (GDP) forecast to increase at an annualized rate of 2.5%. Consistent demand for this industry’s services is indicative of its maturity.
Over the past five years, low barriers to entry have presented ample opportunities for firms to enter this industry. In the 10 years to 2020, the number of enterprises is anticipated to increase on average 2.4% per year. Industry services are highly community focused, and most operators provide personalized services. As a result, unlike other mature industries, adoption and child welfare service providers are
not anticipated to undergo significant consolidation. Additionally, there will always be new needs in the field of youth services and child care, and new firms will emerge to meet the demand.
Most importantly, the stability of this industry results from the very well established role it plays in US society. Industry organizations serve an important humanitarian purpose, advocating for and providing direct service in the area of child welfare. At the same time, this industry improves the long-term stability of the US economy and society: children assisted by industry operators are more likely to contribute productively to the labor market, and are less likely to engage in criminal activity. In this way, adoption and child welfare services are not simply a luxury afforded to developed societies, but a pre-requisite of them.
This industry is Mature

WWW.IBISWORLD.COM Adoption & Child Welfare Services in the US February 2015 13
Products & Services Products and ServicesWhile many industries receive some funding in the form of government subsidies, this industry is unique in that it is dominated by nonprofit firms that rely heavily government grants and subsidies. As a result, the industry’s services can be provided to those clients most in need at a greatly reduced price or for free. In addition to direct government, most industry services receive funding from private charitable donations.
Youth service programsYouth service programs are expected to account for 26.8% of industry services by revenue in 2015. These programs include a variety of nonmedical, social-assistance services to improve the quality of life for children and youth. The industry’s largest operators, most notably the Boys & Girls Clubs of America (BGCA) and Big
Brothers Big Sisters of America, participate in this category through a variety of after-school programs. Programs may operate in a group setting, or in a one-on-one mentoring scenario. Youth service programs can be broken down further into strategic areas depending on their intended outcome, with education, career, leadership and life skills being the most common focus areas. Youth service programs have grown over the past five years due to government initiatives that focused on improving children’s home life.
Foster and guardianship servicesThis industry’s second largest service category, foster and guardianship services are expected to account for 25.4% of revenue in 2015. Industry foster care agencies recruit and train caregivers and place foster children in appropriate
Products & MarketsSupply Chain | Products & Services | Demand Determinants Major Markets | International Trade | Business Locations
KEY BUYING INDUSTRIES
62399 Orphanages & Group Homes in the US Children who are in trouble with the law and who are parentless may be put up for adoption.
81321 Donations, Grants & Endowment in the US Charity and grant management trusts provide funding for child welfare service providers.
92 Public Administration in the US Government organizations fund industry services.
99 Consumers in the US Families who want to adopt children my turn to industry operators.
KEY SELLING INDUSTRIES
32541a Brand Name Pharmaceutical Manufacturing in the US Child welfare service providers purchase brand medication for children.
32541b Generic Pharmaceutical Manufacturing in the US Generic medication may be used in child welfare facilities.
32541d Vitamin & Supplement Manufacturing in the US Supplements and vitamins are provided for children under the care of industry operators.
62111a Primary Care Doctors in the US General doctors will be called upon to examine the state of the child upon adoption.
62111b Specialist Doctors in the US Specialist doctors will be called upon to examine the state of the child upon adoption.
62133 Psychologists, Social Workers & Marriage Counselors in the US Psychologists will be needed to determine the emotional state of a child upon adoption.
Supply Chain

WWW.IBISWORLD.COM Adoption & Child Welfare Services in the US February 2015 14
Products & Markets
Products & Servicescontinued
homes. Foster care agencies may be public or private, for-profit or nonprofit. Over the past five years, this product segment has declined due to government initiatives promoting adoption and familial care. The Fostering Connections to Success and Increasing Adoptions Act of 2008 placed children with relatives rather than non-relative foster families. As a result, the number of children in foster care has declined over the past five years. According to the latest available data from the Administration for Children and Families (ACF) “Child Welfare Outcomes 2009-2012” report to congress, there were an estimated 397,000 children in foster care at the conclusion of 2012. Consequently, foster and guardianship services’ share of industry revenue declined.
Youth counseling and developmental servicesThis product segment includes private and public organizations that provide youth and familial counseling services. Industry organization provide counseling, emergency food and shelter and other resources for youths and families. Organizations also provide general skills training and career training for youths through workshops and other
programs. Over the past five years, revenue from youth counseling and development services increased. This is because government funding and initiatives increasingly focused improving youths’ quality of life, to reduce the need for foster care and adoption. This product segment is estimated to account for 10.0% of revenue in 2015.
Adoption servicesAdoption services are expected to account for 8.2% of industry services by revenue in 2015. This category includes both licensed agencies and unlicensed facilitators that arrange legal placement of a child with non-birth parents. Adoption agencies must be licensed by the US Office of Children of Youth. In general, agencies can be faith-based or non-faith-based and may match children and parents based on religious backgrounds, race or special needs. Adoption facilitators are unlicensed entities, primarily serving adopting families rather than birth mothers. Private adoption facilitators charge a fee to connect families looking to adopt with pregnant mothers and families no longer able to care for their children. Adoption facilitators are not legal in all states because many states do not allow the
Products and services segmentation (2015)
Total $14.1bn
26.8%Youth service programs
5.3%Shelter services
25.4%Foster & guardianship services
24.3%Other social assistance services
10.0%Youth counseling &
developmental services
8.2%Adoption services
SOURCE: WWW.IBISWORLD.COM

WWW.IBISWORLD.COM Adoption & Child Welfare Services in the US February 2015 15
Products & Markets
DemandDeterminants
The Adoption and Child Welfare Services industry, as any other industry, is subject to variable demand for its services. The ways in which industry operators respond to an increase in demand, however, are unique. Typically, families most in need of services for their children are unable to bid for these services due to their low income and higher probability of being unemployed. Indeed, because the clients of this industry are defined by their poverty, and thus their lack of effective demand, this industry functions primarily as a result of charitable donations from the public and private sectors.
Demand for this industry’s two largest service segments, foster care and youth welfare programs, depends primarily on changes in the population served. This target population can be broken up into two general categories: children whose parents are unable to care for them emotionally or economically and children who require additional support to succeed socially or educationally. While it is impossible to discuss all societal and
economic factors influencing child development, the most relevant factors at play over the past five years can be summarized by trends in child poverty rates, foreclosures, and child abuse.
According to the most recently released information from the US Census Bureau, the percentage of under-18 children and youths living below the poverty line is expected to reach 19.9% in 2013. This trend echoes a similar increase in the share of US adults living below the poverty line, driven by slow disposable income growth. From 2010 to 2015, per capita disposable income is expected to grow on average 1.0% per year. For families near the poverty line, even small income shocks can significantly increase hunger and homelessness, causing demand for social services to rise.
Additionally, disposable income drives demand for adoption services. According to the Administration for Children and Families, adoptions can cost anywhere from $2,500 to $40,000. As disposable income grew very slowly or fell in each of the past
Products & Servicescontinued
exchange of money for adoptions (excluding legal fees).
Additionally, US Department of Health and Human Services reinstated a successful policy from 2000 in an attempt to increase adoptions. The department awarded 38 states with incentive awards for increasing the number of adoptions from foster care in fiscal year 2009 relative to 2007. According to the ACF, the number of adoptions increased from 55,000 in 2008 to 57,000 in 2009. However, the program has since expired, causing the number of adoptions to quickly decline to 51,000 in 2011. Adoption rates slightly rebounded in 2012 and are expected to remain stable in 2015. As a result, this product segment’s share
of revenue is expected to slightly decline during the current five year period.
Other child welfare servicesShelter services are expected to account for 5.3% of industry services by revenue in 2015. While residential support is excluded from this industry, a small portion of industry activity is concentrated in non-housing social assistance provided to children in shelters. Other social assistance services account for the remaining 24.3% of industry revenue. The largest contributors in this very diverse catchall category are social assistance services for disabled children and self-help group services.

WWW.IBISWORLD.COM Adoption & Child Welfare Services in the US February 2015 16
Products & Markets
Major Markets
This industry generates the bulk of its revenue from charitable donations, government grants, and indirect funding from government social welfare programs. However, industry organizations only receive funding for providing services to children and youths. As a result, major markets are segmented by age of children receiving services.
Children aged 7 years and youngerChildren in this age group dominate the adoption services segment, as families typically prefer adopting younger children. According to the Administration for Children and Families, children adopted in 2012 (latest available data) had a median age of 5.1 years. As a result
of this preference, there is a relatively greater presence of for-profit operators in this market segment. Some private adoption agencies, which collect fees, exclusively focus on placing very young children with prospective families. However, over the past five years, stagnant disposable income made it more difficult for families to afford adoption fees. International adoption has also declined. Consequently, this market segment’s share of revenue is expected to fall to 47.9% in the five years to 2015.
Children aged 8 to 11 years oldThis age group primarily receives foster care services, youth counseling and development services and other child
DemandDeterminantscontinued
five years, fewer people were able to afford the costs of adoption, reducing demand for this service segment.
Indirect effects of poverty, including increased child abuse and crime rates, have also fueled demand for industry services since the recession. According to research from the American Academy of Pediatrics, child abuse has increased over the past five years due to household poverty. The 2010 study found that for
every 1.0% increase in unemployment, child abuse reports increase by more than 0.5 per 1,000 the following year. Unemployment soared from 5.8% in 2008 to 9.6% in 2010, suggesting an additional 1.9 instances of child abuse for every 1,000 children in 2010. Abused children are vulnerable to long-lasting physical and mental health consequences, requiring services provided by this industry.
Major market segmentation (2015)
Total $14.1bn
47.9%Under 7 year old
21.7%Youths aged 12 to 16 years
18.3%Children aged 8 to 11 years
12.1%Youths older than 16
SOURCE: WWW.IBISWORLD.COM

WWW.IBISWORLD.COM Adoption & Child Welfare Services in the US February 2015 17
Products & Markets
International Trade Although children adopted through this industry may be brought into the country from abroad, the fees collected by industry operators reflect reimbursement for legal expenses and the placement service itself. Thus, firms generate revenue by coordinating and providing a service; industry operators do not buy or sell children. Due to the service-based nature of this industry’s activities, there is no import or export of goods, and consequently, no international trade. Nonetheless, over the past five years, international adoptions have declined. According to
the US Department of State’s Office of Children’s Issues, the number of international adoptions declined from 11,058 in 2010 to 7,092 in 2013, the latest year for which there is available data. IBISWorld estimates that this downward trend will continue through 2015. This trend was exacerbated in 2013 by the Dima Yakovlev Law, which banned Americans from adopting Russian children. According to data sourced from the Office of Children’s Issues, the number of Russian children adopted by Americans fell from 749 in 2012 to just 250 in 2013.
Major Marketscontinued
welfare programs. Children aged 8 to 11 years old are the primary market for foster care services. According to the ACF, children in foster care in 2012 had a median age of 8.5 years. Over the past five years, the number of children in foster care declined due to government programs promoting familial care and preventive services. Consequently, this market segment’s share of revenue declined. In 2015, children aged 8 to 11 years old are estimated to account for 18.3% of industry revenue.
Youths aged 12 to 16 years and olderThis age group receives services from afterschool programs, mentoring
programs and other developmental services. Organizations that coordinate community outreach and other child welfare programs especially target this age group, as teens are considered an “at risk” demographic for drug use and criminal activity. Over the past five years, this market segment grew due to government initiatives for youth development programs. For instance, the Fostering Connections to Success and Increasing Adoptions Act increased government support for older youths transitioning to adulthood. As a result, this market segment is expected to increase to 33.8% of revenue in the five years to 2015.

WWW.IBISWORLD.COM Adoption & Child Welfare Services in the US February 2015 18
Products & Markets
Business Locations 2015
MO1.6
West
West
West
Rocky Mountains Plains
Southwest
Southeast
New England
VT0.4
MA2.8
RI0.4
NJ2.0
DE0.8
NH0.6
CT1.3
MD1.5
DC0.9
1
5
3
7
2
6
4
8 9
Additional States (as marked on map)
AZ1.5
CA11.9
NV0.6
OR1.7
WA2.5
MT0.6
NE0.8
MN2.1
IA0.8
OH3.4 VA
3.0
FL4.7
KS1.9
CO2.1
UT0.7
ID0.4
TX5.4
OK1.1
NC3.4
AK0.2
WY0.3
TN1.5
KY1.3
GA2.8
IL4.2
ME0.8
ND0.3
WI2.7 MI
2.7 PA5.1
WV0.9
SD0.3
NM1.1
AR1.0
MS0.6
AL1.2
SC1.0
LA1.3
HI0.6
IN2.0
NY6.9 5
67
8
321
4
9
SOURCE: WWW.IBISWORLD.COM
Mid- Atlantic
Establishments (%)
Less than 3% 3% to less than 10% 10% to less than 20% 20% or more
Great Lakes

WWW.IBISWORLD.COM Adoption & Child Welfare Services in the US February 2015 19
Products & Markets
Business Locations The distribution of adoption and child welfare service providers reflects the general distribution of the US population, as this industry provides to all children and families. The Mid-Atlantic region is slightly over-represented relative to its population, while the Southeast and Southwest are under-represented. Among the states, California is home to the greatest number of industry establishments, followed by New York.
Low population density in the Southeastern and Southwestern regions reduces the efficiency of service delivery, and thus inhibits industry growth. Compounding this difficulty, establishments in these regions suffer from a lack of funding from private individuals and corporate donors, as a result of lower regional economic growth and employment levels. The Southeast accounts for 25.4% of the US population, but only 22.8% of industry establishments and a mere 15.3% of industry revenue. Similarly, the Southwest accounts for 12.2% of the US population, but only 9.2% of industry establishments and 8.8% of revenue. Poor revenue performance and fund-efficiency in the region has led many industry operators to relocate establishments to regions where limited funds can be more effectively deployed.
Industry presence outweighs population most significantly in the Mid-Atlantic region. The Mid-Atlantic is home to only 15.5% of the population, but 17.1% of industry establishments and 22.2% of industry revenue. Because of the greater population density in this region, and large number of cities within it, the Mid-Atlantic has a greater demand for child welfare services, and a greater potential efficiency of service delivery. Within the region, New York, home to the
Population, industry establishments and revenue by region
RegionPopulation
(%)Establishment
(%)Industry Revenue
(%)
New England 4.7 6.3 6.9Mid-Atlantic 15.5 17.1 22.2Great Lakes 14.9 15.1 15.6Plains 6.6 7.8 6.9Southeast 25.4 22.8 15.3Southwest 12.2 9.2 8.8Rocky Mountains 3.6 4.3 2.5West 17.1 17.5 21.9
SOURCE: US CENSUS BUREAU COUNTY BUSINESS PATTERNS
%
30
0
10
20
Sout
hwes
t
Wes
t
Gre
at L
akes
Mid
-Atla
ntic
New
Eng
land
Plai
ns
Rock
y M
ount
ains
Sout
heas
t
EstablishmentsPopulation
Distribution of establishments vs. population
SOURCE: WWW.IBISWORLD.COM

WWW.IBISWORLD.COM Adoption & Child Welfare Services in the US February 2015 20
Products & Markets
Business Locationscontinued
largest city in the US, accounts for the country’s second greatest share of industry establishments (6.9%), behind
California (11.9%), which is home to the country’s second, tenth, and thirteenth largest cities.

WWW.IBISWORLD.COM Adoption & Child Welfare Services in the US February 2015 21
Cost Structure Benchmarks
Wages make up a large portion of operating costs because this is a service-oriented industry. However, costs can vary depending on the size of the
organization. Typically, large organizations can achieve some economies of scale efficiencies in administrative costs.
Key Success Factors Access to secure revenueLong-term planning for adoption and child welfare services requires access to outside funding.
Must comply with government regulationsOperators must meet all regulations by federal, state and regulatory bodies, especially in regard to the management and reporting of cash flows.
Access to highly skilled workforceWorkers in the child and youth services industry need to be highly skilled to deal with a broad range of problems and challenges and implement best practices in dispute resolution. Skilled workers can be difficult to find due to low pay scale.
Having a good reputationFamilies will want to use adoption agencies with a good reputation.
Market Share Concentration
The Adoption and Child Welfare Services industry is highly fragmented. In 2015, IBISWorld estimates that the four largest firms in the industry account for less than 5.0% of total revenue, which indicates a low level of market share concentration.
Although large organizations have some advantages in areas like fundraising, this industry’s services are generally community-focused and specific to the local needs of the youth populations. For this reason, small, locally focused organizations are most effective. Often, however, such small firms will unite under a national organization charged with conducting research, fundraising, and consulting for the local branches. For instance, the Boys & Girls Clubs of America and the Child Welfare League exist to assist the independently run, dues-paying organizations that constitute its membership.
Employment in the industry is skewed strongly towards small establishments. According to US Census data, 46.9% of employing firms have four or fewer
employees and 75.2% of all enterprises have less than 20 employees. Additionally, this industry is mostly composed of nonemploying operators. Small employing firms are participants in each of the industry’s service segments, most notably adoption facilitators, counselors, and youth center coordinators operating as independent contractors. Typically, industry operators provide personalized services, which favor small localized operators.
Competitive LandscapeMarket Share Concentration | Key Success Factors | Cost Structure Benchmarks Basis of Competition | Barriers to Entry | Industry Globalization
Enterprises by employment size*
EmployeesEnterprises
(%)Employment
(%)
1 to 4 46.9 3.85 to 9 15.8 5.110 to 19 12.5 8.020 to 99 15.1 27.3100 to 499 7.0 31.8500 or more 2.7 24.0
*Latest available data for employing fi rmsSOURCE: US CENSUS BUREAU COUNTY BUSINESS PATTERNS
Level Concentration in this industry is Low
IBISWorld identifies 250 Key Success Factors for a business. The most important for this industry are:

WWW.IBISWORLD.COM Adoption & Child Welfare Services in the US February 2015 22
Competitive Landscape
Cost Structure Benchmarkscontinued
ProfitProfit, defined as earnings before interest and taxes, is not application to most industry operators. In 2015, an estimated 87.0% of industry establishments operate as 501-c nonprofit organizations. While nonprofit firms may in fact generate an excess of revenue over operating expenses, this designation means that any surplus revenue generated by the organization must be retained for self-preservation, expansion, or special projects; surplus revenue cannot be distributed as profit or dividends.
Profit for for-profit firms has increased over the past five years, thereby boosting margins for the industry as a whole. Industry operators benefited from federal legislation that funded for-profit foster care agencies, even as state governments increasingly limited the participation of for-profit adoption services firms. On average, the industry is expected to
recover from average losses totaling 0.6% of revenue in 2010 to margins of 2.7% in 2015. However, profit margins are expected to remain below prerecession levels during the current year.
WagesSimilar to other service industries, wages, including salary and benefits, account for the bulk of operating costs. This industry’s labor force is comprised primarily of social workers, counselors, and administrators. However, while many of these positions require a master’s degree or higher and additional licensing (in the field of psychology, for instance), the average wage is comparatively low at an estimated $36,948. This reflects the high number of industry firms that operate on a nonprofit basis, as nonprofit firms typically offer lower wages due to various budget constraints. Over the past five years,
Sector vs. Industry Costs
■ Profi t■ Wages■ Purchases■ Depreciation■ Marketing■ Rent & Utilities■ Other
Average Costs of all Industries in sector (2015)
Industry Costs (2015)
0
20
40
60
Perc
enta
ge o
f rev
enue
80
1008.6
19.2
6.52.22.9
16.7
43.9
2.7
30.7
5.6 0.72.310.8
47.2
SOURCE: WWW.IBISWORLD.COM

WWW.IBISWORLD.COM Adoption & Child Welfare Services in the US February 2015 23
Competitive Landscape
Cost Structure Benchmarkscontinued
wages’ share of revenue has grown as firms increased employment levels in response to recovering funding levels from public and private sector sources. In 2015, IBISWorld estimates that wages represent 47.2% of industry revenue.
PurchasesPurchases include food and beverages provided to child and youth program participants, books, software and other material used to provide services. Over the past five years, the growth of internet and computer technology caused industry firms to purchase new software, computers and educational tools. As a result, purchases share of revenue slightly increased. In 2015, purchases are anticipated to account for 10.2% of industry revenue.
Rent, utilities and depreciationMany industry firms are small nonemploying operators. These firms can often provide services from homes, schools, libraries or youth centers. As a result, rent and utility expenses are generally low for this industry. Nonetheless, larger operators need to rent facilities to provide various youth welfare services. Over the past five years, rent and utility costs slightly increased due to higher energy costs. In 2015, rent and utilities are expected to account for 5.6% of industry revenue.
Similar to rent and utilities, depreciation costs are low as most industry operators require minimal capital investments to participate in this
industry. However, the growth of computer technology has slightly increased capital investments over the past five years, as software and computer can be used to improve operating efficiency. In 2015, depreciation is expected to account for an estimated 2.3% of industry revenue.
OtherOther costs account for 29.5% of outlays. The greatest costs in this category are fundraising expenses, travel and meeting expenses, and lobbying expenses. Because a majority of industry establishments operate on a nonprofit basis, these firms depend on external funding for a significant portion of their operations. As a result, fundraising costs are expected to account for 15.6% of industry revenue. Other miscellaneous expenses include outsourced professional services, taxation and fringe benefits, repair and maintenance and general administration.
In addition, social welfare organizations receive federal funding, making it necessary to maintain positive relations staff with government agencies. Costs associated with this category include fees for outside consultants and staff charged with researching and advocating for programs benefitting the welfare of young people. Included within travel expenses are the costs of transporting national staff to the capitol and to local offices, as well as the costs of transporting and insuring children adopted from abroad.

WWW.IBISWORLD.COM Adoption & Child Welfare Services in the US February 2015 24
Competitive Landscape
Basis of Competition The Adoption and Child Welfare Services industry has a moderate level of competition. The majority of industry operators, both nonprofit and for-profit organizations, receive significant funding from state and local governments and the US Department of Health and Human Services (HHS). In 2014, government funding is expected to directly account for 81.9% of industry revenue, and the remaining 18.1% of revenue is derived from private contributions. This industry receives indirect revenue from government programs such as Temporary Assistance for Needy Families (TANF), which provides emergency grants for needy families.
Internal competitionBeing the recipient of federal and other external funding does not reduce internal competitive pressures on industry firms. Indeed, industry operators on average spend 15.6% of revenue on fundraising initiatives. The large amount of organizational resources devoted to fundraising reflects the competitive space in which child welfare organizations operate.
Internal competition for institutional funding requires that firms put all resources to quantifiably good use with a minimum of administrative overhead. As a result of the limited resources available to and the near infinite needs of the population served, industry operators compete intensely for the largest corporate and government agency grants. In awarding such grants, institutional donors consult a number of performance metrics, as well as intangibles such as reputation, to ensure that their money is put to good use. Numerical performance metrics are
designed to evaluate the efficiency of operations, quantified as the ratios of various expenses, including program expenses, administrative, expenses, fundraising expenses, to revenue.
Transparency metrics include the presence of independent voting board members, strong conflict of interest and whistleblower policies, the public availability of board meeting minutes, CEO compensation data, and the presentation of audited financials (Form 990 for nonprofit organizations).
Individual firms face unique competitive conditions based on their area of specialization. Adoption agencies and facilitators and foster care agencies compete on customer service, the success of training programs, and overall reputation. Local youth service program providers compete not only for external funding, but also for youth membership, balancing a need to maintain the attention of participants with the crucial educational and career services in its mandate. National child welfare organizations, in contrast, compete on the services provided to member organizations. An effective national representative must generate policy-relevant research, increase federal funding for members, and otherwise provide members with strategic and organizational assistance.
External competitionIndustry operators face external competition from other social services providers for private and public grants and donations. Other social services organizations include homeless shelters, medical clinics and food banks. Over the past five years, external competition increased as donations slowed during the recession.
Level & Trend Competition in this industry is Medium and the trend is Steady

WWW.IBISWORLD.COM Adoption & Child Welfare Services in the US February 2015 25
Competitive Landscape
Industry Globalization
The level of globalization for firms in this industry is low and will remain steady in the future. The majority of the industry’s services are performed domestically. While adoption agencies in the United States may bring children into the country from abroad as a service to
adoptive parents, this is increasingly uncommon. According to the US Department of State’s Office of Children’s Issues, incoming international adoptions decreased from 11,058 in 2010 to 7,092 in 2013, the latest year for which there is available data; the downward trend is
Barriers to Entry Firms in the Adoption and Child Welfare Services industry encounter moderate barriers to entry, facing low concentration and capital intensity, but a high degree of regulation. Although reputation is a strong differentiator in the constant competition for funding, the lack of significant market share concentration reflects a regular flow of new entrants. While the industry’s largest organizations possess formidable lobbying arms, firms able to address an unmet need, or serve an otherwise underserved population can immediately compete for institutional and private funding. Nonetheless, navigating the regulatory environment in which the industry operates, and obtaining legally mandated licensing, can prove a significant barrier to entry.
While the majority of industry operators qualify for federal assistance, including exemption from federal income tax, demonstrating eligibility can be daunting. In the United States, IRS-designated 501(c) organizations, confers exemption from federal income taxes on organizations that meet a set of criteria based on purpose or mission statement, limitations on spending, and internal safeguards. In 2014, an estimated 87.0% of industry operators qualify for this exemption.
In addition to tax exemption, state, local, and federal funding is available to industry firms; a portion of this funding is also available to for-profit industry operators. In general, funding from the federal government is derived from
organizations such as the Administration for Children and Families, which operates under the Department of Health and Human Services. Increasingly, the federal government uses block grants to the states for specific programs to give them more discretion in allocating resources. While government funding is available to a number of organizations, winning financial awards requires that an organization possess familiarity with the regulatory environment and a strong grant-writing capacity.
Independent contractors in the industry are subject to barriers to entry in to form of licensing and educational requirements. Social workers must, in general, possess a master’s degree in social work (MSW) or a related field (e.g. psychology), although a bachelor’s degree may be sufficient for certain entry-level positions. Additional licensing, typically two years or 3,000 hours of supervised clinical experience is required for licensure of clinical social workers in all states and the District of Columbia.
Level & Trend Barriers to Entry in this industry are Medium and Steady
Level & Trend Globalization in this industry is Low and the trend is Steady
Barriers to Entry checklist Level
Competition MediumConcentration LowLife Cycle Stage MatureCapital Intensity LowTechnology Change LowRegulation & Policy HeavyIndustry Assistance High
SOURCE: WWW.IBISWORLD.COM

WWW.IBISWORLD.COM Adoption & Child Welfare Services in the US February 2015 26
Competitive Landscape
Industry Globalizationcontinued
estimated to continue through 2015. This is mostly because agencies that previously provided international adoption services have increasingly focused on improving child welfare in the child’s home country, rather than bringing children into the United States. However, this trend was
exacerbated in 2013 by the Dima Yakovlev Law, which banned Americans from adopting Russian children. According to data sourced from the Office of Children’s Issues, the number of Russian children adopted by Americans fell from 749 in 2012 to just 250 in 2013.

WWW.IBISWORLD.COM Adoption & Child Welfare Services in the US February 2015 27
Other Companies The Adoption and Child Welfare Services industry is highly fragmented, with no single operator contributing over 5.0% to industry revenue. Given the diversity of the industry’s services, and a general emphasis on community-centered social services, it is no surprise that small, local operators dominate. As a result, even operators with a 1.0% market share may represent significant players within a given niche. The following sections describe organizations which, though small in market share, represent the most prominent players in this industry.
Boys & Girls Clubs of America Estimated market share: 1.5%The Boys & Girls Clubs of America (BGCA) is a national nonprofit organization dedicated to enabling young people to reach their potential as productive and responsible citizens. Formed in 1906 as the national organization uniting the country’s many independent Clubs, BGCA today includes more than 4,100 independent Clubs serving more than 3.8 million children. In 2015, the organization is expected to generate revenue of $213.3 million.
The organization’s many programs operate in six strategic areas: education and career programs; character and leadership programs; health and life skills; the arts program; sports, fitness and recreation; and specialized programs. In each of these areas, the BGCA seeks to provide a safe learning environment, opportunities to build new skills and opportunities for members to form responsible relationships with adults and peers. Community-based and building-centered, individual club facilities are located primarily in schools, with a smaller portion located in youth centers on US Military installations and public housing.
The BGCA provides vital services to its affiliates, including financial and organizational support during difficult
economic times. The national organization derives the bulk of its revenue from state funding, followed by federal funding, private sector funding, private individuals and from membership dues from affiliate Clubs (ranging from 0.5% to 1.25% of the annual budgets of these Clubs). While local Clubs derive a portion of their funding independently, additional funds from BGCA passed directly to the operating budgets of local affiliates form a crucial part of their income streams. In 2009, BGCA revenue declined 7.7%, leading to a reduction of programs and the consolidation and closing of Clubs. Since that year, however, industry revenue has increased million, allowing the national organization to open 80 new locations and to prevent the closure of 120 threatened Clubs.
Big Brothers Big Sisters of America Estimated market share: Less than 1.0%The Big Brothers Big Sisters of America (BBBS) is a nonprofit organization dedicated to helping economically disadvantaged children succeed academically and socially. Founded in 1904, BBBS is the largest and oldest youth mentoring service organization in the United States. In 2015, the organization is expected to generate about $31.8 million in revenue, which includes membership fees, government funding and charitable contributions. On average, revenue has performed well over the past five years, mostly due to steady private contributions and grants.
BBBS mentors children between the ages of 6 through 18 in all 50 states. The mentoring process allows children to develop successful relationships with stable, supportive, and responsible adults. This in turn, allows participants to become more confident in their schoolwork and family lives. In fact, a 1995 study by Public/Private Ventures (a Philadelphia-based research
Major CompaniesThere are no Major Players in this industry | Other Companies

WWW.IBISWORLD.COM Adoption & Child Welfare Services in the US February 2015 28
Major Companies
Other Companiescontinued
organization) found that compared with children not in the program, Little Brothers and Little Sisters were 46% less likely to begin using illegal drugs, 52% less likely to skip a class and 33% less likely to hit someone.
The Child Welfare League of America Estimated market share: Less than 1.0%Founded in 1920, the Child Welfare League of America (CWLA) is one of the nation’s oldest child welfare organizations. CWLA, a nonprofit, operates through research, lobbying and direct service in the area of child welfare. In 2015, CWLA is expected to generate $5.1 million in revenue and provide services to more than nine million children.
CWLA provides direct support to its membership of about 800 public and private agencies, and arms these agencies with its most recent research on best practices. The research to practice and research and evaluation units of the CWLA offers robust analysis of emerging trends in child welfare. Member organizations, in turn, provide direct service in a variety of areas included within this industry, including adoption, teen and adolescent family planning, childcare, child protection, children affected by incarceration, foster care, positive youth development, substance abuse prevention and treatment, and community services.
The organization has seen revenue decline in recent years, starting prior to the recession. As the organization has struggled to stay afloat, cutting costs through massive layoffs, declining membership has compounded its money problems. With weak growth in local branch revenue, member agencies are increasingly unwilling to divert any of their funding to the national organization. Additionally, a perceived shift within CWLA from member services
to lobbying and advocacy has led many members to leave, with membership declining 9.0% in 2010 alone.
Public government agenciesIt is important to note that the industry is made up of a combination of private and nonprofit enterprises, the majority of which receive government funding. Thus, while government-owned agencies contribute significantly to the direction and revenue of this industry, they are not included directly among its operators. IBISWorld estimates that in 2015, about 87.0% of industry establishments belong to the nonprofit sector.
While the government agencies that provide funding to many of this industry’s operators are not included in industry enterprises, they have a significant impact, most notably through the Administration for Children and Families (ACF). The ACF, an agency under the US Department of Health and Human Services, is responsible for providing for the economic wellbeing of families and children. ACF funding directly supports adoption and child welfare programs administered through federal and state government agencies, private firms, nonprofit organizations and other community and faith-based organizations. Additionally, the ACF is responsible for the direct administration of the Children’s Bureau. This bureau is responsible for the operation of a number of child welfare programs, including those targeting at-risk youth. These programs support interventions aimed to strengthen the family unit, and when that is not possible, to transfer children as quickly as possible from foster care to safe, permanent homes. Finally, the US Department of Family and Youth Services assists runaway and homeless youth and their families by providing emergency shelter, food, clothing, counseling and referrals for healthcare.

WWW.IBISWORLD.COM Adoption & Child Welfare Services in the US February 2015 29
Capital Intensity The Adoption and Child Welfare Services industry is fundamentally service-oriented, and as a result, is characterized by a low degree of capital intensity. In 2015, for every $1.00 spent on wages, industry operators are expected to spend $0.05 on capital investments. Over the past five years, capital intensity has remained relatively stable. While industry operators have increased investments in computers, software and other electronic learning tools, spending on wages has increased likewise, keeping overall capital intensity low.
Adoption and child welfare services necessitate a high degree of personal interaction between employees and clients. As a result, despite benefiting from volunteer labor and low average
wages, total wage costs are estimated to account for 47.2% of revenue in 2015. Employees, primarily social workers,
Operating ConditionsCapital Intensity | Technology & Systems | Revenue VolatilityRegulation & Policy | Industry Assistance
Tools of the Trade: Growth Strategies for Success
SOURCE: WWW.IBISWORLD.COM
Labo
r Int
ensi
veCapital Intensive
Change in Share of the Economy
New Age Economy
Recreation, Personal Services, Health and Education. Firms benefi t from personal wealth so stable macroeconomic conditions are imperative. Brand awareness and niche labor skills are key to product differentiation.
Traditional Service Economy
Wholesale and Retail. Reliant on labor rather than capital to sell goods. Functions cannot be outsourced therefore fi rms must use new technology or improve staff training to increase revenue growth.
Old Economy
Agriculture and Manufacturing. Traded goods can be produced using cheap labor abroad. To expand fi rms must merge or acquire others to exploit economies of scale, or specialize in niche, high-value products.
Investment Economy
Information, Communications, Mining, Finance and Real Estate. To increase revenue fi rms need superior debt management, a stable macroeconomic environment and a sound investment plan.
Testing & Educational Support
Donations, Grants & Endowment
Brand Name Pharmaceutical Manufacturing
Orphanages & Group Homes
Generic Pharmaceutical ManufacturingAdoption & Child Welfare Services
Capital intensity
0.5
0.0
0.1
0.2
0.3
0.4
SOURCE: WWW.IBISWORLD.COMDotted line shows a high level of capital intensity
Capital units per labor unit
Adoption & Child Welfare
Services
Healthcare and Social
Assistance
Economy
Level The level of capital intensity is Low
WWW.IBISWORLD.COM Adoption & Child Welfare Services in the US February 2015 30
Operating Conditions
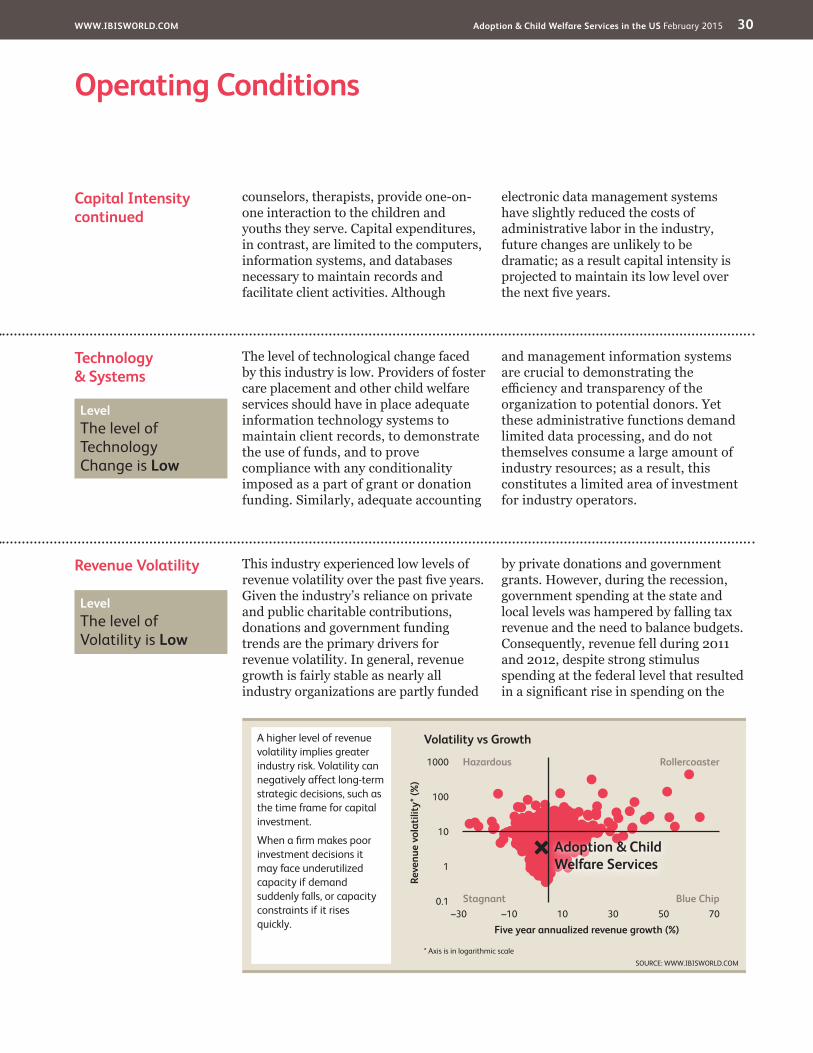
Revenue Volatility This industry experienced low levels of revenue volatility over the past five years. Given the industry’s reliance on private and public charitable contributions, donations and government funding trends are the primary drivers for revenue volatility. In general, revenue growth is fairly stable as nearly all industry organizations are partly funded
by private donations and government grants. However, during the recession, government spending at the state and local levels was hampered by falling tax revenue and the need to balance budgets. Consequently, revenue fell during 2011 and 2012, despite strong stimulus spending at the federal level that resulted in a significant rise in spending on the
Technology& Systems
The level of technological change faced by this industry is low. Providers of foster care placement and other child welfare services should have in place adequate information technology systems to maintain client records, to demonstrate the use of funds, and to prove compliance with any conditionality imposed as a part of grant or donation funding. Similarly, adequate accounting
and management information systems are crucial to demonstrating the efficiency and transparency of the organization to potential donors. Yet these administrative functions demand limited data processing, and do not themselves consume a large amount of industry resources; as a result, this constitutes a limited area of investment for industry operators.
Capital Intensitycontinued
counselors, therapists, provide one-on-one interaction to the children and youths they serve. Capital expenditures, in contrast, are limited to the computers, information systems, and databases necessary to maintain records and facilitate client activities. Although
electronic data management systems have slightly reduced the costs of administrative labor in the industry, future changes are unlikely to be dramatic; as a result capital intensity is projected to maintain its low level over the next five years.
Level The level of Technology Change is Low
SOURCE: WWW.IBISWORLD.COM
Volatility vs Growth
Reve
nue
vola
tility
* (%
)
1000
100
10
1
0.1
Five year annualized revenue growth (%)–30 –10 10 30 50 70
Hazardous
Stagnant
Rollercoaster
Blue Chip
* Axis is in logarithmic scale
Adoption & Child Welfare Services
A higher level of revenue volatility implies greater industry risk. Volatility can negatively affect long-term strategic decisions, such as the time frame for capital investment.
When a fi rm makes poor investment decisions it may face underutilized capacity if demand suddenly falls, or capacity constraints if it rises quickly.
Level The level of Volatility is Low
WWW.IBISWORLD.COM Adoption & Child Welfare Services in the US February 2015 31
Operating Conditions
Regulation & Policy The Adoption and Child Welfare Services industry is subject a high level of federal and state laws and regulations, including licensing for social workers and other industry practitioners and numerous participation requirements for funding from federal and state healthcare programs.
Regulation under the HHS and ACFThe Administration for Children and Families (ACF), a division of the US Department of Health and Human Services (HHS) is the federal agency responsible for funding and regulating this industry. In addition, the ACF administers over 65 social programs relevant to the Adoption and Child Welfare Services industry.
Foster care legislation has been the focus of legislators over the past decades. The Adoption and Safe Families Act of 1997 (ASFA) reversed previous legislation which promoted a policy of reuniting biological families, even when doing so ran contrary to the child’s best interest. The ASFA and subsequent regulations mandate that states improve efforts to provide children with permanent families. The ASFA provided 38 states with incentive awards for increasing the number of adoptions from foster care. Additionally, in 2008, the US congress passed the Fostering Connections to Success and Increasing Adoptions Act. This act promoted placing children with relatives rather than with non-relative foster families. Additionally, the bill funds counseling resources for parents to increase the likelihood for children to
return to their biological parents. Consequently, the number of children is foster declined. According to the latest available data from ACF’s “Child Welfare Outcomes 2009-2012” report to congress, there were an estimated 397,000 children in foster care at the conclusion of 2012.
Other significant regulatory changes affect the participation of for-profit firms in the industry, increasing opportunities for such firms in foster care placement, and decreasing opportunities in adoption services. In 2005, congress passed bill S. 1894, ending a restriction on the use of federal funds to support for-profit foster care. However, while federal legislation has increased the number of for-profit foster care providers, states has limited the participation of for-profit adoption service agencies. This has decreased the number of for-profit adoption agencies this industry. On average, the number of for-profit operators is expected to slightly decline.
LicensingTo qualify for reimbursement under Medicaid and other programs serving low-income children and their families, industry facilities are subject to participation and other requirements imposed by federal and state authorities. Most programs are administered through Title IV of the Social Security Administration, which provides grants to states in exchange for child welfare services. To be eligible for these funds, participants are subject to requirements
Revenue Volatilitycontinued
industry during the previous year. Nonetheless, the industry has rebounded in line with the growing economy, as rising government spending has resulted in greater funding for industry services, Moreover, rising disposable income
levels across the country have led to an uptick in private donations. Consequently, industry revenue is grew as much as an estimated 3.5% in 2014 and is expected to increase for a third consecutive year in 2015.
Level & Trend The level of Regulation is Heavy and the trend is Steady
WWW.IBISWORLD.COM Adoption & Child Welfare Services in the US February 2015 32
Operating Conditions
Industry Assistance Industry AssistanceThe Adoption and Child Welfare Services industry receives high levels of industry assistance, as government programs provide considerable funding for industry operators. Federal funds for this industry are distributed primarily through the Department of Health and Human Services (HHS)’s Administration for Children and Families (ACF). ACF programs include pre-appropriated grants for long-term projects and discretionary grants for short-term initiatives. In fiscal 2015, the ACF has a proposed budget of $51.6 billion, roughly on par with fiscal 2014’s budget of $51.7 billion. The agency’s planned mandatory social services expenditure is expected to fall $183 million from 2014 to total $33.8 billion in 2015. However, overall government funding for social services programs have increased over the past five years. ACF’s budget request for fiscal 2016 is significantly higher than that of the current year, listed at $59.7 billion dollars.
The most significant changes to industry assistance over the past five years, and in the coming five years will be the result of increasing concern over the federal deficit. According to the Congressional Budget office, the Budget Control Act of 2011 may reduce the federal government discretionary spending budget
by $1.5 trillion from 2013 to 2022. While a number of programs serving low-income families are protected discretionary cuts, including Social Security, Medicaid, and food stamps, these cuts will certainly affect the operations of the HHS. Government programs and departments serving children and families are likely to experience budget cuts, including: Title V Maternal and Child Health Block Grants, funding for the child Abuse Prevention and Treatment Act (CAPTA) and the Individuals with Disabilities Education Act (IDEA), Promoting Safe and Stable Families, Mental Health, Substance Abuse, afterschool programs, Juvenile Justice programs, Teen Pregnancy, Promise Neighborhoods, Community Health Centers, and Community Services funding. As a result, government assistance for this industry is anticipated to decrease over the next five years.
Private organizationsThis industry also receives assistance from private sector organizations that provide funding for social services. These include charitable trusts and general donations. Additionally, organizations such as Child Trends provide research on child poverty, child welfare and childhood development. Research and education improves the services that this industry can provide.
Regulation & Policycontinued
that relate to client rights, quality of services, physical facilities and administration. Long-term providers are subject to periodic unannounced inspection by state authorities, often under contract with the appropriate federal agency, to ensure compliance with the requirements of participation in the Medicaid or state program.
Employees and independent contractors in the industry may be subject to individual licensing requirements. The industry’s
labor force is comprised primarily of social workers, counselors, and program administrators. Social workers must, in general, possess a master’s degree in social work (MSW) or a related field (e.g. psychology); a bachelor’s degree may be sufficient for certain entry-level positions. Additional training, typically two years or 3,000 hours of supervised clinical experience is required for licensure of clinical social workers in all states and the District of Columbia.
Level & Trend The level of Industry Assistance is High and the trend is Steady

WWW.IBISWORLD.COM Adoption & Child Welfare Services in the US February 2015 33
Key StatisticsRevenue
($m)
Industry Value Added
($m)Establish-
ments Enterprises Employment Exports ImportsWages ($m)
Domestic Demand
Federal funding for social services
($b)2006 13,350.9 6,553.9 31,485 28,969 183,942 -- -- 6,006.5 N/A 16.52007 13,612.1 7,252.7 31,676 28,939 188,432 -- -- 6,231.8 N/A 16.72008 13,514.8 7,286.9 31,085 28,508 182,559 -- -- 6,273.3 N/A 16.82009 12,950.0 6,435.5 32,506 29,952 185,556 -- -- 6,072.9 N/A 17.02010 13,469.6 6,360.3 34,373 31,800 186,179 -- -- 6,131.4 N/A 19.22011 13,411.6 6,948.6 35,687 33,145 191,777 -- -- 6,170.7 N/A 18.92012 13,177.1 6,750.4 35,671 33,242 195,279 -- -- 6,249.7 N/A 17.92013 13,273.9 6,752.8 36,386 33,946 197,279 -- -- 6,314.8 N/A 18.12014 13,738.1 7,237.3 37,500 34,974 202,821 -- -- 6,522.9 N/A 19.12015 14,107.6 7,404.8 38,469 35,895 207,444 -- -- 6,694.4 N/A 19.42016 14,387.2 7,622.0 39,442 36,804 211,681 -- -- 6,843.6 N/A 19.32017 14,835.1 7,919.1 40,515 37,802 217,563 -- -- 7,059.7 N/A 19.82018 15,135.9 8,152.6 41,458 38,687 221,942 -- -- 7,216.3 N/A 20.22019 15,390.6 8,363.4 42,319 39,514 225,810 -- -- 7,353.3 N/A 20.62020 15,731.9 8,617.0 43,319 40,474 230,575 -- -- 7,526.4 N/A 21.0Sector Rank 39/78 39/78 14/78 14/78 28/78 N/A N/A 29/78 N/A N/AEconomy Rank 530/1339 357/1339 195/1339 176/1339 210/1339 N/A N/A 243/1339 N/A N/A
IVA/Revenue (%)
Imports/Demand
(%)
Exports/Revenue
(%)
Revenue per Employee
($’000)Wages/Revenue
(%)Employees
per Est.Average Wage
($)
Share of the Economy
(%)2006 49.09 N/A N/A 72.58 44.99 5.84 32,654.31 0.042007 53.28 N/A N/A 72.24 45.78 5.95 33,071.88 0.052008 53.92 N/A N/A 74.03 46.42 5.87 34,363.14 0.052009 49.69 N/A N/A 69.79 46.89 5.71 32,728.13 0.042010 47.22 N/A N/A 72.35 45.52 5.42 32,932.82 0.042011 51.81 N/A N/A 69.93 46.01 5.37 32,176.43 0.052012 51.23 N/A N/A 67.48 47.43 5.47 32,003.95 0.042013 50.87 N/A N/A 67.28 47.57 5.42 32,009.49 0.042014 52.68 N/A N/A 67.74 47.48 5.41 32,160.87 0.052015 52.49 N/A N/A 68.01 47.45 5.39 32,270.88 0.042016 52.98 N/A N/A 67.97 47.57 5.37 32,329.78 0.042017 53.38 N/A N/A 68.19 47.59 5.37 32,448.99 0.052018 53.86 N/A N/A 68.20 47.68 5.35 32,514.35 0.052019 54.34 N/A N/A 68.16 47.78 5.34 32,564.10 0.052020 54.77 N/A N/A 68.23 47.84 5.32 32,641.87 0.05Sector Rank 47/78 N/A N/A 60/78 19/78 55/78 52/78 39/78Economy Rank 243/1339 N/A N/A 1202/1339 98/1339 960/1339 1018/1339 357/1339
Figures are inflation-adjusted 2015 dollars. Rank refers to 2015 data.
Revenue (%)
Industry Value Added
(%)
Establish-ments
(%)Enterprises
(%)Employment
(%)Exports
(%)Imports
(%)Wages
(%)
Domestic Demand
(%)
Federal funding for social services
(%)2007 2.0 10.7 0.6 -0.1 2.4 N/A N/A 3.8 N/A 1.22008 -0.7 0.5 -1.9 -1.5 -3.1 N/A N/A 0.7 N/A 0.62009 -4.2 -11.7 4.6 5.1 1.6 N/A N/A -3.2 N/A 1.22010 4.0 -1.2 5.7 6.2 0.3 N/A N/A 1.0 N/A 12.92011 -0.4 9.2 3.8 4.2 3.0 N/A N/A 0.6 N/A -1.62012 -1.7 -2.9 0.0 0.3 1.8 N/A N/A 1.3 N/A -5.32013 0.7 0.0 2.0 2.1 1.0 N/A N/A 1.0 N/A 1.12014 3.5 7.2 3.1 3.0 2.8 N/A N/A 3.3 N/A 5.52015 2.7 2.3 2.6 2.6 2.3 N/A N/A 2.6 N/A 1.62016 2.0 2.9 2.5 2.5 2.0 N/A N/A 2.2 N/A -0.52017 3.1 3.9 2.7 2.7 2.8 N/A N/A 3.2 N/A 2.62018 2.0 2.9 2.3 2.3 2.0 N/A N/A 2.2 N/A 2.02019 1.7 2.6 2.1 2.1 1.7 N/A N/A 1.9 N/A 2.0
2020 2.2 3.0 2.4 2.4 2.1 N/A N/A 2.4 N/A 1.9Sector Rank 53/78 59/78 34/78 27/78 50/78 N/A N/A 58/78 N/A N/AEconomy Rank 731/1339 791/1339 391/1339 348/1339 568/1339 N/A N/A 601/1339 N/A N/A
Annual Change
Key Ratios
Industry Data
SOURCE: WWW.IBISWORLD.COM

WWW.IBISWORLD.COM Adoption & Child Welfare Services in the US February 2015 34
Jargon & Glossary
BARRIERS TO ENTRY High barriers to entry mean that new companies struggle to enter an industry, while low barriers mean it is easy for new companies to enter an industry.
CAPITAL INTENSITY Compares the amount of money spent on capital (plant, machinery and equipment) with that spent on labor. IBISWorld uses the ratio of depreciation to wages as a proxy for capital intensity. High capital intensity is more than $0.333 of capital to $1 of labor; medium is $0.125 to $0.333 of capital to $1 of labor; low is less than $0.125 of capital for every $1 of labor.
CONSTANT PRICES The dollar figures in the Key Statistics table, including forecasts, are adjusted for inflation using the current year (i.e. year published) as the base year. This removes the impact of changes in the purchasing power of the dollar, leaving only the “real” growth or decline in industry metrics. The inflation adjustments in IBISWorld’s reports are made using the US Bureau of Economic Analysis’ implicit GDP price deflator.
DOMESTIC DEMAND Spending on industry goods and services within the United States, regardless of their country of origin. It is derived by adding imports to industry revenue, and then subtracting exports.
EMPLOYMENT The number of permanent, part-time, temporary and seasonal employees, working proprietors, partners, managers and executives within the industry.
ENTERPRISE A division that is separately managed and keeps management accounts. Each enterprise consists of one or more establishments that are under common ownership or control.
ESTABLISHMENT The smallest type of accounting unit within an enterprise, an establishment is a single physical location where business is conducted or where services or industrial operations are performed. Multiple establishments under common control make up an enterprise.
EXPORTS Total value of industry goods and services sold by US companies to customers abroad.
IMPORTS Total value of industry goods and services brought in from foreign countries to be sold in the United States.
INDUSTRY CONCENTRATION An indicator of the dominance of the top four players in an industry. Concentration is considered high if the top players account for more than 70% of industry revenue. Medium is 40% to 70% of industry revenue. Low is less than 40%.
INDUSTRY REVENUE The total sales of industry goods and services (exclusive of excise and sales tax); subsidies on production; all other operating income from outside the firm (such as commission income, repair and service income, and rent, leasing and hiring income); and capital work done by rental or lease. Receipts from interest royalties, dividends and the sale of fixed tangible assets are excluded.
INDUSTRY VALUE ADDED (IVA) The market value of goods and services produced by the industry minus the cost of goods and services used in production. IVA is also described as the industry’s contribution to GDP, or profit plus wages and depreciation.
INTERNATIONAL TRADE The level of international trade is determined by ratios of exports to revenue and imports to domestic demand. For exports/revenue: low is less than 5%, medium is 5% to 20%, and high is more than 20%. Imports/domestic demand: low is less than 5%, medium is 5% to 35%, and high is more than 35%.
LIFE CYCLE All industries go through periods of growth, maturity and decline. IBISWorld determines an industry’s life cycle by considering its growth rate (measured by IVA) compared with GDP; the growth rate of the number of establishments; the amount of change the industry’s products are undergoing; the rate of technological change; and the level of customer acceptance of industry products and services.
NONEMPLOYING ESTABLISHMENT Businesses with no paid employment or payroll, also known as nonemployers. These are mostly set up by self-employed individuals.
PROFIT IBISWorld uses earnings before interest and tax (EBIT) as an indicator of a company’s profitability. It is calculated as revenue minus expenses, excluding interest and tax.
VOLATILITY The level of volatility is determined by averaging the absolute change in revenue in each of the past five years. Volatility levels: very high is more than ±20%; high volatility is ±10% to ±20%; moderate volatility is ±3% to ±10%; and low volatility is less than ±3%.
WAGES The gross total wages and salaries of all employees in the industry. The cost of benefits is also included in this figure.
Industry Jargon
IBISWorld Glossary
ADOPTION FACILITATOR An unlicensed adoption practitioner charging a fee to intermediate between potential adopters and individuals seeking to put their children up for adoption
PRIVATE ADOPTION AGENCY An agency that is licensed by the state to help birth parents find an adopting family.
PUBLIC ADOPTION AGENCY An agency that is usually nonprofit and affiliated with a government agency.

Disclaimer
This product has been supplied by IBISWorld Inc. (‘IBISWorld’) solely for use by its authorized licensees strictly in accordance with their license agreements with IBISWorld. IBISWorld makes no representation to any other person with regard to the completeness or accuracy of the data or information contained herein, and it accepts no responsibility and disclaims all liability (save for liability which cannot be lawfully disclaimed) for loss or damage whatsoever suffered or incurred by any other person resulting from
the use of, or reliance upon, the data or information contained herein. Copyright in this publication is owned by IBISWorld Inc. The publication is sold on the basis that the purchaser agrees not to copy the material contained within it for other than the purchasers own purposes. In the event that the purchaser uses or quotes from the material in this publication – in papers, reports, or opinions prepared for any other person – it is agreed that it will be sourced to: IBISWorld Inc.
At IBISWorld we know that industry intelligence is more than assembling factsIt is combining data with analysis to answer the questions that successful businesses askIdentify high growth, emerging & shrinking marketsArm yourself with the latest industry intelligenceAssess competitive threats from existing & new entrantsBenchmark your performance against the competitionMake speedy market-ready, profit-maximizing decisions
Who is IBISWorld?We are strategists, analysts, researchers, and marketers. We provide answers to information-hungry, time-poor businesses. Our goal is to provide real world answers that matter to your business in our 700 US industry reports. When tough strategic, budget, sales and marketing decisions need to be made, our suite of Industry and Risk intelligence products give you deeply-researched answers quickly.
IBISWorld MembershipIBISWorld offers tailored membership packages to meet your needs.
Copyright 2015 IBISWorld Inc
www.ibisworld.com | 1-800-330-3772 | [email protected]