ib grade 9 math book-chapter5
TRANSCRIPT

7/24/2019 IB grade 9 Math book-Chapter5
http://slidepdf.com/reader/full/ib-grade-9-math-book-chapter5 1/58
Vocabulary
direct variation
constant of variation
partial variation
slope
riserun
rate of change
first differences
Modelling WithGraphs
There are many types of puzzles—logic puzzles, word
puzzles, number puzzles, mechanical puzzles, and puzzles
based on diagrams. Puzzles may be solved by methods
such as guessing, trial and error, and analysing data. The
solution to a puzzle may rely on patterns and relations.
Being able to represent data in a variety of ways is a
useful skill in puzzle solving. In this chapter, you will
investigate graphs and data and develop equations that
represent relations between two variables. You willalso analyse and interpret data so that you can make
conclusions and extensions.
CHAPTER
5Linear Relations
Construct tables of values, graphs,
and equations.
Identify, through investigation,
some properties of linear relations,
and apply these properties to
determine whether a relation is
linear or non-linear.
Compare the properties of direct
variation and partial variation in
applications, and identify the initial
value.
Determine values of a linear
relation by using a table of values
and by using the equation of the
relation.
Determine other representations
of a linear relation, given one
representation.
Describe the effects on a lineargraph and make the corresponding
changes to the linear equation
when the conditions of the
situation they represent are varied.
Analytic Geometry
Determine, through investigation,
various formulas for the slope of a
line segment or a line, and use the
formulas to determine the slope of
a line segment or a line. Determine, through investigation,
connections among the
representations of a constant rate
of change of a linear relation.
234

7/24/2019 IB grade 9 Math book-Chapter5
http://slidepdf.com/reader/full/ib-grade-9-math-book-chapter5 2/58
Chapter Problem
Toothpick patterns are popular puzzles. How
does each pattern relate to the number of
toothpicks? In this chapter, you will develop
equations to represent relationships like these.
2

7/24/2019 IB grade 9 Math book-Chapter5
http://slidepdf.com/reader/full/ib-grade-9-math-book-chapter5 3/58
1. In each part, decide which rational number
is not equivalent to the others.
a) , 0.75, ,
b) 2.5, 2 , ,
c) 0.5, , ,
2. Express each rational number in decimal
form.
a) b) c) d)
3. Express each rational number in lowest
terms.
a) b) c) d)30
12
12
48
15
10˛̨
3
9
12
5
35
40˛̨
7
10
2
5
1
2
1
2
1
2
5
2
5
2
1
2
3
4
3
4
3
4
236 MHR • Chapter 5
Rational Numbers
, and 1.5 are equivalent rational numbers.
Often, rational numbers can be simplified, or expressed in lowest terms.
3
2
9 3
6 3˛̨
9
6
11
2, ˛̨
3
2,
3
2,
3
2
—2 —1 0 1 2
This dot is at 11—2
. I
could also name this
point 3—
2or 1.5.
This dot is at 1 3—4 . I could
also name this point7—
4or
1.75.
Ratio and Proportion
The body of a 50-kg woman contains
about 25 kg of water. The body of an
80-kg man contains about 48 kg of water.
Find the mass of water in the bodies
of a 60-kg woman and a 60-kg man.
Woman:
Man:
The body of a 60-kg woman contains 30 kg of water, and the body of a
60-kg man contains 36 kg of water.
3
5 60 36
1
2 60 30
Person
Ratio of Water
to Mass
Ratio in
Simplest Form
Ratio in
Fraction Form
50-kg woman 25:50 1:2 25—
50
1—
2
80-kg man 48:80 3:5 48—
80
3—
5

7/24/2019 IB grade 9 Math book-Chapter5
http://slidepdf.com/reader/full/ib-grade-9-math-book-chapter5 4/58
4. Write a ratio to compare each quantity to its
total. Express each ratio in simplest form.
a) 5 kg of potassium in 20 kg of fertilizer
b) 12 g of fat in 96 g of meat
c) 12 L of water in 14 L of juice
d) 40 mL of chlorine in 850 mL of solution
5. Seven out of ten people prefer Fresh
toothpaste. How many would prefer Fresh
in a group of 120 people?
6. To convert from centimetres to inches, you
can use the fact that a 30-cm ruler is just ov
12 inches long. A person is 160 cm tall. Wh
is the person’s approximate height, in inche
Get Ready • MHR 2
7. The table lists the number of days with rain
during July in four Canadian cities. For each
city, express the number of rainy days as a
percent of the 31 days in July. Round to one
decimal place.
8. The three key elements in lawn fertilizer a
expressed as a ratio of their percents of the
total mass. For example, in 20:4:8 fertilizer
20% is nitrogen, 4% is phosphorus, and 8
is potassium.
Calculate the mass of each element in each
bag of fertilizer.
a) 10-kg bag of 20:4:8 fertilizer
b) 25-kg bag of 21:7:7 fertilizer
c) 50-kg bag of 15:5:3 fertilizer
d) 20-kg bag of 10:6:4 fertilizer
Location Number of Days With Rain
Toronto, ON 10
Vancouver, BC 7
Charlottetown, PE 12
St. John’s, NL 14
Percents
Over the track and field season, the height Fred cleared in the high jump
increased from 1.81 m to 1.96 m. He was hoping to have a 20% increase in height.
Height increase 1.96 1.81 0.15
Percent increase
100%
8.3%
Fred increased his jump height by about 8.3%.
For a 20% increase, multiply by 20% or 0.2, and then add the result to the original height.
0.20 1.81 0.362
1.81 0.362 2.172
Fred would have to clear about 2.17 m to increase his jump height by 20%.
0.15
1.81
height increase
original height 100%

7/24/2019 IB grade 9 Math book-Chapter5
http://slidepdf.com/reader/full/ib-grade-9-math-book-chapter5 5/58238 MHR • Chapter 5
5.1Direct Variation
The distance that a person can
jog is related to time. If you are
jogging at a constant speed of
100 m/min, how far can you
jog in 10 min? in 1 h?
Investigate
What is the relationship between
distance and time?
1. Susan can jog at a steady pace of 150 m/min
for the first hour.
a) Create a table showing the distance that
Susan jogs in 0 min, 1 min, 2 min, and so
on up to 10 min.
b) Identify the independent variable and the
dependent variable. Graph this relationship.
c) Describe the shape of the graph. Where does it
intersect the vertical axis?
d) Write an equation to find the distance, d , in metres, that Susan
jogs in t minutes.
e) Use the equation to determine the distance that Susan can jog
in 40 min.
f) Consider the distance Susan jogged in 2 min. What happens to
the distance when the time is doubled? What happens to the
distance when the time is tripled?
2. Trish’s steady jogging pace is 175 m/min. Repeat step 1 using
Trish’s speed.
3. Reflect Describe how to develop an equation for distance when
you know the average speed.
grid paper
Tools
You learned about
independent and dependent
variables in Chapter 2:
Relations.
Makinonnections

7/24/2019 IB grade 9 Math book-Chapter5
http://slidepdf.com/reader/full/ib-grade-9-math-book-chapter5 6/58
The relationship between distance and time is
an example of a . For example,
the table shows distances travelled in various
time periods at a constant speed of 10 m/s.
When time is multiplied by a specific number,
distance is also multiplied by the same number.
Another way to describe this direct variation is
to say that distance varies directly with time.
In a direct variation, the ratio of corresponding values of the variables
does not change. So, if d is distance and t is time, then k , where k
is called the . Multiplying both sides of the
equation by t gives d kt .
For the data in the table, 10, or d 10t . The constant of variation
is 10.
Example 1 Algebraic Direct Variation
The Fredrick family travels 250 km to a relative’s home. The distance,
d , in kilometres, varies directly with the time, t , in hours.
a) Find the equation relating d and t if d 43 when t 0.5.
What does the constant of variation represent?
b) Use the equation to determine how long it will take the
Fredricks to reach their destination.
Solution
a) Since d varies directly with t , the equation has the form d kt .
To find k , substitute the given values into k .
k
86
The constant of variation represents the constant average
speed, 86 km/h. The equation relating d to t is d 86t .
b) Substitute d 250.
250 86t
t Divide both sides by 86.
2.9 t
It will take the Fredricks about 2.9 h to reach their destination.
250
86
43
0.5
d
t
d
t
constant of variation
d
t
direct variationTime (s) Distance (m)
1 10
2 20
3 30
4 40
5 50
5.1 Direct Variation • MHR 2
a relationship between t
variables in which one
variable is a constant
multiple of the other
direct variation
in a direct variation, the
ratio of corresponding
values of the variables,
often represented by k ,
the constant multiple by
which one variable is
multiplied
if d varies directly as t ,
then the constant of
variation, k , is given by
k d —
t or d kt
constant of variatio

7/24/2019 IB grade 9 Math book-Chapter5
http://slidepdf.com/reader/full/ib-grade-9-math-book-chapter5 7/58
Example 2 Hourly Rate of Pay
Amir works part-time at a local bookstore. He earns $7.50/h.
a) Describe the relationship between his pay, in dollars, and
the time, in hours, he works.
b) Illustrate the relationship graphically and represent it
with an equation.
c) One week, Amir works 9 h. Find his pay for that week.
Solution
a) To get Amir’s pay, multiply the time worked, in hours, by $7.50.
This means that Amir’s pay, P , in dollars, varies directly with the
time, t , in hours worked.
b) Method 1: Pencil and Paper
This direct variation can be modelled by the equation P 7.50t ,
where k 7.50 is the constant of variation.
Method 2: Use a Graphing CalculatorUse the data from the table in Method 1.
• To clear all lists, pressn[MEM] to display the MEMORY
menu, select 4:ClrAllLists, and presse.
• To enter the data into the lists, pressqand select 1:Edit. Under
list L1, enter the values for time worked, in hours. Under list L2,
enter the values for pay, in dollars.
• To display the scatter plot, set up Plot1 as
shown. Pressz and select 9:ZoomStat.
Draw the line of best fit.
• Pressq, cursor over to display theCALC menu, and then select
4:LinReg(ax b). Enter L1, a comma, L2,
and another comma. Then, pressv,
cursor over to display the Y-VARS menu,
then select 1:FUNCTION, and then 1:Y1.
Presse, and then pressg.
240 MHR • Chapter 5
Time Worked, t (h) Pay, P ($)
0 02 15
4 30
6 45
8 60
10 75
7060
50
40
30
20
10
0 2 4 6Time (h)
P a y ( $ )
8 1012
80
t
P

7/24/2019 IB grade 9 Math book-Chapter5
http://slidepdf.com/reader/full/ib-grade-9-math-book-chapter5 8/58
• Pressy to see the equation representing
the relationship between the time, in hours,
worked and Amir’s pay, in dollars.
Y1 7.50X
Method 3: Use Fathom ™
From the Tool shelf , click and drag the Case Table icon into theworkspace. Name two attributes Time and Pay. Enter the data from
the table in Method 1 into the appropriate cells.
From the Tool shelf , click and drag the New Graph icon into the
workspace. Drag the Time attribute to the horizontal axis and the Pay
attribute to the vertical axis. You will see a scatter plot of the data.
From the Graph menu, select Least-Squares Line.
The equation representing the relationship between the time
worked and Amir’s pay will be indicated in the space below
the graph.
Pay 7.50Time
c) Interpolate from the graph. Read up from 9 h on the horizontal
axis to the line. Then, read across to find that Amir’s pay is
about $68.
You can also use the equation. Substitute t 9 into P 7.50t .
P 7.50(9)
67.50
Amir’s pay for 9 h is $67.50.
5.1 Direct Variation • MHR 2
In this case, if I use the graph, I only
get an approximate answer, but if I use
the equation, I get an exact answer.

7/24/2019 IB grade 9 Math book-Chapter5
http://slidepdf.com/reader/full/ib-grade-9-math-book-chapter5 9/58
Key Concepts
Direct variation occurs when the dependent variable varies
by the same factor as the independent variable.
Direct variation can be defined algebraically as k or y kx ,
where k is the constant of variation.
The graph of a direct variation is a straight line that passes through
the origin.
Communicate Your Understanding
Consider the two equations A 2C 5 and A 2C . Which
is an example of a direct variation? Explain.
Consider the graphs of d 2t and d 3t .
a) Describe the similarities.
b) Describe the differences. Explain why these differences occur.
Practise
For help with questions 1 and 2, see Example 1.
1. Determine the constant of variation for each direct variation.
a) The distance travelled by a bus varies directly with time. The bus travels 240 km in 3 h.
b) The total cost varies directly with the number of books bought.
Five books cost $35.
c) The volume of water varies directly with time. A swimming
pool contains 500 L of water after 5 min.
C2C2
C1C1
y
x
242 MHR • Chapter 5
y = kx
0 x
y
12
10
8
6
42
0 1 2 3 4
d
t
d = 2t
1210
8
642
0 1 2 3 4
d
t
d = 3t

7/24/2019 IB grade 9 Math book-Chapter5
http://slidepdf.com/reader/full/ib-grade-9-math-book-chapter5 10/58
2. The cost, C , in dollars, of building a
concrete sidewalk varies directly with its
length, s, in metres.
a) Find an equation relating C and s if a
200-m sidewalk costs $4500.
b) What does the constant of variation
represent?
c) Use the equation to determine the
cost of a 700-m sidewalk.
For help with questions 3 to 5, see Example 2.
3. Passent’s pay varies directly with the time, in hours,
she works. She earns $8/h.
a) Choose appropriate letters for variables. Make a table of values
showing Passent’s pay for 0 h, 1 h, 2 h, and 3 h.
b) Graph the relationship.
c) Write an equation in the form y kx .
4. The total cost of apples varies directly with the mass, in kilograms,
bought. Apples cost $1.50/kg.
a) Choose appropriate letters for variables. Make a table of values
showing the cost of 0 kg, 1 kg, 2 kg, and 3 kg of apples.
b) Graph the relationship.
c) Write an equation in the form y kx .
5. A parking garage charges $2.75/h for parking.
a)Describe the relationship between the cost of parking and thetime, in hours, parked.
b) Illustrate the relationship graphically and represent it with an
equation.
c) Use your graph to estimate the cost for 7 h of parking.
d) Use your equation to determine the exact cost for 7 h of parking.
Connect and Apply
6. The cost of oranges varies directly with the total mass bought.
2 kg of oranges costs $4.50.
a) Describe the relationship in words.
b) Write an equation relating the cost and the mass of the oranges.
What does the constant of variation represent?
c) What is the cost of 30 kg of oranges?
5.1 Direct Variation • MHR 2

7/24/2019 IB grade 9 Math book-Chapter5
http://slidepdf.com/reader/full/ib-grade-9-math-book-chapter5 11/58
7. To raise money for a local charity, students organized a wake-a-thon
where they attempted to stay awake for 24 h. At this event, the
amount of money raised varied directly with the time, in hours, a
participant stayed awake. Tania raised $50 by staying awake for 16 h.
a) Graph this direct variation for times from 0 h to 16 h, using pencil
and paper or technology.
b) Write an equation relating the money Tania raised and the
amount of time, in hours, she stayed awake.
c) How much would she have raised by staying awake for 24 h?
8. At his summer job, Sam’s regular wage is $9.50/h. For any overtime,
Sam earns 1.5 times his regular wage.
a) Write an equation representing Sam’s regular pay.
b) Write a separate equation representing Sam’s overtime pay.
c) Sam gets a raise to $10/h. How does this change affect the
equations?
9. At a bulk store, 0.5 kg of sugar costs $1.29.a) Explain why this relationship is considered a direct variation.
b) Graph this relationship, using pencil and paper or technology.
c) What would happen to the graph if the price increased to $1.49
for 0.5 kg?
10. Describe a situation that could be illustrated by each graph.
a) b)
11. A bat uses sound waves to avoid flying into objects. A sound wave
travels at 342 m/s. The times for sound waves to reach several
objects and return to the bat are shown in the table. Set up an
equation to determine the distance from the bat to the object. Then,
copy and complete the table.
6
5
4
32
1
0 2 4 6Time (min)
C o s
t ( $ )
8 1012
C
t
30
25
20
1510
5
0 1 2 3Time (s)
D i s t a
n c e ( m )
4 5 6
d
t
Object Time (s) Distance (m)
Tree 0.1
House 0.25
Cliff wall 0.04
244 MHR • Chapter 5
Selecting ToolsRepresenting
Reasoning and Proving
Communicating
Connecting Reflecting
Problem Solving
7/24/2019 IB grade 9 Math book-Chapter5
http://slidepdf.com/reader/full/ib-grade-9-math-book-chapter5 12/58
12. The volume of water in a swimming pool varies directly with time.
500 L of water is in the pool after 4 min.
a) Write an equation relating the volume of water and time.
What does the constant of variation represent?
b) Graph this relationship using pencil and paper or technology.
c) What volume of water is in the swimming pool after 20 min?
d) How long will it take to fill a swimming pool that holds115 000 L of water?
e) Describe the changes to the equation and graph if only 400 L of
water is in the pool after 4 min.
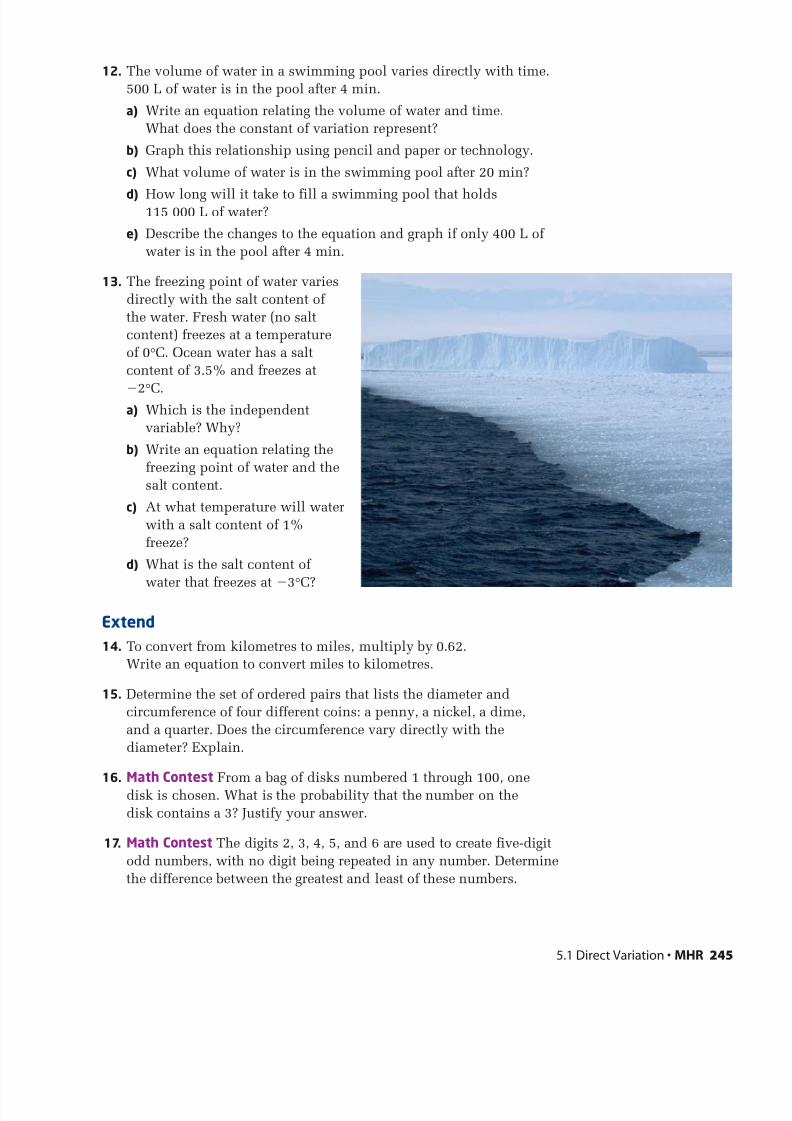
13. The freezing point of water varies
directly with the salt content of
the water. Fresh water (no salt
content) freezes at a temperature
of 0°C. Ocean water has a salt
content of 3.5% and freezes at
2°C.
a) Which is the independent
variable? Why?
b) Write an equation relating the
freezing point of water and the
salt content.
c) At what temperature will water
with a salt content of 1%
freeze?
d) What is the salt content of
water that freezes at
3°C?
Extend
14. To convert from kilometres to miles, multiply by 0.62.
Write an equation to convert miles to kilometres.
15. Determine the set of ordered pairs that lists the diameter and
circumference of four different coins: a penny, a nickel, a dime,
and a quarter. Does the circumference vary directly with the
diameter? Explain.
16. Math Contest From a bag of disks numbered 1 through 100, one
disk is chosen. What is the probability that the number on the
disk contains a 3? Justify your answer.
17. Math Contest The digits 2, 3, 4, 5, and 6 are used to create five-digit
odd numbers, with no digit being repeated in any number. Determine
the difference between the greatest and least of these numbers.
5.1 Direct Variation • MHR 2

7/24/2019 IB grade 9 Math book-Chapter5
http://slidepdf.com/reader/full/ib-grade-9-math-book-chapter5 13/58246 MHR • Chapter 5
5.2Partial Variation
Earth is made up of several distinct
layers. Beneath the oceans, the outermost
layer, or crust, is 5 km to 12 km thick.
Below the continents, Earth’s crust is 25 km
to 90 km thick. The mantle is about 2750 km
thick. The outer core is about 2260 km thick,
while the inner core has a thickness of about
1228 km. The deeper layers are hotter and
denser because the temperature and pressure
inside Earth increase with depth.
Depth (km) Temperature Under Oceans (°C) Temperature Under Continents (°C)
InnerCore
Outer Core
Crust 870°C
3700°C
4300°C
7200°C
Mantle
grid paper
Tools
Investigate
What is the relationship between temperature and depth?
The temperature of Earth’s crust increases by about 145°C for every
kilometre below the oceans. The temperature increases by about
21.75°C for every kilometre below the continents.
1. Starting at a temperature of 10°C at the surface of Earth’s crust,
make a table showing the depth and temperature of Earth’s crust
under the ocean and under the continents, at depths between
0 km and 5 km.
2. a) Plot temperature versus depth for your data under the oceans.b) On the same grid, plot temperature versus depth for your
data under the continents.
3. Compare and contrast the two graphs.
4. How do these graphs differ from those you made for direct
variation in Section 5.1?

7/24/2019 IB grade 9 Math book-Chapter5
http://slidepdf.com/reader/full/ib-grade-9-math-book-chapter5 14/58
5. Consider the equation T 145d 10, where T represents the
temperature, in degrees Celsius, under the oceans and d represents
the depth, in kilometres.
a) Substitute d 1 and calculate T . Repeat for d 2, 3, 4, 5.
Compare the results with those you obtained in step 1.
b) Explain why this equation works.
c) Write a similar equation relating the temperature underthe continents with depth.
6. Reflect Describe the parts of each equation and how they
relate to the data in your table and graph.
The graph illustrates the total cost, C , in dollars, of a taxi fare for a
distance, d , in kilometres.
The fixed cost of $2 represents the initial meter fare. The distance
travelled by taxi changes, or is variable, depending on the passenger’s
destination. For this reason, the variable cost is $0.50 times the distance.
C 2 0.5d
fixed cost variable cost
The graph is a straight line, but it does not show a direct variation
because the line does not pass through the origin. This type of
relationship is called a . Another way to describe this
partial variation is to say that “C varies partially with d .”
In general, if y varies partially with x , the equation is of the form
y
mx
b, where m and b are constants, and• m represents the constant of variation
• b represents the fixed, or initial, value of y
partial variation
5
6
4
3
2
1
0 1 2 3Distance (km)
Taxi Fare
C o s t ( $ )
4 5 6
C
d
5.2 Partial Variation • MHR 2
a relationship between t
variables in which the
dependent variable is th
sum of a constant numb
and a constant multiple
the independent variabl
partial variation

7/24/2019 IB grade 9 Math book-Chapter5
http://slidepdf.com/reader/full/ib-grade-9-math-book-chapter5 15/58
Example 1 Graph a Partial Variation
a) Copy and complete the table of values
given that y varies partially with x .
b) Identify the initial value of y and the
constant of variation from the completed
table. Write an equation relating y and x
in the form y mx b.
c) Graph this relation.
d) Describe the graph.
Solution
a) As x changes from 0 to 1, y changes from 6 to 9.
Therefore, y increases by 3 as x increases by 1.
b) The initial value of y occurs when x 0. The initial value of y is 6.
As x increases by 1, y increases by 3. So, the constant of variation
is 3.
Use b 6 and m 3 to obtain the equation y 3x 6.
c)
d) The graph is a straight line that intersects the y -axis at the point
(0, 6). The y -values increase by 3 as the x -values increase by 1.
y
15
18
21
24
27
30
12
9
6
3
0 1 2 3 4 5 6 7 8 x
x y
0 6
1 9
2 12
3 15
4 18
7 27
248 MHR • Chapter 5
x y
0 6
1 9
2
3 15
4
27
The pattern of increasingthe y -values by 3 checks
for the other values that
were given.

7/24/2019 IB grade 9 Math book-Chapter5
http://slidepdf.com/reader/full/ib-grade-9-math-book-chapter5 16/58
Example 2 School Awards Banquet
A school is planning an awards banquet. The cost
of renting the banquet facility and hiring serving
staff is $675. There is an additional cost of $12
per person for the meal.
a) Identify the fixed cost and the variable cost
of this partial variation.
b) Write an equation to represent this
relationship.
c) Use your equation to determine the total cost
if 500 people attend the banquet.
Solution
a) The fixed cost is $675. The variable cost is $12 times the number
of people.
b) Let C represent the total cost, in dollars. Let n represent thenumber of people attending.
Multiply the number of people by 12 and add 675.
C 12n 675
c) Substitute n 500.
C 12(500) 675
6675
The total cost for 500 people is $6675.
Key Concepts
A partial variation has an equation of the
form y mx b, where b represents the
fixed, or initial, value of y and m represents
the constant of variation.
The graph of a partial variation is a straight
line that does not pass through the origin.
5.2 Partial Variation • MHR 2
y = mx + b
0
y
x

7/24/2019 IB grade 9 Math book-Chapter5
http://slidepdf.com/reader/full/ib-grade-9-math-book-chapter5 17/58
Communicate Your Understanding
Classify each graph as a direct variation, a partial variation, or
neither. Justify your answer.
a) b) c)
The cost to repair a television set is made up of a service charge of
$50, which covers the travel time and gas for the repairperson, plus
$40/h. Describe the steps involved in developing a partial variation
equation that relates the cost and the time required to complete the
repairs.
The table models a partial variation. Discuss how
you can use the table to find m and b in theequation y mx b.
Practise
1. Identify each relation as a direct variation, a partial variation, or
neither. Justify your answer.
a) y 3x b) y 2x 1
c) C 20n 500 d) d 5t
For help with questions 2 and 3, see Example 1.
2. a) Copy and complete the table of values given
that y varies partially with x .
b) Identify the initial value of y and the constant
of variation from the table.
c) Write an equation relating y and x in the form
y mx b.
d) Graph the relation.
e) Describe the graph.
C3C3
C2C2
C1C1
x y
0 5
1 10
2
3 20
4
40
250 MHR • Chapter 5
x y
0 10
1 14
2 18
3 22
4 26
0
y
x 0
y
x 0
y
x
7/24/2019 IB grade 9 Math book-Chapter5
http://slidepdf.com/reader/full/ib-grade-9-math-book-chapter5 18/58
3. a) Copy and complete the table of values given
that y varies partially with x .
b) Identify the initial value of y and the constant
of variation from the table.
c) Write an equation relating y and x in the form
y mx b.
d) Graph the relation.e) Describe the graph.
For help with questions 4 and 5, see Example 2.
4. A small pizza costs $7.00 plus $1.50 per topping.
a) Identify the fixed cost and the variable cost of this partial
variation.
b) Determine the equation relating the cost, C , in dollars, and the
number of toppings, n.
c) Use the equation to determine the cost of a small pizza with five
toppings.
5. A class is planning a field trip to an art gallery. The cost of renting
a bus is $250. There is an additional cost of $4 per student for the
entrance fee.
a) Identify the fixed cost and the variable cost of this partial
variation.
b) Write an equation relating the cost, C , in dollars, and the number
of students, n.
c) Use your equation to determine the total cost if 25 students
attend.
Connect and Apply
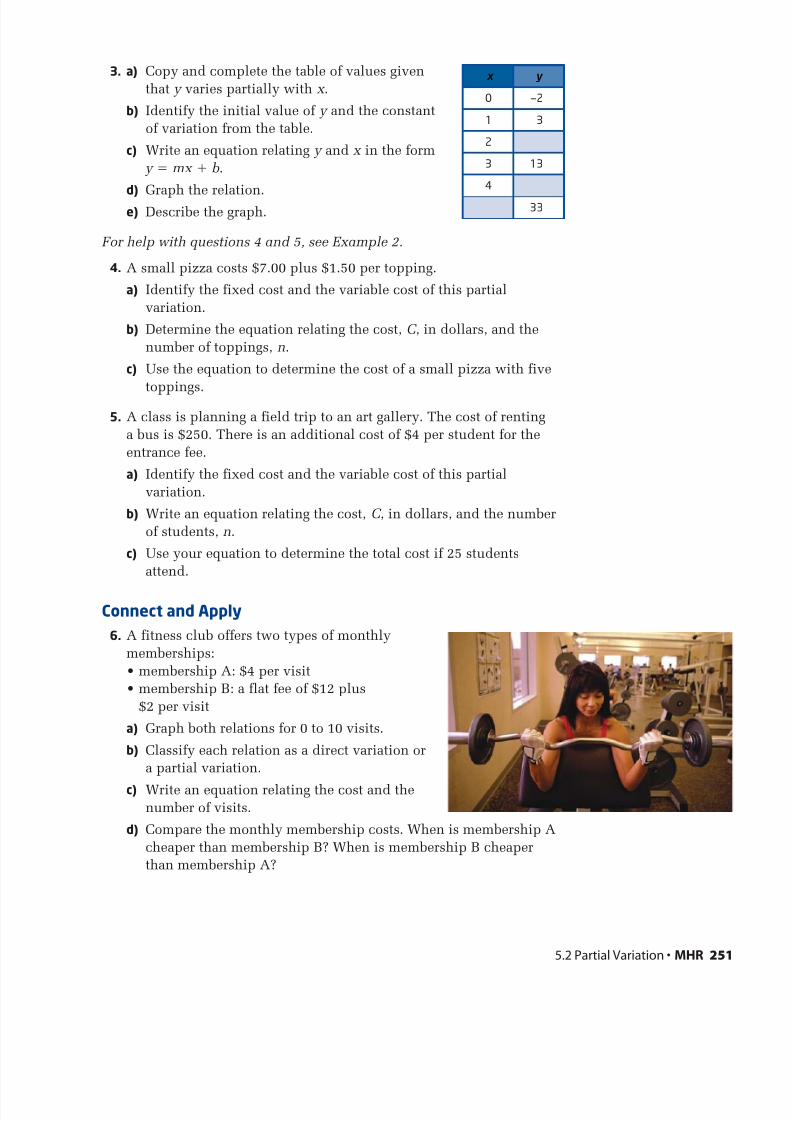
6. A fitness club offers two types of monthly
memberships:
• membership A: $4 per visit
• membership B: a flat fee of $12 plus
$2 per visit
a) Graph both relations for 0 to 10 visits.
b) Classify each relation as a direct variation or
a partial variation.
c) Write an equation relating the cost and thenumber of visits.
d) Compare the monthly membership costs. When is membership A
cheaper than membership B? When is membership B cheaper
than membership A?
5.2 Partial Variation • MHR 2
x y
0 —2
1 3
2
3 13
4
33

7/24/2019 IB grade 9 Math book-Chapter5
http://slidepdf.com/reader/full/ib-grade-9-math-book-chapter5 19/58
7. The table shows the amount a printing company charges for
advertising flyers.
a) Identify the fixed cost this company charges for producing the
flyers. What do you think this amount might represent?
b) Determine the variable cost for producing one flyer. Explain
how you found this.
c) Write an equation representing the price for the flyers.
d) What is the cost to produce 1000 flyers?
e) How many flyers can be produced for $280?
8. Chapter Problem Toothpick patterns are popular puzzles. Here is
an example of a toothpick pattern.
a) Write an equation relating the diagram number and the number
of toothpicks. Is this a partial variation? Explain.
b) Use your equation to determine the number of toothpicks in
Diagram 20.
9. At the surface of a lake, a scuba diver experiences 102.4 kPa(kilopascal) of pressure. As the diver descends, the pressure
increases by 101.3 kPa for every 10 m.
a) Write an equation that relates the pressure experienced by a diver
and the depth that the diver has descended.
b) Divers must be aware of nitrogen narcosis, which occurs when
too much nitrogen dissolves in the blood. Narcosis becomes
possible when the diver is exposed to a pressure of about
400 kPa. At what depth does the danger from narcosis begin?
10. Describe a situation that might lead to
this graph.
Diagram 1 Diagram 2 Diagram 3
252 MHR • Chapter 5
70
C
60
50
40
30
20
10
0 1 2 3Time (h)
C o s t ( $ )
4 5 6 t
Number of Flyers, n Cost, C ($)
0 100
100 120
200 140
300 160
Scuba divers will ascend
slowly to the surface to avoid
decompression sickness, or
the bends. After deep or long
dives, a scuba diver needs to
undergo decompression by
returning to the surface
slowly and in stages.
Did You Know ?

7/24/2019 IB grade 9 Math book-Chapter5
http://slidepdf.com/reader/full/ib-grade-9-math-book-chapter5 20/58
11. At 12:05 P.M., a parachutist was 8000 m above the ground.
At 12:06 P.M., the parachutist was 7750 m above the ground.
At 12:07 P.M., the parachutist was 7500 m above the ground.
a) Graph this relation.
b) Find the average rate of descent, in metres per minute.
c) Write an equation for this relation.
Achievement Check
12. A theatre company produced the musical Cats. The company had
to pay a royalty fee of $1250 plus $325 per performance. The same
theatre company also presented the musical production of Fame in
the same year. For the production of Fame, they had to pay a royalty
fee of $1400 plus $250 per performance.
a) Write an equation that relates the total royalties and the number
of performances for each musical.
b) Graph the two relations on the same grid.
c) When does the company pay the same royalty fee for the twoproductions?
d) Why do you think the creators of these musicals would set
royalties in the form of a partial variation instead of a direct
variation?
Extend
13. In Earth’s atmosphere, the speed of sound can be
approximated using partial variation. The speed of
sound is approximately 331 m/s at 0°C and
approximately 343 m/s at 20°C.a) What is the approximate speed of sound at
i) 30°C? ii) 30°C?
b) Jenny yells out “Hello” in a canyon when the air
temperature is 10°C. It takes 1.4 s to hear her
echo. How far away is the wall of the canyon?
14. A battery was recharged, remained fully charged, and
then slowly lost its charge, as shown in the table.
a) Graph the battery’s charge over time.
b) Determine an appropriate set of equations for the
charge of the battery.
c) What was the remaining charge after
i) 12 h? ii) 26 h? iii) 71 h?
5.2 Partial Variation • MHR 2
Time (h) 0 5 10 15 20 25 30 35 40 45 50 55 60
Charge (%) 92 94 96 98 100 100 100 100 95 90 85 80 75
7/24/2019 IB grade 9 Math book-Chapter5
http://slidepdf.com/reader/full/ib-grade-9-math-book-chapter5 21/58254 MHR • Chapter 5
5.3
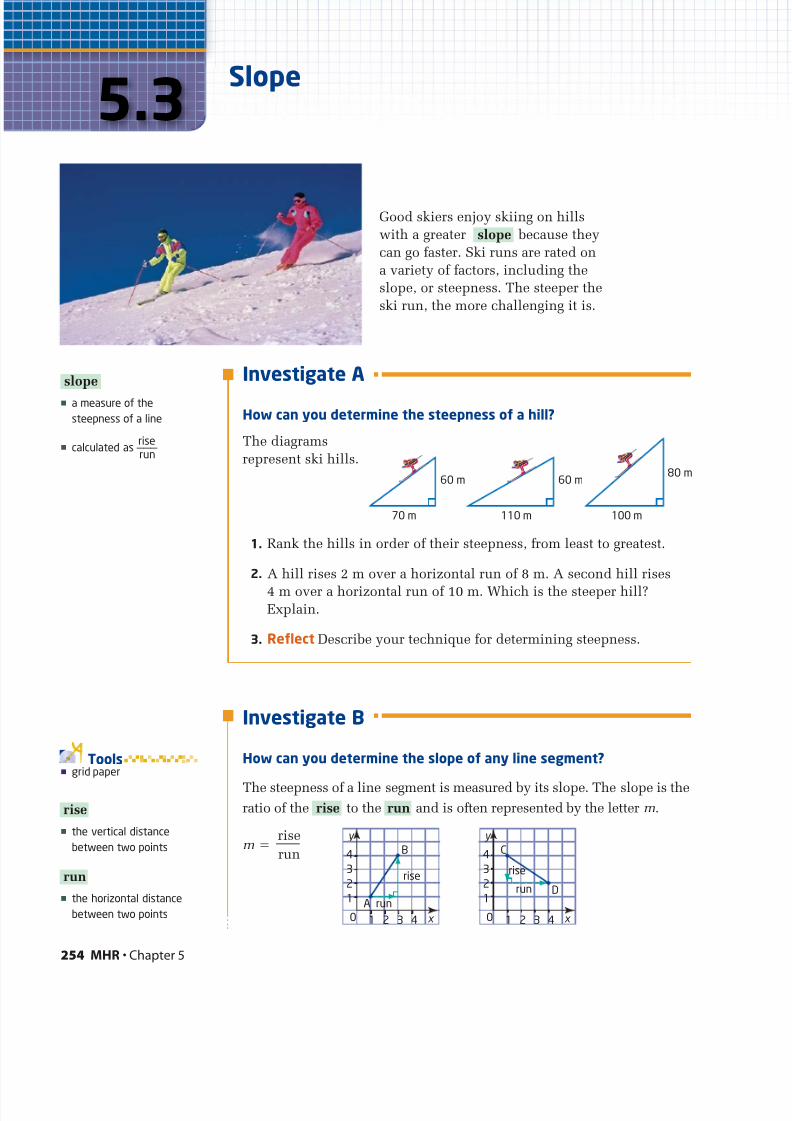
Good skiers enjoy skiing on hills
with a greater because they
can go faster. Ski runs are rated on
a variety of factors, including the
slope, or steepness. The steeper the
ski run, the more challenging it is.
slope
Slope
the vertical distance
between two points
the horizontal distance
between two points
run
rise
grid paperTools
Investigate A
How can you determine the steepness of a hill?
The diagrams
represent ski hills.
1. Rank the hills in order of their steepness, from least to greatest.
2. A hill rises 2 m over a horizontal run of 8 m. A second hill rises
4 m over a horizontal run of 10 m. Which is the steeper hill?Explain.
3. Reflect Describe your technique for determining steepness.
Investigate B
How can you determine the slope of any line segment?
The steepness of a line segment is measured by its slope. The slope is theratio of the to the and is often represented by the letter m.
m rise
run
runrise
60 m60 m
70 m 110 m 100 m
80 m
4
A
B
rise
run
y
x
3
2
1
0 1 2 3 4
4
rise
C
Drun
y
x
3
2
1
0 1 2 3 4
a measure of the
steepness of a line
calculated as———run
rise
slope

7/24/2019 IB grade 9 Math book-Chapter5
http://slidepdf.com/reader/full/ib-grade-9-math-book-chapter5 22/58
When you are looking at a graph on a Cartesian grid, read from left
to right. A line segment rising from left to right has a positive slope.
A line segment falling from left to right has a negative slope.
1. Consider the graph of line segment AB.
a) Is the slope positive or negative? Explain how you know.
b) Determine the rise and run by counting grid units.
c) Determine the slope of the line segment AB using m .
2. Consider the graph of line segment CD.
a) Is the slope positive or negative? Explain how you know.
b) Determine the rise and run by counting of grid units.
c) Determine the slope of the line segment CD using m .
3. a) On a piece of grid paper, set up coordinate axes. Plot the points
A(1, 1) and D(5, 1). Join the points to form line segment AD.
b) Determine the rise and the run.
c) Describe what happens when you calculate the slope of ahorizontal line segment.
4. a) On the same set of axes, plot the point E(1, 5). Join points to
form line segment AE.
b) Determine the rise and the run.
c) Do you think it is possible to calculate the slope of a vertical
line segment? Justify your answer.
5. Reflect Describe how you can find the slope of any line segment.
Example 1 Slope of a Loading Dock
The ramp at a loading dock rises 2.50 m over a run of 4.00 m.
a) Calculate the slope of the ramp.
b) Explain the meaning of the slope.
Solution
a) m
0.625
The slope of the ramp is 0.625.
b) The ramp rises 0.625 m vertically for every 1 m run horizontally.
2.50
4.00
rise
run
rise
run
riserun
5.3 Slope • MHR 2
4.00 m
2.50 m 50 m
2.50 m
7/24/2019 IB grade 9 Math book-Chapter5
http://slidepdf.com/reader/full/ib-grade-9-math-book-chapter5 23/58
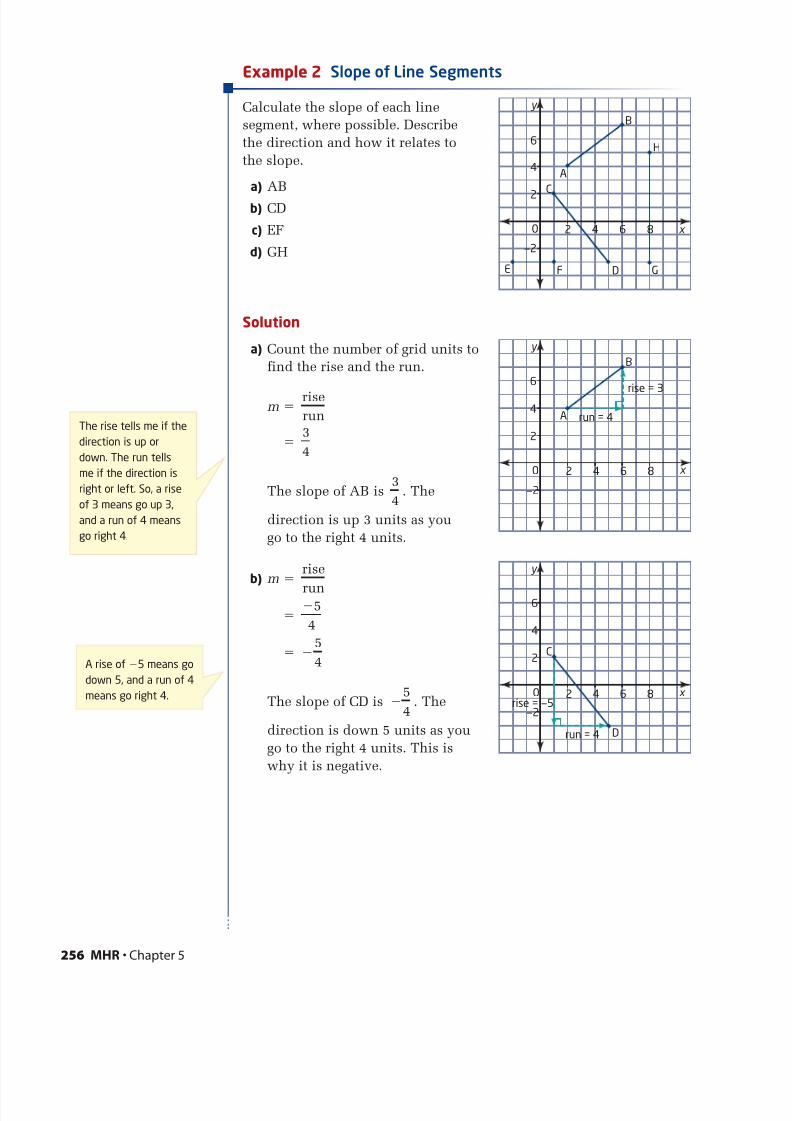
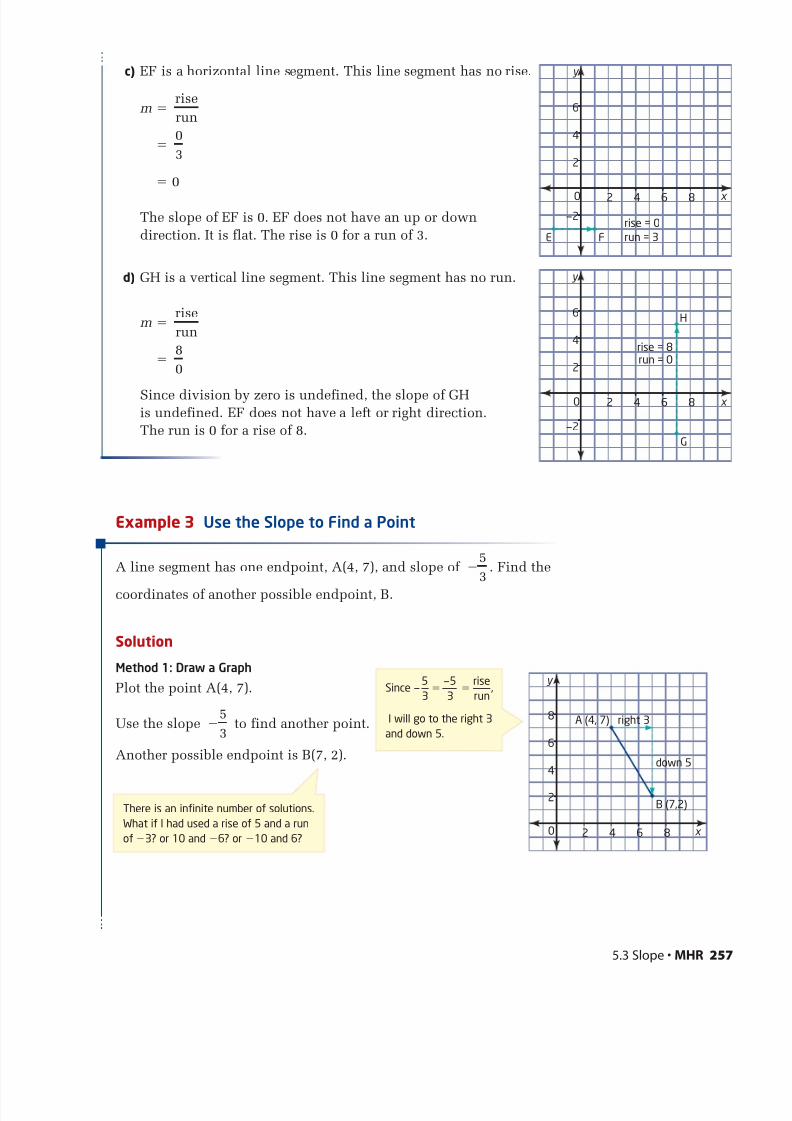
Example 2 Slope of Line Segments
Calculate the slope of each line
segment, where possible. Describe
the direction and how it relates to
the slope.
a) AB
b) CD
c) EF
d) GH
Solution
a) Count the number of grid units to
find the rise and the run.
m
The slope of AB is . The
direction is up 3 units as you
go to the right 4 units.
b) m
The slope of CD is . The
direction is down 5 units as you
go to the right 4 units. This is
why it is negative.
˛̨
5
4
˛̨
5
4
5
4
rise
run
3
4
3
4
riserun
256 MHR • Chapter 5
A
B
H
GD
C
FE
6
4
2
—2
2 4 6
y
x 0 8
A
B
6
4
2
—2
2 4 6 8
y
x 0
run = 4
rise = 3
The rise tells me if the
direction is up or
down. The run tells
me if the direction is
right or left. So, a rise
of 3 means go up 3,
and a run of 4 means
go right 4.
C
D
6
4
2
—2
2 4 6 8
y
x 0
run = 4
rise = —5
A rise of 5 means go
down 5, and a run of 4
means go right 4.
7/24/2019 IB grade 9 Math book-Chapter5
http://slidepdf.com/reader/full/ib-grade-9-math-book-chapter5 24/58

7/24/2019 IB grade 9 Math book-Chapter5
http://slidepdf.com/reader/full/ib-grade-9-math-book-chapter5 25/58
Method 2: Use the Coordinates
The run is 3 and the rise is 5. Add these
values to the x - and y -coordinates,
respectively, of point A.
(4 3, 7 (5)) (7, 2)
Another possible endpoint is B(7, 2).
Key Concepts
The slope, m, is a measure of the
steepness of a line segment. It is
calculated as m .
A line segment rising from left to
right has a positive slope.
A line segment falling from left to
right has a negative slope.
Communicate Your Understanding
Kelly looked at this line segment
and concluded that the slope hadto be negative because the
coordinates of the points contained
negative numbers. Is her reasoning
correct? Explain.
A ramp rises 2 m over a run of 5 m.
a) How would you change the riseto make the slope steeper?
b) How would you change the run
to make the slope steeper?
C2C2
C1C1
rise
run
258 MHR • Chapter 5
6
4
2
2 4 6 8
y
x 0
rise
run
P (1, —2)
Q (4, —9)
—4
—6
—8
2 4 6 8
—2
y
x 0
2 m
5 m
Selecting ToolsRepresenting
Reasoning and Proving
Communicating
Connecting Reflecting
Problem Solving
A (4, 7)
B (7,2)
6
4
2
2 4 6 8
8
y
x 0

7/24/2019 IB grade 9 Math book-Chapter5
http://slidepdf.com/reader/full/ib-grade-9-math-book-chapter5 26/58
Practise
For help with questions 1 to 3, see Example 1.
1. Determine the slope of each object.
a) b)
2. A section of road is built with a vertical rise of 2.5 m over
a horizontal run of 152 m. Find the slope, to the nearest hundredth.
3. To be safe, a wheelchair ramp needs to have a slope no greater
than 0.08. Does a wheelchair ramp with a vertical rise of 1.4 m
along a horizontal run of 8 m satisfy the safety regulation?
For help with questions 4 and 5, see Example 2.
4. For each line segment,
• count grid units to find the rise
• count grid units to find the run
• determine the slope
a) b)
5. Calculate the slope of each line
segment, where possible.
a) AB
b) CD
c) EF
d) GH
e) IJ
f) KL
C
D
6
5
4
3
2
11 2 3 4 5 6
y
x 0
A
B6
5
4
3
2
11 2 3 4 5 6
y
x 0
4.4 m
3.2 m3 m
5 m
5.3 Slope • MHR 2
6
4
2
—2
—4
—6
2 4
y
x 0—2—4
JG H
C
I
E
F
K
L
A
B
D

7/24/2019 IB grade 9 Math book-Chapter5
http://slidepdf.com/reader/full/ib-grade-9-math-book-chapter5 27/58
For help with questions 6 and 7, see Example 3.
6. A line segment has one endpoint of A(3, 1).
a) Plot the point A on a grid.
b) Use the slope to locate another possible endpoint B.
What are the coordinates of point B?
7. A line segment has one endpoint of A(6, 2) and slope of .
Find the coordinates of another possible endpoint B by adding
the appropriate values to the coordinates of point A.
Connect and Apply
8. For safety reasons, a staircase should have a slope of between
0.58 and 0.70. Determine whether each staircase is within
the safe range.
a) b)
9. Given a point A(2, 5), find the coordinates of a point B so
that the line segment AB has each slope.
a) b) c) 4
d) 3 e) 0 f) undefined
10. A ramp needs to have a slope of .
Determine the length of each vertical brace.
11. Slopes of roads are called grades and are expressed as percents.
a) Calculate the grade of a road that rises 21 m over a run of 500 m.
b) For a road to have a grade of 3%, how far does it have to rise over
a run of 600 m?
3
5
2
3
2
3
24 cm
28 cm
5 m
6 m
3
4
3
2
260 MHR • Chapter 5
1 m 1 m 1 m 1 m
brace
1 m
Saint John, New Brunswick
has the steepest main street
in Canada. King Street has an
8% grade.
Did You Know ?

7/24/2019 IB grade 9 Math book-Chapter5
http://slidepdf.com/reader/full/ib-grade-9-math-book-chapter5 28/58
12. Roofers call the slope of a roof its
pitch. Roofs have different pitch
classifications, which indicate how
safe they are for roofers to walk on.
They are classified as shown in
this table.
a) Classify each roof by its pitch.
i)
ii)
b) A roof is 10 m wide and has a pitch of . Find the height.
13. Two ramps are being built with the same slope.
The first ramp is twice the height of the second ramp. Does the
first ramp have to be twice as long as the second ramp? Explain.
14. A steel beam goes between the tops of two buildings that are 7 m
apart. One building is 41 m tall. The other is 52 m tall. What is the
slope of the beam?
15. For safety reasons, an extension ladder should have a slope of between 6.3 and 9.5 when it is placed against a wall. If a ladder
reaches 8 m up a wall, what are the maximum and
minimum distances from the foot of the ladder to
the wall?
16. The Great Pyramid of Cheops has a height
of about 147 m and a base width of
about 230 m. How does its slope
compare to a standard staircase
with slope 0.7?
5
12
9 m
30 m
3 m
16 m
Classification Pitch
Shallow m ≤3—
12
Medium3—
12< m ≤
6—
12
Steep m >6—
12
5.3 Slope • MHR 2

7/24/2019 IB grade 9 Math book-Chapter5
http://slidepdf.com/reader/full/ib-grade-9-math-book-chapter5 29/58
17. In 1967, Montreal hosted Expo 67, an international fair, to celebrate
Canada’s 100th birthday. Canada’s pavilion was an upside-down
pyramid called Katimavik, which means meeting place in Inuktitut,
the language of the Inuit. The base width is about 55 m and the
height is about 18 m. Calculate the slope of the sides. Compare the
slope of the sides to the slope of the Great Pyramid of Cheops, which
you found in question 16.
Extend
18. A cross-country ski area classifies its courses based on the range
of slopes. If the slopes are less than 0.09, the course is classified as
easy. For slopes between 0.09 and 0.18, the course is intermediate.
For slopes greater than 0.18, the course is difficult. For a ski hill
10 m tall, what range of horizontal runs is appropriate for each
classification?
19. A hiking trail has been cut diagonally along
the side of a hill, as shown. What is the slope
of the trail?
20. A regular hexagon has six sides of equal
length. One is drawn on a grid as
shown. Determine the slope of the line
segment from the centre to the vertex
indicated. Explain your reasoning.
262 MHR • Chapter 5
12 m
30 m
80 m
4
2
—2
—4
2 4 x
y
0—2—4

7/24/2019 IB grade 9 Math book-Chapter5
http://slidepdf.com/reader/full/ib-grade-9-math-book-chapter5 30/58
21. How safe are the stairs around your home? To answer this question,
carry out the following investigation.
a) For different sets of stairs around your home, measure the tread
width and riser height. Try to get measurements for several
sets of stairs. Record your measurements in a table, and compute
the slope for each set of stairs. Draw conclusions about which set
of stairs is the least safe in your home.
b) Collect data from at least five classmates. Construct a scatter plot
of the data, and draw a line of best fit. Analyse your results and
write a report on your findings.
22. Math Contest Railroad trains cannot go up tracks with a grade(slope) greater than 7%. To go over hills steeper than this, the
railroad company builds switchbacks. How many switchbacks are
needed to get to the top of a hill that is 250 m high? Assume that the
maximum length of the run is 1 km. Explain your solution.
23. Math Contest The area of the shaded region is 12 square units.
What is the slope of the line through AB?
A
B
C 4
D
E ˛̨
2
3
2
3
˛̨
3
2
3
2
5.3 Slope • MHR 2
slope 7%
slope 7%
slope 7%
A (—6, 0)
B
y
x
riserheight
treadwidth
The steepest railroad in th
world is in the Blue
Mountains of New South
Wales, Australia.
The maximum gradient is
122%.
Did You Know ?

7/24/2019 IB grade 9 Math book-Chapter5
http://slidepdf.com/reader/full/ib-grade-9-math-book-chapter5 31/58
Investigate
How can you find a rate of change from a graph?
The graph shows the average distance, in metres, that each animal or
person can run in 10 s.
1. What do you think is meant by average distance?
2. Visually compare the steepness of each graph. Determine the slope
of each graph. Rank the slopes from least to greatest.
Time (s)
A v e r a g e D i s t a n c e ( m )
150
100
50
300
350
250
200
2 4 6 8 10 12 14 16
y
x 0
Cheetah (10, 311)
Professional Cyclist (10, 165)
Alligator (10, 155)
Polar Bear (10, 111)
Olympic Sprinter (10, 102)
264 MHR • Chapter 5
5.4Slope as a Rate of Change
Asafa Powell of Jamaica set the men’s 100-m world record in Athens,
Greece, on June 14, 2005. He ran 100 m in 9.77 s. His average speed can
be found by dividing the distance by his time.
Average speed
10.2
Asafa’s average speed was about 10.2 m/s. This means that, on average,
he covered a distance of 10.2 m per second of the race. Speed is an
example of a , because it is a rate that refers to the change
in distance relative to the change in time.
rate of change
100
9.77
a change in one quantity
relative to the change in
another quantity
rate of change

7/24/2019 IB grade 9 Math book-Chapter5
http://slidepdf.com/reader/full/ib-grade-9-math-book-chapter5 32/58
3. Calculate the speed of each animal or person as . Rank
the speeds from least to greatest.
4. Reflect Describe how the rate of change relates to the graph
of a relation.
Example 1 Speed
Sarah is on the soccer team and
runs every morning before school.
One day, she ran 5 km in 20 min.
a) Calculate the rate of change of
Sarah’s distance from her
starting point.
b) Graph Sarah’s distance as it
relates to time.
c) Explain the meaning of the
rate of change and how it
relates to the graph.
Solution
a) The rate of change is the
distance travelled over the elapsed time.
rate of change
0.25
The rate of change is 0.25 km/min.
b)
c) The rate of change is Sarah’s average running speed.
It is also the slope of the graph.
6
5
4
3
2
1
10 20
d
t 0
D
i s t a n c e ( k m )
Time (min)
5
20
change in distance
change in time
distance
time
5.4 Slope as a Rate of Change •MHR 2
7/24/2019 IB grade 9 Math book-Chapter5
http://slidepdf.com/reader/full/ib-grade-9-math-book-chapter5 33/58
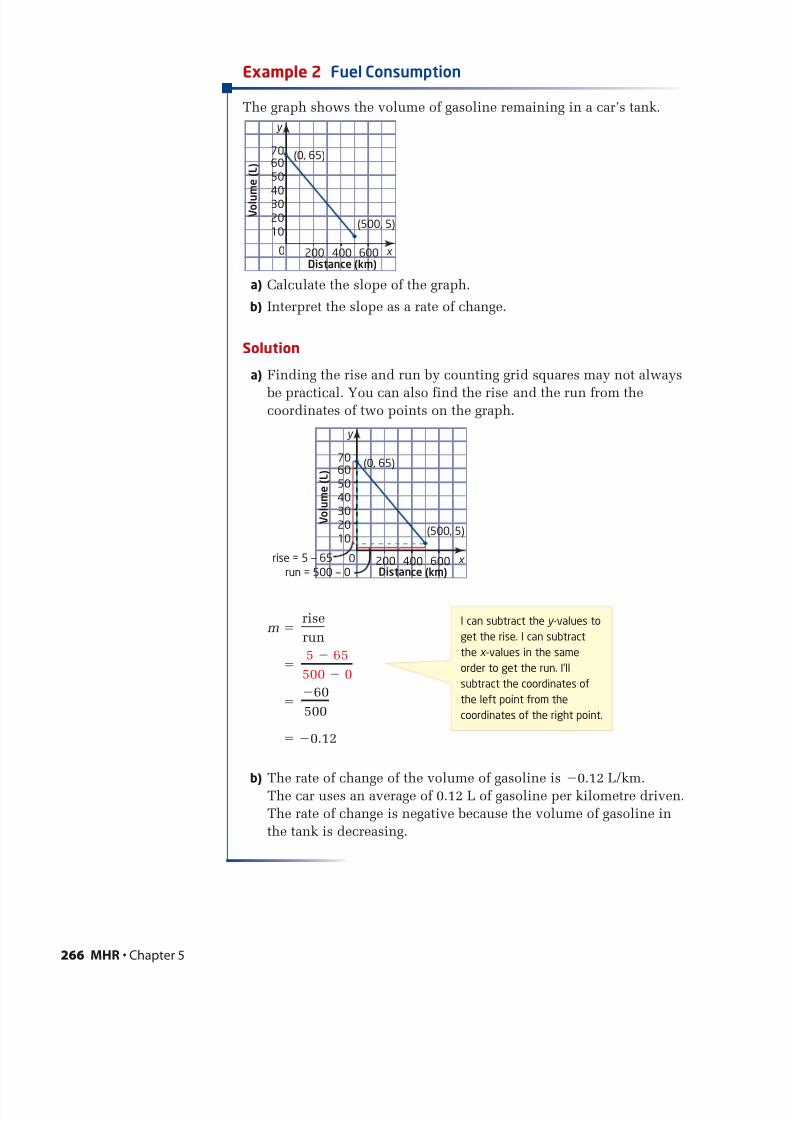
Example 2 Fuel Consumption
The graph shows the volume of gasoline remaining in a car’s tank.
a) Calculate the slope of the graph.
b) Interpret the slope as a rate of change.
Solution
a) Finding the rise and run by counting grid squares may not always
be practical. You can also find the rise and the run from thecoordinates of two points on the graph.
m
0.12
b)The rate of change of the volume of gasoline is
0.12 L/km.The car uses an average of 0.12 L of gasoline per kilometre driven.
The rate of change is negative because the volume of gasoline in
the tank is decreasing.
60
500
5 65
500 0
rise
run
266 MHR • Chapter 5
6070
50
40
30
20
10
200 400 600
y
x 0
(0, 65)
(500, 5)
Distance (km)run = 500 — 0
rise = 5 — 65
V o l u m e ( L )
I can subtract the y -values to
get the rise. I can subtract
the x -values in the same
order to get the run. I’ll
subtract the coordinates of
the left point from the
coordinates of the right point.
6070
50
4030
20
10
200 400 600
y
x 0
(0, 65)
(500, 5)
Distance (km)
V o l u m e ( L )

7/24/2019 IB grade 9 Math book-Chapter5
http://slidepdf.com/reader/full/ib-grade-9-math-book-chapter5 34/58
Key Concepts
Rate of change is the change in one quantity relative to the
change in another.
A rate of change requires units, such as kilometres per hour.
When a relation is graphed, the slope describes the rate of change.
To find the slope of a line segmentjoining two points, subtract the
y -values to get the rise and
subtract the x -values in the same
order to get the run.
Communicate Your Understanding
A car travelled 400 km in 5 h. Ahmed calculated the speed as
80 km/h but, when he graphed the relation, he calculated a slope
of 0.0125. What do you think Ahmed did incorrectly?
When Carlos goes to the gym, he likes to lift weights. The gym has
produced graphs illustrating the weight a person should lift over a
number of visits. Match each graph with the appropriate situation.
a) Begin with a small weight and slowly increase the weightat a constant rate.
b) Begin with a small weight and lift the same weight each visit.
c) Start with a large weight and slowly decrease the weight lifted
each visit.
d) Start with a small weight and rapidly increase the weight
at a constant rate each visit.
C2C2
C1C1
5.4 Slope as a Rate of Change •MHR 2
6
5
4
3
2
1
1 2 3 4 5 6 7 8 9
y
x 0
= 6 — 1= 5
run
= 5 — 2= 3
rise
(6, 5)
(1, 2)
0Number of Visits
W e i g h
t ( k g )
A
0Number of Visit
W e i g h
t ( k g )
B
0Number of Visits
W e i g h t ( k g )
C
0Number of Visit
W e i g h t ( k g )
D
Selecting ToRepresenting
Reasoning and Proving
Communicating
Connecting Reflec
Problem Solving

7/24/2019 IB grade 9 Math book-Chapter5
http://slidepdf.com/reader/full/ib-grade-9-math-book-chapter5 35/58
Practise
For help with questions 1 to 3, see Example 1.
1. The average adult breathes in about 37 L of air every 5 min.
What is the rate of change of volume of air?
2. A teenager’s heart pumps an average of 7200 L of blood every 24 h.
What is the rate of change of volume of blood?
3. A hummingbird can flap its wings an average of 1800 times
every 30 s. What is the rate of change of wing flaps?
For help with questions 4 and 5, see Example 2.
4. The graph shows the height above the ground
of a rock climber over time.
a) Calculate the slope of the graph.
b) Interpret the slope as a rate of change.
5. The graph shows the relationship
between temperature and altitude.
a) Calculate the slope of the graph.
b) Interpret the slope as a rate of
change.
Connect and Apply
6. The price of a loaf of bread increased from $1.45 in 2003 to $1.78 in
2006. What is the average price increase per year?
7. The graph shows the height of a plant
over a 2-month growth period.
Calculate the rate of change per day.
268 MHR • Chapter 5
3035
25
20
15
10
5
200010000
(200, 25)
(2200, 13) T e m p e r a t u r e ( ° C )
Altitude (m)
y
x
12
14
10
8
64
2
20 40 60 800
(61 ,16)
(0, 2)
H e i g h t ( c m )
Time (days)
16
h
t
3025
2015
10
5
4 80
(0, 26)
(8, 0)
Time (s)
H e i g h t ( m )
y
x

7/24/2019 IB grade 9 Math book-Chapter5
http://slidepdf.com/reader/full/ib-grade-9-math-book-chapter5 36/58
8. The table shows the approximate number of downloads of a
freeware program on the Internet over a 2-month period.
a) Graph the data.
b) Calculate the slope and describe it as a rate of change.
c) Do you think this is a popular piece of software? Why or
why not?
9. Chapter Problem
a) Plot a graph relating the number of toothpicks to
the diagram number.
b) Calculate the slope of the line through these points.c) Interpret the slope as a rate of change.
10. From age 12 to 16, girls grow at an average of 8.5 cm/year, while
boys grow at an average of 9.5 cm/year. Helen and John are both
12 years old. Helen is 150 cm tall and John is 146 cm tall. Graph
their heights on the same grid. When can they expect their heights
to be the same?
11. A fire hose can deliver water at a maximum rate of 500 L/min.
a) Plot a graph showing the maximum volume of water that a
fire hose can pour onto a fire in time spans of up to 30 min.b) Suppose two fire hoses are used. How will this affect the slope
of the graph?
12. The table shows the minimum volume of water needed to fight
a typical fire in rooms of various sizes.
a) Graph the data in the table.b) Calculate the rate of change.
c) If a fire truck is pumping water at a rate of 200 L/min, how long
will it take to put out a fire in a room with a floor area of 140 m2?
5.4 Slope as a Rate of Change •MHR 2
Floor Area (m2) Minimum Volume of Water (L)
25 39
50 78
75 117
Date Downloads
Sept 3 52 000
Sept 10 70 000
Sept 17 88 000
Sept 24 106 000
Oct 1 124 000
Oct 8 142 000
Oct 15 160 000
Oct 22 178 000
Oct 29 196 000
Nov 5 214 000
Diagram 1 Diagram 2 Diagram 3
7/24/2019 IB grade 9 Math book-Chapter5
http://slidepdf.com/reader/full/ib-grade-9-math-book-chapter5 37/58
13. A large party balloon is being filled with helium at a constant rate.
After 8 s, there is 2.5 L of helium in the balloon.
a) Graph this relation.
b) The balloon will burst if there is more than 10 L of helium in it.
How long will it take to fill the balloon with that much helium?
Mark this point on your graph.
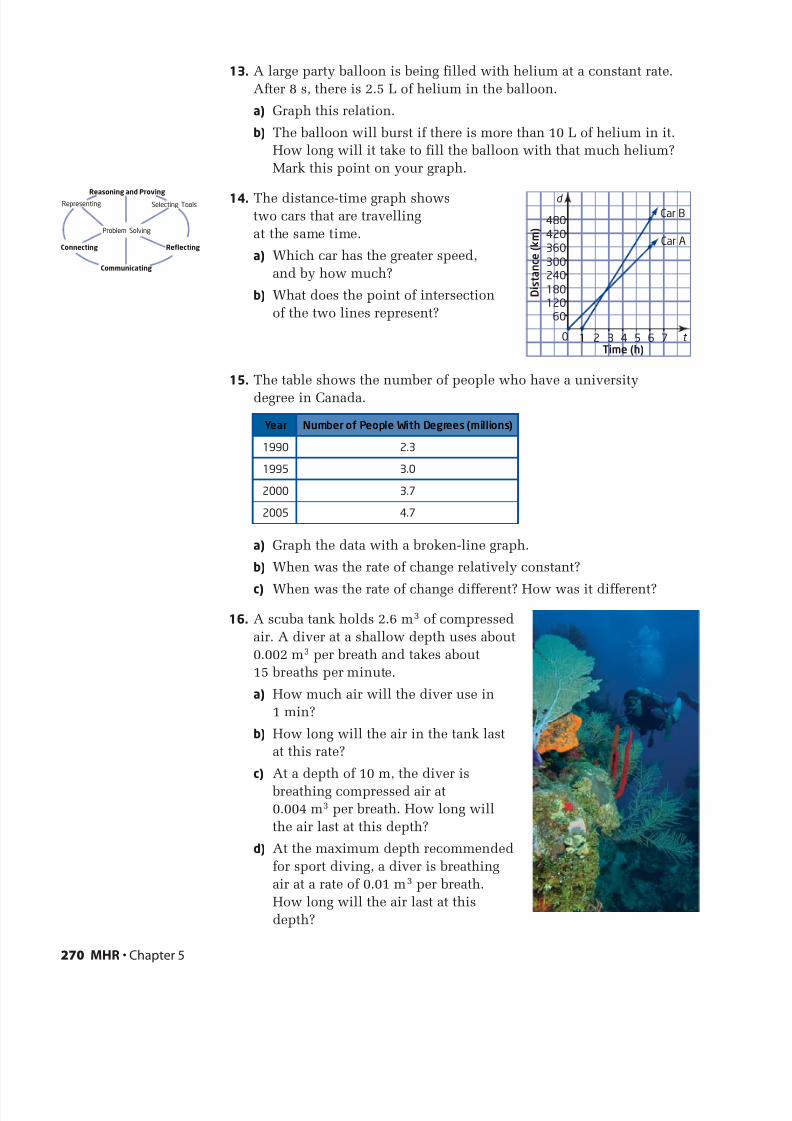
14. The distance-time graph showstwo cars that are travelling
at the same time.
a) Which car has the greater speed,
and by how much?
b) What does the point of intersection
of the two lines represent?
15. The table shows the number of people who have a university
degree in Canada.
a) Graph the data with a broken-line graph.
b) When was the rate of change relatively constant?
c) When was the rate of change different? How was it different?
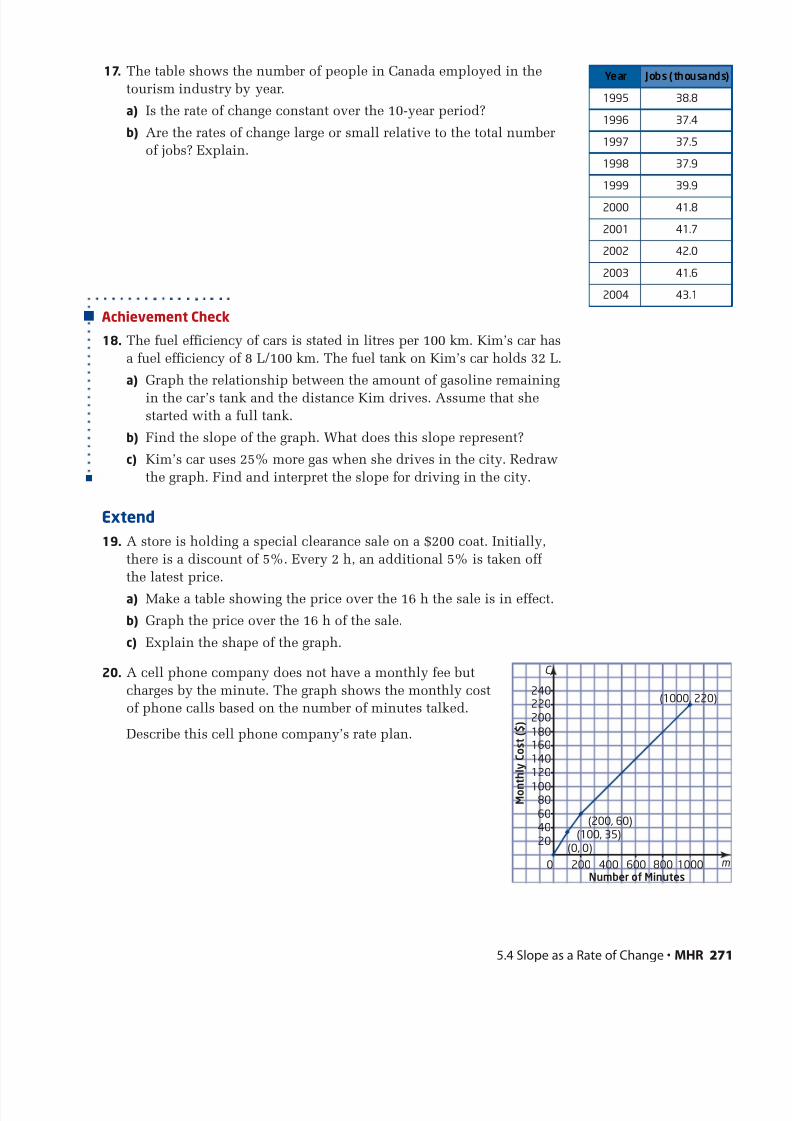
16. A scuba tank holds 2.6 m3 of compressed
air. A diver at a shallow depth uses about
0.002 m3 per breath and takes about
15 breaths per minute.
a) How much air will the diver use in
1 min?
b) How long will the air in the tank last
at this rate?
c) At a depth of 10 m, the diver is
breathing compressed air at0.004 m3 per breath. How long will
the air last at this depth?
d) At the maximum depth recommended
for sport diving, a diver is breathing
air at a rate of 0.01 m3 per breath.
How long will the air last at this
depth?
270 MHR • Chapter 5
Year Number of People With Degrees (millions)
1990 2.3
1995 3.0
2000 3.7
2005 4.7
360
420
480
300240
180120
60
0 21Time (h)
d
t
D i s t a n c e ( k m )
4 5 6 73
Car A
Car BSelecting ToolsRepresenting
Reasoning and Proving
Communicating
Connecting Reflecting
Problem Solving
7/24/2019 IB grade 9 Math book-Chapter5
http://slidepdf.com/reader/full/ib-grade-9-math-book-chapter5 38/58
17. The table shows the number of people in Canada employed in the
tourism industry by year.
a) Is the rate of change constant over the 10-year period?
b) Are the rates of change large or small relative to the total number
of jobs? Explain.
Achievement Check
18. The fuel efficiency of cars is stated in litres per 100 km. Kim’s car has
a fuel efficiency of 8 L/100 km. The fuel tank on Kim’s car holds 32 L.
a) Graph the relationship between the amount of gasoline remaining
in the car’s tank and the distance Kim drives. Assume that shestarted with a full tank.
b) Find the slope of the graph. What does this slope represent?
c) Kim’s car uses 25% more gas when she drives in the city. Redraw
the graph. Find and interpret the slope for driving in the city.
Extend
19. A store is holding a special clearance sale on a $200 coat. Initially,
there is a discount of 5%. Every 2 h, an additional 5% is taken off
the latest price.
a) Make a table showing the price over the 16 h the sale is in effect.
b) Graph the price over the 16 h of the sale.
c) Explain the shape of the graph.
20. A cell phone company does not have a monthly fee but
charges by the minute. The graph shows the monthly cost
of phone calls based on the number of minutes talked.
Describe this cell phone company’s rate plan.
5.4 Slope as a Rate of Change •MHR 2
Year Jobs (thousand
1995 38.8
1996 37.4
1997 37.5
1998 37.9
1999 39.9
2000 41.8
2001 41.7
2002 42.0
2003 41.6
2004 43.1
120
140
160180
200
220240
10080
6040
20
0 200Number of Minutes
M o n t h l y C o s t ( $ )
400 600 800 1000
(1000, 220)
(200, 60)(100, 35)
(0, 0)
C

7/24/2019 IB grade 9 Math book-Chapter5
http://slidepdf.com/reader/full/ib-grade-9-math-book-chapter5 39/58
Investigate
How can you use a table of values to determine if a relation is linear
or non-linear?
Method 1: Use Pencil and Paper
1. Consider the relation y 3x .
a) Copy and complete the table of values.
b) Graph the relation.
c) Classify the relation as linear or non-linear.
2. a) Describe the pattern in the x -values.
b) Add a third column to your table to record the change in y .
Calculate each entry by subtracting consecutive values of y .
The values in the third column are called .
c) What do you notice about the values in the third column?
first differences
272 MHR • Chapter 5
5.5First Differences
Immediately after jumping from an airplane, a skydiverfalls toward Earth with increasing speed. How can you
tell if the speed is increasing linearly or non-linearly over
time?
In Chapter 2: Relations, you learned how to identify
linear and non-linear relations through graphing. In this
section, you will learn how to use tables of values to
identify the type of relation.
x y First Differences
0 0
1 3 3
2
3
4
x y
0 0
1 3
2
3
4
grid paper
Tools
differences between
consecutive y -values intables of values with
evenly spaced x -values
first differences
3 0 3

7/24/2019 IB grade 9 Math book-Chapter5
http://slidepdf.com/reader/full/ib-grade-9-math-book-chapter5 40/58
x y
—4 —10
—1 —5
2 0
5 5
8 10
x y
0 —3
2 —1
4 3
6 9
8 17
x y
0 7
1 3
2 —1
3 —5
4 —9
3. Repeat steps 1 and 2 for each relation using
a table of values with the x -values shown.
a) y 2x 7
b) y x 2
c) y 2x
4. Consider your results for the four relations. Make an observation
regarding linear relations and first differences.
5. Use first differences to determine which of these relations
are linear and which are non-linear.
a) b) c)
6. Reflect Write a rule for using first differences to determine
whether a relation is linear or non-linear.
7. Reflect Describe how you can tell if the equation of a relation
represents a linear relation.
Method 2: Use Technology
1. Create a table of values for y 3x using five values for
x : 0, 1, 2, 3, 4, 5.• To clear all lists, pressn[MEM] to display the MEMORY
menu, select 4:ClrAllLists, and presse.
• To enter the data into the lists, pressqand select 1:Edit. Under
list L1, enter the x -values.
• To generate the y -values, scroll over to list L2, then up to the L2
heading. Type the expression for y , substituting the list L1 for x .
Press 3*n [L1]e.
2. Graph the relation. Is it linear?
• Pressn [STATPLOT] to display the
STAT PLOTS menu. Select 1:Plot1.• Presse to select On.
• For Type:, select line graph.
• Ensure that Xlist: is set to L1 and Ylist: is
set to L2.
• Pressz and select 9:ZoomStat.
x y
0
1
2
3
4
5.5 First Differences • MHR 2
graphing calculator
Tools

7/24/2019 IB grade 9 Math book-Chapter5
http://slidepdf.com/reader/full/ib-grade-9-math-book-chapter5 41/58
x y
—4 —10
—1 —5
2 0
5 5
8 10
x y
0 —3
2 —1
4 3
6 9
8 17
x y
0 7
1 3
2 —1
3 —5
4 —9
3. a) Describe the pattern in the x -values
displayed in list L1.
b) Find the differences between successive
y -values.
• To find the first differences, scroll
over and up to the L3 heading.
• Pressn [LIST] to display the LIST MATH menu.
• From the OPS menu, select 7: ∆ List(.• Then, pressn [L2])e.
c) What do you notice about the values in list L3?
4. Repeat steps 1 to 3 for each relation.
a) y 2x 7
b) y x 2
c) y 2x
5. Consider your results in steps 2 and 3 for the four relations. Make
an observation about linear relations and first differences.
6. Use first differences to determine which of these relations
are linear and which are non-linear.
a) b) c)
7. Reflect Write a rule for using first differences to determine
whether a relation is linear or non-linear.
8. Reflect Describe how you can tell if the equation of a relation
represents a linear relation.
274 MHR • Chapter 5

7/24/2019 IB grade 9 Math book-Chapter5
http://slidepdf.com/reader/full/ib-grade-9-math-book-chapter5 42/58
x y
0 7
1 10
3 16
6 25
x y
0 7
1 10
2 13
3 16
Key Concepts
To work with first differences, the values of x (independent
variable) must change by a constant amount.
To find first differences, subtract consecutive values of y
(dependent variable).
2 0 2
4 2 2
6 4 2
8 6 2
If the first differences of a relation are constant, the relation is linear.
If the first differences of a relation are not constant, the relation is
non-linear.
Communicate Your Understanding
For each table of values, decide whether it is possible to use
first differences to determine whether the relation is linear or
non-linear. Explain your decision.
a) b)
Jacob’s rate of pay is $9.50/h. If you made a table of values of
Jacob’s earnings, how would his hourly wage relate to the first
differences?
Practise
1. Look at each equation. Predict whether it represents a linearrelation or a non-linear relation. Use a graphing calculator to
confirm your answers.
a) y 5x 6 b) y 3x 2
c) y 4x 2 1 d) y 10x
e) y f) y 6
x
4
3x
1
2
C2C2
C1C1
x y First Differences
0 0
1 2 2
2 4 2
3 6 2
4 8 2
5.5 First Differences • MHR 2

7/24/2019 IB grade 9 Math book-Chapter5
http://slidepdf.com/reader/full/ib-grade-9-math-book-chapter5 43/58
x y
—5 8
—3 4
—1 0
1 —4
x y
—1 1
0 0
1 1
2 4
x y
3 —4
4 —1
5 2
6 5
x y
0 5
1 6
2 8
3 12
2. Copy each table and include a third column to record first
differences. Classify each relation as linear or non-linear.
a) b)
c) d)
3. Each table shows the speed of a skydiver before the parachute opens.
Without graphing, determine whether the relation is linear or non-linear.
a) There is no air resistance. b) There is air resistance.
Connect and Apply
4. Use first differences to determine which relations are linear and
which are non-linear. Write an equation representing each linear
relation. Extrapolate the relation to predict the outcome for the
seventh step.
a)
b)
276 MHR • Chapter 5
Time (s) Speed (m/s)
0 0
1 9.6
2 16.6
3 23.1
4 30.8
5 34.2
Time (s) Speed (m/s)
0 0
1 9.8
2 19.6
3 29.4
4 39.2
5 49.0
Number of Houses Number of Segments
1
2
3
4
Base Side Length Total Number of Tiles
1
2
3
4

7/24/2019 IB grade 9 Math book-Chapter5
http://slidepdf.com/reader/full/ib-grade-9-math-book-chapter5 44/58
5. Use first differences to determine which relations are linear and
which are non-linear. Write an equation representing each linear
relation. Extrapolate the relation to predict the outcome for the
seventh step.
a)
b)
6. Chapter Problem A pattern is made from toothpicks as shown.
a) Create a table comparing the diagram number to the number
of toothpicks.
b) Use first differences to show that the pattern is a linear relation.
c) Write an equation for the relation.
d) Extrapolate the relation to predict the outcome for the 10th step.
7. A rectangular piece of cardboard is 16 cm wide. It is dipped in water
and is wet from the bottom up.
a) Create a table comparing the height of the wet cardboard
to its area as the height increases from 0 cm to 10 cm.b) Use first differences to determine whether the relation is linear.
c) What is the area of wet cardboard if the height is 50 cm?
Diagram 1 Diagram 2 Diagram 3
5.5 First Differences • MHR 2
height
16 cm
Number of Sides Number of Diagonals
4
5
6
7
Number of Circles Number of Intersection Points
1
2
3
4

7/24/2019 IB grade 9 Math book-Chapter5
http://slidepdf.com/reader/full/ib-grade-9-math-book-chapter5 45/58
Extend
8. The triangle’s base is twice its height. The
triangle is painted from the bottom up.
a) Create a table comparing the height of the
painted portion to its area as the height
increases.
b) Use first differences to determine whether the relation is linear.
9. A class conducted an experiment to see how high a ball
would bounce from various heights. The results of one
group’s experiment are shown in the table.
Provide two or more pieces of evidence to show whether
this relationship is linear or non-linear.
10. The first few figures in a pattern are shown.
a) Copy and complete the table.
b) Use Technology A graphing calculator can be used to compute
first differences. Follow the steps below.
• Enter the values from column 1 (Figure Number) in list L1.
• Enter the values from column 2 (Number of Circles in Pattern)in list L2.
• Place the cursor on L3 using the cursor keys.
• Pressn [LIST]. From the OPS menu, select 7: ∆ List(.
Pressn [L2])e.
What information is in L3? Use this information to create a
non-linear equation for this pattern.
Figure 1 Figure 2 Figure 3 Figure 4
278 MHR • Chapter 5
Figure Number Number of Circles in Pattern
1 1
2 3
3
4
5
6
7
8
Drop Height (cm) 50 100 150 200 250 300
Bounce Height (cm) 41 82 125 166 208 254
b
h

7/24/2019 IB grade 9 Math book-Chapter5
http://slidepdf.com/reader/full/ib-grade-9-math-book-chapter5 46/585.6 Connecting Variation, Slope, and First Differences •MHR 2
5.6Connecting Variation, Slope, andFirst Differences
You have learned to identify a linear relation from its
graph, equation, and table of values. For example, from
the graph of a linear relation, you can tell if it is a direct
variation or a partial variation and calculate its slope.
In addition, you can identify a linear relation from its
table of values by calculating first differences.
Consider the distance travelled by a snail over time.
Is the graph of this relationship linear? How could
you find the slope?
In this section, you will learn how variation, slope,
and first differences are connected.
Time, t (min) Height, h (m)
0 —3
3 1
6 5
9 9
12 13
Investigate
How are variation, slope, and first differences connected?
The table shows the height, compared to the ground, of a
snail as it crawls up a pipe.
1. Graph the relation. Is this a direct variation or a partial variation?
2. Describe the pattern in the t -values. Use first differences to
confirm that the relation is linear.
3. Calculate the slope.
4. How does the slope relate to the first differences and the
pattern in the t -values?
5. What is the initial value of the height?
6. Write an equation of the line.
7. Reflect Describe how first differences, slope, and partial
variation are related.
grid paper
Tools

7/24/2019 IB grade 9 Math book-Chapter5
http://slidepdf.com/reader/full/ib-grade-9-math-book-chapter5 47/58
The slope of a linear relation remains constant. The first differences
also remain constant when the changes in the x -values are constant.
The slope, m, of a line can be calculated by dividing the change in
y by the change in x .
m
The equation of a line has the form y mx b, where m represents
the slope and b represents the vertical intercept, or the value of the
dependent variable where the line intersects the vertical axis.
Example 1 Fuel Consumption
The graph shows the relationship between the volume of gasolineremaining in a car’s fuel tank and the distance driven.
a) Calculate the slope and describe its meaning.b) Determine the vertical intercept.
c) Write an equation for this relation.
y 2 y 1
x 2 x 1
change in y
change in x
rise
run
280 MHR • Chapter 5
This is sometimes abbreviated as ∆ y— ∆ x
, which is read as
“delta y over delta x.” The Greek letter delta is the symbol
for change in.
6
7
5
4
3
2
1
0 21 3 4 5 6 7 8 9
(x 2, y
2)
(x 1, y
1)
runx 2 — x 1
risey
2 — y
1
y
x
78
91
65
52
3926
13
0 200 400 d
V
Distance (km)
V o l u m e ( L )

7/24/2019 IB grade 9 Math book-Chapter5
http://slidepdf.com/reader/full/ib-grade-9-math-book-chapter5 48/585.6 Connecting Variation, Slope, and First Differences •MHR 2
Solution
a) Use the first two points on the line to calculate the slope.
Use (x 1, y 1) (0, 65) and (x 2, y 2) (100, 52).
m
The rate of change of the volume of fuel in the tank is L/km.
The car uses an average of 13 L of gasoline per 100 km driven.
This is a negative quantity because the volume of gasoline is
decreasing.
b) The vertical intercept is the value of V when d 0.
From the graph, V 65 when d 0. Therefore, b 65.
c) This is a partial variation, so its equation has the form
V md b. The equation of this relation is V .
Example 2 Slope and the Constant of Variation
Make a table of values and graph the relation y 2x 5.
Draw a right triangle on your graph to find the slope.
Solution
m
2
2
1
rise
run
13
100d 65
13
100
13
100
13
100
52 65
100 0
y 2 y 1
x 2 x 1
Since the slope of
a linear relation is
constant, I can use
any pair of points
and the slope will
be the same.
x y
1 —3
2 —1
3 1
4 3
4
2
—2
0 2 4run = 1
rise = 2
x
y
The slope is the same as
the constant of variation in
the equation y 2x 5.
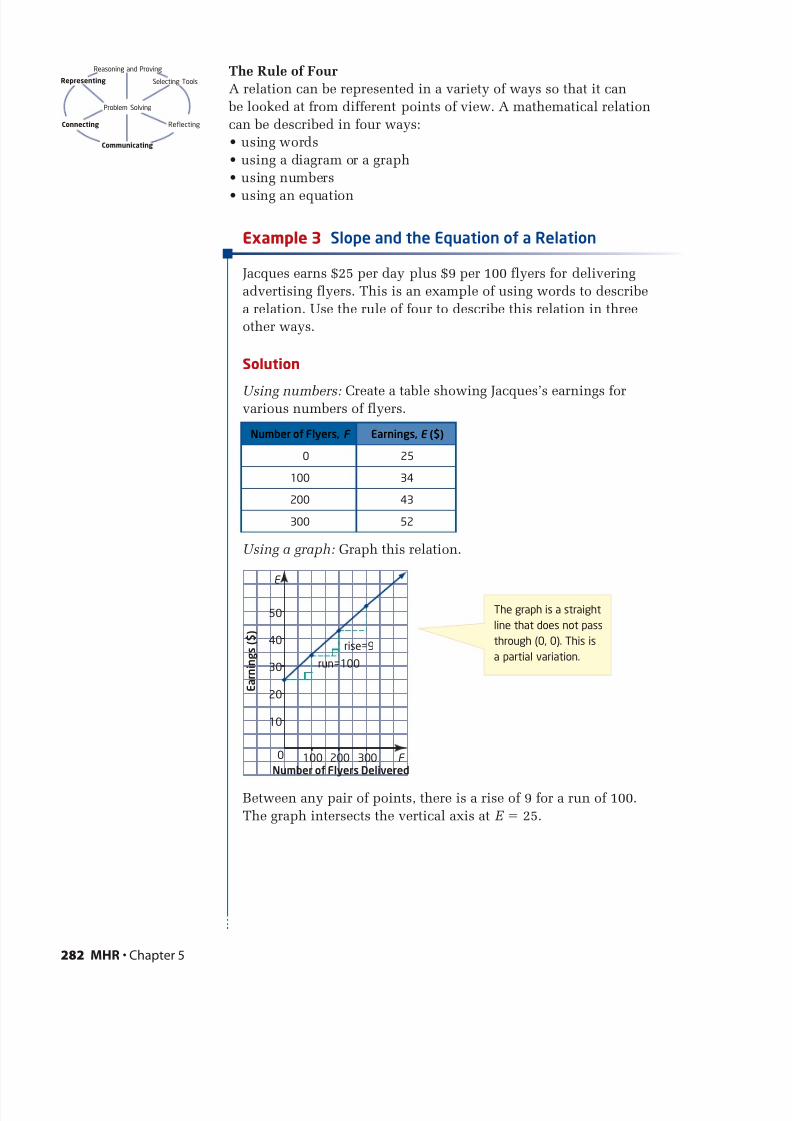
7/24/2019 IB grade 9 Math book-Chapter5
http://slidepdf.com/reader/full/ib-grade-9-math-book-chapter5 49/58
The Rule of Four
A relation can be represented in a variety of ways so that it can
be looked at from different points of view. A mathematical relation
can be described in four ways:
• using words
• using a diagram or a graph
• using numbers
• using an equation
Example 3 Slope and the Equation of a Relation
Jacques earns $25 per day plus $9 per 100 flyers for delivering
advertising flyers. This is an example of using words to describe
a relation. Use the rule of four to describe this relation in three
other ways.
Solution
Using numbers: Create a table showing Jacques’s earnings forvarious numbers of flyers.
Using a graph: Graph this relation.
Between any pair of points, there is a rise of 9 for a run of 100.
The graph intersects the vertical axis at E 25.
30
40
50
20
10
0 100Number of Flyers Delivered
E a r n i n g s ( $ )
200 300 F
E
run=100
rise=9
282 MHR • Chapter 5
The graph is a straight
line that does not pass
through (0, 0). This is
a partial variation.
Number of Flyers, F Earnings, E ($)
0 25
100 34
200 43
300 52
Selecting ToolsRepresenting
Reasoning and Proving
Communicating
Connecting Reflecting
Problem Solving

7/24/2019 IB grade 9 Math book-Chapter5
http://slidepdf.com/reader/full/ib-grade-9-math-book-chapter5 50/585.6 Connecting Variation, Slope, and First Differences •MHR 2
Looking at the table, the
F -values change by a
constant amount of 100
and the E -values change
by a constant amount of 9
change in E m ————
change in F
9—100
The initial value of E is 25
Using an equation:
The relation is linear with m and an initial value of 25.
This is a partial variation. The equation representing this relation is
E , where E is Jacques’s earnings, in dollars, and F is
the number of flyers delivered. The slope represents Jacques’s rateof pay in relation to the number of flyers delivered.
Key Concepts
Finite differences and the pattern in the x -values can be used
to find the slope of a linear relation.
The constant of variation is also the slope of a linear relation.
A constant, or average, rate of change can be interpreted asthe slope of a relation.
Slope can be symbolized as m ,
where represents change in, or
m .
A line has an equation of the form y mx b, where m
represents the slope and b represents the vertical intercept.
The Rule of Four can be used to represent a relation in four ways:
using words
using a diagram or a graph
using numbers
using an equation
y 2 y 1
x 2 x 1
¢ y
¢x
9
100F 25
9
100
6
7
5
4
3
2
1
0 21 3 4 5 6 7 8 9
(x 2, y
2)
(x 1, y
1)
runx
2 — x
1
risey
2 — y
1
y
x

7/24/2019 IB grade 9 Math book-Chapter5
http://slidepdf.com/reader/full/ib-grade-9-math-book-chapter5 51/58
Communicate Your Understanding
The constant of variation and the slope of a relation are
the same. Explain why this is true.
Describe the different ways you can find the slope of a
linear relation.
How can you find the slope of this
line? Explain.
Practise
For help with questions 1 and 2, see Example 1.
1. a) Calculate the slope.
b) Determine the vertical intercept.
c) Write an equation for the relation.
2. a) Calculate the slope.
b) Determine the vertical intercept.
c) Write an equation for the relation.
C3C3
C2C2
C1C1
284 MHR • Chapter 5
8
10
12
14
64
(—2, 1)
(0, 6)
(2, 11)
(4, 16)
2
0 2—2 4 x
y
4
6
2
(—3, —5)
(0, —1)
(3, 3)
(6, 7)
—2
—4
0 2—2—4 4 6
y
x
0
4
6
8
10
12
2
2
2—2 4 6
12
3
8
8
x
y

7/24/2019 IB grade 9 Math book-Chapter5
http://slidepdf.com/reader/full/ib-grade-9-math-book-chapter5 52/585.6 Connecting Variation, Slope, and First Differences •MHR 2
For help with question 3, see Example 2.
3. Make a table of values and graph each relation. Draw a right
triangle on your graph to find the slope.
a) y 2x 1 b) y 3x 4
c) y d) y 0.5x 0.2
For help with questions 4 to 6, see Example 3.
4. Use the rule of four to represent this relation in
three other ways.
a) Use a graph.
b) Use words.
c) Use an equation.
5. Use the rule of four to represent this relation in
three other ways.a) Use a graph.
b) Use words.
c) Use an equation.
6. A house painter charges $400 plus $200 per room to paint
the interior of a house. Represent the relation using numbers,
a graph, and an equation.
Connect and Apply
7. The cost of a taxi ride is $5.00 plus $0.75 for every 0.5 km.
a) Graph this relation.
b) Identify the slope and the vertical intercept of the line.
What do they represent?
c) Is this a direct or a partial variation? Explain.
d) Write an equation relating the cost and the distance travelled.
8. The table shows how the depth of a scuba
diver changes with time. Complete the ruleof four for the relation by representing it
using words, a graph, and an equation.
3
2x
Time (s) Depth (m)
0 —50
5 —45
10 —40
15 —35
20 —30
x y
—6 1
—4 6
—2 11
0 16
2 21
x y
0 2
1 5
2 8
3 11
4 14

7/24/2019 IB grade 9 Math book-Chapter5
http://slidepdf.com/reader/full/ib-grade-9-math-book-chapter5 53/58286 MHR • Chapter 5
9. y varies directly with x . When x 4, y 9.
a) Find the slope and the vertical intercept of the line.
b) Write an equation for this relation.
c) Graph this relation.
10. y varies partially with x . When x 0, y 5, and when x 6, y 8.
a) Find the slope and the vertical intercept of the line.b) Write an equation for this relation.
c) Graph this relation.
11. Complete the rule of four for this
relation by representing it numerically,
in words, and with an equation.
12. Complete the rule of four for the relation y 4x 3 by
representing it numerically, graphically, and in words.
13. A swimming pool is being drained. The table shows the volume
of water, in kilolitres, remaining after an elapsed time, in minutes.
a) Confirm that this relation is linear.
b) Graph this relation.
c) Find the slope of the graph as both a fraction and a decimal.
Is the slope constant? What does the slope represent?
d) Write an equation for the volume of water in terms of the time.
e) Use your graph or equation to find the volume of water after 60 min.
Time (min) 0 40 120 180
Volume of Water (kL) 50 40 20 5
8
4
—4
—8
0 2—2—4—6 x
y

7/24/2019 IB grade 9 Math book-Chapter5
http://slidepdf.com/reader/full/ib-grade-9-math-book-chapter5 54/585.6 Connecting Variation, Slope, and First Differences •MHR 2
Mass (kg) 0 2 4 6 8
Length (cm) 6.2 9.6 13.0 16.4 19.8
Achievement Check
14. A company tests the heavy-duty elastic bands it makes by measuring
how much they stretch when supporting various masses. This table
shows the results of tests on one of the elastic bands.
a) Graph the relation between mass and length.
b) What does the point (0, 6.2) represent?
c) Find the slope of the graph. Is it constant? What does it represent?
d) Write an equation for the length in terms of the mass.
e) Predict how long the elastic band will be when it is supporting
a 10-kg mass.
f) If the length for an 8-kg mass were 19.0 cm, how would the
answer to part e) change?
Extend15. This table shows the recommended
dosage for a particular drug, based
on the patient’s mass.
a) Write an equation relating the dosage and the mass of the patient.
b) The maximum dosage is 110% of the recommended dosage. Write
an equation relating the maximum dosage and the patient’s mass.
c) Graph both relations. Compare the graphs.
16. A salesperson’s monthly sales and
pay for a 4-month period are
shown in the table. Determine
the salesperson’s base salary and
percent commission on sales.
Describe any assumptions you
had to make.
Mass (kg) Dosage (mg)
40 30
50 35
60 40
70 45
80 50
90 55
100 60
110 65
120 70
Sales ($) Salary ($)
15 000 1300
28 000 1560
34 000 1680
17 500 1350

7/24/2019 IB grade 9 Math book-Chapter5
http://slidepdf.com/reader/full/ib-grade-9-math-book-chapter5 55/58288 MHR • Chapter 5
Chapter 5 Review
5.1 Direct Variation, pages 238—245
1. Christina works part-time at a flower shop.
She earns $9/h. Her pay varies directly with
the time, in hours, she works.a) Choose appropriate letters for variables.
Make a table of values showing
Christina’s pay for 0 h, 1 h, 2 h, and 3 h.
b) Graph the relationship.
c) Write an equation in the form y kx .
2. The Jung family travels 300 km to a relative’s
home. The distance, d , in kilometres, varies
directly with the time, t , in hours.
a) Find an equation relating d and t if
d 144 when t 1.5. What does the
constant of variation represent?
b) Use the equation to determine how long
it will take the Jungs to reach their
destination.
3. The volume of soup varies directly with the
volume of water used to prepare it. John
uses 2.5 L of water to make 3.0 L of soup.
a) Explain why this relation is a direct
variation.b) Graph this relation.
c) What will happen to the graph if John
uses 2.8 L of water to make 3.0 L of soup?
5.2 Partial Variation, pages 246—253
4. a) Copy and complete the
table of values, given
that y varies partially
with x .
b) Identify the initial valueof y and the constant of
variation from the table.
c) Write an equation
relating y and x in the
form y mx b.
d) Graph the relation. Describe the graph.
5. Identify each relation as a direct variation,
a partial variation, or neither. Justify your
answer.
a) y x 2 5 b) A 3d 2c) C 2.5m d) y 8x 1
6. A new restaurant is having advertising
flyers printed. The cost to design and lay
out the flyer is $500. There is an additional
cost of $0.15 per flyer printed.
a) Identify the fixed cost and the variable
cost of this partial variation.
b) Write an equation representing this
relationship.
c) Use your equation to determine the
total cost of 500 flyers.
5.3 Slope, pages 254—263
7. Determine the slope of each object.
a)
b)
8. Calculate the
slope of each
line segment.
a) AB
b) CD
c) EF
45 m
32 m
0.26 m
2.0 m
x y
0 4
1 7
2
3 13
4
25
4
2 A
B
EC
D
F—2
0 2—2 4
6
y
x

7/24/2019 IB grade 9 Math book-Chapter5
http://slidepdf.com/reader/full/ib-grade-9-math-book-chapter5 56/58
t d
—1 21
0 13
1 9
2 7
3 6
x y
0 4
1 11
2 18
3 25
4 32
Chapter 5 Review • MHR 2
9. a) Draw an example of a line segment with
an endpoint (3, 5) and a slope of 0.
b) Draw an example of a line segment
with an endpoint (4, 1) and anundefined slope.
10. A ladder reaches 2 m up a wall. The foot of
the ladder is 0.4 m from the wall. For safety
reasons, the slope should be between 6.3
and 9.5. Is this ladder within the safe range?
5.4 Slope as a Rate of Change,
pages 264—271
11.The graph shows the average amount of food energy used by a 50-kg person while
taking part in various activities.
Describe the slope of each activity as
a rate of change.
12. The hair on your head grows at a constant
rate. The longest strands of Samira’s hairwere 45 cm long on her 12th birthday. She
decided not to cut her hair for 5 years and
the longest strands grew to 106 cm. Graph
the length of Samira’s hair over the 5-year
period. What is the slope of the graph?
Express it as a rate of change.
5.5 First Differences, pages 272—278
13. Use first differences to determine whether
each relation is linear or non-linear.
a) b)
14. Each tile measures 2 cm by
2 cm. Use first differences
to determine whether the
relationship between the
length of the row of tiles and
its area is linear or non-linear.
5.6 Connecting Variation, Slope, and First
Differences, pages 279—287
15. a) Confirm that this
relation is linear.
b) Calculate the slope.
c) Write an equation
for the relation.
d) Graph the relation.
16. The table shows the mass of propane
fuel remaining in a barbecue tank.
a) Confirm that this relation is linear.b) Graph this relation.
c) Find the slope and the vertical intercep
of the graph. What do they represent?
d) Write an equation for the mass of propa
fuel in terms of the time.
36
48
60
72
84
24
12
0 10Time (min)
E n e r g y ( k J )
20 30 40
walking
swimming
playingbasketball
cycling
E
t
Time (h) 0 1 2 3 4 5
Mass (kg) 9.0 8.6 8.2 7.8 7.4 7.0
x y
0 2
1 5
2 8
3 11
4 14

7/24/2019 IB grade 9 Math book-Chapter5
http://slidepdf.com/reader/full/ib-grade-9-math-book-chapter5 57/58290 MHR • Chapter 5
Multiple Choice
For questions 1 to 5, select the best answer.
1. Which of the following is an example
of a partial variation?
A M
9N B p 3q
C k 9h 7
D y 4x 2
2. The distance travelled by a car in a given
time varies directly with its speed. A car
travelled 150 km in 1.5 h. What is the
constant of variation?
A 100
B 0.01
C 15
D 375
3. What is the slope of this roof?
A 3
B 12
C 0.75
D 0.5
4. Which statement is false?
A The slope of a linear relation also
represents a constant rate of change.
B Slope can be calculated as .
C Non-linear relations have constant first
differences.
D In the equation y mx b, the slope
is represented by m.
5. The cost of gasoline varies directly with the
volume purchased. 50 L of gasoline costs$43.50. Which of the following relates the
cost, C , and the volume of gasoline, G ?
A C = 0.87G + 43.50
B C = 1.15G
C C = 1.15G + 50
D C = 0.87G
Short Response
Show all steps to your solutions
6. a) Calculate the
slope.
b) Determine thevertical
intercept.
c) Write an
equation for
the relation.
7. The time between seeing a lightning flash
and hearing the thunder it creates varies
directly with how far away the lightning is.
The thunder from a lightning flash 685 maway was heard after 2.0 s.
a) Determine an equation relating the
time before hearing the thunder and
the distance from the lightning flash.
b) Graph this relationship.
8. When water freezes, its volume increases,
as shown in the table.
Without graphing, determine whether
the relation is linear or non-linear. Justify
your answer.
9. The price charged to repair a computer
is $60, plus $50/h.
a) Write an equation representing this
relationship.
b) What is the total cost of a repair that
takes 3.5 h?
c) How would the equation change if
the hourly cost changed to $45?
rise
run
Liquid Volume of
Water (L)
Frozen Volume of
Water (L)
5 5.45
10 10.90
15 16.35
20 21.80
Chapter 5 Practice Test
3 m
4 m
4
2
—2
0—2—4
6
x
y
2

7/24/2019 IB grade 9 Math book-Chapter5
http://slidepdf.com/reader/full/ib-grade-9-math-book-chapter5 58/58
Extended Response
Provide complete solutions.
10. This graph shows the cost of producing
1000 copies of a school yearbook as it relates
to the number of pages in the yearbook.
a) Calculate the rate of change. How does
it relate to the graph?
b)Write an equation for this relationship.
c) Describe how the equation and graph
would change if the base cost changed
to $9000.
d) Producing 2000 copies of the yearbook
would increase the cost per page by 8%
with no change in the base cost.
Determine the equation for the cost of
producing 2000 copies of this yearbook
as it relates to the number of pages.
Consider the relationship between the number of closed regions and
the number of toothpicks in the patterns. Decide whether each
toothpick pattern is linear or non-linear. Justify your answer. If the
pattern is linear, state the rate of change and develop an equation for
the relationship. If the pattern is non-linear, describe how to adjust
the diagrams to make a linear pattern, and write an equation to
define the relationship.
Pattern A
Chapter Problem Wrap-Up
p
C
6 000
8 000
10 000
12 000
14 000
16 000
4 000
2 000
0 50 100 150 200
C o s t ( $ )
Number of Pages