iaph/pianc:(sustainability(reporsng(for(ports(/( … · • iaph/pianc:(sustainability ......
TRANSCRIPT

PORTOPIA Sustainability repor6ng First European Port Industry Sustainability Report Michaël Dooms, Indra Vonck,Theo No7eboom, Antonis Michail, Mar; Puig, Rosa Mari Darbra, George Vaggelas, Mychal Langenus
PORTOPIA European Port Performance Conference “Port Industry Performance: Recent Advances”
Lisbon
23 March’16

Wednesday 23 March 16 2
Introduc6on (1)
• IAPH/PIANC: sustainability reporSng for ports / guidance on the individual port level
• What about the industry level as a whole?
• PORTOPIA covers the dimensions of sustainability within its 6 perspecSves

Wednesday 23 March 16 3
Introduc6on (2)
• Need to be7er highlight the value PORTOPIA could create
• SuggesSon to create an addiSonal output, following the “European Port Performance Dashboards” of 2012 and 2013 (following PPRISM)
• No other industry has an integrated performance report

Wednesday 23 March 16 4
Principles
• Provision of general insights and tendencies
• Limited analysis (to-‐the-‐point)
• Accessibility and transparency of sources and data
• NO normaSve or policy statements > neutrality is key – Stakeholders need to make up their own strategies, acSons, viewpoints, etc. based on this

Wednesday 23 March 16 5
Future
• Move towards a more dynamic report (interacSve document? Website? Customizable PDF)
• Expand the number of insights (currently +/-‐ 50)
• Integrate other data sources from other stakeholders (pilots, tugs, terminal operators,…) – Make it a real / inclusive industry performance report
• Repository by providing links to best pracSces, calculaSon tools, as well as promoSng the collaboraSve pladorms and intelligence tools

Wednesday 23 March 16 6
Content
• 6 perspecSves – Market Trends and Structure – Socio-‐Economic – Environment, Health and Safety/Security – LogisScs Chain and OperaSonal Performance – Governance – User PercepSons of Port Quality THIS REPORT ONLY CONTAINS A SELECTION OF INSIGHTS, THE FULL REPORT IS AVAILABLE AT THE ESPO AND PORTOPIA WEBSITE (WWW.ESPO.BE; WWW.PORTOPIA.EU)

Wednesday 23 March 16 7
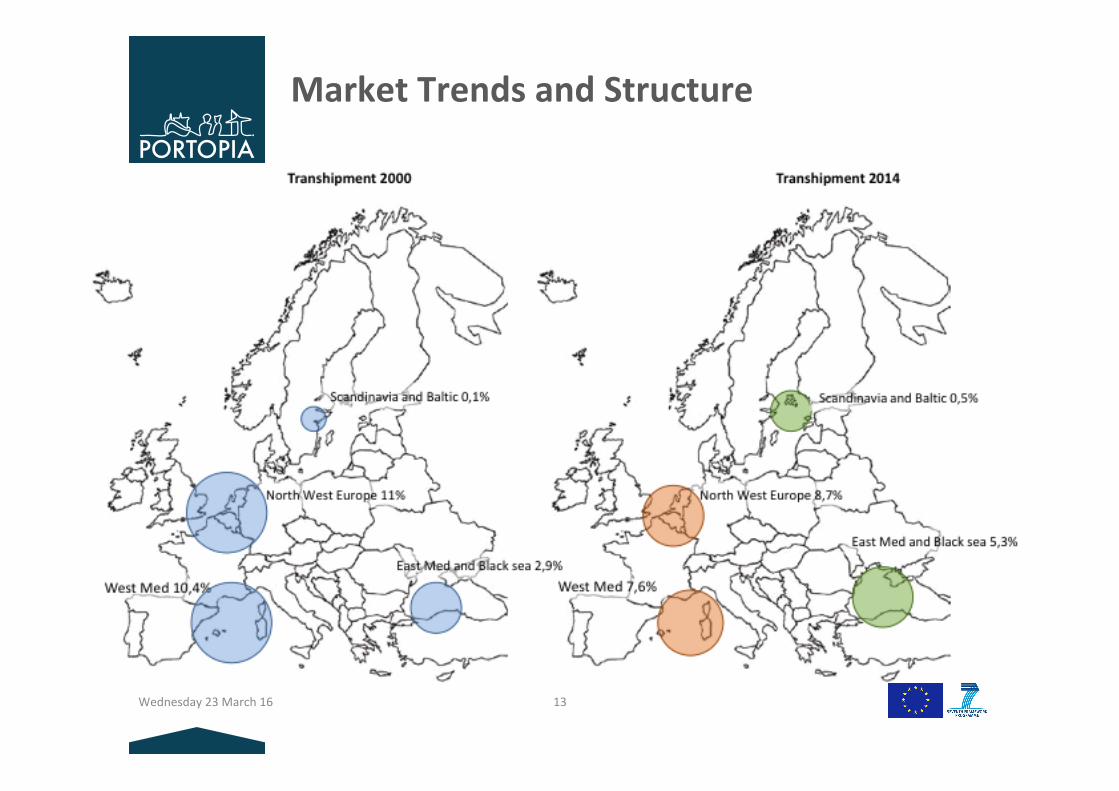
Market Trends and Structure
-‐14%-‐12%-‐10%-‐8%-‐6%-‐4%-‐2%0%2%4%6%8%
2006 2007 2008 2009 2010 2011 2012 2013 2014
GDP growth vs total throughput
GDP growth EU27 Total througput

Wednesday 23 March 16 8
Market Trends and Structure

Wednesday 23 March 16 9
Market Trends and Structure

Wednesday 23 March 16 10
Market Trends and Structure

Wednesday 23 March 16 11
Market Trends and Structure

Wednesday 23 March 16 12
Market Trends and Structure Container line performance
Source: BCG and PORTOPIA analysis
Wednesday 23 March 16 13
Market Trends and Structure

Wednesday 23 March 16 14
Market Trends and Structure

Wednesday 23 March 16 15

Wednesday 23 March 16 16
Socio-‐Economic Indicators
• Severe data availability issues: only ca. 10 ports have annual credible data
• Former extrapolaSons point to approx. 1,1 million FTE direct employment and 2,5 million total employment on the EU level
• Consistent with other studies (OECD, PorSus)

Wednesday 23 March 16 17
Environment, Health, Safety, Security
1. Occupa6onal Health, Safety, and Security (OHSS) Research 2. Environmental Performance 2016
A. Environmental management indicators B. Environmental monitoring indicators C. Top 10 Environmental priori6es
D. Services to shipping
3. EU Dashboard 2016 Conclusions

Wednesday 23 March 16 18
Occupa6onal Health, Safety, and Security (OHSS) Research
Category Indicator Defini6on
Occupa6onal Health
Days Lost The days lost corresponds to the number of full calendar days’ where the vicSm is unfit for work due to an accident at work. The indicator is normalized by dividing it by the Full Time Equivalent value.
Fatal work accidents
This indicator assesses the number of fataliSes due to occupaSonal accidents over a period of Sme. The indicator is normalized by dividing it by the Full Time Equivalent value.
Work related accidents
It assesses the number of work related accidents over a period of Sme. The indicator is normalized by dividing it by the Full Time Equivalent value.
Safety N a u S c a l accidents
This indicator assesses the number of nauScal accidents in port areas over a period of Sme. The indicator is normalized by dividing it by the number of port calls.
Security
Port security incidents
This indicator assesses the number of Port Security Incidents over a period of Sme.
Investment in protecSon
This indicator evaluates the percentage of investment in protecSon divided by the overall investment of the port over a period of Sme.
Wednesday 23 March 16 19
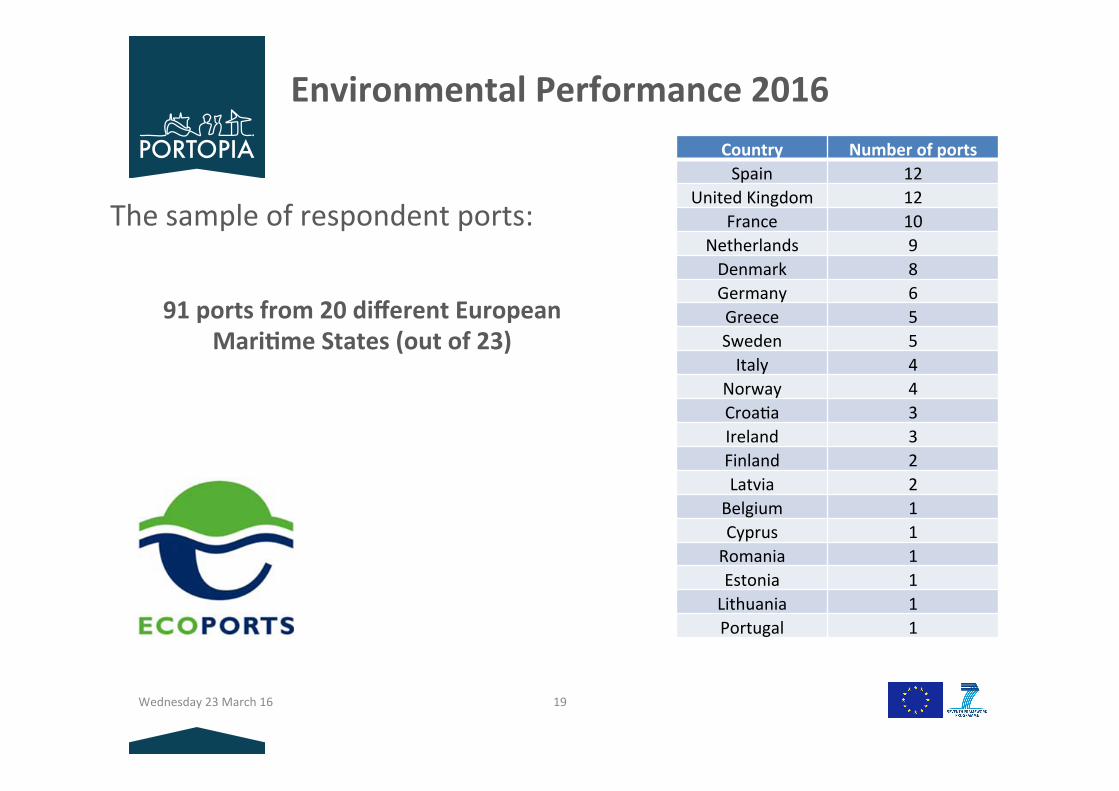
Environmental Performance 2016
The sample of respondent ports:
91 ports from 20 different European
Mari6me States (out of 23)
Country Number of ports Spain 12
United Kingdom 12 France 10
Netherlands 9 Denmark 8 Germany 6 Greece 5 Sweden 5 Italy 4
Norway 4 CroaSa 3 Ireland 3 Finland 2 Latvia 2 Belgium 1 Cyprus 1 Romania 1 Estonia 1 Lithuania 1 Portugal 1

Wednesday 23 March 16 20
Environmental Performance 2016
The sample of respondent ports:
Wednesday 23 March 16 21
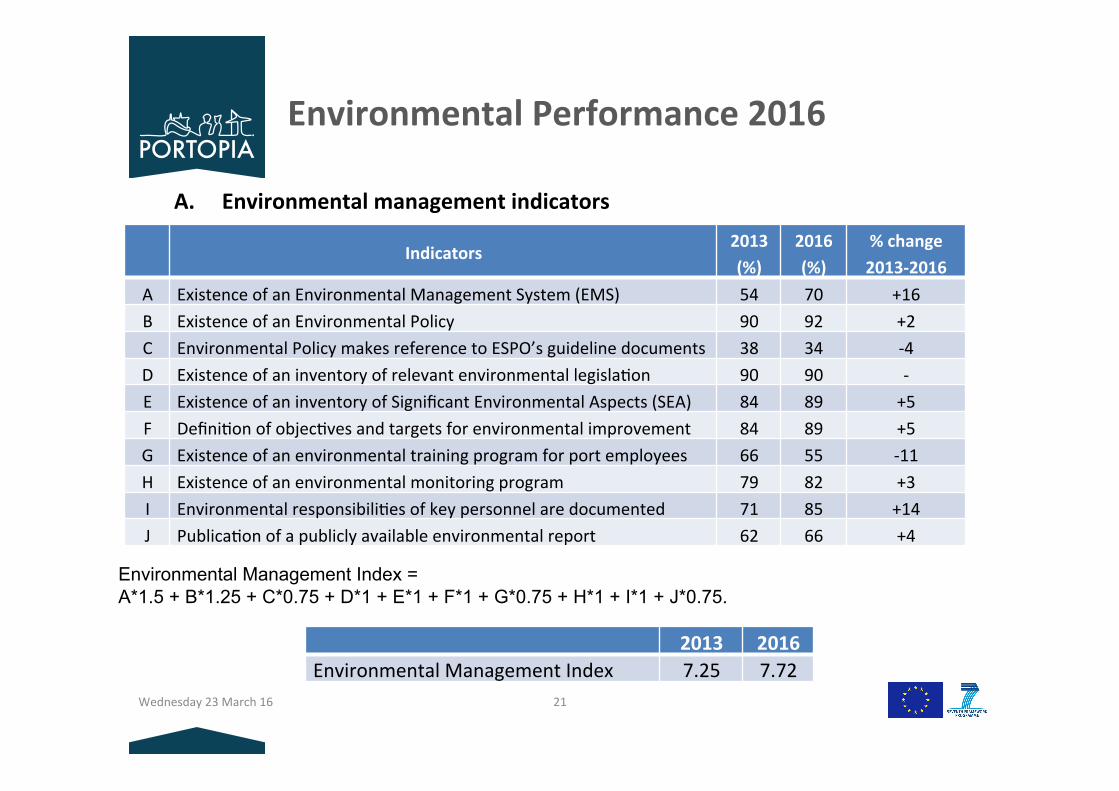
A. Environmental management indicators
Environmental Performance 2016
Indicators 2013 (%)
2016 (%)
% change 2013-‐2016
A Existence of an Environmental Management System (EMS) 54 70 +16 B Existence of an Environmental Policy 90 92 +2 C Environmental Policy makes reference to ESPO’s guideline documents 38 34 -‐4 D Existence of an inventory of relevant environmental legislaSon 90 90 -‐ E Existence of an inventory of Significant Environmental Aspects (SEA) 84 89 +5 F DefiniSon of objecSves and targets for environmental improvement 84 89 +5 G Existence of an environmental training program for port employees 66 55 -‐11 H Existence of an environmental monitoring program 79 82 +3 I Environmental responsibiliSes of key personnel are documented 71 85 +14 J PublicaSon of a publicly available environmental report 62 66 +4
Environmental Management Index = A*1.5 + B*1.25 + C*0.75 + D*1 + E*1 + F*1 + G*0.75 + H*1 + I*1 + J*0.75.
2013 2016 Environmental Management Index 7.25 7.72
Wednesday 23 March 16 22
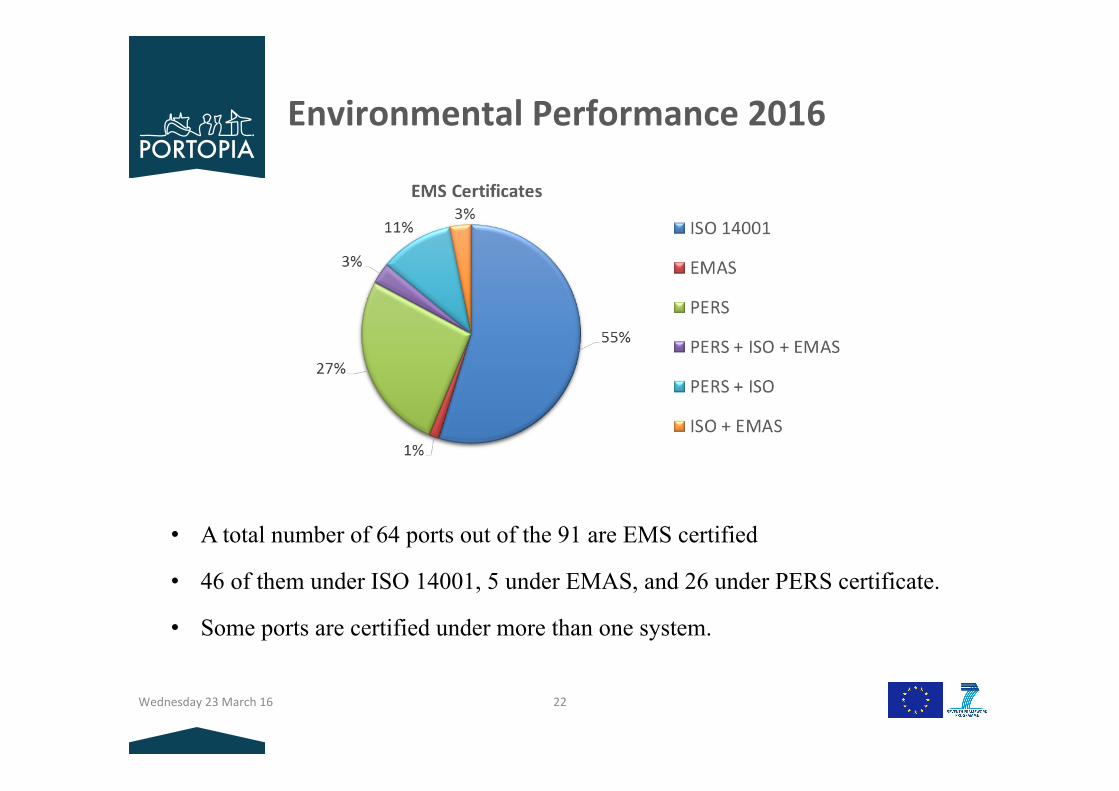
Environmental Performance 2016
• A total number of 64 ports out of the 91 are EMS certified
• 46 of them under ISO 14001, 5 under EMAS, and 26 under PERS certificate.
• Some ports are certified under more than one system.

Wednesday 23 March 16 23
Indicators 2013 (%) 2016 (%) % change 2013-‐2016
Waste 67 79 +12 Energy consumpSon 65 73 +8 Water quality 56 70 +14 Air quality 52 65 +13 Sediment quality 56 63 +7 Water consumpSon 58 62 +4 Noise 52 57 +5 Carbon Footprint 48 47 -‐1 Soil quality 42 44 +2 Marine ecosystems 35 36 +1 Terrestrial habitats 38 30 -‐8
Environmental Performance 2016
B. Environmental monitoring indicators
Wednesday 23 March 16 24
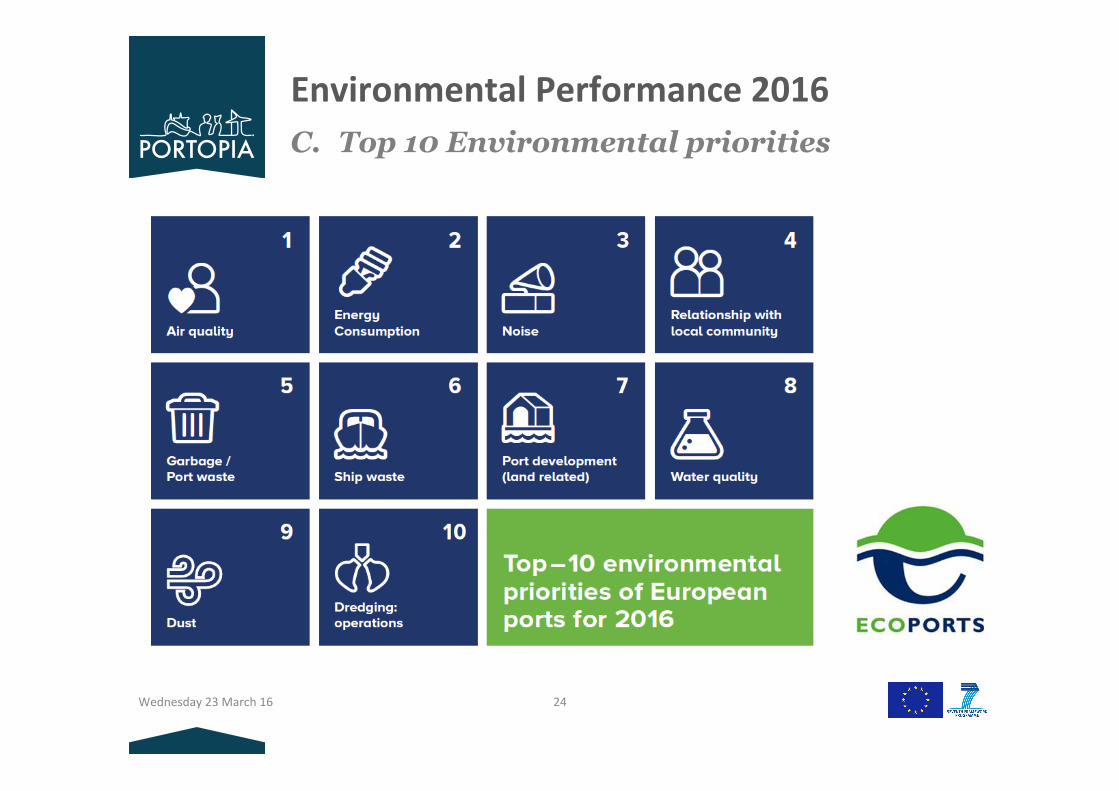
Environmental Performance 2016 C. Top 10 Environmental priorities
Wednesday 23 March 16 25
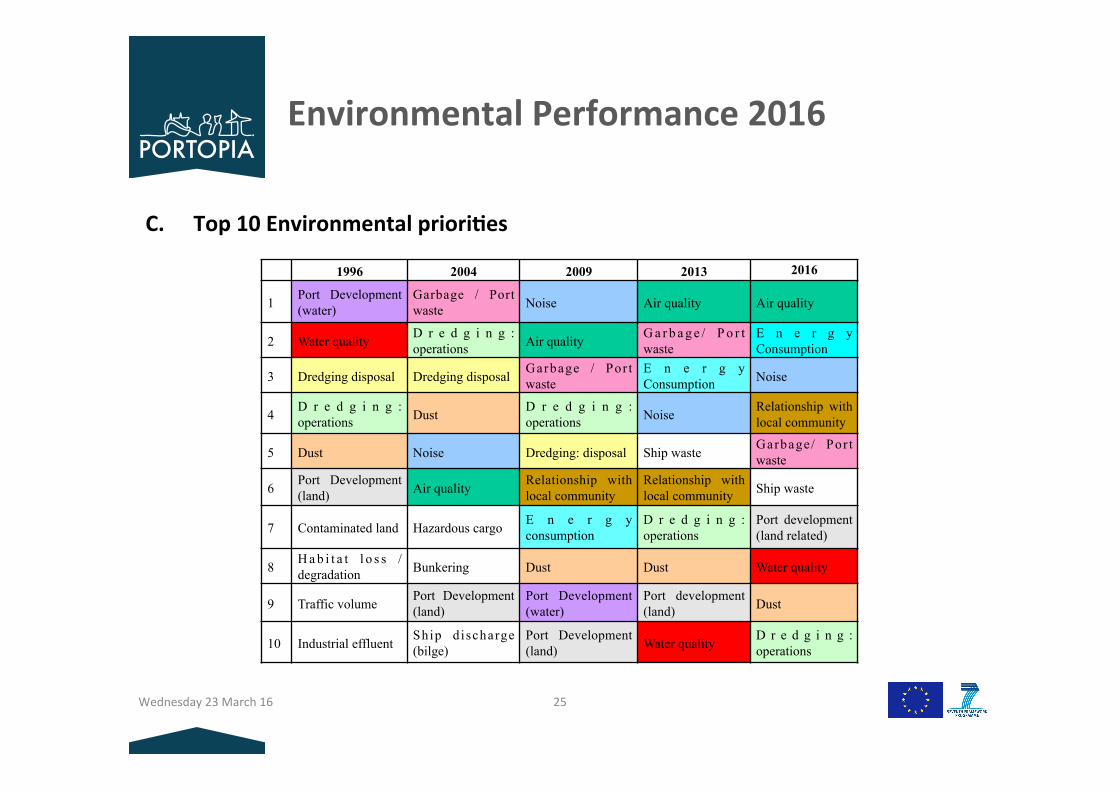
Environmental Performance 2016
C. Top 10 Environmental priori6es
1996 2004 2009 2013 2016
1 Port Development (water)
Garbage / Port waste Noise Air quality Air quality
2 Water quality D r e d g i n g : operations Air quality G a r b a g e / P o r t
waste E n e r g y Consumption
3 Dredging disposal Dredging disposal Garbage / Por t waste
E n e r g y Consumption Noise
4 D r e d g i n g : operations Dust D r e d g i n g :
operations Noise Relationship with local community
5 Dust Noise Dredging: disposal Ship waste Garbage/ Por t waste
6 Port Development (land) Air quality Relationship with
local community Relationship with local community Ship waste
7 Contaminated land Hazardous cargo E n e r g y consumption
D r e d g i n g : operations
Port development (land related)
8 H a b i t a t l o s s / degradation Bunkering Dust Dust Water quality
9 Traffic volume Port Development (land)
Port Development (water)
Port development (land) Dust
10 Industrial effluent Ship discharge (bilge)
Port Development (land) Water quality D r e d g i n g :
operations

Wednesday 23 March 16 26
Environmental Performance 2016
Indicators 2016 (%)
Is on-‐shore power supply available at one or more of the berths? 53
If YES, high voltage? 20
If YES, low voltage? 47
Does the port offer differenSate dues for “Greener” vessels? 62
Is Liquefied Natural Gas (LNG) bunkering available in the port today? 22
D. Services to shipping
• It comprises three indicators on the efforts made in order to facilitate a greener shipping.
• They were included in the SDM checklist in spring 2015.
• These results are based on the contribuSon of 61 ports.

Wednesday 23 March 16 27
0% 10% 20% 30% 40% 50% 60% 70% 80% 90% 100%
CerSfied environmental management system
Environmental training programme for the employees
Documented environmental responsabiliSes of key personnel
Publicly available environmental report
Environmental monitoring programme
DefiniSon of objecSves and targets
Inventory of Significant environmental aspects
Inventory of relevant envirionmental legislaSon
Reference to ESPO guidelines in Environmental Policy
Environmental Policy
Environmental management snapshot 2016
Yes No
EU Dashboard 2016

Wednesday 23 March 16 28
0% 10% 20% 30% 40% 50% 60% 70% 80% 90% 100%
Air Quality
Sediment Quality
Marine Ecosystems
Waste
Energy ConsumpSon
Water Quality
Overview of monitored environmental aspects 2016
Yes No
Top 3 monitored environmental aspects 2016 1st waste 2nd energy consump3on 3rd water quality
EU Dashboard 2016

Wednesday 23 March 16 29
Top 10 Environmental priorities 2016
EU Dashboard 2016

Wednesday 23 March 16 30
0% 10% 20% 30% 40% 50% 60% 70% 80% 90% 100%
Is Liquefied Natural Gas (LNG) bunkering available in the port today?
Does the port offer differenSate dues for “Greener” vessels?
Is On-‐shore Power Supply available for seagoing commercial vessels?
Services to shipping snapshot 2016
YES NO
EU Dashboard 2016

Wednesday 23 March 16 31
Conclusions
• This secSon of the Sustainability report demonstrates that a majority of EU ports are working acSvely to protect the environment
• There has been an increase in the existence of environmental management
components and in the monitoring environmental issues.
• The update of the top10 environmental issues is an important exercise because it idenSfies the high priority common areas on which ports are working and sets the framework for guidance and iniSaSves to be taken by ESPO.
• The first benchmark performance of the services to shipping indicators is posiSve in order to know in which posiSon is the sector located and it will allow to draw future trends on those issues in future surveys.

Wednesday 23 March 16 32
Logis6c chain and opera6onal performance
• ConnecSvity indicators: – Ro-‐Ro ConnecSvity Indicator – MariSme ConnecSvity Indicator – Intermodal ConnecSvity Indicator
• Cost indicators (under the form of indices): – Port Dues – Terminal Handling Charges (THC)
• CongesSon indicators: – MariSme Fluidity: tested within 2 ports based on AIS data provided by
MarineTraffic – Road congesSon
• Terminal producSvity indicator
Under development (data availability issues)

Wednesday 23 March 16 33
THC index

Wednesday 23 March 16 34
LSCI per European region Based on UNCTAD

Wednesday 23 March 16 35
LSCI Europe vs selected world regions Based on UNCTAD

Wednesday 23 March 16 36
Governance indicators
• New ESPO Fact Finding Governance Study available at the ESPO conference in Dublin (June 2nd, 3rd, 2016)
• Former indicators developed in PPRISM – ReporSng of Corporate Social Responsibility (RCSR); – IntegraSon of the Port Cluster (IPC); – Autonomous Management (AM)
h7p://www.espo.be/media/espopublicaSons/espofacdindingreport2010.pdf h7p://www.espo.be/media/espopublicaSons/espo_dashboard_2012.pdf
Wednesday 23 March 16 37
User Percep6ons of Quality
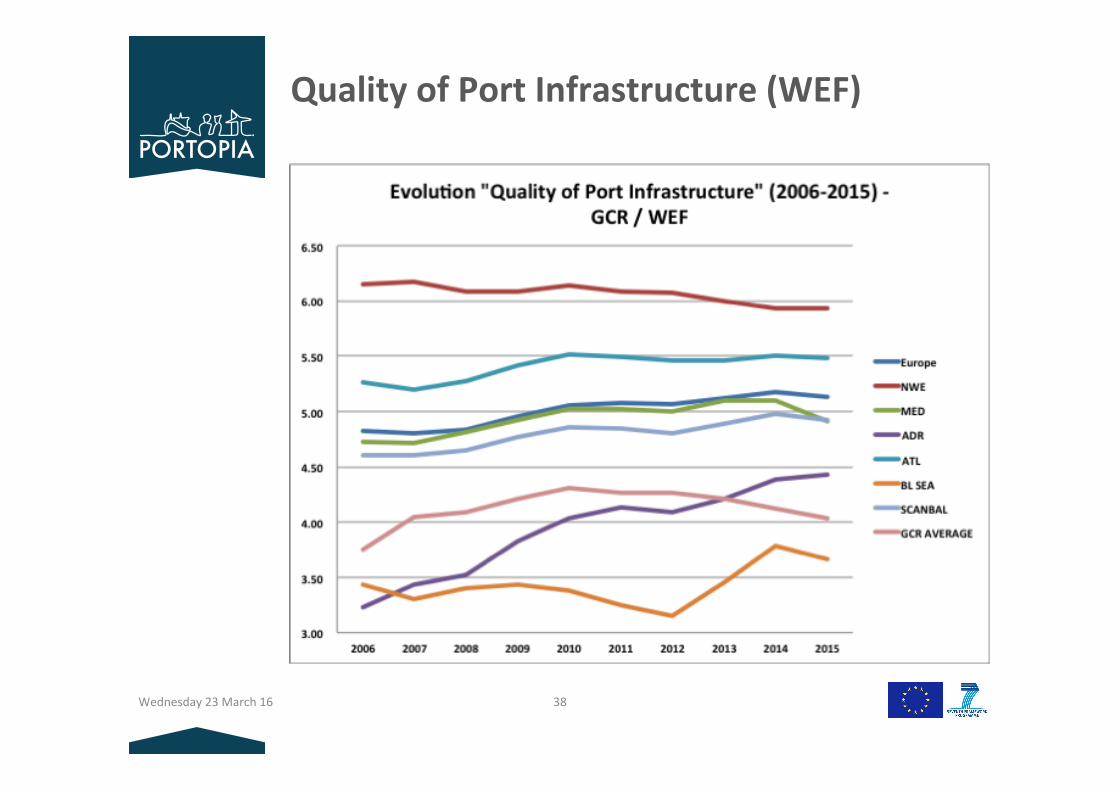
• Only available on the country level via WEF and World Bank
• WEF indicator (annual) on “Quality of Port Infrastructure” based on a survey scale 1-‐7
• Currently used on the EC transport scoreboard… • We believe the ports deserve be7er… (although the WEF indicator provides some useful insights)
h7p://ec.europa.eu/transport/facts-‐fundings/scoreboard/index_en.htm
Wednesday 23 March 16 38
Quality of Port Infrastructure (WEF)

Wednesday 23 March 16 39
Quality of Port Infrastructure (WEF)
Wednesday 23 March 16 40
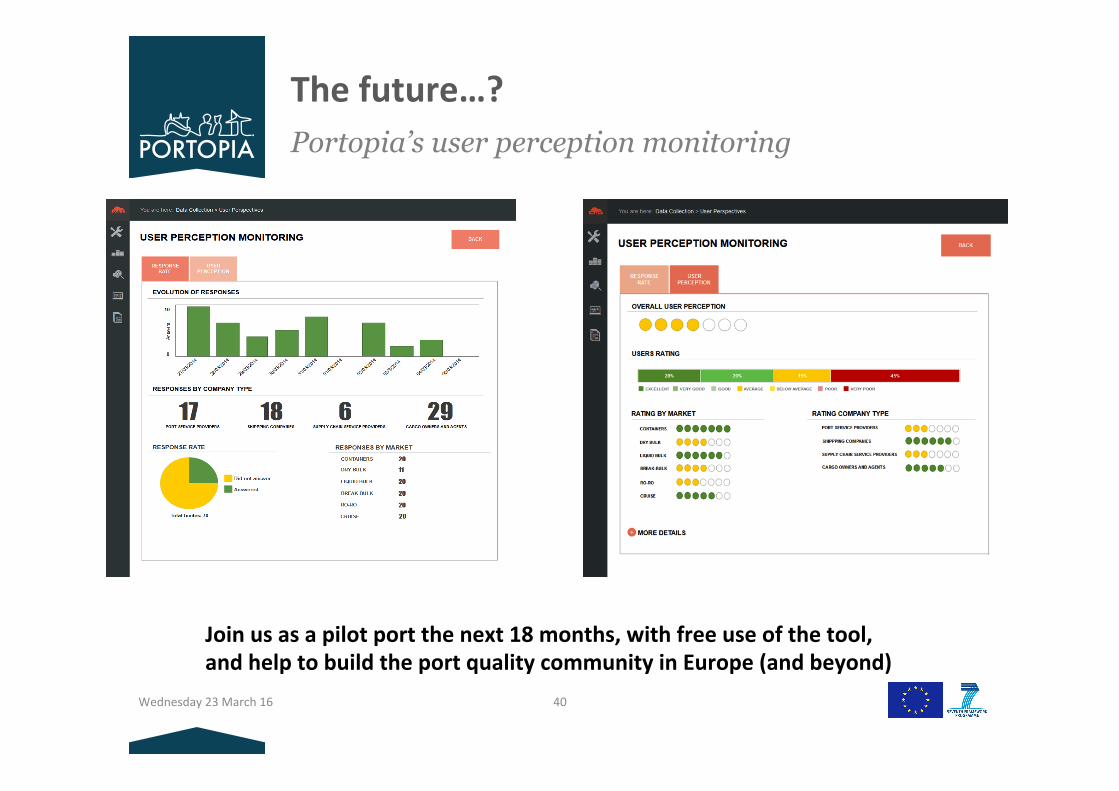
The future…? Portopia’s user perception monitoring
Join us as a pilot port the next 18 months, with free use of the tool, and help to build the port quality community in Europe (and beyond)

Wednesday 23 March 16 41
Concluding remarks
• Is such a report useful?
• For whom – Trade associaSons? – Individual Ports? – Governmental stakeholders?
• How to improve it in the short term? • How to govern the process?