i touristics + shoreplan engineering limited - culture... · 2020-07-31 · touristics and...
TRANSCRIPT

i TOURISTICS + Shoreplan Engineering Limited

Recreational Boating Feasibility and Capacity Study – Phase 1 Final Report June 2014
i TOURISTICS + Shoreplan Engineering Limited
TABLE OF CONTENTS LIST OF TABLES ......................................................................................................................................... iii
LIST OF FIGURES ....................................................................................................................................... iii
LIST OF EXHIBITS ....................................................................................................................................... iii
EXECUTIVE SUMMARY ............................................................................................................................. vii
SECTION 1 - INTRODUCTION .................................................................................................................... 1
1.0 Background ......................................................................................................................................... 1
1.1 Study Approach ................................................................................................................................... 1
1.3 Report Format ..................................................................................................................................... 2
SECTION 2 – EXISTING RECREATIONAL BOATING FACILITIES IN HALTON REGION ...................... 3
2.0 Boating Facilities ................................................................................................................................. 3
2.1 Amenities and Services ....................................................................................................................... 3
2.2 Seasonal and Transient Slip Users ..................................................................................................... 8
2.3 Assessment of Infrastructural Features at Boating Facilities .............................................................. 9
2.3.1 La Salle Park ................................................................................................................................ 9
2.3.2 Bronte Harbour........................................................................................................................... 10
2.3.3 Oakville Harbour ........................................................................................................................ 11
2.3.4 Oakville Harbour Marina - Oakville Harbour .............................................................................. 11
2.3.5 Oakville Yacht Squadron ........................................................................................................... 12
2.3.6 The Oakville Club ....................................................................................................................... 12
2.3.7 Wai Nui O Kanaka Outrigger Canoe Club ................................................................................. 13
2.3.8 Oakville Power Boat Club .......................................................................................................... 13
2.3.9 Burloak Canoe Club ................................................................................................................... 13
2.4 Other Boating Facilities in Halton ...................................................................................................... 13
2.5 Comparison of Halton’s Boating Facilities with those of the GTA/Golden Horseshoe Area ............. 14
2.5.1 Boating Facilities ........................................................................................................................ 14
2.5.2 Amenities and Services ............................................................................................................. 14
2.5.3 Seasonal and Transient Slip Users............................................................................................ 14
2.5.4 Facilities in Halton Compared with the GTA/Golden Horseshoe Area ...................................... 14
2.5.5 Marina Rates and Fees in Halton Compared with the GTA/Golden Horseshoe Area ............... 15
2.5.6 Annual Rate Increases ............................................................................................................... 16
Recreational Boating Feasibility and Capacity Study – Phase 1 Final Report June 2014
ii TOURISTICS + Shoreplan Engineering Limited
SECTION 3 – PROFILE OF BOATERS AND POPULATION CHARACTERISTICS ................................ 19
3.0 Introduction........................................................................................................................................ 19
3.1 Socio-demographic Profile of Sail and Power Boaters ..................................................................... 19
3.2 Socio-demographic Characteristics of Burlington, Oakville and Halton Residents .......................... 19
3.3 Projected Population of Halton 2013 to 2031 ................................................................................... 22
3.4 Projected Growth in Boating Activities .............................................................................................. 22
SECTION 4 – EXISTING AND PROJECTED NUMBER OF BOATS IN ONTARIO ................................. 27
4.0 Introduction........................................................................................................................................ 27
4.1 Historical Number of Boats by Length, Beam and Draft, 2007 to 2012 ............................................ 27
4.1.1 Length ........................................................................................................................................ 27
4.1.2 Beam .......................................................................................................................................... 29
4.1.3 Draft ........................................................................................................................................... 29
4.2 Projected Number of Boats ............................................................................................................... 30
4.2.1 Length of Ontario Boats ............................................................................................................. 30
4.2.2 Beam of Ontario Boats ............................................................................................................... 32
4.2.3 Draft of Ontario Boats ................................................................................................................ 32
4.2.4 Length of New York State Boats ................................................................................................ 32
4.2.5 Beam of New York State Boats ................................................................................................. 33
4.2.6 Draft of New York State Boats ................................................................................................... 33
SECTION 5 – CURRENT AND PROJECTED NEED FOR SEASONAL AND TRANSIENT SLIPS AND LAUNCH RAMPS IN HALTON REGION ................................................................................................... 35
5.0 Introduction........................................................................................................................................ 35
5.1 Need for Seasonal Slips .................................................................................................................... 35
5.2 Need for Transient Slips .................................................................................................................... 36
5.2.1 Transient Boater Market ............................................................................................................ 36
5.2.2 Existing Number of Transient Boats in Market Area .................................................................. 37
5.2.3 Projected Number of Transient Boats in Market Area ............................................................... 37
5.2.4 What Transient Boaters are Interested In .................................................................................. 38
5.3 Need for Launch Ramps ................................................................................................................... 39
SECTION 6 – PLANNING FOR FUTURE BOATER NEEDS IN HALTON ............................................... 41
6.0 Introduction........................................................................................................................................ 41
6.1 Monitoring Current Demand Situation ............................................................................................... 43
6.1.1 Meeting Future Seasonal Slips and Boater Demand................................................................. 43

Recreational Boating Feasibility and Capacity Study – Phase 1 Final Report June 2014
iii TOURISTICS + Shoreplan Engineering Limited
LIST OF TABLES
Table 1 – Boating Facilities in Halton ........................................................................................................ 3
Table 2 – Boating Facilities in Halton Compared to the GTA/Golden Horseshoe Area ......................... 15
Table 3 – Evaluation of Halton’s Harbours Boating Facilities ................................................................. 17
Table 4 – Strengths, Weaknesses, Opportunities and Threats for Recreational Boating in Halton ....... 42
LIST OF FIGURES
Figure 1 – La Salle Park ............................................................................................................................ 4
Figure 2 – Oakville Harbour ...................................................................................................................... 5
Figure 3 – Bronte Harbour ........................................................................................................................ 6
Figure 4 – Launch Ramp Locations .......................................................................................................... 7
Figure 5 – Residence of Boat Owners at Seasonal Slips ......................................................................... 9
Figure 6 – Boating Participation in Ontario ............................................................................................. 20
Figure 7 – Halton Population Projections 2011 to 2031 (25 and over) ................................................... 23
Figure 8 – Projected Growth in Halton’s Share of Ontario’s Power and Sail Boaters ............................ 24
Figure 9 – Projected Growth in Percentage of Ontario’s Population Participating in Selected Boating Activities .................................................................................................................................................. 24
Figure 10 – Projected Growth in Number of Power and Sail Boaters in Halton (2013 to 2031) ............. 25
Figure 11 – Historical Growth of Ontario’s and New York’s Recreational Boats – 6 metres to less than 8 metres (2007 to 2012) ............................................................................................................................. 28
Figure 12 – Historical Growth in Length of Largest Ontario’s Recreational Boats (2007 to 2012) ......... 28
Figure 13 – Historical Growth in Length of Largest New York State’s Recreational Boats (2007 to 2012)................................................................................................................................................................. 29
Figure 14 – Percentage Share of Ontario’s Boat Market by Length of Boat (2007 to 2031) .................. 31
LIST OF EXHIBITS
EXHIBIT 1A MARINAS, YACHT AND BOAT CLUBS WITHIN HALTON REGION – NUMBER AND SIZE OF SLIPS ....................................................................................................................................... 45
EXHIBIT 1B MARINAS, YACHT AND BOAT CLUBS WITHIN HALTON REGION – FACILITIES AND SERVICES .............................................................................................................................................. 47
EXHIBIT 1C MARINAS, YACHT AND BOAT CLUBS WITHIN HALTON REGION – FEES AND USER PATTERNS ............................................................................................................................................. 49
EXHIBIT 1D MARINAS, YACHT AND BOAT CLUBS WITHIN HALTON REGION – ASSESSMENT OF DOCKS, FAIRWAYS, BREAKWATER AND FUEL DOCKS .................................................................. 52
EXHIBIT 1E MARINAS, YACHT AND BOAT CLUBS WITHIN HALTON REGION – ASSESSMENT OF PUMPOUT STATIONS, LAUNCH RAMPS AND SECURITY MEASURES ........................................... 53
EXHIBIT 2A PROGRAMS OFFERED BY BOATING CLUBS WITHIN HALTON REGION .................. 54

Recreational Boating Feasibility and Capacity Study – Phase 1 Final Report June 2014
iv TOURISTICS + Shoreplan Engineering Limited
EXHIBIT 2B PROGRAMS OFFERED BY YACHT AND SAILING CLUBS WITHIN HALTON REGION................................................................................................................................................................. 57
EXHIBIT 3 KELSO CONSERVATIN BOAT RENTALS.......................................................................... 59
EXHIBIT 4A MARINAS AND YACHT CLUBS WITHIN THE GREATER TORONTO AREA (GTA)/GOLDEN HORSESHOE – NUMBER AND SIZE OF SLIPS ....................................................... 60
EXHIBIT 4B MARINAS AND YACHT CLUBS WITHIN THE GREATER TORONTO AREA (GTA)/GOLDEN HORSESHOE – FACILITIES AND SERVICES ........................................................... 64
EXHIBIT 4C MARINAS AND YACHT CLUBS WITHIN THE GREATER TORONTO AREA (GTA)/GOLDEN HORSESHOE – FEES ................................................................................................. 70
EXHIBIT 5 COMPARISON OF 2014 SUMMER AND WINTER MARINA FEES IN HALTON REGION AND THE GTA/GOLDEN HORSESHOE AREA ..................................................................................... 84
EXHIBIT 6 ANNUAL SUMMER AND WINTER RATES AND FEES 2014 (30 foot boat) ...................... 86
EXHIBIT 7 MARINA FACILITIES AND SERVICES RATING ................................................................ 86
EXHIBIT 8 EVALUATION OF MARINA SERVICES AND FACILITIES IN HALTON REGION AND GTA/GOLDEN HORSESHOE AREA ...................................................................................................... 87
EXHIBIT 9 SELECTED SOCIO-DEMOGRAPHIC CHARACTERISTICS OF RESIDENTS WITHIN HALTON REGION................................................................................................................................... 88
EXHIBIT 10 POPULATION PROJECTIONS FOR HALTON REGION BY AGE AND GENDER CATEGORIES IMPORTANT TO RECREATIONAL BOATING .............................................................. 90
EXHIBIT 11 POPULATION PROJECTIONS FOR ONTARIO BY AGE AND GENDER CATEGORIES IMPORTANT TO RECREATIONAL BOATING ....................................................................................... 92
EXHIBIT 12 LENGTH OF BOATS REGISTERED WITHIN ONTARIO AND NEARBY U.S. STATES .. 94
EXHIBIT 13 BEAM OF BOATS REGISTERED WITHIN ONTARIO AND NEARBY U.S. STATES ...... 96
EXHIBIT 14 DRAFT OF BOATS REGISTERED WITHIN ONTARIO AND NEARBY U.S. STATES .... 97
EXHIBIT 15 TYPE OF BOAT REGISTERED IN ONTARIO AND NEARBY U.S. STATES ................... 99
EXHIBIT 16 NUMBER OF BOATS IN OTHER CANADIAN PROVINCES AND TOP 12 U.S. STATES IN 2012 .................................................................................................................................................. 100
EXHIBIT 17 PLEASURE CRAFT LICENSES GRANTED BY TRANSPORT CANADA IN 2013 ........ 101
EXHIBIT 18 PLEASURE CRAFT LICENSES CANCELLED BY TRANSPORT CANADA IN 2013 .... 102
EXHIBIT 19 PROJECTED GROWTH BY LENGTH OF BOATS REGISTERED IN ONTARIO (2013 to 2031) ..................................................................................................................................................... 103
EXHIBIT 20 PROJECTED GROWTH BY BEAM (WIDTH) OF BOATS REGISTERED IN ONTARIO (2013 to 2031) ....................................................................................................................................... 104
EXHIBIT 21 PROJECTED GROWTH BY DRAFT OF BOATS REGISTERED IN ONTARIO (2013 to 2031) ..................................................................................................................................................... 105
EXHIBIT 22 PROJECTED GROWTH BY TYPE OF BOATS REGISTERED IN ONTARIO (2013 to 2031) ..................................................................................................................................................... 106
EXHIBIT 23 PROJECTED GROWTH BY LENGTH OF BOATS REGISTERED IN NEW YORK STATE (2013 to 2031) ....................................................................................................................................... 107

Recreational Boating Feasibility and Capacity Study – Phase 1 Final Report June 2014
v TOURISTICS + Shoreplan Engineering Limited
EXHIBIT 24 PROJECTED GROWTH BY WIDTH OF BOATS REGISTERED IN NEW YORK STATE (2013 to 2031) ....................................................................................................................................... 108
EXHIBIT 25 PROJECTED GROWTH BY DRAFT OF BOATS REGISTERED IN NEW YORK STATE (2013 to 2031) ....................................................................................................................................... 109
EXHIBIT 26 PROJECTED GROWTH BY TYPE OF BOATS REGISTERED IN NEW YORK STATE (2013 to 2031) ....................................................................................................................................... 110
EXHIBIT 27 ESTIMATED NUMBER OF SEASONAL BOATS WITHIN HALTON REGION ............... 111
EXHIBIT 28 DEMAND FOR SEASONAL SLIPS WITHIN HALTON REGION .................................... 112
EXHIBIT 29 AVERAGE DISTANCE TRAVELLED AWAY FROM MARINA ........................................ 113
EXHIBIT 30 AVERAGE NUMBER OF DAYS USING A BOAT ........................................................... 113
EXHIBIT 31A MARINAS WITHIN 20 NAUTICAL MILES OF BRONTE HARBOUR ........................... 114
EXHIBIT 31B MARINAS WITHIN 21 TO 40 NAUTICAL MILES OF BRONTE HARBOUR ................ 117
EXHIBIT 31C MARINAS WITHIN 41 TO 60 NAUTICAL MILES OF BRONTE HARBOUR ................ 122
EXHIBIT 31D MARINAS WITHIN 61 TO 80 NAUTICAL MILES OF BRONTE HARBOUR ................ 124
EXHIBIT 32 NUMBER OF SEASONAL AND TRANSIENT SLIPS WITHIN TRANSIENT MARKET AREA OF HALTON REGION BOATING FACILITIES .......................................................................... 126
EXHIBIT 33 NUMBER OF POWER AND SAIL BOATS WITHIN TRANSIENT MARKET AREA OF HALTON REGION BOATING FACILITIES ........................................................................................... 126
EXHIBIT 34 POTENTIAL TRANSIENT BOATS WITHIN MARKET AREA OF HALTON REGION BOATING FACILITIES IN 2013 ............................................................................................................ 126
EXHIBIT 35 PROJECTED NUMBER OF BOATS WITHIN 80 NAUTICAL MILES OF HALTON REGION BOATING FACILITIES 2013 TO 2031 .................................................................................. 127
EXHIBIT 36 PROJECTED NUMBER OF TRANSIENT BOATERS WITHIN 80 NAUTICAL MILES OF HALTON REGION BOATING FACILITIES 2013 TO 2031 ................................................................... 128
EXHIBIT 37 ESTIMATED NUMBER OF BOATS IN HALTON REGION LIKELY TO USE A LAUNCH RAMP FOR THEIR BOATING ACTIVITY ............................................................................................. 129

Recreational Boating Feasibility and Capacity Study – Phase 1 Final Report June 2014
vi TOURISTICS + Shoreplan Engineering Limited
Recreational Boating Feasibility and Capacity Study – Phase 1 Final Report June 2014
vii TOURISTICS + Shoreplan Engineering Limited
EXECUTIVE SUMMARY Study Objectives TOURISTICS and Shoreplan Engineering Limited were retained by the Town of Oakville, City of Burlington (in partnership with LaSalle Park Marina Association) and Halton Region to conduct the first of a two phased study to determine the current and anticipated demand for recreational boating facilities within Halton and the Greater Toronto Area (GTA)/Golden Horseshoe Region over the period from 2013 until 2031 and the need to accommodate any future demand for additional slips. The intent of the study was to provide a comprehensive analysis of current harbour capacity within the GTA/Golden Horseshoe region and specifically within Halton Region. It was also the intent of the study to assess the changing demographic profile or the area and the impacts of these changes on the anticipated demand for recreational boating, the sources and location of this demand, trends in the type of boating and berth requirements with the aim of making recommendations on whether or not additional harbour capacity is warranted within Halton. The demand for additional slips and launch ramps in Halton will be dependent on three major factors:
• The ability of the existing marina facilities within the market area to meet the current and future demand, and the overall occupancy rate of the marinas within the seasonal market area;
• The growth in the number of power and sail boats in the seasonal market area and the changes
in their length, beam and draft; and,
• The market area for seasonal slips and launch ramps exhibiting socio-demographic characteristics that are strong determinants of power and sail boating demand.
Key Findings Boating Facilities in Halton There are four marinas, three yacht clubs, one power boat club, and four boating clubs in Halton Region. They provide recreational boating enthusiasts with opportunities for canoeing, kayaking, sailing, and the use of catamarans, outrigger canoes, and stand up paddle boards. In addition, the reservoir at Kelso Conservation Area, lake at Mountsberg Conservation Area and Fairy Lake at Prospect Park all in the northern part of Halton provide areas suitable to launch and use small aluminum boats, canoes, kayaks, paddle boats and stand up paddle boards. In addition to the marinas, yacht and power boat clubs, Halton is also home to four boating clubs (Burloak Canoe Club, Burlington Sailing and Boating Club, Burlington Beach Catamaran Club, Wai Nui O Kanata Outrigger Canoe Club) catering to non-motorized boating activities. The four clubs offer opportunities for participation with canoes, outrigger canoes, kayaks, war canoes, dragon boats, dinghies, keel boats, paddle boats and stand up paddle boards. All report an increase in the number members, programs offered and participants in 2013. The programs are offered to members and non-members and both children and adults. The physical conditions of the boating infrastructure at the three existing harbour locations on Lake Ontario (Oakville Creek, Bronte Creek and LaSalle Park), are, with one exception, generally adequate with some poor conditions mostly related to dock spacing. The dock spacing tends to be less than suggested in current marina guidelines for public facilities and the docks are less stable than some currently available products for commercial facilities. Much of the docking is provided without finger docks. Most locations do not offer water and power on dock, as is commonly done. The one exception is Bronte Outer Harbour where the docks and their layout meet current guidelines and supporting infrastructure appears to be very in good condition.

Recreational Boating Feasibility and Capacity Study – Phase 1 Final Report June 2014
viii TOURISTICS + Shoreplan Engineering Limited
It is acknowledged that the Oakville is improving harbour infrastructure on ongoing basis, particularly as it relates to shoreline improvements. Further improvements are being planned. Burlington and LaSalle Park Marina Association recently completed a class environmental assessment for major wave protection improvements at La Salle Park Marina. Boating Facilities in Halton Compared with the GTA/Golden Horseshoe Area There are 41 boating facilities in the GTA/Golden Horseshoe Area between Scarborough in the east and St. Catharines in the west. Fourteen are marinas and the remaining 27 are yacht and sailing clubs. As shown in the Table following, although the occupancy rates and percentage of slips by length are similar, boaters at marinas and yacht clubs in Halton appear to be less well served than those in GTA/Golden Horseshoe area. As a percentage of total slips available, the GTA/Golden Horseshoe area offers twice as many transient slips as Halton and as a percentage of facilities, twice as many fuel docks. Although a higher percentage of facilities in the GTA/Golden Horseshoe area offer a pump out service, the number of slips per pump out is similar (i.e. 292 versus 336 in Halton). Both areas have insufficient on-site capacity to accommodate all the seasonal boats for winter storage (i.e. 71% in Halton versus 87% in the GTA). The demand for additional slips is much higher in Halton than the GTA/Golden Horseshoe area as expressed by the number of boats on the waiting list as a percentage of occupied seasonal slips (i.e. 36% in Halton versus 16% in the GTA). Halton GTA/Golden Horseshoe Area Number of Marinas, Yacht, Sailing and Power Boat Clubs
8 41
Seasonal Slips Occupied 1,310 96.8% 8,833 98.6% Transient Slips as Percentage of Total Slips
2.5% 5.4%
Percentage of Slips <30 feet 33.2% 20.2% Percentage of Slips 30 feet to <36 feet 44.0% 48.1% Percentage of Slips 36 feet to <46 feet 20.2% 22.9% Percentage of Slips 46 feet and over 2.6% 8.8% Percentage of Facilities with Fuel Docks 25% 53.7% Number of Slips Per Fuel Dock 672 424 Percentage of Facilities with Pump Out 50% 78.0% Number of Slips Per Pump Out 336 292 Percentage of Facilities with Launch Ramp
37.5% 53.6%
Percentage of Slips with 30 amp or more power
51.5% 78.6%
Percentage of Seasonal Boats Accommodated On-site for Winter Storage
70.8% 87.4%
Number of Boats on Waiting List 470 1,470 Boats on Waiting List as a Percentage of Occupied Seasonal Slips
35.9% 16.4%
Marina Rates and Fees The rates charged at Bronte Outer Harbour Marina, Bronte Harbour, Oakville Harbour, and LaSalle Park Marina are comparable with those in the GTA/Golden Horseshoe Area given the product offering. Marina operators throughout the GTA/Golden Horseshoe Area indicated that annual rate increases are typically held to three to four percent due to the highly competitive nature of the market place. Since there are no indications that marina operating costs will decrease in the future, it is expected that rates will continue to rise at this rate. One-time increases above three to four percent do occur when additional revenue is required for capital improvements. Rate increases at Bronte Outer Harbour Marina, Bronte and Oakville Harbours, and LaSalle Park Marina have consistently fallen within the area norms.

Recreational Boating Feasibility and Capacity Study – Phase 1 Final Report June 2014
ix TOURISTICS + Shoreplan Engineering Limited
Projected Population of Halton 2013 to 2031 The population of Halton 25 and older is projected to increase from 359,130 in 2013 (169,690 males, 189,440 females) to 403,450 by 2018 (196,980 males, 206,470 females), to 451,130 by 2023 (219,850 males, 231,280 females), to 498,180 by 2028 (243,090 males, 255,090 females), and reach 528,100 by 2031 (258,100 males, 269,850 females). This represents a 47 percent increase in the population between 2013 and 2031. During this same time period the population of Ontario 25 and older is projected to increase by only 26 percent from 9,614,530 (4,661,300 males, 4,953,230 females) in 2013, to 12,064,180 (5,850,820 males, 6,213,360 females) in 2031. The period from 2011 to 2031 will also see a 54 percent increase in employment in Halton while that of the province will increase by 27 percent. The increased growth in the age groups with high participation rates in boating (i.e. 35 to 44 and 45 to 54) and employment in Halton indicates a likely large increase in the demand for recreational boating activities and a larger share of Ontario’s power and sail boaters. Projected Growth in Boating Activities Between 2011 and 2030 participation in power boating, sailing, canoeing, kayaking and rowing are all projected to increase. There are no comparable projections available for outrigger canoeing, paddle boating, and stand up paddle boarding, although anecdotal information based on the increased number of members at area clubs suggests that participation in these activities is also in a growth mode. Over the 20 years between 2011 and 2030 participation in power boating, sailing, canoeing, kayaking and rowing is projected to increase as follows:
Activity 2011 2020 2030 Power Boating 10.8% 13.0% 14.6% Sailing 3.6% 4.3% 4.8% Canoeing 6.8% 7.6% 8.3% Kayaking 2.4% 4.4% 5.4% Rowing 3.0% 3.1% 3.3% Projected Growth in Power and Sail Boats 2013 to 2031 Between 2013 and 2031 the number of boats in Ontario is projected to grow as follows:
Length 2013 2023 2031 Percentage Increase
6 m. to <8 m. (20 ft. to <26 ft.) 64,700 71,950 74,230 14.7% 8 m. to <9 m. (26 ft. to <30 ft.) 12,780 14,760 15,440 20.8% 9 m. to <11 m. (30 ft. to <36 ft.) 19,400 29,720 39,010 101.1% 11 m. to <14 m. (36 ft. to <46 ft.) 11,590 16,810 21,120 82.2% 14 m. and longer (46 ft. or more) 6,470 9,980 13,180 103.7% This projected increased growth in the length of boats will have a particularly strong impact on the facilities in Oakville and Bronte Harbour where there is already a shortage of longer slips and many of the fairways are sub-standard in terms of width. This shortage will be further exacerbated as there will be a need to either modify the number of slips to accommodate wider beam widths or add more slips. Conclusions Need for Seasonal Slips By comparing the number of seasonal slips available in 2013 with the number of boats requiring a slip, it is evident that demand exceeds supply and additional slips are needed. It is estimated that at the end of

Recreational Boating Feasibility and Capacity Study – Phase 1 Final Report June 2014
x TOURISTICS + Shoreplan Engineering Limited
the boating season in 2013 there was a need for 430 additional slips. By 2018 the need for additional slips will rise to 820; by 2023 to 1,400; by 2028 to 1,860; and reach 2,160 by 2031. By comparison to existing facilities within Halton, this would mean four additional marinas at least the size of Bronte Outer Harbour Marina. The trend toward longer and wider boats will have a significant impact on the number of slips in Oakville and Bronte Harbours where the finger docks are short and the fairways narrow. It is evident that there is a current and future need for seasonal slips in the 10.67 metre (35 foot), 12.12 metre (40 foot), and 13.72 metre (45 foot) range. Need for Transient Slips According to the 2009 Great Lakes Boating Survey, 60 percent of boater’s days away from their home marina are spent within 20 nautical miles. A further 20 percent are spent within 21 and 40 nautical miles, 10 percent within 41 to 60 nautical miles, 6 percent within 61 to 80 nautical miles, and the final 4 percent beyond 80 nautical miles. During the 2013 boating season, there were 54,190 boaters at the 75 marinas, yacht and power boat clubs within 80 nautical miles of Bronte Harbour. The number of transient boaters visiting the Halton facilities is dependent on the number of boaters within the market and their distance from Halton. Of the 54,190 within 80 nautical miles of Halton, 37,880 were within 20 nautical miles and would have the greatest likelihood of visiting on one or more occasions. The least likely are those 640 boaters within 61 to 80 nautical miles. By 2018 the total number of transient boater days within the overall market area is projected to increase to 59,900; to 65,170 by 2023; to 69,930 by 2028; and reach 72,700 by 2031. There is clearly an existing and growing transient boater market that the facilities in Halton would be in a position to attract. The Oakville Harbour, Bronte Harbour and Bronte Outer Harbour Marina are in easy walking distance of the type of shops and restaurants of interest to transient boaters. The numbers provided by the marinas, yacht and power boat clubs within Halton and those within the GTA/Golden Horseshoe Area and beyond confirm there is significant transient boater market to be attracted. Oakville, Burlington and Halton should increase the number of transient slips available; but should not exceed the industry average of approximately 15 percent of the total slips available. Based on the number of transient boaters attracted to the marinas, yacht and power boat clubs in the GTA/Golden Horseshoe Area, 200 transient slips in Halton Region (i.e. 1,344 x 0.15 = 200) could be expected to attract a minimum of 6,000 transient boaters annually. Need for Launch Ramps Boats that are trailered to launch ramps are typically less than 8 metres (less than 26 feet). Approximately 20 percent of boats 6 metres to less than 8 metres (i.e. 20 feet to less than 26 feet), and 2 percent of boats 8 metres to less than 9 metres (i.e. 26 feet to less than 30 feet) are trailered to launch ramps on a per use basis. Launch ramp use is usually concentrated during a three-hour launch period (morning) and three-hour retrieval period (afternoon). Launch ramps require a large amount of parking space. Typically a one lane ramp should have at least 35 to 45 vehicle and boat trailer parking spaces. A two lane launch ramp should have between 45 and 75 spaces. While we have determined that there is a sizable number of boats in Halton that would likely use a launch ramp, there is little data available to indicate the current level of use, as the two facilities in LaSalle Park in Burlington are free of charge and are not monitored. The Bronte and Oakville launch ramps had 2,200 documented users in 2013. Additional undocumented users frequent the facilities in LaSalle Park and the facilities in Hamilton and Mississauga due to the poor condition and limited parking at the Burlington, Bronte and Oakville launch ramps. The number of boats likely to use a launch ramp in Halton is projected to increase from 14,300 in 2013; to 15,440 by 2018; to 16,470 by 2023; to 17,370 by 2028; and reach 17,890 by 2031. Ideally, based on the existing data, one additional launch ramp will be required by 2018, two additional launch ramps (for a total of 6) will be required by 2023, and three more by 2031 for a
Recreational Boating Feasibility and Capacity Study – Phase 1 Final Report June 2014
xi TOURISTICS + Shoreplan Engineering Limited
total of seven. However, until more detailed user data is available for the existing launch ramps we recommend that the municipalities concentrate on improving the existing facilities rather than adding additional ones. It should be noted that the Ministry of Natural Resources considers there is a world class fishery off Bronte/Oakville Harbours, especially for salmon fishing. There are currently eight fishing charter boat operators in Oakville and Bronte, and the Ministry feels that the fishery could support at least 12 fishing charter boats. In addition, the 34,100 licensed anglers in Halton spend hundreds of dollars each annually within the Region on fishing and boating equipment.
Purchases Wholly Attributable to Recreational Fishing
Average Annual Expenditure per Active Licensed Angler
Boating Equipment $342.54 Fishing Equipment $77.21 Recommendations Monitoring Current Demand Situation In order to provide boating facilities in a timely fashion it will be necessary to monitor the level of demand in an ongoing manner. For marinas this means maintaining a permanent waiting list which indicates the length, width and beam of the boat requiring a slip or mooring. For boating clubs (i.e. canoeing, kayaking, rowing, etc.) it means documenting the number of persons turned away from program offerings or membership categories. When an individual marina has reached capacity (i.e. 95% occupancy or more) and the marina manager has a documented waiting list approaching one-half the number of seasonal slips, a new or expanded facility is warranted. Given that the environmental, planning and construction steps involved in bringing a new marina to fruition will likely take a minimum of four years (i.e. planning, environmental assessment process and design; approvals by various government agencies; and construction); the waiting list likely will have reached a point where when combined with industry average trade-ups, the new facility will be assured of success as there will be no shortage of demand for slips. Meeting Future Seasonal Slip and Boater Demand The study clearly indicates that there is a demand for boating facilities much beyond the capacity of the existing facilities. It is also clear that the existing facilities and the three main existing locations cannot meet this demand by gradual expansion. The two river locations at Oakville and Bronte cannot expand further within the existing channel to any degree while respecting environmental objectives. The one location on the open lake in Bronte (i.e. Bronte Outer Harbour Marina) is bound by fixed breakwaters and cannot expand within the footprint of the breakwaters. The La Salle Park Marina is proposing provision of fixed breakwaters which then could accommodate some future expansion. No decision has been made on this location as of the writing of this report. As the identified demand for slips is beyond the capacity of the existing sites in the Region, new locations will need to be considered on a go forward basis. Selection of any new site will be a complex process that will be subject to an individual environmental assessment process and a thorough review by all levels of government and conservation authorities, as well as the general public. The projections suggest that if the demand were to be met with the typical size marina found on the Great Lakes, it would require the construction of four facilities at least as large as Bronte Outer Harbour Marina along the Halton waterfront by 2031. Clearly, this is a task that will call for extensive public consultations, creativity, and out of box thinking. In addition, the Burloak Canoe Club requires an additional 70 to 75 feet of shoreline dockage for a total of 100 feet to meet current demand, let alone future demand. Additional space and secured parking for

Recreational Boating Feasibility and Capacity Study – Phase 1 Final Report June 2014
xii TOURISTICS + Shoreplan Engineering Limited
people with disabilities would allow the Wai Nui O Kanaka Outrigger Canoe Club to expand its membership as well.

Recreational Boating Feasibility and Capacity Study – Phase 1 Final Report June 2014
TOURISTICS + Shoreplan Engineering Limited 1
SECTION 1 – INTRODUCTION 1.0 Background TOURISTICS and Shoreplan Engineering Limited were retained by the Town of Oakville (Oakville), City of Burlington (Burlington) [in partnership with LaSalle Park Marina Association] and the Region of Halton (Halton) to conduct the first of a two phased study to determine the current and anticipated demand for recreational boating facilities within Halton and the Greater Toronto Area (GTA)/Golden Horseshoe Region over the period from 2013 until 2031 and the need to accommodate any future demand for additional slips. The intent of the study was to provide a comprehensive analysis of current harbour capacity within the GTA/Golden Horseshoe region and specifically within Halton. It was also the intent of the study to assess the changing demographic profile of the area and the impacts of these changes on the anticipated demand for recreational boating, the sources and location of this demand, trends in the type of boating and berth requirements with the aim of making recommendations on whether or not additional harbour capacity is warranted within Halton. This information will be used by Oakville, Burlington and Halton (the Partners) for park and harbour master planning initiatives, business planning, and in other strategy documents. It will help the Partners understand more clearly what the future demand and supply requirements are in terms of marina facilities to meet the recreational boating demand of Halton. Many areas of Halton are identified as “Urban Growth Centres” by the Province of Ontario and there is a belief that the current harbour capacity will not keep pace with the forecasted population growth in the area and demand for such facilities. As both Burlington and Oakville are lakefront communities, and Halton has invested significant funding into a Regional Waterfront Parks program, boating/sailing is considered synonymous with Halton. Fiscally viable and sustainable harbours and recreational boating, along with a vibrant waterfront within Halton is important from a quality of life perspective and aligns with the community values of many residents. 1.1 Study Approach In order to complete a detailed assessment of the current and future need for recreational boating facilities in Halton, the following steps were undertaken:
• Conducted a site visit to each of the boating facilities (i.e. marinas, yacht and boat clubs within Halton) to assess the current product offering.
• Contacted a representative of each of the facilities to obtain information on the number and size
of slips, facilities and services offered, fees charged and user patterns.
• Conducted a site visit to each of the marinas, yacht and boats clubs from the Scarborough Bluffs Sailing Club in the east to St. Catharines Marina in the west.
• Conducted in person or telephone interviews with the owner/operators/commodores of each of
the facilities within the GTA/Golden Horseshoe area to obtain information on the number and size of slips, facilities and services offered, fees charged and user patterns.
• Conducted telephone interviews with power and sail boat builders/manufacturers in Canada and
the United States to obtain data on the current and future length, beam, and draft of boats sold and registered in Ontario, New York, and Michigan, and any forecasts for growth in boating.
• Contacted Transport Canada for information regarding the number of licensed pleasure craft in
Ontario and the rest of Canada.

Recreational Boating Feasibility and Capacity Study – Phase 1 Final Report June 2014
TOURISTICS + Shoreplan Engineering Limited 2
• Contacted the National Marine Manufacturers Association regarding the number of recreational boats in Canada and the United States.
• Contacted each of the municipalities and conservation authorities within the GTA/Golden Horseshoe area regarding planned or rumoured new marina facilities.
• Met with the Association of Oakville Harbours’ Stakeholders regarding local boater input and their
2012 Rates and Fees Study. Throughout the study process the consultants met with representatives from the Town of Oakville Parks and Open Space, City of Burlington Parks and Recreation Department (along with LaSalle Park Marina Association representation) and Region of Halton, Planning Services. Special thanks is extended to the of Commodores of each of the Yacht and Boat Clubs in Oakville and Burlington and the Marina Managers/Presidents in Oakville, Bronte and Burlington for their unending provision of data and information for this study. 1.3 Report Format The report is divided into six sections or chapters. Section 2 describes and maps the existing boating facilities within Halton. Section 3 provides a profile of power and sail boaters in Ontario and population and boating activity projections for the period between 2013 and 2031. The historical and projected number, length, beam, and draft of boats in Halton’s seasonal and transient market are detailed in Section 4. The level of demand for seasonal and transient slips and launch ramps is described in Section 5. Section 6 provides an indication of the steps necessary to ensure that future recreational boating needs are met to the extent possible; the approach required to meet the future demand; and the result of a strengths, weaknesses, opportunities and threats analysis. Figures and tables are inserted in the text of the report as close to the first reference as practical. Detailed EXHIBITS are included in the appendix in the order in which they are referred.

Recreational Boating Feasibility and Capacity Study – Phase 1 Final Report June 2014
TOURISTICS + Shoreplan Engineering Limited 3
SECTION 2 – EXISTING RECREATIONAL BOATING FACILITIES IN HALTON REGION 2.0 Boating Facilities There are four marinas, three yacht clubs, one power boat club, and four boating clubs (providing opportunities for canoe, kayak, sailing, catamaran, outrigger canoe, and stand up paddle boards). In addition, the 25 hectare reservoir at Kelso Conservation Area (Milton), 202 hectare lake at Mountsberg Conservation Area (Milton) and 26 hectare Fairy Lake at Prospect Park (Acton-Halton Hills) all in the northern part of Halton provide launch ramps and the opportunity to use small aluminum boats, canoes, kayaks, paddle boats and stand up paddle boards. Each of these facilities is listed in Table 1 below and shown in Figures 1 to 4 following. Table 1 - Boating Facilities in Halton
Facility Location Boating Activity Marina Oakville Harbours Marina - Oakville Harbour
Lakeshore Road East Sail boats, power boats
Oakville Harbours Marina - Bronte Harbour
2508 Lakeshore Road West Sail boats, power boats
Bronte Outer Harbour Marina 2340 Ontario Street, Bronte Sail boats, power boats, Halton Police Marine Unit
LaSalle Park Marina 831 LaSalle Park Road, Burlington Sail boats, power boats Yacht Club Oakville Club 56 Water Street, Oakville Sail boats, kayaks, stand up paddle
boards Oakville Yacht Squadron 146 Lakeshore Road West, Oakville Sail boats Bronte Harbour Yacht Club 2514 Lakeshore Road West, Bronte Sail boats, power boat, dinghies Power Boat Club Oakville Power Boat Club 150 Water Street, Oakville Power boats Boating Club Burloak Canoe Club 160 Water Street, Oakville Canoes, kayaks, war canoes, dragon
boats Burlington Sailing and Boating Club 841 LaSalle Park Road, Burlington Dinghies, keel boats, power boats Burlington Beach Catamaran Club Lakeshore Road, Burlington Catamarans Wai Nui O Kanaka Outrigger Canoe Club 2479 Hixon Street, Oakville Outrigger canoes, stand up paddle
boards Conservation Area and Park Kelso Conservation Area 5234 Kelso Road, Milton Canoes, kayaks, paddle boats, stand up
paddle boards, small aluminum boats (motorized boats prohibited)
Mountsberg Conservation Area 2259 Milburough Line, Campbellville (Milton)
Canoes, kayaks, paddle boats, stand up paddle boards, small aluminum boats (powered by electric trolling motors permitted, gas powered motor prohibited )
Fairy Lake, Prospect Park 30 Park Avenue, Acton (Halton Hills) Canoes, kayaks, stand up paddle boards, small aluminum boats (powered by electric trolling motors permitted, gas powered motor prohibited)
Coronation Park 1426 Lakeshore Road West, Oakville Canoes, kayaks, paddle boats, stand up paddle boards, small aluminum boats
Burloak Waterfront Park 5420 Lakeshore Road East, Burlington Canoes, kayaks, paddle boats, stand up paddle boards, small aluminum boats
2.1 Amenities and Services The four marinas, three yacht clubs and one power boat club have 1,344 slips and moorings, of which 137 are mediterranean bow in moorings1 (i.e. Oakville Club 43, Oakville Yacht Squadron 76, Bronte Harbour Yacht Club 18). Of the 1,344 slips available in Halton only 34 are transient and none of these

Recreational Boating Feasibility and Capacity Study – Phase 1 Final Report June 2014
TOURISTICS + Shoreplan Engineering Limited 4
Figure 1 - LaSalle Park Marina

Recreational Boating Feasibility and Capacity Study – Phase 1 Final Report June 2014
TOURISTICS + Shoreplan Engineering Limited 5
Figure 2 - Oakville Harbour

Recreational Boating Feasibility and Capacity Study – Phase 1 Final Report June 2014
TOURISTICS + Shoreplan Engineering Limited 6
Figure 3 - Bronte Harbour

Recreational Boating Feasibility and Capacity Study – Phase 1 Final Report June 2014
TOURISTICS + Shoreplan Engineering Limited 7
Figure 4 - Halton Region Facilities

Recreational Boating Feasibility and Capacity Study – Phase 1 Final Report June 2014
TOURISTICS + Shoreplan Engineering Limited 8
are at the Oakville or Bronte Harbour Marinas. All but 10 are available at the Bronte Outer Harbour Marina. 446 of the slips are less than 30 feet; 592, 30 feet to less than 36 feet; 271, 36 feet to less than 46 feet; and 35, 46 feet and over (EXHIBIT 1A). Only Bronte Outer Harbour Marina and Bronte Harbour have permanent lift facilities; cranes are brought in in the spring and fall for the launch and haulout at the other six facilities. Bronte Harbour offers repairs through a marine shop operated by an independent owner. The facility is leased from the Town of Oakville. Only two of the eight facilities provide a fuel dock (i.e. Oakville Power Boat Club, Bronte Outer Harbour Marina) and only the fuel dock at Bronte Outer Harbour Marina is available to both power and sail boats as only boats that clear the bridges’ (32 foot clearance) can make it to the Oakville Power Boat’s fuel dock. There are four launch ramps; one in Oakville Harbour, one in Bronte Harbour, and two at the LaSalle Park Marina in Burlington. The five launch ramps at Kelso and Mountsberg Conservation Areas, Fairy Lake, and Coronation Park are only suitable for canoes, kayaks and small boats as there are either physical or other operational restrictions on the use of motorized boats at these locations (Figure 4). There is potential for a launch ramp at Burloak Waterfront Park suitable for canoes, kayaks and small boats. A master plan review of the park is currently underway. Oakville Power Boat Club, Bronte Outer Harbour Marina, Oakville Harbour Marina, and LaSalle Park Marina (shared with BSBC) offer the only pump out services in Halton. Just over half of the slips (i.e. 687) have access to 30 or more amp. power pedestals. Only 71 percent or 928 of the 1,310 seasonal boats at the eight facilities can be accommodated on-site for winter storage. Another 40 could be accommodated within Oakville Harbours Marina if the abandoned boats were removed (EXHIBIT 1B). 2.2 Seasonal and Transient Slip Users During the 2013 boating season 96.8 percent of the 1,310 seasonal slips were occupied. Anything over 95 percent is considered full occupancy by industry standards. Some slips were not occupied in 2013 due to spring storm damage to the marina infrastructure at LaSalle Park Marina and wet moorings required for the pilot dredging project in Bronte Harbour. As shown in Figure 5 below, 84.8 percent (1,075) of the seasonal slips at the eight facilities were occupied by residents of Halton, 57.7 percent (732) by residents of Oakville, 22.7 percent (288) by residents of Burlington, and 4.4 percent (55) by residents in the rest of Halton. Sixty percent or 767 of the 1,268 seasonal boats in 2013 were sail boats and 501 power boats (EXHIBIT 1C). There were 470 boats on the waiting lists of the eight facilities with 73 percent looking for a slip 36 feet or more in length. This represents 37.1 percent of the occupied slips in 2013 Despite the low number of transient slips available within Halton, 1,287 boaters visited the area facilities in 2013, staying for an average of 1.5 days. This number of transient visits is primarily due to the reciprocal arrangements at the yacht clubs where visiting boats can use member slips when they are vacant. If transient slips were available within Oakville Harbour and Bronte Harbour we believe this number would be substantially higher. _____ 1 In a Mediterranean mooring, the bow (front) of the boat is tied to a fixed structure (in the case of the harbours, a dock) while the stern (back) is tied off to two floating devices, customarily tires that are themselves anchored to the bottom of the harbour and that are usually deployed only during the boating season. The boat approaches the shoreline at a perpendicular angle, runs two lines to the shore (dock) and another two to the floating moorings. The advantage of Mediterranean mooring is that many more boats can be accommodated along a fixed length of shoreline as there are no finger docks separating the boats. The disadvantage is that embarking and disembarking the boat must be made from the bow of the boat which is not as easy as, and is less stable than using a finger dock alongside.

Recreational Boating Feasibility and Capacity Study – Phase 1 Final Report June 2014
TOURISTICS + Shoreplan Engineering Limited 9
Figure 5 - Residence of Boat Owners at Seasonal Slips
2.3 Assessment of Infrastructural Features at Boating Facilities The conditions of the existing facilities were reviewed at the three main boating locations within the Region. These locations include LaSalle Park in Burlington, Bronte Harbour and Oakville Harbour. The review was limited to a visual assessment of the facilities and observations of their function and boater use (EXHIBIT 1D and 1E). No surveys, measurements or testing of the structures were undertaken. The review did not include buildings or club houses. Comments with respect to adequacy of fairways are based on a review of aerial photography. A fairway twice the length of a boat using the adjacent dock is considered good and a fairway width of one and one-half of the length of the boat is considered adequate. Water depth requirements depend on boat mix but generally water depths of 1.8 metres are considered adequate for public marinas. Chart datum is taken as reference water level. Comments with respect to stability of docks are based on experiences during site visits and comments received from boaters and may be considered somewhat subjective. Comments regarding launch ramp parking follow published recommendations that suggest 40 car/trailer combination parking spaces are required per launch lane. However, it is recognized that demand for parking varies from location to location and by time of day. Plans of the facilities are provided on the previously noted Figures 1 to 3. The reader should refer to these figures while reading the description in this sub-section of the report. 2.3.1 La Salle Park LaSalle Park provides the base of LaSalle Park Marina and the Burlington Sailing and Boating Club. The facilities are located on or adjacent to the LaSalle Park Pier. The La Salle Park Marina facilities are located on the east side of the pier and include floating docks and a floating breakwater. The docks and the breakwater are removed every fall and reinstated in the spring. The docks and their use are being hampered by excessive wave activity due to a functionally inadequate floating breakwater. Damage to the docks and boats is frequent. The operation of the marina and specifically the provision of proper wave protection for the marina was the subject of a recently completed Class Environmental Assessment (Dillon Consulting Limited, 2013). The Environmental Study Report concludes that a fixed breakwater is the preferred method of resolving the ongoing wave related
57.7% 22.7%
4.4%
15.2%
Oakville Burlington Milton-Halton Hills Outside of Halton Region

Recreational Boating Feasibility and Capacity Study – Phase 1 Final Report June 2014
TOURISTICS + Shoreplan Engineering Limited 10
problems. Any comments with respect to the docks are not material until the basin is properly protected. The spacing of the docks and fairway widths are appropriate for the size of the slips. Water depth is greater than required in most of the basin. Approximately 20 percent of the dock area in the north part of the basin has a water depth of less than 1.8 metres at Chart Datum. Boats with shallow draft are assigned to this part of the basin. The park also includes two launch ramps, one located on the east side of the pier and another located on the west side of the pier. The east ramp is used by the public to launch small to moderate size boats transported on trailers behind cars and trucks. The ramp surface accommodates two launching lanes. The slope of the ramp appears to be within an acceptable slope gradient and deep enough to accommodate launching under a typical range of water levels. Fixed piers and extended floating docks are provided on both sides of the ramp. Segregated parking for the launch ramp is not provided. The west ramp is located directly in front (south) of the Burlington Sailing and Boating Club (BSBC). Although not dedicated for exclusive use of the club, it is not readily accessible from the public parking lot. It is a single lane structure. The launch ramp had a number of problems including rough surfaces and inadequate depth in the past and is presently under re-construction. It is re-designed to operate under the full range of water levels experienced during a typical boating season. The launch ramp is flanked with floating docks installed by BSBC in the spring and removed in the fall. 2.3.2 Bronte Harbour The Bronte Harbour area includes two distinct boating facilities. The Bronte Outer Harbour Marina is located east of the mouth of the Bronte Creek and is a privately operated facility under a long term lease from the Region. The boating facilities within the mouth of the creek include the municipal facilities operating as Oakville Harbour Marina and the Bronte Harbour Yacht Club. The Bronte Outer Harbour Marina is the most recently constructed boating facility on the Halton waterfront. The facility has floating docks. They appear to be stable and well secured. Access to the docks is controlled with security gates. The shore treatments are in good condition. There appears to be no physical deficiencies in these facilities. Reports of excessive wave penetration into the basin under southwest wind conditions were provided by boaters. The docking facilities along the river within the Oakville Harbour Marina are generally arranged directly off the shore walls of the creek with three additional main docks extending into the creek beyond the shore connected docks. Two of the three additional main docks have fingers attached. The third main dock supports boats docked bow-in with stern float anchors. The stability of the main docks and main docks with fingers is considered to be adequate. The stability of the finger docks attached directly to the shore walls is considered poor. The width of fairways varies in various parts of the harbour from adequate to inadequate. There are parts of the harbour where fairways are just equal to the length of boats docked in the area. The seawalls are constructed of various materials but most commonly of concrete blocks or steel sheet piles. The concrete block walls appear to be functional. The walls do not show excessive settlement or lean. The backshore, which is mostly made up of interlocking pavement surfaces or boardwalk also does not show an excessive amount of settlement or movement. This is considered important given that the soils around the harbour are very soft sediments with organic content. There are two launch ramps within the river channel. A public launch ramp is located on the south side of the river and specific car/trailer parking is provided adjacent to the ramp. The launch ramp has two lanes. There are nine parking spots provided which is considered substandard for the launch ramp. Public parking related to the park is available and is configured in such a way that it can be used as overflow for the launch ramp. The ramp surface appears relatively steep but not excessively so. We observed no docks available to assist in launching. A second set of launch ramps are available in the Bronte Harbour Yacht Club compound. These are single lane launch ramps and are separated by a mast crane slip. These launch ramps appear to be available for the use of the club members only.

Recreational Boating Feasibility and Capacity Study – Phase 1 Final Report June 2014
TOURISTICS + Shoreplan Engineering Limited 11
The water depth within the mooring area of the river varies. Oakville undertakes regular dredging operations and dredges the river to 2 m below Chart Datum regularly. The interval between dredging operations is approximately seven years, but may vary. The water depth in the mooring areas will gradually decrease after dredging and the operations will become hindered by reduced water depth over time. Oakville experimented with ongoing dredging operations using a small suction dredge and filtering the dredged material through geotextile bags. The results of the experimental operation are not known at this time. Oakville is also undertaking a sediment management study at Bronte Harbour at present time to better understand the sources of sediment and deposition process in the harbour. 2.3.3 Oakville Harbour Six marinas and boat clubs operate within the river mouth of Sixteen Mile Creek. These include Oakville Harbour Marina – Oakville Harbour, Oakville Yacht Squadron, Oakville Club, Wai Nui O Kanaka Outrigger Canoe Club, Oakville Power Boat Club and the Burloak Canoe Club. Given the multiple operations, the descriptions are provided on club/marina basis. The entrance to Oakville Harbour is formed with two breakwaters. The west breakwater is a steel sheet pile pier with a concrete cap. At the north end of the west breakwater is a short armour stone groyne which extends approximately 30 m into the entrance channel. The armour stone groyne breaks waves that propagate up the entrance channel. The east breakwater is formed by a SSP pier with a concrete cap. Repairs to the east breakwater were carried out in 2012. The Town of Oakville Water Air Rescue Force (TOWARF) is at the north end of the east breakwater. The shore along TOWARF is protected with rip rap and armour stone. Two slips used by TOWARF are located along this section of the shore. The TOWARF facility was not included in the review. The water depth within the mooring areas of Sixteen Mile Creek varies. Oakville regularly dredges the creek to 2 m below Chart Datum. The interval between dredging operations is typically ten years, but may vary. The water depth in the mooring areas will gradually decrease after dredging and the operations will become hindered by reduced water depth over time. Oakville last dredged Sixteen Mile Creek in the fall/winter of 2010. 2.3.4 Oakville Harbour Marina - Oakville Harbour Oakville Harbour Marina operations within Sixteen Mile Creek include three locations. There are operations within the Oyster Bay area near the mouth of the creek, operations within the central part of the harbour south of the Lakeshore Bridge to Randall Street bridge and docking facilities in the uppermost part of the harbour. Each of these locations is described separately. Oyster Bay is the embayment along the west side of the river north of Tannery Park and south of Oakville Yacht Squadron (OYS). Oyster Bay’s shore is protected with a pre-cast concrete block wall and armour stone wall. Oakville is now reconstructing the shoreline protection within Oyster Bay. The pre-cast concrete block wall is being replaced with a boulder berm and armour stone wall. The Oakville Harbour Marina docks within Oyster Bay are floating docks configured in a standard main dock/finger dock arrangement. They extend north from the south shore. The docks are adequate with respect to their width and stability. The width of the fairways within this area varies depending on the position along the dock. They are adequate on the river channel side in some areas and inadequate or substandard in most other areas. Fairways just marginally greater than the length of the boats were noted. The central part of the Oakville Harbour Marina operations includes both sides of the river south of the Randall Street bridge to OYS (Shipyard Park) on the west side and to Oakville Club on the east side. It also includes a launch ramp at the south end of Shipyard Park. The launch ramp is in poor condition and Oakville is in the process of redesigning the ramp as part of their Oakville Harbour West Master Plan redevelopment.

Recreational Boating Feasibility and Capacity Study – Phase 1 Final Report June 2014
TOURISTICS + Shoreplan Engineering Limited 12
The west shore north of the launch ramp is protected with a concrete block wall constructed in the 1990’s. The block wall extends along the shore of Shipyard Park and ends at the north side of Shipyard Lagoon. The wall appears to be in good condition. The shore north of Shipyard Lagoon is protected with an anchored SSP wall that was constructed in 2011. The north portion of the SSP wall under the bridge is protected with an armour stone wall constructed in 2011. North of the armour stone wall, the west shore is natural with no formal structures. Boats along the west shore mostly tie off bow-in along the shore with stern floating anchors. This same arrangement is used within the Shipyard Lagoon. The only exception to this is the shore under and within approximately 25 meters of the Lakeshore Road bridge. Here the docking is provided along a shore parallel floating dock tied off to shore anchor piles. Large boats dock parallel to the dock. The fairways within this part of the river are adequate except at the mouth of the Shipyard Lagoon. The east side of the river, north of the Oakville Club to the south side of the launch ramp near the Randall Street Bridge, is protected with a pre-cast concrete block wall similar in construction to the wall in Shipyard Park. The wall appears to be in good condition. Floating finger docks are secured to the wall and boats tie off to the finger docks. Boats dock either bow or stern-in. The stability of the finger docks is judged to be marginal. North of the Burloak Canoe Club, along the upper reach of the harbour, boats dock along both sides of a shore parallel floating dock. The larger boats dock along the creek side. One shore connection is centrally located along the dock. A set of stairs leads from the shore wall to the northeast corner of the public parking lot off Water Street. The stairs are gated. The dock appears adequate for its width and stability. The fairways are adequate. 2.3.5 Oakville Yacht Squadron The Oakville Yacht Squadron (OYS) is located north of Oyster Bay. The shoreline is protected with a pre-cast concrete block wall and steel sheet pile (SSP) walls. The pre-cast concrete block wall extends along short sections of the north shore of Oyster Bay. The concrete wall appears to be in good condition. The steel sheet pile wall that runs along the south side of the OYS building is poor condition. A mast crane is located near the east end of the wall. The steel sheet pile wall along the east of the OYS site was reconstructed in 2011. It is in good shape and supports a public boardwalk located along the east side of the OYS site. The new wall ends at the public launch ramp at the south end of Shipyard Park. There are two main docks that extend south from the OYS site into Oyster Bay. The boats docks bow-in with stern anchors in a very tight configuration. There are no finger docks. The main docks are stable and width is considered adequate but the use is hindered by the bow of some boats extending over the dock. Boats also dock bow-in along the new wall on the east side of the site. Stern anchors are used to tie-off the boats from the wall. 2.3.6 The Oakville Club The shore along The Oakville Club (OC) from the tennis court to the north side of the building is protected with a SSP wall. The wall is covered with a timber deck. Steel rings are attached either to the cap of the SSP wall or to the timber deck. Boats tie off to the steel rings secured to the SSP wall and deck. Short finger docks supported off the deck provide access to the boats. The wall is rusted and sections of the wall are leaning toward the lake. The shore north of the OC building is protected with a gabion basket wall. The gabion basket wall is covered by a timber deck. Short finger docks supported from the timber deck and gabion baskets provide access to the boats moored along the shore. All boats are docked bow into the shore with stern floating anchors. The fairway, or the open channel of the river, is of appropriate width.

Recreational Boating Feasibility and Capacity Study – Phase 1 Final Report June 2014
TOURISTICS + Shoreplan Engineering Limited 13
2.3.7 Wai Nui O Kanaka Outrigger Canoe Club A steel sheet pile wall extends along the south and north sides of the launch ramp adjacent to the Randall Street bridge, under the bridge and a short distance into the Power Boat Club basin. The wall is heavily rusted at the water line. The Wai Nui O Kanaka Outrigger Canoe Club uses this area and the launch ramp. There appears to be no docks used by the club. The launch ramp surface accommodates one launching lane. The slope of the ramp appears to be within an acceptable slope gradient and deep enough to accommodate launching of the Canoe Club boats. 2.3.8 Oakville Power Boat Club There are two distinct parts to the Oakville Power Boat Club facilities. A basin is located directly north of the Randall Street bridge and additional docking is provided along the east side of the river. Descriptions are provided below for these two parts. The shore along the south side of the Power Boat Club basin is protected with a rip rap revetment. The east and north shore of the basin is protected with a stone filled timber crib. The timbers are round and the stone fill is visible in the gaps. A timber deck extends along the top of the crib. The deck is uneven. Vertical steel piles are intermittently driven in front of the crib. They may be used to support the deck. Some of the vertical piles are leaning into the basin. Overall, these structures are in very poor condition and their stability is uncertain. Finger docks supported on steel tube piles are located along the east and west sides of the basin. A floating main dock with fingers extends south from the north shore of the basin. Boats dock along shore-parallel floating docks on the south shore. The stability of the main and finger docks is unknown. The fairway width in the basin varies from inadequate to adequate. The north side of the entrance to the basin and the east shore of the creek north of the entrance are protected with gabion baskets. The baskets are broken and they have lost their stone fill. A timber deck supported on steel tube piles covers the gabion baskets along this shoreline. The portions of the structure reviewed are considered to be in poor condition. Finger docks supported on steel tube piles and channels extend from the deck into the creek. The docks are narrow but appear to be stable. The docks are constructed using various types and sizes of materials and do not appear to be designed to a uniform appearance and standard. Fuel can be purchased at the Power Boat Club. The fuel dock is supported on steel tube piles. A gas pump and a store are located on shore. Boats can moor along either side of the fuel dock. The dock appears narrow and stable. 2.3.9 Burloak Canoe Club The Burloak Canoe Club is located north of the Power Boat Club. A shore parallel dock, supported on steel tube piles, extends north along the east shore of the creek. Boats are moored along the dock and the dock appears stable. The fairway, or open channel of the river, is adequate. 2.4 Other Boating Facilities in Halton In addition to the marinas and yacht clubs, Halton is also home to four boating clubs (Burloak Canoe Club, Burlington Sailing and Boating Club, Burlington Beach Catamaran Club, Wai Nui O Kanata Outrigger Canoe Club) catering to non-motorized boating activities. The four clubs offer opportunities for participation with canoes, outrigger canoes, kayaks, war canoes, dragon boats, dinghies, keel boats, paddle boats and stand up paddle boards (EXHIBIT 2). All of these boating facilities report an increase in the number of programs offered and participants in these programs in 2013. The programs are offered to both children and adults. The Burlington Sailing and Boating Club and Wai Nui O Kanata Outrigger Canoe Club also offer programs for the disabled. The Oakville Club, Oakville Yacht Squadron and Bronte

Recreational Boating Feasibility and Capacity Study – Phase 1 Final Report June 2014
TOURISTICS + Shoreplan Engineering Limited 14
Harbour Yacht Club offer junior and adult sailing schools for their members, and indicate that the numbers of participants in their sailing programs are also growing. The Oakville Yacht Squadron and Bronte Harbour Yacht Club also offer sailing lessons to the general public. The Bronte Harbour Yacht Club also offers a one week blind sailing program each summer. Kelso Conservation Area, Mountsberg Conservation Area and Fairy Lake in the northern part of Halton and Burloak Waterfront Park offer an opportunity for use of canoes, kayaks, paddle boats, stand up paddle boards, and small aluminum boats. Motorized boats are prohibited at Kelso, but boats with electric trolling motors are permitted at Mountsberg and Fairy Lake. There are no restrictions on motorized boats at Burloak Waterfront Park but physical barriers exist that limit access to the lakeshore. Mountsberg Reservoir caters mostly to fishermen than to the other forms of boating and sees as many as 200 boats involved in fishing on a good day. As a result of the tree stumps and occasional low water levels, stand up paddle boards are not encouraged at Mountsberg. Fairy Lake is also used more by fishermen than other forms of boating. The Town of Halton Hills does not monitor the level of use on the Lake; as a result there are no data available regarding the different activity uses. Kelso offers boat rentals from late April to early October for single and double kayaks, canoes, paddle boats, and stand up paddle boards (EXHIBIT 3). 2.5 Comparison of Halton’s Boating Facilities with those of the GTA/Golden Horseshoe Area 2.5.1 Boating Facilities There are 41 boating facilities in the GTA/Golden Horseshoe Area between Scarborough in the east and St. Catharines in the west. Of these 14 are marinas and the remaining 27 are yacht, sailing and cruising clubs. 2.5.2 Amenities and Services The 41 boating facilities offer 9,339 slips or moorings of which 8,833 are seasonal and 506 dedicated as transient or reciprocal slips or moorings. 1,830 of the slips are less than 30 feet; 4,361, 30 feet to less than 36 feet; 2,077, 36 feet to less than 46 feet; and 800, 46 feet and over (EXHIBIT 4A). Twenty two of the facilities provide a fuel dock. Thirty two have a pump out. There are 29 launch ramps available for use by boats typically 26 feet or less in length (i.e. 7.9 metres). Almost 80 percent (78.6%) of the slips (i.e. 7,130) have access to 30 or more amp. power. More than 85 percent (87.4%) of the 8,709 seasonal boats can be accommodated on-site for winter storage (EXHIBIT 4B). 2.5.3 Seasonal and Transient Slip Users During the 2013 boating season 98.6 percent of the 8,833 seasonal slips were occupied. The remaining slips were not occupied due to long-term maintenance repairs and unsuitable lengths for the boats requiring a slip. Seasonal boats were almost evenly split between power (50.9%) and sail (49.1%). There were 1,450 boats on the waiting lists of the 41 facilities with 22 percent looking for a slip 46 feet or more in length (EXHIBIT 4C). This represents an additional 16.4 percent of needed supply. 2.5.4 Facilities in Halton Compared with the GTA/Golden Horseshoe Area As shown in Table 2 following, although the occupancy rates and percentage of slips by length are similar, boaters at marinas and yacht clubs in Halton appear to be less well served than those in GTA/Golden Horseshoe area. As a percentage of total slips available, the GTA/Golden Horseshoe area offers twice as many transient slips as Halton and as a percentage of facilities, twice as many fuel docks. Although a higher percentage of facilities in the GTA/Golden Horseshoe area offer a pump out service, the number of slips per pump out is similar (i.e. 292 versus 336 in Halton). Both areas have insufficient

Recreational Boating Feasibility and Capacity Study – Phase 1 Final Report June 2014
TOURISTICS + Shoreplan Engineering Limited 15
on-site capacity to accommodate all the seasonal boats for winter storage (i.e. 70.8% in Halton versus 87.4% in the GTA). The demand for additional slips is much higher in Halton than the GTA as expressed by the number of boats on the waiting list as a percentage of occupied seasonal slips (i.e. 37.1% in Halton versus 16.9% in the GTA/Golden Horseshoe area). Table 2 - Boating Facilities in Halton Compared to the GTA/Golden Horseshoe Area Halton GTA/Golden Horseshoe Area Number of Marinas, Yacht, Sailing and Power Boat Clubs
8 41
Seasonal Slips Occupied 1,310 96.8% 8,833 98.6% Transient Slips as Percentage of Total Slips
2.5% 5.4%
Percentage of Slips <30 feet 33.2% 20.2% Percentage of Slips 30 feet to <36 feet 44.0% 48.1% Percentage of Slips 36 feet to <46 feet 20.2% 22.9% Percentage of Slips 46 feet and over 2.6% 8.8% Percentage of Facilities with Fuel Docks 25% 53.7% Number of Slips Per Fuel Dock 672 424 Percentage of Facilities with Pump Out 50% 78.0% Number of Slips Per Pump Out 336 292 Percentage of Facilities with Launch Ramp
37.5% 53.6%
Percentage of Slips with 30 amp or more power
51.5% 78.6%
Percentage of Seasonal Boats Accommodated On-site for Winter Storage
70.8% 87.4%
Number of Boats on Waiting List 470 1,470 Boats on Waiting List as a Percentage of Occupied Seasonal Slips
37.1% 16.9%
Source: EXHIBIT 1 and EXHIBIT 4 2.5.5 Marina Rates and Fees in Halton Compared with the GTA/Golden Horseshoe Area We have compared the rates and fees to be charged at Bronte Outer Harbour Marina, Bronte Harbour, Oakville Harbour, and LaSalle Park Marina during the 2014 boating season with those at eleven marinas in the GTA/Golden Horseshoe Area offering the same facilities and services (EXHIBIT 5). These services include:
• Slip with at least 30 amp power and water;
• Summer land storage; • Cradle/trailer storage; • Mast stepping/un-stepping; • Pump out service;
• Transient slip; • Launch ramp; • Haul-out or launch; and, • Winter storage.
Outer Harbour Marina in Toronto has the highest seasonal slip rental at $94.45 per linear foot, followed by Fifty Point Marina in Winona at $92.60 and LaSalle Park Marina the least expensive at $66.00 per linear foot. The rates charged at Bronte Outer Harbour Marina, Bronte Harbour, Oakville Harbour, and LaSalle Park Marina are comparable with those in the GTA/Golden Horseshoe Area given the product offering. Outside of Halton only Lakefront Promenade at $66.37 per foot and Port Credit Harbour Marina at $68.33 per foot are lower than Bronte Outer Harbour Marina at $73.00 per linear foot. The fees for summer land storage, cradle/trailer storage, mast stepping/un-stepping, pump out services, transient slip rentals, use of the launch ramp, and haul-out or launch are similar at all fifteen marinas and harbours.

Recreational Boating Feasibility and Capacity Study – Phase 1 Final Report June 2014
TOURISTICS + Shoreplan Engineering Limited 16
We compared the cost of winter storage based on a per square foot package cost for a 30 foot boat with a beam of 10 feet.1 While winter storage at Bronte Outer Harbour at $5.35 per square foot is only exceeded by the $5.60 per square foot charged at Outer Harbour Marina in Toronto the rates charged at Bronte and Oakville Harbours and by the Burlington Sailing & Boating Club at LaSalle Park are in keeping with those at other facilities outside Halton (EXHIBIT 5 and 6). In fact, the winter storage rate charged by the Burlington Sailing & Boating Club is the lowest at $2.28 per square foot or approximately one-half of that charged at Bronte Harbour (i.e. $4.01/sq. ft.) and St. Catharines Marina (i.e. $4.00/sq. ft.) the next lowest two. As a further analysis of the rates charged within Halton and the GTA/Golden Horseshoe Area we undertook to compare them based on 17 facilities and services considered by boaters to be the most desirable features in a marina (EXHIBIT 7).2 Each of the 15 marinas was evaluated based on features and values. Where a marina had a feature or service, but it was considered in need of improvement a lesser value was assigned (i.e. 4 rather than 5 for docks, 2 rather than 3 for a launch ramp) (EXHIBIT 8). Based on this assessment Harbour West Marina in Hamilton was the only marina receiving a maximum 62 point facility rating. Bronte Outer Harbour Marina received a score of 56, Bronte Harbour 44, LaSalle Park Marina 43, and Oakville Harbour 40, (Table 3). Improvements are planned Bronte Harbour, LaSalle Park Marina, and Oakville Harbour which will improve these scores. 2.5.6 Annual Rate Increases Our interviews with marina operators throughout the GTA/Golden Horseshoe Area indicated that annual rate increases are typically held to three to four percent due to the highly competitive nature of the market place and the fear of losing boaters if rates are increased too much in one season. Since there are no indications that marina operating costs will decrease in the future, it is expected that rates will continue to rise at this rate. One-time increases above three to four percent do occur when additional revenue is required for capital improvements. Rate increases at Bronte Outer Harbour Marina, Bronte and Oakville Harbours, and LaSalle Park Marina have consistently fallen within the area norms. LaSalle Park Marina uses the Bank Of Canada Consumer Price Index (CPI) as a minimum in setting their annual rates. When above normal increases in rates are necessary, it is good business practice to inform the long-term boaters as to the reason for this need (i.e. unusually high dredging costs, winter storm damage, major infrastructure improvements, etc.). It also has to be realized that operating marinas is a business and businesses at worst are expected to break-even but more realistically are expected to be revenue-positive. An annual capital reserve for replacement of 10 to 12 percent of gross revenue when possible is generally sufficient to cover major capital improvements within the 20 to 25 year life cycle of the marinas’ major infrastructure features and should be included in all marina and harbour budgets.. _____ 1 Winter storage package includes (haul-out, bottom wash, storage, launch) 2 50 boat owners were interviewed at the Toronto International Boat Show between January 12 and 18, 2014 regarding the features they felt were most desirable at a home marina. They were then asked to rate each feature on a scale of 1 to 5, with 5 being the most desirable. The rating values are virtual the same as those used in the Association of Oakville Harbours’ Stakeholders 2012 Rates and Fees Study

Recreational Boating Feasibility and Capacity Study – Phase 1 Final Report June 2014
TOURISTICS + Shoreplan Engineering Limited 17
Table 3 - Evaluation of Halton’s Harbours Boating Facilities
Facility Facility Rating Missing or Features in Need of Improvement
Bronte Outer Harbour Marina 56 No launch ramp, repair service or laundry facilities
Bronte Harbour 44 Finger docks in need of improvement; No pump out, fuel dock, WiFi connection, laundry facilities; Staff not available for assistance, launch ramp needs improvement
LaSalle Park Marina 43 Docks in need of improvement; potable water and 30 amp power not available at all finger docks; No fuel dock, repair services, marine supplies, mast crane or laundry facilities; Staff not always available for assistance, launch ramps needs improvement
Oakville Harbour 40 Docks in need of improvement; No 24 hour security, fuel dock, WiFi connection, repair services, marine supplies, laundry facilities; Staff not available for assistance, launch ramp needs improvement
Source: EXHIBIT 7 and 8

Recreational Boating Feasibility and Capacity Study – Phase 1 Final Report June 2014
TOURISTICS + Shoreplan Engineering Limited 18

Recreational Boating Feasibility and Capacity Study – Phase 1 Final Report June 2014
TOURISTICS + Shoreplan Engineering Limited 19
SECTION 3 – PROFILE OF BOATERS AND POPULATION CHARACTERISTICS 3.0 Introduction This section provides a socio-demographic profile of boaters in Ontario; an indication of how these socio-demographic characteristics compare with those of Halton’s residents; projections of Halton’s population between 2013 and 2031; and projected participation rates for a number of the existing boating activities in Halton. 3.1 Socio-demographic Profile of Sail and Power Boaters In 2011, 14.5 percent of Ontario’s population 16 or over participated in boating.1 The participation rate by males (i.e. 15.8%) is only slightly higher than that for females (i.e. 13.3%). For both males and females the highest participation rate is in the 35 to 44 and 45 to 54 age group (i.e. 22.9% and 19.0% respectively for males and 18.9% and 16.3% respectively for females) (Figure 6). Power and sail boaters are represented in all levels of attained education, although those with some university education and those with a university degree are the highest at 21.2 percent and 25.5 percent respectively. While boating also appeals to all employment categories, those employed in professional, administrative and managerial, and skilled labour positions have the highest participation rates at 28.8 percent and 24.6 percent respectively. The largest number of boaters come from households earning $40,000 to $74,999, although the highest participation rate is within those from households earning $100,000 or more. 3.2 Socio-demographic Characteristics of Burlington, Oakville and Halton Residents There are 493,045 persons living in Halton, including 174,780 residing in Oakville, and 173,761 in Burlington according to the Best Planning Estimates, June 2011. It is evident when looking at the socio-demographic characteristics that have the highest propensity to participate in boating (e.g. education, occupation, household income) that Halton, Oakville and Burlington are a strong market for power and sail boating participation. Among males 35 to 44, the age group with the highest participation in boating (i.e. 22.9%), Halton and Oakville are slightly under-represented when compared to the province (i.e. 15.6% and 15.0% respectively, compared to 15.8% for Ontario. The second highest participation rate among males falls in the 45 to 54 year age category (i.e. 19.0%); in this case all three areas are over-represented when compared to the province (i.e. 16.3%, 17.5%, 16.0% and 15.3% respectively) (EXHIBIT 9 and Figure 6). A similar pattern occurs with the proportion of females compared to the province. The proportion of the female population within Halton (i.e. 16.0%), and Oakville (i.e. 16.2%), is over-represented compared to the province (i.e. 15.7%) in the 35 to 44 age group which has the highest participation rate in boating (i.e. 18.9%). Females in the 45 to 54 age group, the category with the second highest participation rate in boating (i.e. 16.3%) are over-represented in all three areas when compared to the province with Oakville being the most over-represented (i.e. 17.3% vs. 15.3%). Burlington is the least over-represented at 15.8% followed by Halton Region at 15.9%. In our meeting with the Association of Oakville Harbours’ Stakeholders the Commodores noted that the majority of their members fell in the 45 to 54 age group. The higher the level of education attained, the higher the level of participation in boating as shown by a 21.2 percent participation rate for those with some university education and 25.5 percent for those with a degree. All three areas are all well over-represented compared to that of the province among those with a university degree (i.e. Halton 26.3%; Oakville 32.6%; and Burlington 23.7%) compared to 20.5% for the province. Those with some university education are also over-represented in all three geographic market areas when compared to the percentage of all those in Ontario (i.e. 4.7%, 5.6%, 4.5% compared to 4.1% respectively). _____ 1 Statistics Canada, General Social Survey and Ontario Ministry of Tourism, Culture and Sport

Recreational Boating Feasibility and Capacity Study – Phase 1 Final Report June 2014
TOURISTICS + Shoreplan Engineering Limited 20
Figure 6 - Boating1 Participation in Ontario
1 Includes in-board and out-board motor boating and sailing, excludes canoeing, kayaking and motorized personal watercraft
5.3%
14.1%
16.3%
18.9%
15.4%
12.5%
3.4%
9.8%
13.3%
8.9%
16.6%
19.0%
22.9%
17.8%
14.7%
3.7%
11.8%
15.8%
3.6%
10.8%
14.5%
0% 5% 10% 15% 20% 25%
65+
55 to 64
45 to 54
35 to 44
25 to 34
16 to 24
Sailing
Motor Boating
Boating
Females
65+
55 to 64
45 to 54
35 to 44
25 to 34
16 to 24
Sailing
Motor Boating
Boating
Males
Sailing
Motor Boating
Boating
Percentage of any group age 16 or over that participated in boating at any time in 2011
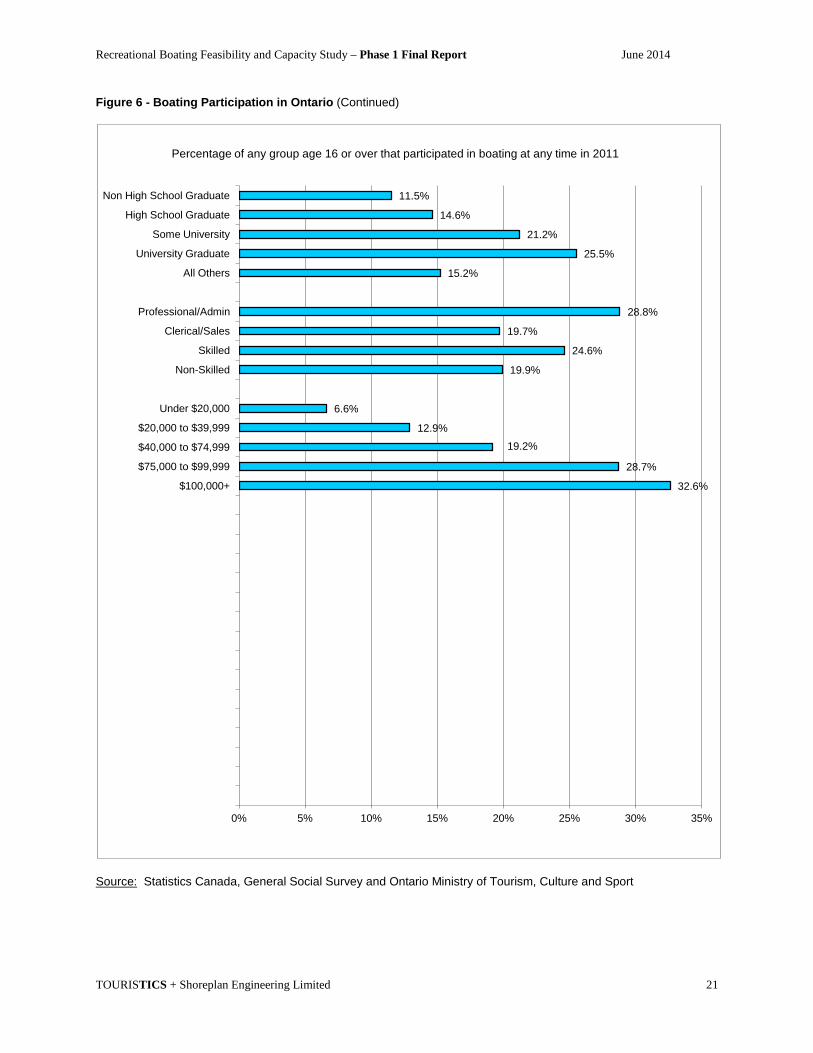
Recreational Boating Feasibility and Capacity Study – Phase 1 Final Report June 2014
TOURISTICS + Shoreplan Engineering Limited 21
Figure 6 - Boating Participation in Ontario (Continued)
Source: Statistics Canada, General Social Survey and Ontario Ministry of Tourism, Culture and Sport
32.6%
28.7%
19.2%
12.9%
6.6%
19.9%
24.6%
19.7%
28.8%
15.2%
25.5%
21.2%
14.6%
11.5%
0% 5% 10% 15% 20% 25% 30% 35%
$100,000+
$75,000 to $99,999
$40,000 to $74,999
$20,000 to $39,999
Under $20,000
Non-Skilled
Skilled
Clerical/Sales
Professional/Admin
All Others
University Graduate
Some University
High School Graduate
Non High School Graduate
Percentage of any group age 16 or over that participated in boating at any time in 2011

Recreational Boating Feasibility and Capacity Study – Phase 1 Final Report June 2014
TOURISTICS + Shoreplan Engineering Limited 22
Occupation is a socio-demographic characteristic that is also a strong determinant of participation in boating. Within Halton, Oakville and Burlington there are proportionally more individuals in professional/managerial/administrative occupations (i.e. 53.1%, 57.1%, and 41.9% respectively compared to the province’s 45.7%), the occupation category with the highest participation level in boating (i.e. 28.8%). On the other hand, skilled labour persons who have the second highest participation rate in boating (i.e. 24.6%) are under-represented in all three geographic areas (i.e. 18.1% in Halton, 16.1% in Oakville, and 17.7% in Burlington) compared to 21.1 percent in Ontario. Despite being under-represented in skilled labour there are still approximately 51,400 individuals in Halton employed in this category, 16,000 in Oakville, and 17,600 in Burlington. Household income is the strongest determinant for participation in boating. Median household income in Halton is 38.1 percent higher than the province (i.e. $83,496 versus $60,455). In Oakville the median household income ($92,394) is 52.8 percent higher and in Burlington ($74,969) 24.0 percent higher than the province. Within the income group $75,000 to $99,999; which has the second highest participation rate in boating (i.e. 28.7%), all three areas are under-represented: Halton by 1.4 percent, Oakville by 3.3 percent and Burlington by 1.1 percent (i.e. 12.1%, 10.2%, and 12.4% respectively compared to 13.5% for Ontario). Households with an average income of $100,000 or more have the highest participation rate in power and sail boating at 32.6 percent. In this case, all three areas are well over-represented when compared to the rest of Ontario, with Halton at 45.4 percent, Oakville at 49.2 percent, and Burlington at 39.3 percent compared to the province’s 16.8 percent. 3.3 Projected Population of Halton 2013 to 2031 There are no data available other than by age and gender characteristics which project the population of Halton over the next twenty year period. Therefore we have used the Region’s Best Planning Estimates, June 2011, as a base along with the Ontario Ministry of Finance’s, Ontario Population Projection Update, 2009-2036, Spring 2013, and Greater Golden Horseshoe Growth Forecasts to 2041, Technical Report, November 2012, Hemson data to arrive at projections for each year (EXHIBIT 10). The population of Halton 25 and older1 is projected to increase from 359,130 in 2013 (169,920 males, 189,210 females) to 403,630 by 2018 (196,670 males, 206,960 females), to 451,670 by 2023 (220,220 males, 231,450 females), to 498,180 by 2028 (243,520 males, 254,660 females), and reach 528,100 by 2031 (258,250 males, 269,850 females), (Figure 7). This represents a 47 percent increase in the population between 2013 and 2031. During this same time period the population of Ontario 25 and older is projected to increase by only 25.5 percent from 9,614,530 (4,661,300 males, 4,953,230 females) in 2013, to 12,064,180 (5,850,820 males, 6,213,360 females) in 2031 (EXHIBIT 11). The period between 2011 and 2031 will also see a 53.9 percent increase in employment in Halton while that of the province will increase by 26.8 percent.2 The increased growth in the age groups with high participation rates in boating (i.e. 35 to 44 and 45 to 54) and employment in Halton indicates a likely large increase in the demand for recreational boating activities and a larger share of Ontario’s power and sail boaters (Figure 8). 3.4 Projected Growth in Boating Activities Between 2011 and 2030 participation in power boating, sailing, canoeing, kayaking and rowing are all projected to increase. There are no comparable projections available for outrigger canoeing, paddle boating, and stand up paddle boarding, although anecdotal information based on the increased number of members at area clubs suggests that participation in these activities is also in a growth mode. ____ 1Very few power or sail boats are owned by those under 25 2Greater Golden Horseshoe Growth Forecasts to 2041, Hemson Consulting Limited, 2012 and Ontario’s Long-Term Report on the Economy, Ministry of Finance, 2010

Recreational Boating Feasibility and Capacity Study – Phase 1 Final Report June 2014
TOURISTICS + Shoreplan Engineering Limited 23
Figure 7 - Halton Population Projections 2011 to 2031 (25 and over)
Note: Few boats are owned by those under 25, and the 25 to 64 age group categories have the highest participation rates in power and sail boating Based on data provided by Statistics Canada, General Social Survey and Ontario Ministry of Tourism, Culture and Sport (Figure 9) participation in power boating, sailing, canoeing, kayaking and rowing is projected to increase over the 20 years between 2011 and 2030 as follows:
• Power boating - 2011 (10.8%) 2020 (13.0%) 2030 (14.6%) • Sailing - 2011 (3.6%) 2020 (4.3%) 2030 (4.8%) • Canoeing - 2011 (6.8%) 2020 (7.6%) 2030 (8.3%) • Kayaking - 2011 (2.4%) 2020 (4.4%) 2030 (5.4%) • Rowing - 2011 (3.0%) 2020 (3.1%) 2030 (3.3%)
Based on these projected participating rates the number of male power and sail boaters in Halton in the age groups with the highest participation rates (i.e. 35 to 44 and 45 to 54) are expected in increase from 16,560 in 2013 to 17,440 in 2018, to 18,450 in 2023, to 20,140 in 2028 and reach 21,380 by 2031. Females in the same two age group categories are projected to increase from 14,560 in 2013, to 14,900 by 2018, to 15,830 by 2023, to 17,240 by 2028, and reach 18,240 by 2031. This represents a 29 percent increase in the number of male power and sail boaters and a 23 percent increase in the number of female power and sail boaters in Halton (Figure 10). Given that the slips and moorings in Halton were at capacity in 2013, there will be an increased need for additional slips in Halton each year between 2014 and 2031.
0
10,000
20,000
30,000
40,000
50,000
60,000
70,000
80,000
Mal
e
Fem
ale
Mal
e
Fem
ale
Mal
e
Fem
ale
Mal
e
Fem
ale
Mal
e
Fem
ale
Mal
e
Fem
ale
2011 2011 2013 2013 2018 2018 2023 2023 2028 2028 2031 2031
Popu
latio
n of
Hal
ton
Reg
ion
25 a
nd o
lder
Year
25 to 34 35 to 44 45 to 54 55 to 64 65+

Recreational Boating Feasibility and Capacity Study – Phase 1 Final Report June 2014
TOURISTICS + Shoreplan Engineering Limited 24
Figure 8 - Projected Growth in Halton’s Share of Ontario’s Power and Sail Boaters
Note: Based on number of males and females 25 years of age and older Figure 9 - Projected Growth in Percentage of Ontario’s Population Participating in Selected Boating Activities
Source: Statistics Canada, General Social Survey; Ontario Ministry of Tourism, Culture and Sport
0.0
0.5
1.0
1.5
2.0
2.5
3.0
3.5
4.0
4.5
5.0
Mal
es
Fem
ales
Mal
es
Fem
ales
Mal
es
Fem
ales
Mal
es
Fem
ales
Mal
es
Fem
ales
2013 2018 2023 2028 2031
Halto
n's P
erce
ntag
e of
Ont
ario
's Po
wer
& S
ail
Boat
ers
Year
11.6 13.2
14.5 16.5
17.4 18.4
19.6
6.8 7.1 7.6 8 8.3
0
5
10
15
20
25
2000 2006 2010 2015 2020 2025 2030
Perc
enta
ge o
f Pop
ulat
ion
16 o
r ove
r Pa
rtic
ipat
ing
Year
Power & Sail Boating Power Boating Sailing
Canoing Kayaking Rowing

Recreational Boating Feasibility and Capacity Study – Phase 1 Final Report June 2014
TOURISTICS + Shoreplan Engineering Limited 25
Figure 10 - Projected Growth in Number of Power and Sail Boaters in Halton (2013 to 2031)
0
2,000
4,000
6,000
8,000
10,000
12,000
14,000
Mal
es
Fem
ales
Mal
es
Fem
ales
Mal
es
Fem
ales
Mal
es
Fem
ales
Mal
es
Fem
ales
2013 2018 2023 2028 2031
Num
ber o
f Pow
er &
Sai
l Boa
ters
25 to 34 (17.8% & 15.4% participation) 35 to 44 (22.9% & 18.9% participation)
45 to 54 (19.0% & 16.3% participation) 55 to 64 (16.6% & 14.1% participation)
65+ (8.9% & 5.3% participation)

Recreational Boating Feasibility and Capacity Study – Phase 1 Final Report June 2014
TOURISTICS + Shoreplan Engineering Limited 26

Recreational Boating Feasibility and Capacity Study – Phase 1 Final Report June 2014
TOURISTICS + Shoreplan Engineering Limited 27
SECTION 4 – EXISITING AND PROJECTED NUMBER OF BOATS IN ONTARIO 4.0 Introduction Since 100 percent of the market for seasonal slips and moorings along the waterfront in Halton will come from Ontario1 and over 95 percent of the market for transient slips will come from Ontario and New York2, we have concentrated our analysis regarding the number, length, beam and draft of these boats on these two geographic areas. For purposes of comparison, similar numbers have been included in the EXHIBITS at the end of this report for the neighbouring states of Pennsylvania and Michigan. 4.1 Historical Number of Boats by Length, Beam and Draft, 2007 to 2012 Since few boats under 6 metres (i.e. 20 feet) venture onto the Great Lakes for any extended period of time, primarily for safety reasons, and there is a high propensity to trailer boats under 6 metres in length to launch ramps for their use rather than occupying a marina slip or moorage, we have only considered those boats 6 metres or longer as a base of comparison for our projections of Halton’s potential need for additional slips. As shown in EXHIBIT 12, in 2012 there were approximately 112,180 registered power and sail boats of this size in Ontario, and 41,640 in New York State. The number of boats under 6 metres has increased an average of 0.6 percent per annum in Ontario, and -1.1 percent in New York State. There was a slight increase in 2012 over 2011 in New York State. Boats 6 metres or more on the other hand have increased 3.1 percent per annum in Ontario. Those in New York have decreased by 1.0 percent each year between 2007 and 2011, with only 2012 again showing an increase over 2011. Our interviews with government officials, boat manufacturers and marina owner/operators in Ontario, and New York indicate that the stronger economic growth in Canada until 2008 and confidence in a return to a stronger economy in 2011 and 2012 after the downturn of 2008-2010 were the reasons why Ontario boaters bought larger boats as first time buyers or traded-up for larger boats as repeat buyers at a faster rate than those in New York. Our interviews with U.S. officials did indicate there are positive signs for an economic recovery in New York State beyond 2012. Boat manufacturers and boaters also tell us that the movement toward bigger boats results from a movement away from cottage ownership. Larger boats in some cases have as many staterooms as cottages have bedrooms. The typical drive to a cottage in Ontario is 1½ to 2 hours whereas to a seasonal slip it is normally 30 minutes or less. EXHIBIT 16 at the end of this report indicates that in 2012 Ontario had 42.6 percent (1,130,088) of the registered power and sail boats in Canada, Quebec was second at 20.0 percent (531,080) and British Columbia third at 14.2 percent and 376,696 boats. 4.1.1 Length The length or length overall (LOA) is the maximum length of the boat’s hull measured parallel to the waterline. It is the most commonly used way of expressing the size of a boat, and is used for calculating the cost of a marina slip lease. The number of boats 6 metres to less than 8 metres (i.e. 20 ft. to less than 26 ft.) has increased 2.0 percent per annum between 2007 and 2012 in Ontario, and decreased 2.0 percent per annum in New York. These are the boats that are typically used for fishing, water skiing and wakeboarding and are trailered to a launch ramp for each activity day (Figure 11). Boats 8 metres to less than 9 metres (i.e. 26 ft. to less than 30 ft.) have increased 2.4 percent per annum in Ontario, and 0.6 _____ 1 According to a recent study conducted by the National Marine Manufacturers Association the maximum distance boaters prefer to travel to a marina to use their boat on a regular basis is 50 kilometres or approximately 30 minutes driving time 2 According to a survey conducted by the U.S. Department of Transportation, Michigan Department of Natural Resources, and Michigan State University, Department of Parks, Recreation and Tourism Resources 94 percent of boater’s days away from their home marina are spent within 80 nautical miles

Recreational Boating Feasibility and Capacity Study – Phase 1 Final Report June 2014
TOURISTICS + Shoreplan Engineering Limited 28
percent in New York. Those 9 metres to less than 11 metres (i.e. 30 ft. to less than 36 ft.) have increased 5.8 percent per annum in Ontario, and 1.7 percent in New York. Boats 11 metres to less than 14 metres (i.e. 36 ft. to less than 46 ft.) have increased 5.1 percent per annum in Ontario, and 1.7 percent in New York State. In each market the greatest annual percentage increase took place in those boats 14 metres or more in length or 46 feet or more (i.e. 5.9 percent per annum in Ontario, and 4.6 percent in New York), (Figure 12 and Figure 13). Our discussions with boating officials and marina owner/operators in New York indicated that the wealthier boaters owning the largest boats have been less affected by the poor economy in the United States since 2007. Boats in these five size categories are the ones that are currently using the slips and moorings at the eight facilities in Halton Region. Figure 11 - Historical Growth of Ontario’s and New York’s Recreational Boats - 6 metres to less than 8 metres (2007 to 2012)
Figure 12 - Historical Growth in Length of Largest Ontario’s Recreational Boats (2007 to 2012)
58,019 59,392 60,823 62,284 63,033 63,796
19,977 19,450 18,549 18,156 17,800 17,933
0
10,000
20,000
30,000
40,000
50,000
60,000
70,000
2007 2008 2009 2010 2011 2012
Num
ber o
f Boa
ts
Year
Ontario
New York
11,208 11,443 11,720 12,010 12,283 12,556
14,365 15,295
16,145 16,819 17,622
18,525
8,869 9,394 9,843 10,206 10,682 11,129
4,775 5,114 5,335 5,580 5,874 6,178
0
2,000
4,000
6,000
8,000
10,000
12,000
14,000
16,000
18,000
20,000
2007 2008 2009 2010 2011 2012
Num
ber o
f Boa
ts
Year
8 to <9 m 9 to <11 m 11 to <14 m 14+ m

Recreational Boating Feasibility and Capacity Study – Phase 1 Final Report June 2014
TOURISTICS + Shoreplan Engineering Limited 29
` Figure 13 - Historical Growth in Length of Largest New York State’s Recreational Boats (2007 to 2012)
4.1.2 Beam The beam of a boat is its width at the widest point measured at the vessel’s normal waterline. Within Ontario and New York there were approximately 569,910 and 238,120 power and sail boats respectively with a beam of 2 metres to less than 3 metres (i.e. 6 ft. 6” to less than 10 ft.); 21,860 and 9,424 respectively from 3 metres to less than 4 metres (i.e. 10 ft. to less than 13 ft.); and 10,800 and 6,020 respectively with a beam of 4 or more metres (i.e. 13 ft. or more) in 2012. Between 2007 and 2012, the number of boats in Ontario with a beam of 2 metres to less than 3 metres saw an increase of 0.8 percent annually. Those with a beam of 3 metres to less than 4 metres and 4 metres and wider increased 5.8 percent and 5.9 percent per annum respectively. The increase in the beam of boats in New York State is less dramatic. Boats with a beam of 2 metres to less than 3 metres decreased 1.0 percent per annum, while those 3 metres to less than 4 metres and 4 metres and wider increased by 0.4 percent and 1.0 percent each year (EXHIBIT 13). What is clearly evident from these numbers is that boats are getting longer and wider and marinas will need to recognize this if they wish to maintain or possibly increase their share of the Ontario and New York State boater market. 4.1.3 Draft Draft is the vertical distance of a boat between the waterline and the bottom of the hull or keel in the case of a sail boat. Draft determines the minimum depth of water a boat can safely navigate. As boats have grown in length and beam (width) between 2007 and 2012, their draft has also increased though at a much more uniform rate than length and width. EXHIBIT 14 demonstrates that in Ontario the rate of annual increase for boats with a draft of 0.61 metres to less than 1.52 metres (i.e. 2 ft. to less than 5 ft.) was 0.8 percent per annum while New York showed a decrease of 1.0 percent per annum. Those boats in Ontario with a draft of 1.52 metres to less than 1.83 metres (i.e. 5 ft. to less than 6 ft.) and 1.83 metres and more (i.e. 6 ft. or more) increased 2.6 percent and 3.1 percent each year respectively. Boats in New York showed the largest percentage increases in the 1.52 metres to less than 1.83 metres and 1.83 metres and more draft categories; 1.4 percent each year in the former and 0.9 percent each year in the latter.
5,432 5,332 5,325 5,333 5,403 5,596
6,433 6,393 6,389 6,399 6,558
6,998
6,655 6,727 6,690 6,683 6,870 7,216
3,161 3,161 3,205 3,244 3,339 3,594
0
1,000
2,000
3,000
4,000
5,000
6,000
7,000
8,000
2007 2008 2009 2010 2011 2012
Num
ber o
f Boa
ts
Year
8 to <9 m
9 to <11 m
11 to <14 m
14+ m

Recreational Boating Feasibility and Capacity Study – Phase 1 Final Report June 2014
TOURISTICS + Shoreplan Engineering Limited 30
4.2 Projected Number of Boats Based on our discussions with boating officials and boat manufacturers/builders in Canada and the United States, we have projected that the total number of boats in Ontario less than 6 metres (i.e. less than 20 feet in length) will increase from approximately 1,022,500 in 2013, to 1,079,900 by 2031, an increase of 5.6 percent over that period. Those 6 metres or more in length will increase from approximately 114,900 in 2013, to 129,500 in 2018, to 143,200 by 2023, to 155,700 by 2028, and reach approximately 163,000 by 2031, an increase of 41.8 percent over that period. Our discussions with boating officials in New York and the National Marine Manufacturers Association (NMMA) in Chicago indicates that that the total number of boats in New York State 6 metres or more in length will increase from approximately 42,000 in 2013, to 43,900 in 2018, to 45,600 in 2023, to 47,000 in 2028, and reach approximately 47,700 by 2031, an increase of approximately 13.6 percent over that period. Ontario’s growth in boats 6 metres or more in length is three times that of New York State. Based on the data provided to us, we have projected a greater increase for Ontario compared to New York because economists are predicting that the recovering economy in Canada and Ontario will continue to outpace that of the United States and New York, and all of the boat manufacturers that we interviewed are confident that sales and registration of larger boats in Ontario will exceed that exhibited between 2007 and 2012. While all indications are that the number of boats in Ontario and New York in each length category will increase beyond 2012, we have chosen to take a more conservative growth rate (i.e. reduced growth rate) beyond 2018 (i.e. for boats 8 metres to less than 9 metres, we have used a growth rate of 1.75 per annum between 2012 and 2018, 1.25 percent per annum from 2018 to 2023, 0.7 percent per annum from 2023 to 2028, and 0.2 percent per annum from 2028 to 2031). A similar reduced growth rate has been used in the projections for each length of boat. We have chosen to do this to account for any unforeseen uncertainties that may occur between 2014 and 2031 and have not already been accounted for in our projections. In EXHIBITS 19, 20, 21, and 22 for Ontario and EXHIBITS 23, 24, 25, and 26 for New York State, the growth projections use the size category as a base for projecting from the 2012 number. For example, in EXHIBIT 19 for Ontario, and EXHIBIT 23 for New York a distinct growth rate was applied to the 2012 base number in each category of length. The growth rate in each category was derived from data available between 2007 and 2012 and the projections provided by boat manufacturers/builders in Canada and the United States for what they will sell between 2013 and 2031 and the number of boats that Transport Canada, Service Canada believes will be registered in Ontario and the number the New York State Department of Motor Vehicles believes will be registered during the 2013 to 2031 time period. The number of pleasure craft licenses granted and cancelled by Transport Canada in 2013 indicates that we have been conservative with our projections for 2013 (EXHIBITS 17 and 18). Not only is the Transport Canada data an additional source on which to base our projections, it also provides an additional assurance that we are not overstating the number of boats expected in Ontario between 2014 and 2031. 4.2.1 Length of Ontario Boats The number of power and sail boats in Ontario 6 metres to less than 8 metres will continue to represent the largest share of boats in Halton’s waterfront area during the 2013 to 2031 time period. Boats in this category are projected to grow from approximately 64,700 in 2013, to 69,100 by 2018, 71,900 by 2023, 73,400 by 2028, and reach 74,230 by 2028. This represents an average annual growth rate between 2013 and 2018 of 1.4 percent, 0.8 percent per annum between 2018 and 2023, 0.4 percent each year between 2023 and 2028 and 0.2 percent per annum between 2028 and 2031. The higher growth rate among those boats of greater length exhibited between 2007 and 2012 is projected to continue between 2013 and 2031. Boats 9 metres to less than 11 metres are projected to grow 5.0 percent per annum between 2013 and 2018 and a further 4.5 percent, 3.9 percent and 2.0 percent each year respectively between 2018 and 2023, 2023 and 2028, and 2028 and 2031. Those Ontario boats from 11 metres to less than 14 metres are projected to increase 4.4 percent per annum between 2013 and 2018, 3.8 percent per annum between 2018 and 2023, 3.2 percent per annum between 2023 and 2028, and a

Recreational Boating Feasibility and Capacity Study – Phase 1 Final Report June 2014
TOURISTICS + Shoreplan Engineering Limited 31
further 1.6 percent per annum between 2028 and 2031. The largest boats, those 14 metres and more in length are projected to have the highest growth rate per annum at 5.1 percent, 4.6 percent, 4.0 percent, and 2.0 percent in each of the noted time periods between 2013 and 2031 (EXHIBIT 19). This projected increased growth in the length of boats will have a particularly strong impact on the facilities in Oakville and Bronte Harbour where there is already a shortage of longer slips and many of the fairways are sub-standard in terms of width. This shortage will be further exacerbated as there will be a need to either modify the number of slips to accommodate wider beam widths or add more slips. Between 2013 and 2031 the number of boats in Ontario is projected to grow as follows:
Length 2013 2023 2031 Percentage Increase
6 m. to <8 m. (20 ft. to <26 ft.) 64,700 71,950 74,230 14.7% 8 m. to <9 m. (26 ft. to <30 ft.) 12,780 14,760 15,440 20.8% 9 m. to <11 m. (30 ft. to <36 ft.) 19,400 29,720 39,010 101.1% 11 m. to <14 m. (36 ft. to <46 ft.) 11,590 16,810 21,120 82.2% 14 m. and longer (46 ft. or more) 6,470 9,980 13,180 103.7% Figure 14 following shows that although the number of boats in Ontario 6 metres to less than 8 metres in length has and will continue to increase, the percentage share of this size of boats has and will decrease relative to those 9 metres and over. Although boats 8 metres and longer will continue to increase their share of the boat market, those less than 8 metres will continue to dominate the market for the foreseeable future. Figure 14 - Percentage Share of Ontario’s Boat Market by Length of Boat (2007 to 2031)
0.0
10.0
20.0
30.0
40.0
50.0
60.0
70.0
Perc
enta
ge S
hare
Year
6 m. to less than 8 metres 8 metres to <9 metres 9 metres to <11 metres
11 metres to <14 metres 14 metres & over

Recreational Boating Feasibility and Capacity Study – Phase 1 Final Report June 2014
TOURISTICS + Shoreplan Engineering Limited 32
4.2.2 Beam of Ontario Boats The trend toward wider boats in the years 2007 to 2012 is also expected to continue for the period between 2013 and 2031 (EXHIBIT 20). Within Ontario, the number of boats with a beam of 2 metres to less than 3 metres (i.e. 6 ft. 6’ to less than 10 ft.) is projected to grow 0.6 percent per annum between 2013 and 2018, 0.8 percent per annum between 2018 and 2028, and 0.5 percent between 2028 and 2031, whereas boats 3 metres to less than 4 metres wide (i.e. 10 ft. to less than 13 ft.) are projected to increase 5.2 percent per annum between 2013 and 2018, 5.6 percent per annum between 2018 and 2023, 5.5 percent per annum between 2023 and 2028, and a further 4.6 percent per annum between 2028 and 2031. Boats with the widest beam 4 metres or more (i.e. 13 ft. or more) are projected to grow by 5.5 percent each year from 2013 until 2018, 5.9 percent each year between 2018 and 2023, 5.8 percent each year between 2023 and 2028, and a further 4.8 percent each year from 2028 through 2031. The number of boats in Ontario with a beam of 3 metres or more is projected to increase from approximately 34,200 in 2013, to 55,700 by 2023, and reach approximately 80,900 by 2031; an increase of 136.5 percent. The facilities with already narrow slips will be negatively impacted by the increased growth in wider boats. Between 2013 and 2031 the width of boats in Ontario is projected to grow as follows:
Beam 2013 2023 2031 Percentage Increase
2 m. to <3 m. (6 ft. 6” to <10 ft.) 573,190 615,430 646,540 12.8% 3 m. to <4 m. (10 ft. to <13 ft.) 22,900 37,020 53,330 132.9% 5 m. or more (13 ft. or more) 11,330 18,700 27,540 143.1% 4.2.3 Draft of Ontario Boats Boats in Ontario with a draft of 0.61 metres to less than 0.91 metres, and 0.91 metres to less than 1.22 metres are projected to increase by 0.6 percent each year between 2013 and 2018, 0.5 percent each year between 2018 and 2023, 0.4 percent each year between 2023 and 2028, and a further 0.2 percent each year between 2028 and 2031. Those boats 1.22 metres to less than 1.52 metres in draft are projected to increase by 1.8 percent each year between 2013 and 2018, and 1.6 percent, 1.5 percent and 0.9 percent each year between 2018 and 2023, 2023 and 2028, and 2028 and 2031 respectively. Boats with a draft of 1.52 metres to less than 1.83 metres are projected to increase by 2.4 percent per annum between 2013 and 2018 and the same 2.2 percent per annum between 2018 and 2023, and 2023 and 2028, with a further increase of 1.4 percent per annum between 2028 and 2031. Boats with the deepest draft (i.e. 1.83 metres or more) are projected to have the greatest percentage increases each year between 2013 and 2031, increasing 3.0 percent each year between 2013 and 2018, 2.8 percent each year between 2018 and 2023, 3.5 percent each year between 2023 and 2028, and 2.2 percent each year between 2028 and 2031 (EXHIBIT 21). Between 2013 and 2031 the draft of boats in Ontario is projected to grow as follows:
Draft 2013 2023 2031 Percentage Increase
0.6 m to <1.22 m (2 ft. to <4 ft.) 593,670 627,120 644,450 8.6% 1.22 m. to <1.52 m. (4 ft. to <5 ft.) 28,670 33,780 38,080 32.8% 1.52 m. to <1.83 m. (5 ft. to <6 ft.) 2,510 3,120 3,700 47.4% 1.83 m. or more (6 ft. or more) 1,180 1,550 2,020 71.2% 4.2.4 Length of New York State Boats Based on the improved economic growth forecasts for the United States and New York State beyond 2012, we are able to project a slight positive growth rate for New York boats between 2013 and 2031. Boats 6 metres to less than 8 metres, are projected to increase 0.2 percent per year between 2013 and

Recreational Boating Feasibility and Capacity Study – Phase 1 Final Report June 2014
TOURISTICS + Shoreplan Engineering Limited 33
2028 and 0.1 percent each year between 2028 and 2031. The boats most likely to visit the facilities in Halton are those 8 metres or more in length (i.e. 26 feet or more). Of these, boats 8 metres to less than 9 metres are projected to grow 0.3 percent per annum between 2013 and 2028 and 0.2 percent per annum between 2028 and 2031. Those boats 9 metres to less than 11 metres are projected to increase 1.1 percent per annum from 2013 until 2018 and a further 0.7 percent, 0.5 percent and 0.3 percent each year between 2018 and 2023, 2023 and 2028, and 2028 and 2031 respectively. Boats 11 metres to less than 14 metres are projected to grow 1.1 percent each year between 2013 and 2018, 0.6 percent each year between 2018 and 2023, 0.5 percent each year between 2023 and 2028, and another 0.2 percent each year between 2028 and 2031. As in Ontario, boats 14 metres and longer in New York are projected to exhibit the strongest growth rates at 4.0 percent per annum between both 2013 and 2018, 3.3 percent per annum from 2018 to 2023, 2.7 percent per annum from 2023 to 2028, and 1.4 percent per annum from 2028 until 2031. The number of boats 8 metres or longer are projected to increase from approximately 24,000 in 2013, to 27,700 by 2023, and reach approximately 29,100 by 2031 (EXHIBIT 23). 4.2.5 Beam of New York State Boats Boats in New York State with the narrowest beam (i.e. 2 metres to less than 3 metres) are projected to increase slightly between 2013 and 2031 at 0.2 percent per annum between 2013 and 2018, 0.1 percent per annum between 2018 and 2028 and less than 0.1 percent per annum between 2028 and 2031. Those boats with a beam of 3 metres to less than 4 metres are projected to increase 3.9 percent each year between 2013 and 2018, 3.5 percent each year between 2018 and 2028, and a further 2.0 percent per year from 2028 to 2031. Between 2013 and 2018 boats in New York with a beam of 4 metres or more are projected to increase by 4.2 percent each year, between 2018 and 2023 by 3.9 percent each year, between 2023 and 2028 by 4.1 percent each year and 2.2 percent per annum from 2028 to 2031 (EXHIBIT 24). 4.2.6 Draft of New York State Boats Boats in New York State with a draft of 0.91 metres to less than 1.22 metres are projected to grow from approximately 56,800 in 2013, to 59,200 by 2023 and reach approximately 60,200 by 2031 (EXHIBIT 25). Those boats requiring a draft of 1.22 metres to less than 1.52 metres are projected to increase from approximately 11,800 in 2013, to 13,100 by 2023, and reach 14,000 by 2031. Boats with a draft of 1.52 metres to less than 1.83 metres are projected to increase from approximately 1,100 in 2013, to 1,300 by 2023, and reach approximately 1,600 by 2031. New York boats in the deepest draft category (i.e. 1.83 metres and more) are projected to increase from 500 in 2013, to 600 by 2023 and reach approximately 700 by 2031.

Recreational Boating Feasibility and Capacity Study – Phase 1 Final Report June 2014
TOURISTICS + Shoreplan Engineering Limited 34

Recreational Boating Feasibility and Capacity Study – Phase 1 Final Report June 2014
TOURISTICS + Shoreplan Engineering Limited 35
SECTION 5 – CURRENT AND PROJECTED NEED FOR SEASONAL AND TRANSIENT SLIPS AND LAUNCH RAMPS IN HALTON REGION 5.0 Introduction The need for additional slips and launch ramps in Halton is dependent on three major factors:
• The ability of the existing marina facilities within the market area to meet the current and future demand, and the overall occupancy rate of the marinas within the seasonal market area;
• The growth in the number of power and sail boats in the seasonal market area and the changes
in their length, beam and draft; and,
• The market area for seasonal slips and launch ramps exhibits socio-demographic characteristics that are strong determinants of power and sail boating demand.
Based on our analysis of these factors in the previous three sections of this report, there is a demonstrated need for additional slips and launch ramps in Halton. The projected level of that need is described in this section. 5.1 Need for Seasonal Slips Based on our interviews with marina operators and yacht club commodores in Halton we have assumed that the boats requiring seasonal slips are at least 6 metres or more in length (i.e. approximately 20 feet or more). As shown in EXHIBIT 27, we estimate that there were approximately 4,400 boats 6 metres or more in length in Halton in 2013. Since data on the number of registered boats in Ontario are not county or region specific, we have arrived at our estimate of boats by dividing the number of boats in Ontario by the population. This provides us with the number of persons per boat (i.e. 118.6) or that there is one boat of this size for every 118.6 persons. By dividing the population of Halton by the number of residents per boat in the market area we arrive at the number of seasonal boats (e.g. 525,260/118.6 = 4,430 seasonal boats). Since we are using averages, it is recognized that this method may over-estimate land locked areas (i.e. Middlesex, Waterloo), and under-estimate others with a large waterfront area (i.e. Halton, Peel). Overall we believe that it provides a reasonable estimate given the data available. This approach is widely used by private and public sector marina developers in North America and internationally to estimate the number of boats in the market area. The U.S. National Park Service and the Tennessee Valley Authority (TVA) use this approach in their watershed area studies in the United States as does Parks Canada. In arriving at the number of boats that require seasonal slips it is necessary to eliminate those that are moored at private docks or boathouses and those that are trailered to a launch ramp on a per use basis. Our discussions with planners and officials at Conservation Authorities indicated that there is no readily available data regarding the number of residences in Halton with docks or boathouses. We have therefore used a conservative estimate that 5 percent of the households with waterfront property on Lake Ontario have boats moored at private docks or boathouses. Our discussions with the National Marine Manufacturers Association - Canada and a number of Canadian boat trailer sellers provided an estimate of approximately 20% of boats 6 metres to less than 8 metres and 2% of boats 8 metres or longer are trailered to launch ramps on a per use basis. We have excluded these trailered boats from the number requiring a slip. We have further reduced the number of boats requiring a slip by 150 boats to account for the residents particularly in North Halton who keep their boats at marinas on Georgian Bay or other locations. The North Halton Power & Sail Squadron has a number of members who do this (EXHIBIT 28). By comparing the number of seasonal slips available in 2013 with the number of seasonal boats as derived in EXHIBIT 28, it is evident that there is more demand than supply and additional slips are

Recreational Boating Feasibility and Capacity Study – Phase 1 Final Report June 2014
TOURISTICS + Shoreplan Engineering Limited 36
needed. LaSalle Park Marina is proposing to add 120 seasonal slips for the opening of the 2016 boating season. There is a theory among many marina operators and boat manufacturers throughout North America today that if there are no adequate slips at a port, the number of boats in the area will reflect this deficiency. If on the other hand, quality facilities are offered, these facilities will actually foster boat ownership and activity in the area. Port Whitby Marina in Whitby and Meyer’s Pier in Belleville are direct examples of this theory. We estimate that at the end of the boating season in 2013 there was a need for 430 additional slips. If LaSalle Park Marina is able add 120 new seasonal slips in time for the 2016 boating season, the need for additional seasonal slips will reach 600. By 2018, the need for additional slips will rise to 820 (EXHIBIT 28). The trend toward longer and wider boats will have a significant impact on the number of slips in Oakville and Bronte Harbours where the finger docks are short and the fairways narrow. It is evident that there is a current and future need for seasonal slips in the 10.67 metre (35 foot), 12.12 metre (40 foot), and 13.72 metre (45 foot) range. 5.2 Need for Transient Slips 5.2.1 Transient Boater Market Area Two sources of information were used in determining the likely market for the use of transient slips in Halton: a 2009 Great Lakes boating survey and our interviews with 75 yacht and boating clubs on Lake Ontario in Ontario and New York within the market area of Halton’s facilities. The 2009 Great Lakes Boating Survey, was conducted by the U.S. Department of Transportation, Michigan Department of Natural Resources, and Michigan State University, Department of Parks, Recreation and Tourism Resources. According to the Great Lakes Boating Survey, 60 percent of boater’s days away from their home marina are spent within 20 nautical miles. A further 20 percent are spent within 21 and 40 nautical miles, 10 percent within 41 to 60 nautical miles, 6 percent within 61 to 80 nautical miles, and the final 4 percent beyond 80 nautical miles (EXHIBIT 29). Our telephone interviews with the yacht and boating clubs in Ontario and New York State situated on Lake Ontario provided an indication of the boating trips’ characteristics, their likelihood of using a transient slip in Halton, and their comments on other marinas they frequent. The information obtained through our boater survey confirmed the results of the larger Great Lakes survey. For this reason, we have defined the transient boater market area for Halton’s facilities as follows:
• 60 percent of boater demand will come from the Toronto to Jordon Harbour area (i.e. within 20 nautical miles of Bronte Harbour1). During the 2013 boating season, there were 22 marinas and yacht clubs within 20 nautical miles, all within Ontario, mooring a total of 4,709 boats (EXHIBIT 31A).
• 80 percent of boater demand will come from within 40 nautical miles of Bronte Harbour (i.e.
Toronto to Pickering in the east; and St. Catharines to Niagara-on-the-Lake to the southwest in Ontario, and Lewiston to Wilson in New York State on the south side of Lake Ontario). During the 2013 boating season there were 25 marinas and yacht clubs in Ontario within 21 to 40 nautical miles, with 4,593 boats, and 10 marinas and yacht clubs in New York State with 675 boats (EXHIBIT 31B).
________ 1Bronte Harbour is approximately the mid-point of the Halton Region waterfront
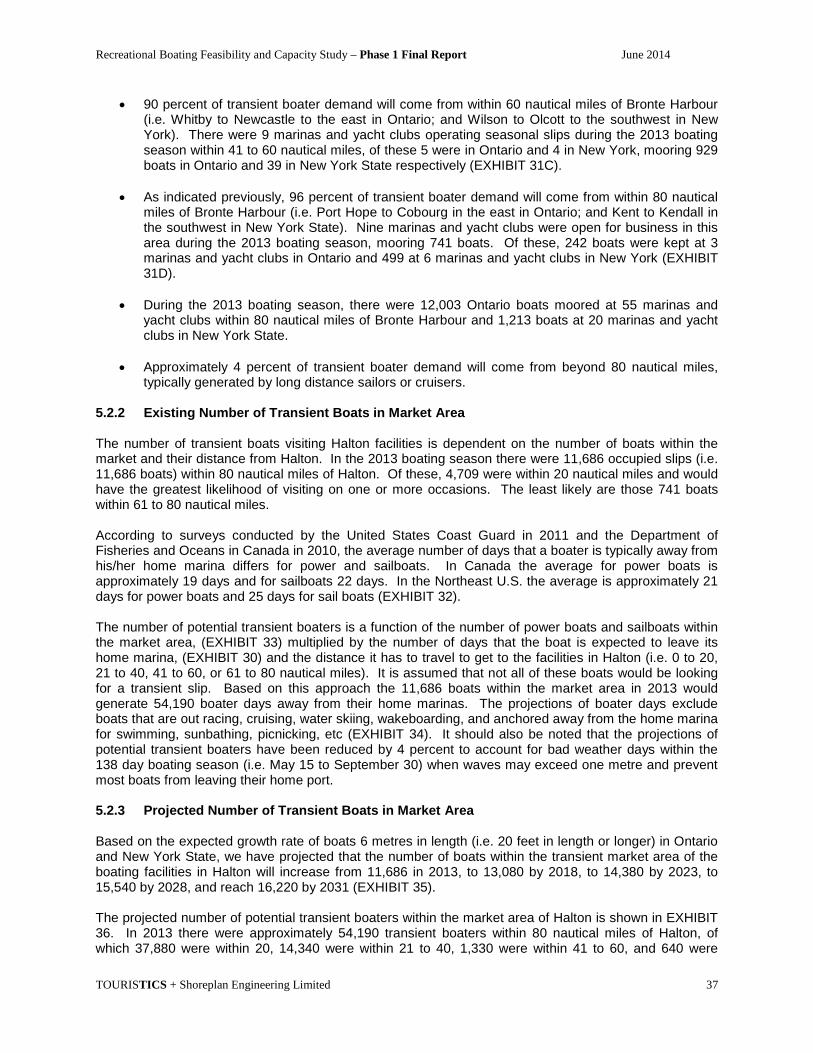
Recreational Boating Feasibility and Capacity Study – Phase 1 Final Report June 2014
TOURISTICS + Shoreplan Engineering Limited 37
• 90 percent of transient boater demand will come from within 60 nautical miles of Bronte Harbour (i.e. Whitby to Newcastle to the east in Ontario; and Wilson to Olcott to the southwest in New York). There were 9 marinas and yacht clubs operating seasonal slips during the 2013 boating season within 41 to 60 nautical miles, of these 5 were in Ontario and 4 in New York, mooring 929 boats in Ontario and 39 in New York State respectively (EXHIBIT 31C).
• As indicated previously, 96 percent of transient boater demand will come from within 80 nautical
miles of Bronte Harbour (i.e. Port Hope to Cobourg in the east in Ontario; and Kent to Kendall in the southwest in New York State). Nine marinas and yacht clubs were open for business in this area during the 2013 boating season, mooring 741 boats. Of these, 242 boats were kept at 3 marinas and yacht clubs in Ontario and 499 at 6 marinas and yacht clubs in New York (EXHIBIT 31D).
• During the 2013 boating season, there were 12,003 Ontario boats moored at 55 marinas and
yacht clubs within 80 nautical miles of Bronte Harbour and 1,213 boats at 20 marinas and yacht clubs in New York State.
• Approximately 4 percent of transient boater demand will come from beyond 80 nautical miles,
typically generated by long distance sailors or cruisers. 5.2.2 Existing Number of Transient Boats in Market Area The number of transient boats visiting Halton facilities is dependent on the number of boats within the market and their distance from Halton. In the 2013 boating season there were 11,686 occupied slips (i.e. 11,686 boats) within 80 nautical miles of Halton. Of these, 4,709 were within 20 nautical miles and would have the greatest likelihood of visiting on one or more occasions. The least likely are those 741 boats within 61 to 80 nautical miles. According to surveys conducted by the United States Coast Guard in 2011 and the Department of Fisheries and Oceans in Canada in 2010, the average number of days that a boater is typically away from his/her home marina differs for power and sailboats. In Canada the average for power boats is approximately 19 days and for sailboats 22 days. In the Northeast U.S. the average is approximately 21 days for power boats and 25 days for sail boats (EXHIBIT 32). The number of potential transient boaters is a function of the number of power boats and sailboats within the market area, (EXHIBIT 33) multiplied by the number of days that the boat is expected to leave its home marina, (EXHIBIT 30) and the distance it has to travel to get to the facilities in Halton (i.e. 0 to 20, 21 to 40, 41 to 60, or 61 to 80 nautical miles). It is assumed that not all of these boats would be looking for a transient slip. Based on this approach the 11,686 boats within the market area in 2013 would generate 54,190 boater days away from their home marinas. The projections of boater days exclude boats that are out racing, cruising, water skiing, wakeboarding, and anchored away from the home marina for swimming, sunbathing, picnicking, etc (EXHIBIT 34). It should also be noted that the projections of potential transient boaters have been reduced by 4 percent to account for bad weather days within the 138 day boating season (i.e. May 15 to September 30) when waves may exceed one metre and prevent most boats from leaving their home port. 5.2.3 Projected Number of Transient Boats in Market Area Based on the expected growth rate of boats 6 metres in length (i.e. 20 feet in length or longer) in Ontario and New York State, we have projected that the number of boats within the transient market area of the boating facilities in Halton will increase from 11,686 in 2013, to 13,080 by 2018, to 14,380 by 2023, to 15,540 by 2028, and reach 16,220 by 2031 (EXHIBIT 35). The projected number of potential transient boaters within the market area of Halton is shown in EXHIBIT 36. In 2013 there were approximately 54,190 transient boaters within 80 nautical miles of Halton, of which 37,880 were within 20, 14,340 were within 21 to 40, 1,330 were within 41 to 60, and 640 were

Recreational Boating Feasibility and Capacity Study – Phase 1 Final Report June 2014
TOURISTICS + Shoreplan Engineering Limited 38
within 61 to 80 nautical miles of Bronte Harbour. By 2018 the total number of transient boater days within the overall market area is projected to increase to 59,900, to 65,170 by 2023, to 69,930 by 2028, and reach 72,700 by 2031. As was the case with seasonal slips, there is clearly an existing and growing transient boater market that the boating facilities in Halton would be in a position to attract. The Oakville Harbour, Bronte Harbour and Bronte Outer Harbour Marina are in easy walking distance of the type of shops and restaurants of interest to transient boaters. The numbers provided by the marinas and yacht clubs within Halton (EXHIBIT 1C) and those within the GTA/Golden Horseshoe Area and beyond (EXHIBIT 31) confirm there is significant transient boater market to be attracted. While we believe that Oakville, Burlington and Halton should increase the number of transient slips available; this number should not exceed the industry average of approximately 15 percent of the total slips available. Transient slips, while heavily used on weekends especially holiday weekends, generally attract low use during the Monday to Friday time period. Based on the number of transient boaters attracted to the facilities in the GTA/Golden Horseshoe Area (EXHIBIT 31), 200 transient slips in Halton (i.e. 1,344 x 0.15 = 200) could be expected to attract a minimum of 6,000 transient boaters annually. An established marina (i.e. Year 4 or 5) in a good market can expect to reach high occupancy rates on holiday weekends and established special event weekends, as shown below. Monday through Friday are difficult days to attract transient boaters even with very attractive discounts.
(established marina in a good market) Holiday Weekends 90 to 100% Existing Special Event Weekends 75 to 100% New Special Event Weekends 65 to 85% Normal Weekends 55 to 65% Normal Weekdays 5 to 10% 5.2.4 What Transient Boaters are Interested In According to our interviews with the yacht and boating clubs on Lake Ontario in Ontario and New York, transient boaters are looking for the following:
• Sturdy full length finger docks; • Safe (relatively sheltered) marina basin or harbour; • A feeling of security, through a safety system, personnel or location and other watchful patrons; • Adequate dockside power, including varying fittings and different electrical requirements, based
on boat size/need; • Freshwater supply; • Pump out; • Internet/Wi-Fi; • Upland amenities, such as clean and inviting restrooms, showers and laundry facilities; • Fuel service or at least close access to fuel; • Access to provisions; • Short term storage space; • Staff on docks to assist in docking and providing local directions and advice; • A list in the marina office with telephone numbers of businesses in the area having the services
boaters need (i.e. repair facilities, laundry if not on site, grocery stores, convenience stores, shopping, restaurants);
• A variety of nearby attractions or events; and, • A place to exercise pets.
Other amenities mentioned less frequently were the provision of a shuttle service to town or the availability of bicycles. Since virtually all of the services and amenities mentioned above are also

Recreational Boating Feasibility and Capacity Study – Phase 1 Final Report June 2014
TOURISTICS + Shoreplan Engineering Limited 39
important in attracting the seasonal boater market there should be no additional cost to the marinas or municipalities in catering to the transient boater market. Among transient boaters those that come for special events such as festivals and regattas tend to be the highest spenders as they typically stay for more than one day. Those on their way to or from another destination tend to stay for less than half a day. The inclusion of more transient slips in Halton would have a significant economic impact on the businesses in downtown Oakville and Burlington. Expenditures by transient boaters at grocery stores, restaurants, marine supply outlets, other retail outlets, marine repair shops and tourist attractions and events within Halton would be substantial. The Ontario Ministry of Tourism, Recreation, and Culture, Travel Activities and Motivation Survey (TAMS), 2006 indicates an average per person transient boater expenditure of $32.80 for less than a 12 hour stay, $42.70 for less than 24 hours and not overnight, and $192.10 for an overnight stay (average stay 3 nights). This assumes 2.1 persons per boat as per industry average. 5.3 Need for Launch Ramps Boats that are trailered to launch ramps are typically less than 8 metres (less than 26 feet). Approximately 20 percent of boats 6 metres to less than 8 metres (i.e. 20 feet to less than 26 feet), and 2 percent of boats 8 metres to less than 9 metres (i.e. 26 feet to less than 30 feet) are trailered to launch ramps on a per use basis. Launch ramp use is usually concentrated during a three-hour launch period (morning) and three-hour retrieval period (afternoon). Launch ramps require a large amount of parking space. Typically a one lane ramp should have at least 35 to 45 vehicle and boat trailer parking spaces. A two lane launch ramp should have between 45 and 75 spaces. While we have determined that there is a sizable number of boats in Halton that would likely use a launch ramp (EXHIBIT 37), there is little data available to indicate the current level of use, as the two facilities in LaSalle Park in Burlington are free of charge and are not monitored. The Bronte Beach launch ramp, and Oakville Shipyard Park launch ramp had 2,200 users in 2013. The number of boats likely to use a launch ramp in Halton is projected to increase from 14,300 in 2013, to 15,440 by 2018, to 16,470 by 2023, to 17,370 by 2028, and reach 17,890 by 2031. Ideally, based on the existing data, one additional launch ramp will be required by 2018, two additional launch ramps (for a total of 6) will be required by 2023, and three more by 2031 for a total of seven. However, until more detailed user data is available for the existing launch ramps we would recommend that the municipalities concentrate on improving the existing facilities rather than adding additional ones. It should be noted that the Ministry of Natural Resources considers there is a world class fishery off Bronte/Oakville Harbours, especially for salmon fishing.1 There are currently eight fishing charter boat operators in Oakville and Bronte, and the Ministry feels that the fishery could support at least 12 fishing charter boats. In addition, the 34,100 licensed anglers in Halton Region spend hundreds of dollars each annually within the Region on fishing and boating equipment.2
Purchases Wholly Attributable to Recreational Fishing, 20101
Average Annual Expenditure per Active Licensed Angler
Boating Equipment $342.54 Fishing Equipment $77.21 _____ 1 Andy Todd, Manager, Lake Ontario Management Unit, Ontario Ministry of Natural Resources
2 Survey of Recreational Fishing in Canada, 2010, Fisheries and Oceans Canada, 2012

Recreational Boating Feasibility and Capacity Study – Phase 1 Final Report June 2014
TOURISTICS + Shoreplan Engineering Limited 40

Recreational Boating Feasibility and Capacity Study – Phase 1 Final Report June 2014
TOURISTICS + Shoreplan Engineering Limited 41
SECTION 6 – PLANNING FOR FUTURE BOATER NEEDS IN HALTON 6.0 Introduction It is clear from the research and data presented in the preceding Sections of this report that:
• The population of Halton will increase at a faster rate than that of the province as a whole during the next twenty years1;
• The participation rates in power boating, sail boating, canoeing, kayaking, and rowing kayaking
will continue to increase;
• The number of power and sail boats registered in Ontario will continue to increase;
• Power and sail boats have and will increase in length, width and to a lesser extent draft;
• Haltons’ marinas are at capacity today; and,
• There is no room within Bronte Harbour Regional Waterfront Park or Oakville’s Sixteen Mile Creek to expand capacity.
It is also clear as illustrated in Table 4 below that while there are many strengths and opportunities related to recreational boating in Halton, there are a number of weaknesses and threats that have serious implications for boating activities. A number of the weaknesses identified in the table are being dealt with or there are plans in place to deal with them. It is unlikely that an additional fuel dock accessible to both power and sail boats is possible within the existing three harbours. It should be noted that the threats are common to all marinas and harbours throughout Ontario and do not place the facilities in Halton at a disadvantage to those in the GTA/Golden Horseshoe Area. We believe that for the most part, the strengths and opportunities for recreational boating in Halton out-weigh the weaknesses and threats. Marinas and boating facilities increase public access to the waterfront; provide more amenities on the waterfront; act as tourism attractions; enhance the physical appearance of the waterfront; raise real estate property values on the waterfront and in nearby neighbourhoods; act as a catalyst for new commercial and residential development, and in doing so increase the tax base; and create an improved aquatic habitat. Visitors attracted to the waterfront as a result of “boater activity” can also be an important source of revenue and economic spinoffs. In addition to the thousands of dollars that power and sail boaters spend annually in seasonal slip rentals, launch and haul-out fees and winter storage fees at their marina, yacht or power boat club in Oakville and Burlington, (EXHIBIT 1) they also spend thousands of dollars annually in the community for fuel, insurance, supplies and repairs.
Annual Expenditure in Community in Addition to that at Home Marina, Yacht or Power Boat Club2
Power Boat - 20 feet to less than 26 feet $2,800.00 Power Boat - 26 feet to less than 36 feet $3,600.00 Power Boat - 36 feet or more $6,800.00 Sail Boat - 20 feet to less than 26 feet $2,400.00 Sail Boat - 26 feet to less than 36 feet $2,800.00 Sail Boat - 36 feet or more $5,700.00 _____ 1 2013 to 2031
2 Recreational Marine Research Center, Michigan State University, 2011, and members of the Association of Oakville Harbours’ Stakeholders, 2014.

Recreational Boating Feasibility and Capacity Study – Phase 1 Final Report June 2014
TOURISTICS + Shoreplan Engineering Limited 42
Table 4 – Strengths, Weaknesses, Opportunities and Threats for Recreational Boating in Halton
Strengths Weaknesses • Existing, active marinas and yacht clubs • Accessible waterfront • Projected growth in age categories with high
participation rates in boating • Diverse and growing local population • Stable local economy • Large and growing population base with easy
access to boating activity areas (i.e. Oakville and Burlington are on Lake Ontario)
• Proximity to U.S. transient boater market which is starting to recover from downturn 2008-2010
• Number of learn to sail programs and participants are increasing at all area clubs
• A number of local clubs offer a variety of programs including ones for the disabled
• Participation in canoeing, kayaking, rowing, paddle boarding, etc. leads to more physically fit population
• Boating activity attracts residents and tourists to the waterfront and downtown area of Oakville and Burlington
• Lack of well designed launch ramps • Existing marinas and club facilities are at
capacity • Insufficient capacity for winter storage • Continual need for dredging in Oakville and
Bronte Harbours • Relative lack of transient slips • Weak link between marinas, harbours and
restaurants, shopping, attractions • One fuel dock accessible to sail boats • Insufficient 30 and 50 amp. power • Lack of security at Oakville Harbour • Lack of readily identifiable space to develop a
marina • Recreational planning for boating is becoming
more complex and contentious • Municipal budgets are limited and in
competition with increasing demand for non-water oriented recreational activities and other priorities
• Crowded sub-standard mooring layout • Lack of finger docks
Opportunities Threats • Large number of boating enthusiasts reside and
are attracted to Halton and downtown urban areas
• Boating appeals to persons of all ages and income levels
• Growing recreational boating market • Growth in the number of bigger boats • Boats are being developed as “floating cottages”
moored in local marinas thereby reducing travel time to cottage
• Transient boating is on the upswing • Transient boaters use restaurants, retail and
shopping outlets, and attractions close to marinas
• Boating events are an additional source of income for local businesses
• Recreational development of waterfront lands acts as a driver for the local economy
• Public waterfront ownership for potential expansion exists
• New marinas and boating facilities could lead to additional related business opportunities or partnerships (i.e. boat repairs, boat sales, boat and boater equipment sales)
• Development provides opportunity to enhance environmental functions and habitat both in the new facilities and where the riverine docks are currently located
• Relocate boating facilities/slips out of areas requiring dredging
• Restore river based wetland ecosystems
• Escalating marina construction costs • Escalating utility costs • Existing facilities not able to meet future boater
needs • Lack of federal and provincial grant funding
sources • Higher marine fuel costs may dampen demand
for power boating • Stringent environmental controls increase cost
of on-going maintenance dredging • Habitat loss or change in the shoreline • Lack of vision to capture market share and
tourism dollars

Recreational Boating Feasibility and Capacity Study – Phase 1 Final Report June 2014
TOURISTICS + Shoreplan Engineering Limited 43
6.1 Monitoring Current Demand Situation In order to provide boating facilities in a timely fashion it will be necessary to monitor the level of demand in an ongoing manner. For marinas this means maintaining a permanent waiting list which indicates the length, width and beam of the boat requiring a slip or mooring. For boating clubs (i.e. canoeing, kayaking, rowing, etc.) it means documenting the number of persons turned away from program offerings or membership categories. When an individual marina has reached capacity (i.e. 95% occupancy or more) and the marina manager has a documented waiting list approaching one-half the number of seasonal slips, a new or expanded facility is warranted. Given that the environmental, planning and construction steps involved in bringing a new marina to fruition will likely take a minimum of four years (i.e. planning, environmental assessment process and design; approvals by various government agencies; and construction); the waiting list likely will have reached a point where when combined with industry average trade-ups3, the new facility will be assured of success as there will be no shortage of demand for slips. 6.1.1 Meeting Future Seasonal Slip and Boater Demand The study clearly indicates that there is a demand for boating facilities much beyond the capacity of the existing facilities4. It is also clear that the existing facilities and the three main existing locations cannot meet this demand by gradual expansion. The two river locations at Oakville and Bronte cannot expand further within the existing channel to any degree while respecting environmental objectives. The one location on the open lake in Bronte (i.e. Bronte Outer Harbour Marina) is bound by fixed breakwaters and cannot expand within the footprint of the breakwaters. The La Salle Park Marina, as noted in the report, is proposing the provision of a fixed breakwater which then could accommodate some future expansion5. No decision has been made on this location as of the writing of this report. As the identified demand for slips is beyond the capacity of the existing sites in the Region, new locations will need to be considered on a go forward basis. Selection of any new site will be a complex process that will be subject to an individual environmental assessment process and a thorough review by all levels of government and conservation authorities, as well as the general public. The projections suggest that if the demand were to be met with the typical size of marina found on the Great Lakes, it would require the construction of four facilities at least as large as Bronte Outer Harbour Marina along the Halton waterfront by 2031. Clearly, this is a task that will call for extensive public consultations, creativity, and out of box thinking. In addition, the Burloak Canoe Club requires an additional 70 to 75 feet of shoreline dockage for a total of 100 feet to meet current demand, let alone future demand. Additional space and secured parking for people with disabilities would allow the Wai Nui O Kanaka Outrigger Canoe Club to expand its membership as well. ____ 3 A new marina will typically also attract an industry average of approximately 2 percent of the seasonal boaters currently at other marinas in the area who will trade up because of the newer facilities available and/or because it is more conveniently located
4 820 additional slips by 2018; 1,400 slips by 2023; 1,860 slips by 2023; and 2,160 by 2031
5 Even if the City of Hamilton and the Hamilton Port Authority proceed with the planned expansion of 800 slips during the period from 2016 to 2028, and 10% of the demand in the western part of Halton were to choose that location instead, the need for additional slips in Halton would still be 740 in 2018; 1,260 in 2023; 1,670 in 2028; and 1,940 by 2031

Recreational Boating Feasibility and Capacity Study – Phase 1 Final Report June 2014
TOURISTICS + Shoreplan Engineering Limited 44

Recreational Boating Feasibility and Capacity Study – Phase 1 Final Report June 2014
TOURISTICS + Shoreplan Engineering Limited 45
EXHIBIT 1A MARINAS, YACHT AND BOAT CLUBS WITHIN HALTON REGION – NUMBER AND SIZE OF SLIPS Marina/Yacht/Boat Club Location Total
Slips Number of Slips
by Length
Seasonal Slips
Transient Slips
Seasonal Slips1
Occupied
Max. Length
Min. Draft
Fuel Launch Ramp
Marine Supplies
Oakville Club Oakville, Ontario 56 Water Street 905-845-0231
47
<26’ - 10 27’ to <30’ -14 30’ to <36’ - 20 36’ to <46’ -3
43
Mediter- ranean bow in moorings
1 slip for visitors Reciprocalsdepend on status of seasonal
3 at 38 ft.
4 ft.
Oakville Yacht Squadron Oakville, Ontario 146 Lakeshore Road West 905-338-9379
79
<26’ - 0 26’ to <30’ -17 30’ to <36’- 34 36’ to <46’ - 25
76
Mediter- ranean bow in moorings
3 dedicated plus member slips that are available at time of request
38 ft.
5 ft.
Yes Member only - no specific fee
Oakville Harbours Marina – Oakville Harbour
Oakville, Ontario Lakeshore Road East (905) 338-4188
238
<26’ - 56, 8 wet moorings 26’ to <30’ - 100, 15 wet moorings 30’ to <36’- 36, 11 wet moorings 36’ to <40’ - 36, 2 wet moorings 41’ to 46’ - 10, 3 wet moorings
238
50 ft.
2 ft.
$17.00/ vehicle/ trailer $150.00/ season - Resident $180.00/ season -Non-Resident $334.75/ season - charter

Recreational Boating Feasibility and Capacity Study – Phase 1 Final Report June 2014
TOURISTICS + Shoreplan Engineering Limited 46
EXHIBIT 1A MARINAS, YACHT AND BOAT CLUBS WITHIN HALTON REGION – NUMBER AND SIZE OF SLIPS (Continued) Marina/Yacht/Boat Club Location Total
Slips Number of Slips
by Length
Seasonal Slips
Transient Slips
Seasonal Slips1
Occupied
Max. Length
Min. Draft
Fuel Launch Ramp
Marine Supplies
Oakville Harbours Marina - Bronte Harbour
Oakville, Ontario Lakeshore Road East (905) 338-4188
254
<26’ - 33 26’ to <30’ - 101, 50 wet moorings 30’ to <36’- 116, 57 wet moorings 36’ to <40’ - 4
254
36 ft.
2 ft.
$17.00/ vehicle/ trailer $150.00/ season - Resident $180.00/ season -Non-Resident $334.75/ season - charter
Yes
Oakville Power Boat Club Oakville, Ontario 150 Water Street 905-844-3607
62
<26’ - 0 26’ to <30’ - 8 30’ to <36’- 10 36’ to <46’ - 39 46’+ - 5
60
2 Others depend on status of seasonal
52 ft.
4 ft.
Gas
Bronte Outer Harbour Marina
Bronte, Ontario 2340 Ontario Street 905-827-7575
420
<26’ - 52 26’ to <30’ - 52 30’ to <36’- 160 36’ to <46’ - 102 >46’ - 30
396
24 Seasonal slips used by transients as they become available
65 ft.
6 ft.
Reg-ular gas, High test gas, Diesel
Yes
Bronte Harbour Yacht Club Bronte, Ontario 2514 Lakeshore Road West 905-827-6437
18
18 Mediter- ranean bow in moorings
1 finger dock
Depends on status of seasonal
30 ft.
5 ft.
Yes No charge - included in yacht fees
LaSalle Park Marina Burlington, Ontario 831 LaSalle Park Road (905) 633-9483
219
30’ - 219
219
Depends on status of seasonal
37.5 ft.
35 ft.
Yes Free Public Ramp
Note: 1,268 seasonal slips were occupied during the 2013 boating season. The occupancy numbers for each individual marina/yacht/boat club have been removed from the EXHIBIT to protect the confidence in which they were given

Recreational Boating Feasibility and Capacity Study – Phase 1 Final Report June 2014
TOURISTICS + Shoreplan Engineering Limited 47
EXHIBIT 1B MARINAS, YACHT AND BOAT CLUBS WITHIN HALTON REGION – FACILITIES AND SERVICES
Marina/Yacht/Boat Club
Haulout Repairs Food Facilities Shore Power (amps)
Pumpout Recreation Facilities
Sales Hookups Winter Storage
Plans for Future
Changes Oakville Club
Crane brought in for launch & haul out
Ice/Water 3 food service areas (River Bar, Dockside, Poolside)
Washrooms Showers Public telephone
15 amp.
- 14 15/30 amp. -
26 50 amp.
- 1
Outdoor swimming pool, Tennis, Badminton, Squash courts, Fitness centre, Picnic tables, Gas BBQ
Power Water WIFI
Outdoor Limited to about 15 member boats per year
Upgrading docking area, 20 slips with modern power & water hookups
Oakville Yacht Squadron
Dinghy crane, Mast crane, Crane brought in for launch & haul out
Kitchen facilities, Bar, Ice
Washrooms Showers
30 amp.
at all slips
Picnic tables, Gas BBQs
Power Water
Outdoor - 80 boats, may vary slightly depend-ing on the mix request-ing storage
New sailing building (for sailing school & dry sailors) New dry sail lift Enlarged dry sail area Clubhouse renovations
Oakville Harbours Marina - Oakville Harbour
Crane brought in for launch & haul out
Ice/Water Soft drink vending machine
Washrooms Showers Public telephone
30 amp.
- 76 50 amp.
- 41
Yes
$40.00 seasonal
pass
Picnic tables
Power Water
Outdoor - 120
Oakville Harbours Marina - Bronte Harbour
35 ton travel lift, Mast crane
Marine shop operated by inde-pendent owner (Facility leased from Town)
Ice/Water Soft drink vending machine
Washrooms Public telephone
30 amp.
- 76 50 amp.
- 4
Picnic tables
Yacht broker
Power Water
Outdoor - 270 Have room for 30 more if they come during haulout so boats can be arrangedRoom for 40 more if rid of abandoned boats
Converting wet moorings to finger docks in Bronte, number to be decided Adding full service (hydro, water to finger docks)

Recreational Boating Feasibility and Capacity Study – Phase 1 Final Report June 2014
TOURISTICS + Shoreplan Engineering Limited 48
EXHIBIT 1B MARINAS, YACHT AND BOAT CLUBS WITHIN HALTON REGION – FACILITIES AND SERVICES (Continued)
Marina/Yacht/Boat Club
Haulout Repairs Food Facilities Shore Power (amps)
Pumpout Recreation Facilities
Sales Hookups Winter Storage
Plans for Future
Changes Oakville Power Boat Club
Crane brought in for launch & haul out only for members
Club house with bar, Snacks, Licensed patio tent, Ice
Washrooms Showers Coin laundry
30 amp.
at all slips
Yes
Free for members $15.00 for
visitors
Picnic tables, Gas BBQs, Covered outdoor dining area, Children’s play area, Pool table, Satellite TV
Power Water WIFI
Outdoor Seasonal members only - 58 boats on-site
Upgrading hydro service (5 to 8 slips) to 50 amp.
Bronte Outer Harbour Marina
50 ton travel lift Mast crane Hydraulic trailer
Ice/Water Restaurant
Washrooms Showers Garbage & recycling stations
15 amp.
- 52, 30 amp. - 308,
50 amp. - 36
Yes
$16.00/ Pumpout
2 covered, floating picnic docks, Gas BBQs
Power Water WIFI
Outdoor Limited to 220 boats
None, do have space for approx 100 more slips if smaller slips removed
Bronte Harbour Yacht Club
Mast crane, Crane brought in for launch & haul out
Ice/Water Bar Occasional kitchen
Washrooms Showers Public telephone
15 amp.- 6
BBQs Lawn area
Power Water
Outdoor - 60 boats
Considering renovation of clubhouse
LaSalle Park Marina 80 ton Crane brought in for launch & haul out by BSBC at LaSalle Pier
Con-tractors do come to marina for minor repairs
Only with special occasion permits
Washrooms Showers Public telephone
15 amp. tempor-
ary shared
use
Yes
$50.00 for seasonal pass for
non BSBC LaSalle Marina users
Picnic tables BBQs on floating dock, (Wading pool, Children’s play area, Baseball diamond in LaSalle Park)
Shared power Water
WIFI
Outdoor - 75 boats via BSBC
Plans to add 120 seasonal & 20 transient slips, Permanent rock wavebreak protection, Will accommo-date up to 50 ft. boats, 30 to 50 amp. at all slips

Recreational Boating Feasibility and Capacity Study – Phase 1 Final Report June 2014
TOURISTICS + Shoreplan Engineering Limited 49
EXHIBIT 1C MARINAS, YACHT AND BOAT CLUBS WITHIN HALTON REGION – FEES AND USER PATTERNS
Marina/ Yacht/Boat
Club
Rental Rates Winter Storage Rates
Percentage of Seasonal Boats
Seasonal Boater Market Area
Turn Away Business
Number of Transient
Boats
Average Length of
Stay
Primary Market Area
(Transient Boats)
Seasonal Transient Power Sail
Oakville Club $3.02/ft. Cradle storage $30.00 Dinghies $85.00
First night free for reciprocals Others $35.00/ Night
$2.87/ft. Launch/haul out approximately $200.00 each event
100%
Oakville 87% Burlington 11% (All of Halton Region 98%)
440
1 night
48% Toronto 23% western end Lake Ontario 11% Niagara 11% New York State 5% east of Toronto
Oakville Yacht Squadron
$4.26/sq. ft.
$2.53/sq. ft. (includes all costs) members must contribute volunteer hours to haul-out and launch and must prep their own masts, cradles, bottom wash, and mast/cradle storage
100%
Oakville 75% Burlington 6% (All of Halton Region 83%)
200
2 days
75% Toronto 15% Western Lake Ontario 10% Niagara Region
Oakville Harbours Marina - Oakville Harbour
$68.80/ft. finger serviced $61.44/ft. finger non-serviced $150.00 - cradle storage $139.05 - trailer storage (1 axle) $190.55 (2-3 axles) Summer storage $0.90/sq. ft./month $25.75 TOWARF fee - for all slip holders 10% non- residents surcharge
$4.01/sq. ft. (includes haul out, bottom wash, storage, launch) $3.50/sq. ft. storage only - no service
35%
65%
Oakville 88% Burlington 4% (All of Halton Region 95%)

Recreational Boating Feasibility and Capacity Study – Phase 1 Final Report June 2014
TOURISTICS + Shoreplan Engineering Limited 50
EXHIBIT 1C MARINAS, YACHT AND BOAT CLUBS WITHIN HALTON REGION – FEES AND USER PATTERNS (Continued)
Marina/ Yacht/Boat
Club
Rental Rates Winter Storage Rates
Percentage of Seasonal Boats
Seasonal Boater Market Area
Turn Away Business
Number of Transient
Boats
Average Length of
Stay
Primary Market Area
(Transient Boats)
Seasonal Transient Power Sail
Oakville Harbours Marina - Bronte Harbour
$48.10/ft. wet mooring - 25’ & under. $49.10/ft. wet mooring - 26’ $50.10/ft. wet mooring - 27’ $51.10/ft. wet mooring - 28’ $52.10/ft. wet mooring - 29’ $53.10/ft. wet mooring - 30’ $54.10/ft. wet mooring - 31’ $56.60/ft. wet mooring - 30’ to 35’ $57.89/ft. wet mooring - 36’ & over
$4.63/sq. ft. up to 12’ beam $4.94/sq. ft. over 12’ beam (includes haul out, bottom wash, storage, launch) $3.50/sq. ft. storage only - no service
25%
75%
Oakville 88% Burlington 4% (All of Halton Region 95%)
Oakville Power Boat Club
$4.75/sq. ft. Members expected to participate in launch/ haulout, if not assessed a fee of $100.00
$1.50/ft. daily serviced
Included in annual membership and docking fees
100%
Oakville 75% Burlington 10% (All of Halton Region 95%)
62
1 - 2 nights
Varies across dozens of boat clubs on Lake Ontario
Bronte Outer Harbour Marina
$72.00/ft. 20’ - 22’ slip $72.00/ft. 26’ - 28’ slip $73.00/ft. 30’ slip $73.00/ft. 32’ - 36’ slip $74.00/ft. 40’ - 45’ slip $76.00/ft. 50’ and longer
$1.40/ft. daily $1.20/ft. weekly $1.00/ft. monthly $10.00 <3hrs - under 35’ $15.00 <3hrs - 35’ & over
$5.35/sq. ft. (haul out, launch, bottom wash) $4.50/sq. ft. storage only $10.00/linear ft. of mast (de-step, store, re-step)
56%
44%
Oakville 41% Burlington 32% (All of Halton Region 80%)
51% want 28’ - 34’ 33% want 36’ - 45’ 10% want >45’ 6% want <28’
498
1 - 2 days
36% Toronto 24% Halton 22% Peel 10% Niagara 6% Hamilton 2% U.S.

Recreational Boating Feasibility and Capacity Study – Phase 1 Final Report June 2014
TOURISTICS + Shoreplan Engineering Limited 51
EXHIBIT 1C MARINAS, YACHT AND BOAT CLUBS WITHIN HALTON REGION – FEES AND USER PATTERNS (Continued)
Marina/ Yacht/Boat
Club
Rental Rates Winter Storage Rates
Percentage of Seasonal Boats
Seasonal Boater Market Area
Turn Away Business
Number of Transient
Boats
Average Length of
Stay
Primary Market Area
(Transient Boats)
Seasonal Transient Power Sail
Bronte Harbour Yacht Club
$52.47/ft. 26’ or less $53.57/ft. 27’ $54.67/ft. 28’ $55.77/ft. 29’ $56.32/ft. 30’
$3.45/sq. ft. (includes haul out/launch, bottom wash, mast storage)
1%
99%
Oakville 55% Burlington 22% (All of Halton Region 80%)
25
1 day
60% GTA 40% Golden Horseshoe
LaSalle Park Marina
$1,615.00 <25’ $1,980.00 26’ - <30’ $2,189.00 31’ - <35’ $2,553.00 36’ - <37.5’ $310.00 (in excess of 12’ beam) June 1 - Sept 30 $1,200.00 <20’ $1,000.00 PWC in water $1,300.00 PWC on dock
$40.00/ Night for non- reciprocal
40%
60%
Burlington 60.8% (All of Halton Region 62.4%) Hamilton/ Golden Horseshoe Area 25%
’
62
2 days
75% GTA 20% Niagara Region 5% New York State & further
Note: There were 470 boats on the waiting list for slips during the 2013 boating season, 73 percent were looking for slips 36 feet are greater in length. The numbers for each individual marina/yacht/boat club have been removed from the EXHIBIT to protect the confidence in which they were given

Recreational Boating Feasibility and Capacity Study – Phase 1 Final Report June 2014
TOURISTICS + Shoreplan Engineering Limited 52
EXHIBIT 1D MARINAS, YACHT AND BOAT CLUBS WITHIN HALTON REGION – ASSESSMENT OF DOCKS, FAIRWAYS, BREAKWATERS AND FUEL DOCKS
Marina/
Yacht/Boat Club
Docks Fairways Condition of Breakwater Structures
and/or Seawalls
Fuel Dock State of
Repair of Main & Finger Docks
Adequacy of Width of Main Dock
Adequacy of Width of Finger
Docks
Stability of Finger
Docks
Adequacy of Depth of Water at Finger
Docks
Adequacy of Depth of Water
in Fairways
Adequacy of Width
of Fairways
State of Repair
of Dock, Pumps
& Storage Tanks
Adequacy of Security When Not
in Use
Adequacy of
Location for Safety Purposes
Oakville Club
Not Applicable
Not Applicable
Not Applicable
Not Applicable
River Dredged Regularly
River Dredged Regularly
Sub-standard
Not Applicable Not Applicable
Not Applicable
Not Applicable
Oakville Yacht Squadron
Fair Minimum Not Applicable
Not Applicable
River Dredged Regularly
River Dredged Regularly
Sub-standard or inadequate
Some New and Some Dilapidated
Not Applicable
Not Applicable
Not Applicable
Oakville Harbours Marina - Oakville Harbour
Adequate Adequate Adequate Adequate River Dredged Regularly
River Dredged Regularly
Adequate, Sub-standard or inadequate
Under Reconstruction
Not Applicable
Not Applicable
Not Applicable
Oakville Harbours Marina - Bronte Harbour
Adequate Adequate Adequate Adequate Poor for Shore Attached
River Dredged Regularly
River Dredged Regularly
Adequate, Sub-standard or inadequate
Adequate to Poor
Not Applicable
Not Applicable
Not Applicable
Oakville Power Boat Club
Poor (Hazardous) within basin Poor to Adequate along river
Adequate Poor to Adequate
Adequate River Dredged Regularly
River Dredged Regularly
Sub-standard or inadequate
Poor (Hazardous
Adequate Poor Adequate
Bronte Outer Harbour Marina
Good Good Good Good Good Good Adequate Good Good Good Good
Bronte Harbour Yacht Club
Adequate Not Applicable
Adequate Poor River Dredged Regularly
River Dredged Regularly
Adequate, Sub-standard or inadequate
Adequate to Poor
Not Applicable
Not Applicable
Not Applicable
LaSalle Park Marina
Frequently Damaged by Wave Action
Adequate Adequate Adequate Good Good Good Inadequate Docks and Boat exposed to excessive waves
Not Applicable
Not Applicable
Not Applicable
Source: Shoreplan Engineering Limited

Recreational Boating Feasibility and Capacity Study – Phase 1 Final Report June 2014
TOURISTICS + Shoreplan Engineering Limited 53
EXHIBIT 1E MARINAS, YACHT AND BOAT CLUBS WITHIN HALTON REGION – ASSESSMENT OF PUMPOUT STATIONS, LAUNCH RAMPS AND SECURITY MEASURES
Marina/ Yacht/Boat
Club
Pumpout Station
Launch Ramp Adequacy of Security Measures
State of Repair of
Dock, Pumps & Storage Tanks
State of Repair
Adequacy of Ramp
Slope
Adequacy of Ramp Length
Adequacy of Depth of Water for Launch/ Haulout
Adequacy of
Temporary Parking
Adequacy of Design for Ease
of Use
At Finger Docks During Boating Season
For Winter Storage of
Boats
Oakville Club Not available Not available Not available Not available Not available Not available Not available Good Good Oakville Yacht Squadron
Not available Not available Not available Not available Not available Not available Not available Poor Adequate
Oakville Harbours Marina - Oakville Harbour
Poor Poor Ramp condition under review by Town
Appears too flat above water
Unknown Town is pursuing redesign
Unknown Town is pursuing redesign
Available Poor Interferes with road traffic
Poor Poor
Oakville Harbours Marina - Bronte Harbour
Not available Poor Appears too steep above water
Functional Functional Subject to siltation
Available Poor No docks provided for boarding
Poor Poor
Oakville Power Boat Club
Functional Not Available Not Available Not Available Not Available Not Available Not Available Poor Poor
Bronte Outer Harbour Marina
Good Not Available Not Available Not Available Not Available Not Available Not Available Good Good
Bronte Harbour Yacht Club
Not available Functional Available to member only
Functional Available to member only
Appears Functional Available to member only
Unknown Subject to siltation Available to member only
Requirements Unknown Available to member only
Functional Available to member only
Not applicable Good
LaSalle Park Marina
Not available Adequate Adequate Adequate Adequate Parking not provided
Adequate Good Not Applicable
Burlington Sailing & Boating Club Association
Not available Poor Ramp under Reconstruction
Poor Poor Very Poor Provided as part of public parking at the park
Readily accessible to club members; available to the public
Not applicable Good
Source: Shoreplan Engineering Limited

Recreational Boating Feasibility and Capacity Study – Phase 1 Final Report June 2014
TOURISTICS + Shoreplan Engineering Limited 54
EXHIBIT 2A PROGRAMS OFFERED BY BOATING CLUBS WITHIN HALTON REGION Boating Club Burloak Canoe
Club Burlington Sailing and Boating Club
Burlington Beach Catamaran Club
Wai Nui O Kanaka Outrigger Canoe Club
Location Oakville, Ontario 160 Water Street 905-338-8287
Burlington, Ontario 841 LaSalle Park Road 905- 681-6547
Burlington, Ontario Lakeshore Road
Oakville, Ontario 2479 Hixon Street 905-339-2370
Membership 280 More than 2012
176 30 Full - 77 Children in camps - 200 10% higher than 2012
Type and number of boats used by Club
4 War canoes - 14 people + cox 5 C4 - 4 people 4 C2 - 2 people 19 C1 - 1 person 7 K4 - 4 people 8 K2 - 2 people 32 K1 - 1 person 2 Dragon boats 40 miscellaneous small boats 5 Aluminum runabouts Dragon boats are used by non-members, boats share the club dock and use parking lot
3 dry dinghy boats - 2 persons/boat 1 24’ keel sail boat - 4 persons 1 26’ keel sail boat - 5 persons 1 30’ Committee Boat “Underway”
30 catamarans 7 outrigger canoes - 6 person 7 outrigger canoes (club) - 2 person 4 outrigger canoes (members) - 2 person 1 outrigger canoe (club) - 4 person 5 outrigger canoes (club) - 1 person 20 outrigger canoes (members) - 1 person 12 stand up paddle boards (club) 25 stand up paddle boards (members)
Types of facilities used to store boats
Indoor dry stacking - attached to building, free standing
2 keel boats at LaSalle Park Marina slips Dinghy sail boats in on land compound
Pins on the beach All stored in outdoor dry-stack racks in club compound
Number of each storage facility
5 rentals from LaSalle Park Marina Secure compound
One dry storage One shed
One dock in Oakville - 10 sections of EZ dock stabilized for disabled access
Membership Programs
Elementary (8 to 15) Canoe Kids Summer Camp Youth (15+) - non-competitive Youth (15+) - racing High performance (15+) Masters (25+) - non-competitive Masters (25+) - racing
Sailing school age 7+ Cruising, Racing, Seminars, Social events, Raft-ups
None Family Days and Intros for people 8 years and up. Adult Open(16 plus), Masters and Seniors Disabled Introducing childrens programs, plus summer camps
Frequency of Membership Programs
Elementary (8 to 15) - May to June & September (Monday & Friday 4:30 to 6:00pm) - July to August (Monday through Friday 9:30 to 12:30 + some weekend regattas)
Continually throughout boating season Social and seminars offered year round
N/A Open and Masters 3x Week May to October inclusive, plus more sessions in peak summer periods Seniors 2x Week June to September inclusive.

Recreational Boating Feasibility and Capacity Study – Phase 1 Final Report June 2014
TOURISTICS + Shoreplan Engineering Limited 55
EXHIBIT 2A PROGRAMS OFFERED BY BOATING CLUBS WITHIN HALTON REGION (Continued) Boating Club Burloak Canoe
Club Burlington Sailing and Boating Club
Burlington Beach Catamaran Club
Wai Nui O Kanaka Outrigger Canoe Club
Frequency of Membership Programs
Youth (15+), High Performance (15+), Masters (25+) - land training October to April, on-water May to October
Non-membership Programs
Dragon boating Canoe Kids Summer Camp (one week Monday to Friday 9:00am to noon)
Disabled Sailing (all ages) Sea Cadet training, Sail training for underprivileged children
None Seniors and disabled (open to all people with disabilities) programs Family and trial days, Friday night social paddling to non-members
Frequency of Non-membership Program Offerings
Twice a week by club, crews can access boats 7 days a week for practice 6 one week camps in July and August
Weekly, bi-weekly, monthly throughout boating season
N/A Friday Night Socials 12x weather permitting Disabled programming 8 x Seniors twice a week for 12 weeks Friends and Family special days 4 x year, open houses 4x year
Number of Participants
Small increase 2013 over 2012
Adult Learn to Sail/Sail Without a Owning a Boat - 26 increasing yearly Able Sail (Disabled) - 29 increasing yearly Sailing School, children and adults – 100 increasing yearly
N/A
Races or regattas at club facilities
No
Racing twice weekly May to October - 15 boats each time Sailing school regattas weekly 8 times - 6 boats each time June regatta one weekend (open to non-members) - 60 boats
Wednesday night races - 15 boats each time Sunday races - 10 to 12 boats each time
Informal regattas approx. 4 times a year, dates are generally weather dependent.
Launch ramp Yes, use included in membership
Ramp is limited to human-powered craft and is not fee based.
Haulout Crane brought in for launch & haul out
None
Food Kitchen, dining room in Clubhouse for members’ and guests’ use
None

Recreational Boating Feasibility and Capacity Study – Phase 1 Final Report June 2014
TOURISTICS + Shoreplan Engineering Limited 56
EXHIBIT 2A PROGRAMS OFFERED BY BOATING CLUBS WITHIN HALTON REGION (Continued) Boating Club Burloak Canoe
Club Burlington Sailing and Boating Club
Burlington Beach Catamaran Club
Wai Nui O Kanaka Outrigger Canoe Club
Facilities Washrooms Showers Public telephone
Portable washroom Club purchased washroom trailer donated it to the Town of Oakville, who are contracted to maintain it for club use and the power boaters use on site. No telephone
Recreational Facilities
Gas BBQs, (Wading pool, Children’s play area, Baseball diamond in LaSalle Park)
One picnic table Gas BBQ
Two picnic tables Gas BBQ
Winter Storage Outside in secure compound - 75 boats
Compound storage - 30 boats
Outdoor storage on racks
Plans for future changes
Will expand size of clubhouse with upper space
None Depending on City of Burlington
Club anticipates modest growth facilitated by improved storage
Turn Away Business Turn away kids applying to elementary program (8 to 13). This is not only related to availability but sufficient numbers of suitable boats does have an impact Turn away kids for Canoe Kids Summer Camp Can only accommodate 2 or 4 crews for Dragon Boating, with more dock space could add many more
No 8 Can add racks to accommodate modest growth for next 3 to 5 years
Capacity for Expansion
Yes for sail training as demand expands
Not at present Utilize existing space to the fullest
Need at least 100 feet of shoreline for dockage in order to meet demand for programs, currently only have 25 to 30 feet. Floating docks further up the river would be a temporary but not ideal solution
Additional space and secured parking for people with disabilities would allow the club to expand its membership

Recreational Boating Feasibility and Capacity Study – Phase 1 Final Report June 2014
TOURISTICS + Shoreplan Engineering Limited 57
EXHIBIT 2B PROGRAMS OFFERED BY YACHT AND SAILING CLUBS WITHIN HALTON REGION Club The Oakville Club Oakville Yacht
Squadron Bronte Harbour Yacht Club
National One Design Sailing Academy
Location Oakville, Ontario 56 Water Street 905-845-0231
Oakville, Ontario 905-338-9379
Oakville, Ontario 2514 Lakeshore Road West 905-827-6437
Oakville, Ontario 2340 Ontario Street 800-825-8719
Membership Senior and Social - 1,019 54 additional members in 2013
Full - 128 Intermediate - 6 Associate - 35 Other - 36 All membership numbers are higher than in 2012
Senior Associate Intermediate Dinghy Paddling Junior 221 - approximately same as 2012
N/A
Type and number of boats used by Club
Sailboats - 49 (3 to 8 persons per boat) Stand Up Paddle Boards - 4 Kayaks (single) - 12
Sailboats - 129 Dinghy – 20
Sail boats - 120 Canoes - 2 Stand Up Paddle Boats - 1 Kayaks - 10 Dinghy - 10
10 metre Flying Tiger Keelboats - 2 7.5 metre Flying Tiger Keelboat - 1 Racing Keelboats - 2
Types of facilities used to store boats
Outdoor stacks for kayaks - 16 Outdoor cradles in winter for sail boats – 14
Docks - 80 Dry Sail - 10 berths Dinghy - 20 berths
Docks Dry sail on land
Docks – 5
Number of each storage facility
Outdoor stacks for kayaks - 16 Outdoor cradles in winter for sail boats – 14
Docks - 80 Dry Sail - 10 berths Dinghy - 20 berths
Docks - 18 Dry sail on racks - 15
Membership Programs
Training & classes, summer day camps Yachting group +/- 100 members - racing, cruising, sailpast
Full, Intermediate, Associate, Junior, Crew, Honourary/ Life members
Sailing instruction Racing Cruising Social activities
Introduction Course Introduction to Sailing Learn to Cruise Introduction to Racing Advanced Racing Winter Sailing Training Corporate Team Building
Frequency of Membership Programs
Junior Sailing School - 4 x 2 week sessions Adult Sailing School - 6 x4 x 2 evenings/ week on-water sessions Race Programme - year long for participants
Sailing instruction - junior sailors weekly in July & August adults bi-weekly May to August Racing - weekly in summer Cruising - weekly in summer Social activities - weekly
Non-membership Programs
Members only Members only Junior sailing lessons Blind sailing program Regattas

Recreational Boating Feasibility and Capacity Study – Phase 1 Final Report June 2014
TOURISTICS + Shoreplan Engineering Limited 58
EXHIBIT 2B PROGRAMS OFFERED BY YACHT AND SAILING CLUBS WITHIN HALTON REGION (Continued) Boating Club The Oakville Club Oakville Yacht
Squadron Bronte Harbour Yacht Club
National One Design Sailing Academy
Frequency of Non-membership Program Offerings
N/A N/A Junior sailing lessons Blind sailing program - one week Regattas - 2
Number of Participants
Introduction Course - 32
Races or regattas at club facilities
5 weekend club races per season (5 to 10 boats each) 1 open regatta in August - 50 boats (60% from other clubs)
May to September - club racing Wednesday & Thursday evenings Weekend & special races - 6 per year Major regattas - 3 per year
Weekly races - 55 boats Regattas - GHYRA 60 boats, Bronte Rocks 90 boats
Plans for future changes
No changes, upgrades to second half of dock with proper power/water pedestals
New sailing school, New dry sail boat crane, new dry sail storage area
Major club renovation
Turn Away Business 9 boats Sailing school programme is fully enrolled for 3 of the 4 session operating at over 100% capacity 6 of 8 weeks & at 85% capacity for 2 of 8 weeks Adult programme operating at 75 to 85% capacity
Small waiting list for junior sailing lessons
Capacity for Expansion
No plans to expand sailing program
Sailing school has plans to increase capacity currently underway
None

Recreational Boating Feasibility and Capacity Study – Phase 1 Final Report June 2014
TOURISTICS + Shoreplan Engineering Limited 59
EXHIBIT 3 KELSO CONSERVATION BOAT RENTALS
Time Single Kayaks Double Kayaks Canoes Paddle Boats Stand Up Paddle Boards
1 hour $16.00 $19.00 $19.00 $23.00 $20.00 2 hour $28.00 $33.00 $33.00 $40.00 $35.00 Additional ½ hour
$9.00 $11.00 $11.00 $13.00 $11.00
Equipment supplied for
1 person 2 people Maximum 3 adults or 2 adults & 2 children
Maximum 2 adults & 2 children
1 person
Rentals available late April to early October

Recreational Boating Feasibility and Capacity Study – Phase 1 Final Report June 2014
TOURISTICS + Shoreplan Engineering Limited 60
EXHIBIT 4A MARINAS AND YACHT CLUBS WITHIN THE GREATER TORONTO AREA (GTA)/GOLDEN HORSESHOE – NUMBER AND SIZE OF SLIPS
Marina/
Yacht/Boat Club Location Total
Slips Seasonal
Slips Transient
Slips Seasonal
Slips1
Occupied
Max. Length
Draft Fuel Launch Ramp
Marine Supplies
Scarborough Bluffs Sailing Club
Scarborough, Ontario Brimley Road South 416-264-2692
4
4 reciprocal
Yes (4)
Highland Yacht Club Scarborough, Ontario Brimley Road South 416-267-0224
120
108
12
12.8
2.1
Gas Diesel
Yes
Cathedral Bluffs Yacht Club Scarborough, Ontario Brimley Road South 416-261-0537
350
335
15
15.2
1.8
Bluffers Park Yacht Club Scarborough, Ontario 2369 Kingston Road 416-261-6993
142
127
15
13.7
2.1
Gas Diesel
Bluffers Park Marina Scarborough, Ontario 7 Brimley Road South 416-266-4556
430
410
20
15.2
3.6
Gas Diesel
Yes
Yes
Ashbridge’s Bay Yacht Club Toronto, Ontario 30 Ashbridge’s Bay Park Road 416-698-4498
280
274
6
11.6
3.8
Gas Diesel
Toronto Hydroplane & Sailing Club
Toronto, Ontario 20 Ashbridge’s Bay Park Road 416-694-6918
210
190
20
11
3.7
Yes
Aquatic Park Sailing Club Toronto, Ontario 2 Leslie Street 416-631-3940
10 10 + 100
moorings
15.2 5.8
Outer Harbour Marina Toronto, Ontario 475 Unwin Avenue 416-778-6445
654
644
10 30.5
6.1
Gas Diesel
Yes
Royal Canadian Yacht Club Toronto, Ontario Centre Island 416-967-7245
400
390
10 reciprocal
13.7
2.4
Gas Diesel
Queen City Yacht Club Toronto, Ontario Algonquin Island 416-203-0929
110
104
6 Reciprocal
12.2
2.1
Island Yacht Club Toronto, Ontario 400 Queens Quay West 416-362-6588
300
285
15
16.8
4.6 in bay
2.4 at docks
Hanlan’s Point Toronto, Ontario Hanlan’s Point 416-203-1055
150
150
22.9
4.6

Recreational Boating Feasibility and Capacity Study – Phase 1 Final Report June 2014
TOURISTICS + Shoreplan Engineering Limited 61
EXHIBIT 4A MARINAS AND YACHT CLUBS WITHIN THE GREATER TORONTO AREA (GTA)/GOLDEN HORSESHOE – NUMBER AND SIZE OF SLIPS (Continued)
Marina/
Yacht/Boat Club Location Total
Slips Seasonal
Slips Transient
Slips Seasonal
Slips1
Occupied
Max. Length
Draft Fuel Launch Ramp
Marine Supplies
Toronto Island Marina Toronto, Ontario Centre Island 416-203-1055
150
100
50
21.3
2.1
Gas Diesel
Yes
Marina Quay West Toronto, Ontario 235 Queens Quay West 416-203-1212
200
180
20
18.3
3.65
Yes
Marina 4 Toronto, Ontario 235 Queens Quay West 416-203-1212
100
90
10
12.2
6.1
Alexandra Yacht Club Toronto, Ontario 2 Stadium Road 416-260-8690
100
98
2 reciprocal 10.7
3.1
National Yacht Club Toronto, Ontario 1 Stadium Road 416-260-8686
173
170
+ 80 moorings
3
13.7 - sailboats
12.2 - power boats
2.6
Ontario Place Marina Toronto, Ontario 955 Lakeshore Boulevard 416-314-9858
350
325
25
27.4
4.3
Gas Diesel
Yes
Toronto Sailing & Canoe Club
Toronto, Ontario 1391 Lakeshore Blvd. West 416-533-5907
93
91
moorings
2 moorings
10.4
1.8
4 launch ramps
Boulevard Club Toronto, Ontario 1491 Lakeshore Blvd. West 416-532-3341
58
56
2 reciprocal 18.3
2.4
Mimico Cruising Club Toronto, Ontario 200 Humber Bay Park Road W 416-252-7737
302
287
15
15.2
3.0
Etobicoke Yacht Club Toronto, Ontario 300 Humber Bay Park Road W 416-259-1159
650
640
10 reciprocal
13.4
3.7
Toronto Humber Yacht Club Toronto, Ontario 101 Humber Valley Road 416-231-4650
118
114
4 reciprocal
Clear-ance under bridge 3.0
9.1
1.5
Gas
Yes
Lakeshore Yacht Club Toronto, Ontario 76 Colonel Sam Smith Park Dr 416-255-3701
164
154
10 reciprocal
14.0
3.7
Gas Diesel
Yes

Recreational Boating Feasibility and Capacity Study – Phase 1 Final Report June 2014
TOURISTICS + Shoreplan Engineering Limited 62
EXHIBIT 4A MARINAS AND YACHT CLUBS WITHIN THE GREATER TORONTO AREA (GTA)/GOLDEN HORSESHOE – NUMBER AND SIZE OF SLIPS (Continued)
Marina/
Yacht/Boat Club Location Total
Slips Seasonal
Slips Transient
Slips Seasonal
Slips1
Occupied
Max. Length
Draft Fuel Launch Ramp
Marine Supplies
Port Credit Yacht Club Mississauga, Ontario 115 Lakefront Promenade 905-278-5578
450
450
Depends on status of seasonal
18.3
3.1
Gas Diesel
Yes
Lakefront Promenade Marina
Mississauga, Ontario 135 Lakefront Promenade 905-274-7601
167
162
5
13.7
2.4
Gas Diesel
Yes
Yes
Port Credit Harbour Marina Mississauga, Ontario 1 Port Street East 905-274-1595
675
645
30
15.2
5.5
Gas Diesel
Yes
Yes
Credit Village Marina Mississauga, Ontario 12 Stavebank Road 905-891-5217
63
63
18.3
2.4
Gas Diesel
Yes (2)
Yes
St. Catharines Marina St. Catharines, Ontario 200 Broadway Avenue 905-935-5522
181
151
30
24.4
2.4
Gas Diesel
Yes
Yes
Port Dalhousie Pier Marina St. Catharines, Ontario 80 Lighthouse Road 905-646-5515
465
445
20
30.5
4.3
Yes
Yes
Dalhousie Yacht Club St. Catharines, Ontario 74 Lighthouse Road 905-934-8325
100
90
10
12.2
3.7
Gas Diesel
Yes
Beacon Harbourside Yacht Club
Jordan, Ontario 2793 Beacon Boulevard 905-562-7888
110
100
10
12.2
4.3
Gas Diesel
Yes
Yes
Lakecourt Marine Grimsby, Ontario 471 Maple Avenue 905-945-5852
80
75
5
9.1
1.68
Gas Diesel
Yes
Yes
Foran’s Marine Grimby, Ontario 15 Lake Street 905-945-5284
125
115
10
12.2
1.37
Gas
Yes
Yes
Fifty Point Marina Winona, Ontario 1479 Baseline Road 905-643-2103
330
310
20
18.3
2.7
Gas Diesel
Yes
Yes
Newport Yacht Club & Marina
Stoney Creek, Ontario 31 Sunvale Place 905-643-0195
240
230
10
15.2
3.7
Royal Hamilton Yacht Club Hamilton, Ontario McNab Street 905-528-8464
155
150
5 reciprocal
50.3
4.6
Gas
MacDonald Marine Services Hamilton, Ontario 102 Harbourfront Drive 905-529-9205
135
129
6 reciprocal
15.2
3.7
Yes
Yes

Recreational Boating Feasibility and Capacity Study – Phase 1 Final Report June 2014
TOURISTICS + Shoreplan Engineering Limited 63
EXHIBIT 4A MARINAS AND YACHT CLUBS WITHIN THE GREATER TORONTO AREA (GTA)/GOLDEN HORSESHOE – NUMBER AND SIZE OF SLIPS (Continued)
Marina/
Yacht/Boat Club Location Total
Slips Seasonal
Slips Transient
Slips Seasonal
Slips1
Occupied
Max. Length
Draft Fuel Launch Ramp
Marine Supplies
Macassa Bay Yacht Club Hamilton, Ontario Harbourfront Drive 905-529-9205
110
107
3 reciprocal
12.1
1.5
Yes
Harbour West Marina 605 James Hamilton, Ontario Street West (905) 525-4330
228
228
Depends on status of seasonal
30.5
6.1
Gas Diesel
Yes
Yes
Note: 8,709 seasonal slips and moorings were occupied during the 2013 boating season; an occupancy rate of 98.6 percent. The occupancy numbers for each individual marina within the Greater Toronto Area (GTA)/Golden Horseshoe have been removed from the EXHIBIT to protect the confidence in which they were given.

Recreational Boating Feasibility and Capacity Study – Phase 1 Final Report June 2014
TOURISTICS + Shoreplan Engineering Limited 64
EXHIBIT 4B MARINAS AND YACHT CLUBS WITHIN THE GREATER TORONTO AREA (GTA)/GOLDEN HORSESHOE – FACILITIES AND SERVICES
Marina/
Yacht/Boat Club Haulout Repairs Food Facilities Shore
Power (amps)
Pumpout Recreation Facilities
Sales Hookups Winter Storage
Plans for Future
Changes Scarborough Bluffs Sailing Club
Ice/Water Kitchen & lounge in Clubhouse
Showers Washrooms
Picnic tables Gas BBQs
Public telephone
e-mail hookup
None
Highland Yacht Club Ice/Water Showers Washrooms
20 Yes Picnic tables Gas BBQs
Power Water
Outside None
Cathedral Bluffs Yacht Club
Ice/Water Restaurant
Showers Washrooms Laundry
30
Yes
Picnic tables Gas BBQs Children’s play area, Deck
Power Water
Outside
None
Bluffers Park Yacht Club
Ice/Water
Showers Washrooms Laundry
15 30
Yes
Picnic tables Gas BBQs Children’s play area
Power Water
None
Bluffers Park Marina 40 tons Mast stepping facilities
Hulls Engines Electrical Sails
Ice/Water Restaurant Snack bar
Showers Washrooms Laundry
20 30 50
Yes
$20.00
Picnic tables BBQs
Engines Boats
Power Water
Outside
None
Ashbridge’s Bay Yacht Club
Ice/Water
Showers Washrooms Laundry
15
Yes
Picnic tables Gas BBQs
Power Water
Outside
None
Toronto Hydroplane & Sailing Club
Ice/Water Showers Washrooms
15 Yes Picnic tables Gas BBQs Patio
Water
None
Aquatic Park Sailing Club
Ice/Water Showers Washrooms
Picnic tables Outside None
Outer Harbour Marina 35 ton travel lift Mast crane Fork lift
Hulls Engines Electrical
Ice/Water
Showers Washrooms Laundry
30 50
Yes $15.50 1
tank $21.80 2
tanks
Picnic tables BBQs
Power Water
Outside
Under discussion, has space for 636 more slips
Royal Canadian Yacht Club
20 ton travel lift
Ice/Water Formal dining room Snack Bar
Showers Washrooms Laundry
15 30
Yes
Adult & Children’s swimming pools Tennis courts Children’s playground, Patios
Power Water
Outside
None

Recreational Boating Feasibility and Capacity Study – Phase 1 Final Report June 2014
TOURISTICS + Shoreplan Engineering Limited 65
EXHIBIT 4B MARINAS AND YACHT CLUBS WITHIN THE GREATER TORONTO AREA (GTA)/GOLDEN HORSESHOE – FACILITIES AND SERVICES (Continued)
Marina/
Yacht/Boat Club Haulout Repairs Food Facilities Shore
Power (amps)
Pumpout Recreation Facilities
Sales Hookups Winter Storage
Plans for Future
Changes Queen City Yacht Club
Marine railway
Ice/Water Dining room Bar
Showers Washrooms Laundry
15
Yes
Picnic tables Children’s play area Indoor kids’ room
Power Water Public
telephone
Outside
None
Island Yacht Club Travel lift
Ice/Water Dining room Lounge, Bar Snack bar
Showers Washrooms Laundry
15 30
Yes
Picnic tables Gas BBQ’s Children’s playground Swimming pool Tennis courts
Power Water
Outside
None
Hanlan’s Point Ice/Water Snack bars
Showers Washrooms
15 30
Picnic tables BBQ’s, Wading pools, Tennis, Volleyball, Beaches, Bicycle rental
Power Water
None
Toronto Island Marina 15 ton travel lift Mast crane
Hulls Engines Electrical Sails
Ice/Water Groceries Restaurant Patio bar
Showers Washrooms Laundry
15 30 50
Yes Free for seasonal $15.00/ tank all others
Picnic tables
Power Water Public
telephone Wireless internet
Outside
None
Marina Quay West Ice/Water Ice cream
Showers Washrooms Laundry
30 50
Yes Token-
operated $10.00 for 30 gallons
or less
Picnic tables
Power Water Public
telephone Wireless internet
None
Marina 4 Ice/Water
Showers Washrooms Laundry
30
Yes Token-
operated $10.00 for 30 gallons
or less
Power Water Public
telephone Wireless internet
None
Alexandra Yacht Club 51/2 ton crane Rental crane for haulout/ launch
Ice/Water Kitchen
Showers Washrooms
20
Yes
Picnic tables Gas BBQ’s
Power Water Public
telephone Wireless internet
Outside
None

Recreational Boating Feasibility and Capacity Study – Phase 1 Final Report June 2014
TOURISTICS + Shoreplan Engineering Limited 66
EXHIBIT 4B MARINAS AND YACHT CLUBS WITHIN THE GREATER TORONTO AREA (GTA)/GOLDEN HORSESHOE – FACILITIES AND SERVICES (Continued)
Marina/
Yacht/Boat Club Haulout Repairs Food Facilities Shore
Power (amps)
Pumpout Recreation Facilities
Sales Hookups Winter Storage
Plans for Future
Changes National Yacht Club
Rental crane for haulout/ Launch
Ice/Water Licensed dining room Balcony for outdoor dining
Showers Washrooms Laundry
30
Picnic tables Gas BBQ’s Children’s playground
Power Water Public
telephone Wireless internet
Outside
None
Ontario Place Marina Crane Hydraulic trailers
Can be
arranged
Ice/Water Marina Grill Licensed outdoor patio
Showers Washrooms Laundry
30 50
Picnic tables
Power Water Public
telephone Wireless internet
Outside - up to 13.7 metres
None
Toronto Sailing & Canoe Club
Ice/Water Catered grill Bar, Cold snacks
Showers Washrooms
Yes
Picnic tables Gas BBQ’s
Public
telephone
None
Boulevard Club Ice/Water Dining room Licensed patio, Cafe Bar
Showers Washrooms Laundry
15 30
Yes
Indoor & Outdoor pools Badminton Tennis, Lawn bowling, Fitness Centre, Saunas Teen games room, Play area for preschoolers
Power Water Public
telephone Wireless internet
Outside
None
Mimico Cruising Club Dual purpose crane - lift up to 3,000 lbs Mast stepping.
Ice/Water Licensed restaurant Deck for outdoor dining
Showers Washrooms Laundry
20 30
Yes
Picnic tables Gas BBQ’s Children’s play area
Power Water Public
telephone Wireless internet
Outside
None
Etobicoke Yacht Club 2 ton crane Mast crane
Ice/Water Licensed Dining, Bar
Showers Washrooms Laundry
30
Picnic tables Gas BBQ’s Children’s play area
Power Water
Wireless internet
Outside
None
Toronto Humber Yacht Club
Ice/water Clubhouse Bar, Snack bar
Showers Washrooms
15
Yes
Picnic tables Gas BBQ’s
Power Water Public
telephone
Outside
None

Recreational Boating Feasibility and Capacity Study – Phase 1 Final Report June 2014
TOURISTICS + Shoreplan Engineering Limited 67
EXHIBIT 4B MARINAS AND YACHT CLUBS WITHIN THE GREATER TORONTO AREA (GTA)/GOLDEN HORSESHOE – FACILITIES AND SERVICES (Continued)
Marina/
Yacht/Boat Club Haulout Repairs Food Facilities Shore
Power (amps)
Pumpout Recreation Facilities
Sales Hookups Winter Storage
Plans for Future
Changes Lakeshore Yacht Club
Rental crane for haulout/ launch
Ice/water Clubhouse Kitchen Lounge
Showers Washrooms Laundry
30
Yes
Picnic tables Gas BBQ’s Children’s play area, Loaner bikes
Power Water Public
telephone Wireless internet
Outside
None
Port Credit Yacht Club Ice/water Clubhouse Dining room Bar, Licensed Patio
Showers Washrooms Laundry
30
Yes
Picnic tables Gas BBQ’s Swimming pool Children’s play area
Power Water Public
telephone Wireless internet
Outside - Dryland & Water
None
Lakefront Promenade Marina
Ice/water Licensed Snack bar
Showers Washrooms Laundry
30
Yes
Picnic tables Charcoal BBQ’s Children’s play area
Power Water Public
telephone Wireless internet
Outside
None
Port Credit Harbour Marina
35 ton travel lifts Fork lifts Mast crane
Hulls Engines Electrical Sails
Ice/water Restaurant Patio Bar & Grill
Showers Washrooms Laundry
30 50
Yes
Picnic tables
Power Water Some
phone jacks on docks
Public telephone Wireless internet
Inside Outside - Dryland & Water
None
Credit Village Marina Ice/water Restaurant
Showers Washrooms Laundry
30
Picnic tables
Power Water Public
telephone
None
St. Catharines Marina 35 ton travel lift Fork lift
Engines Electrical
Ice/water Restaurant Outdoor patio & gazebo
Showers Washrooms Laundry
15 20 30 50
Yes
$16.00/ service
Picnic tables
Power Water Public
telephone Wireless internet
Outside
None

Recreational Boating Feasibility and Capacity Study – Phase 1 Final Report June 2014
TOURISTICS + Shoreplan Engineering Limited 68
EXHIBIT 4B MARINAS AND YACHT CLUBS WITHIN THE GREATER TORONTO AREA (GTA)/GOLDEN HORSESHOE – FACILITIES AND SERVICES (Continued)
Marina/
Yacht/Boat Club Haulout Repairs Food Facilities Shore
Power (amps)
Pumpout Recreation Facilities
Sales Hookups Winter Storage
Plans for Future
Changes Port Dalhousie Pier Marina
30 ton travel lift
Hulls Engines Electrical Sails
Ice/water Floating restaurant Patio deck
Showers Washrooms
30
Yes
Picnic tables Beach
Engines Boats
Power Water
Telephone hookup at each slip
Public telephone Wireless internet
Outside
Under consider-ation within 5 years
Dalhousie Yacht Club 2 ton hoist
Ice/water Dining room Lounge Licensed outdoor patio
Showers Washrooms Laundry
15 30
Yes
Picnic tables Charcoal BBQs
Power Water Public
telephone
Outside
None
Beacon Harbourside Yacht Club
Hydraulic trailer & crane on call
Hulls Engines Electrical Sails
Ice/water Restaurant Outdoor patio
Showers Washrooms Laundry
15 30
Yes
Gazebo with picnic tables
Power Water
Outside
None Has capacity for additional 150 slips
Lakecourt Marine 25 ton crane
Engines Electrical
Ice/water
Showers Washrooms
15 20
Yes
Picnic tables
Power Water
None
Foran’s Marine 10 ton fork lift
Hulls Engines Electrical
Ice/water Snacks
Showers Washrooms
15 20 30
Yes
Picnic tables Children’s play area
Engines Boats
Power Water
Outside
None
Fifty Point Marina 20 ton travel lift
On call
Ice/water Licensed restaurant Coffee shop
Showers Washrooms Laundry
30
Yes $13.00/
tank weekdays $16.00/
tank weekends
Picnic tables Gas BBQs Beach Children’s play area
Power Water Public
telephone Wireless internet
Outside
Would like to due to demand, but land- locked
Newport Yacht Club & Marina
On call for Hulls Engines
Ice/water Licensed restaurant
Showers Washrooms Laundry
30
Yes
Picnic tables Gas BBQs Adjacent to Children’s play area, Tennis courts
Power Water Public
telephone
None

Recreational Boating Feasibility and Capacity Study – Phase 1 Final Report June 2014
TOURISTICS + Shoreplan Engineering Limited 69
EXHIBIT 4B MARINAS AND YACHT CLUBS WITHIN THE GREATER TORONTO AREA (GTA)/GOLDEN HORSESHOE – FACILITIES AND SERVICES (Continued)
Marina/
Yacht/Boat Club Haulout Repairs Food Facilities Shore
Power (amps)
Pumpout Recreation Facilities
Sales Hookups Winter Storage
Plans for Future
Changes Royal Hamilton Yacht Club
Rental crane for haulout/ launch
Engines Electrical
Ice/water Licensed dining room Bar
Showers Washrooms
15 30
Picnic tables Gas BBQs Children’s play area, Swimming Pool
Power Water Public
telephone Wireless internet
Outside
None
MacDonald Marine Services
Jib hoist for boats up to 10.4 m. Crane for haulout/ Launch
Hulls Engines Electrical Sails
Ice/water
Showers Washrooms
15 30
Yes
Power Water
Outside
None
Macassa Bay Yacht Club
Rental crane for haulout/ launch
Ice/water Clubhouse Bar, Snacks
Showers Washrooms
30
Picnic tables Gas BBQs
Power Water Public
telephone Wireless internet
Outside
None
Harbour West Marina 50 ton travel lift, Fork lifts, Yard carriers, 2 Mast cranes
Engines Electrical
Ice/water
Showers Washrooms Laundry
30 50
Yes
Picnic tables Gas BBQs Children’s play area
Power Water Public
telephone Wireless internet
Outside
Planning underway for 150 additional slips, has capacity for 800

Recreational Boating Feasibility and Capacity Study – Phase 1 Final Report June 2014
TOURISTICS + Shoreplan Engineering Limited 70
EXHIBIT 4C MARINAS AND YACHT CLUBS WITHIN THE GREATER TORONTO AREA (GTA)/GOLDEN HORSESHOE – FEES
Marina/ Yacht/Boat Club
Rental Rates Winter Storage Rates Waiting List Seasonal Transient
Scarborough Bluffs Sailing Club Highland Yacht Club Cathedral Bluffs Yacht Club $2,363.00 senior member annual
fees (includes slip, power, pumpout, launch/haulout, bottom wash & winter storage) $340.75 social membership
Bluffers Park Yacht Club Bluffers Park Marina $90.00/ft. at fixed docks (shore)
$84.00/ft. at floating docks (includes up to 30 amp. power, parking, water, pumpouts & 10% discount on food services) $10.00/ft. for extra 30 amp. outlet $35.00/ft. boat-on-a-trailer (ramp access) $4.35/sq. ft. summer season land storage $1.20/sq. ft. 1 month $0.55/sq. ft. 1 week - sailboat on cradles/power boat on blocks $120.00/season cradle/trailer storage annual boaters $315.00/season cradle/trailer storage winter boaters $28.00/ft. non Bluffer Park Marina members cradle/trailer storage $5.40/ft. blocking for power boats $1.20/sq. ft. per month, $0.55/sq. ft. per week for repair land storage $60.00 repair blocking for power boats $65.00/hour yard labour $75.00/half-hour forklift & operator $150.00 (1 hour minimum) tow inside harbour, Non Bluffers Park Marina members $500.00 deposit
Fixed dock $1.45/ft. per day $7.40/ft. per week $25.00/ft. per month Floating dock $1.30/ft. per day $6.80/ft. per week $23.00/ft. per month Boat trailer storage $7.50 per day $32.00 per week $80.00 per month
$4.50/sq. ft. (includes haul out, hull rinse, storage & launch) Does not include winterization $5.40/linear ft. blocking for power boats $120.00 trailer/ cradle land storage Bluffer Park Marina members - 26’ or less $28.00/ft. Bluffer Park Marina members boat & trailer land storage $28.00/ft. non Bluffer Park Marina members cradle/trailer only land storage Boat lift or launch $6.80/ft. (up to 40’) $8.95/ft. (over 40’) $3.50/ft. hull rinse $4.00/ft. mast step/de-step - (Crane use only, includes operator) $6.00/ft. for two masts Live-Aboards $4.50/sq. ft. In-water storage (includes one lift-out after each entire year) $350.00 first person $190.00 each additional person $38.00/amp. winter hydro (30 and 50 amp. available) $24.00/amp. deep winter hydro discount (Dec. 15 to Mar. 15)

Recreational Boating Feasibility and Capacity Study – Phase 1 Final Report June 2014
TOURISTICS + Shoreplan Engineering Limited 71
EXHIBIT 4C MARINAS AND YACHT CLUBS WITHIN THE GREATER TORONTO AREA (GTA)/GOLDEN HORSESHOE – FEES (Continued)
Marina/
Yacht/Boat Club Rental Rates Winter Storage Rates Waiting List
Seasonal Transient Ashbridge’s Bay Yacht Club $1,500.00 initiation fee - senior
$100.00 initiation fee - age 25+ Senior Member Boat Introduction Fees $3,500.00 - 35’ and longer $2,500.00 - > 29’ to <35’ $1,000.00 - 29’ and less $500.00 - dry sail $200.00 senior member capital reserve charge Annual membership fees $1,260.00 senior $345.00 senior associate 65+ $590.00 dinghy $65.00 junior $350.00 associate $165.00 introductory associate $345.00 out of town $3.69/sq. ft. mooring/dry sail $1.57/sq. ft. summer yard storage, boat not in use $100.00 boat haul/launch/cross haul/move
First two nights free, subsequent $20.00/night
$1.22/sq. ft. January to launch $0.64/sq. ft. haul out to December $125.00 dinghy storage fees
Toronto Hydroplane & Sailing Club
$1,130.00 initiation fee $1,582.00 wet mooring initiation fee $615.00 sailing membership $117.00 crew membership $51.00 junior membership $25.93 small locker fee $64.12 large locker fee $50.95/beam ft. (minimum 6’) $0.87/sq. ft. summer dry storage $86.19 summer trailer storage
First two nights free, subsequent $20.00/night
$0.72/sq. ft.
Aquatic Park Sailing Club

Recreational Boating Feasibility and Capacity Study – Phase 1 Final Report June 2014
TOURISTICS + Shoreplan Engineering Limited 72
EXHIBIT 4C MARINAS AND YACHT CLUBS WITHIN THE GREATER TORONTO AREA (GTA)/GOLDEN HORSESHOE – FEES (Continued)
Marina/ Yacht/Boat Club
Rental Rates Winter Storage Rates Waiting List Seasonal Transient
Outer Harbour Marina $94.45/ft. 30 amp. $102.85/ft. 50 amp. $0.54/sq. ft. weekly land storage $1.30/sq. ft. monthly $4.45/sq. ft. 6 months (minimum 150 sq. ft. for all time periods) $150.00 trailer/cradle storage 6 months $5.60/ft. blocking/cradle handling $250.00 compound move $130.00/hr. sling time (minimum 1 hour) $190.00 sling time overnight $65.00 towing in marina $65.00/hour labour rate $80.00/hour fork lift $125.00 crane truck (minimum 1 hour) $20.00 access cards
$1.60/ft. daily $7.60/ft. weekly $29.00/ft. monthly
$5.60/sq. ft. outdoor winter package (includes haul out, blocking/cradle handling, storage and launch) $4.00/sq. ft. outdoor storage only $11.50/sq. ft. heated indoor winter package (includes haul out, blocking/cradle handling, storage and launch) - minimum 200 sq. ft. $4.10/ft. power wash $4.25/ft. masting $130.00 mast storage 6 months $9.30/ft. haul out $9.30/ft. launch
Royal Canadian Yacht Club $1.50/ft. per night to a maximum of 3 days includes water & 30 amp. power, first night free
Included in membership fees
Corporate member - $11,000.00 entrance fee, $3,622.35 annual fee, $362.24 capital maintenance fee Resident family member age 33+ - $11,000.00 entrance fee, $3,622.35 annual fee, $362.24 capital maintenance fee Resident single member age 33+ - $11,000.00 entrance fee, $3,121.11 annual fee, $312.11 capital maintenance fee Resident age 32 - $9,700.00 entrance fee, $3,121.11 annual fee, $312.11 capital maintenance fee Resident age 31 - $8,500.00 entrance fee, $2,796.63 annual fee, $279.66 capital maintenance fee Resident age 30 - $7,250.00 entrance fee, $2,472.16 annual fee, $247.22 capital maintenance fee Resident age 29 - $6,300.00 entrance fee, $2,147.69 annual fee, $214.77 capital maintenance fee Resident age 28 - $5,650.00 entrance fee, $1,622.37 annual fee, $162.24 capital maintenance fee Resident age 27 - $5,050.00 entrance fee, $1,297.89 annual fee, $129.79 capital maintenance fee Resident age 27 - $5,050.00 entrance fee, $1,297.89 annual fee, $129.79 capital maintenance fee

Recreational Boating Feasibility and Capacity Study – Phase 1 Final Report June 2014
TOURISTICS + Shoreplan Engineering Limited 73
EXHIBIT 4C MARINAS AND YACHT CLUBS WITHIN THE GREATER TORONTO AREA (GTA)/GOLDEN HORSESHOE – FEES (Continued)
Marina/ Yacht/Boat Club
Rental Rates Winter Storage Rates Waiting List Seasonal Transient
Royal Canadian Yacht Club Resident age 26 - $4,200.00 entrance fee, $973.42 annual fee, $97.34 capital maintenance fee Resident age 25 - $3,700.00 entrance fee, $648.95 annual fee, $64.90 capital maintenance fee Resident age 26 - $4,200.00 entrance fee, $973.42 annual fee, $97.34 capital maintenance fee Resident age 25 - $3,700.00 entrance fee, $648.95 annual fee, $64.90 capital maintenance fee Intermediate age 21 to 24 - $2,850.00 entrance fee, $356.38 annual fee, $35.64 capital maintenance fee Youth age 16 to 20 - $1,550.00 entrance fee, $356.38 annual fee, $35.64 capital maintenance fee Non-resident with principal residence beyond 80 kms. of City Hall - $11,000.00 entrance fee, $998.38 annual fee, $99.84 capital maintenance fee Non-resident with principal residence beyond 400 kms. of City Hall - $11,000.00 entrance fee, $665.59 annual fee, $66.56 capital maintenance fee $2.00/ft. boat wash $55.00/hour general labour $110.00 cradle transport $120.00 owner assisted haul to slings, $170.00 unassisted $190.00 owner assisted haul to cradle, $250.00 unassisted
Queen City Yacht Club Senior initiation fee $1,800.00 - <28’, $3,600.00 28’ and over $1,855.00 annual fees - senior $225.00 annual fees- dry sail $74.50/beam foot - mediterranean mooring (includes power, water, pumpout) $2.05/sq. ft. summer storage $150.00 mast storage without boat $350.00 tender pass
Only reciprocal clubs, no more than 3 consecutive nights, no more than 2 visits per year - no charge $25.00 pumpout
$2.05/sq. ft. (includes unlimited haul outs and launches)
Island Yacht Club $4,553.00 annual fees - family $625.00 tender pass $815.00 food (minimum) $1,200.00 capital assessment $3,414.00 annual fees -single $470.00 tender pass $611.00 food (minimum) $900.00 capital assessment $6.20/sq. ft. (includes power, water, pumpout)
$2.00/ft. for first night, second night free, only reciprocal clubs, two visits per season, limit of four nights total per season $15.00 per person for use of pool, tennis courts, children’s facilities, locker room, bar & restaurant $5.00 child 12 years and under (use of facilities limited to 2 visits per season), $5.00/person tender
$3.57/sq. ft. (includes haul out and launch)

Recreational Boating Feasibility and Capacity Study – Phase 1 Final Report June 2014
TOURISTICS + Shoreplan Engineering Limited 74
EXHIBIT 4C MARINAS AND YACHT CLUBS WITHIN THE GREATER TORONTO AREA (GTA)/GOLDEN HORSESHOE – FEES (Continued)
Marina/ Yacht/Boat Club
Rental Rates Winter Storage Rates Waiting List Seasonal Transient
Hanlan’s Point $1.50/ft. per day $7.50/ft. per week
Toronto Island Marina $86.00/ft. - class A docks $83.00/ft. - class B docks (includes water & hydro up to 30 amps.) $11.00/ft. extra 30 amp service or 50 amps. $33.00/ft. dry sailors $0.60/sq. ft. weekly land storage for repairs/short term only $275.00 canoe & dinghy storage (on marina racks) $100.00/hour sling time $300.00 overnight sling hang $90.00 tow inside marina $100.00/hour tow outside marina $70.00/hour yard labour $225.00/year storage lockers $50.00 cradle storage summer $150.00 transportation of cradles $165.00 tender pass
$1.85/ft. daily $9.00/ft. weekly $30.00/ft. monthly Extra 30amp./50 amp. service $0.50/ft. daily, $2.00/ft. weekly, $8.00/ft. monthly
$4.75/sq. ft. (includes haul out, storage, launch) $4.00/ft. blocking power boat $5.00/ft. blocking sailboat mast down $6.00/ft. blocking sail boat mast up Or $100.00 annual fee for cradle handling & storage $285.00/boat dry sailors $170.00 canoe & dinghy storage (on marina racks) $3.50/ft. power wash $250.00 quick haul & launch (includes 1 hour pad time) $7.00/ft. travel lift charges $5.00/ft. block charges $50.00 cradle handling
Marina Quay West $90.00/ft. $25.00/ft. per month (includes use of one 30 amp. outlet) $200.00 per season for one additional 30 amp. outlet
$1.70/ft. per night (40’ and under) $2.25/ft. per night (over 40’)
Marina 4 $90.00/ft. $25.00/ft. per month (includes use of one 30 amp. outlet) $200.00 per season for one additional 30 amp. outlet
$1.70/ft. per night (under 40’)
John Quay $22.13 (40’ and under) $26.55 (over 40’) Flat rate for visits of 3 hours or less between 9am - 5pm $2.70/ft. per night (40’ to 200’)

Recreational Boating Feasibility and Capacity Study – Phase 1 Final Report June 2014
TOURISTICS + Shoreplan Engineering Limited 75
EXHIBIT 4C MARINAS AND YACHT CLUBS WITHIN THE GREATER TORONTO AREA (GTA)/GOLDEN HORSESHOE – FEES (Continued)
Marina/ Yacht/Boat Club
Rental Rates Winter Storage Rates Waiting List Seasonal Transient
Alexandra Yacht Club $2,000.00 initiation, $500.00 annual - senior member $2,000.00 building debenture, $600.00 mooring debenture (refundable) $200.00 initiation, $200 annual - associate member $1.30/sq. ft.
2 free nights reciprocal members only
$1.50/sq. ft. (includes haul out, storage and launch)
National Yacht Club $2,500.00 initiation fee, $1,725.00 annual fee, $45.00 minimum/ month dining room, $7,000.00 dock equity right (refundable) $695.00 swing mooring annual fee + $26.00/ft. over 25’ for senior owning boat requiring mooring or dock $28.00/ft. for greater of vessel length or assigned dock length $1,000.00 initiation fee, dry sail owner over 30, $500.00 initiation fee, owner 30 or under, $1,121.00 annual dues, $347.00 summer storage, $45.00 minimum/ month dining room $100.00 initiation fee, $448.50 annual dues, $125.00 summer storage for dinghy, $45.00 minimum/ month dining room (April to September only)
Match other club’s reciprocal policy, otherwise $15.00 for first night, next two nights free, third & fourth night $15.00 each night, maximum 5 day limit per year
$2.90/sq. ft.
Ontario Place Marina $82.85 - up to 30 amp. $87.60 - 50 amp. or 2 x 30 amp.+ $10.00/ft. (May to Oct.) - trailer storage $100.00 (May to Oct.) - cradle storage $220.00 additional vehicle parking pass
$1.70/ft. daily $8.00/ft. weekly $32.00/ft. monthly
$4.35/sq. ft. (includes haul out, trailer/cradle storage, pressure clean bottom of boat) $3.00/sq. ft. storage of boat on trailer only $12.00/ft. haul out only

Recreational Boating Feasibility and Capacity Study – Phase 1 Final Report June 2014
TOURISTICS + Shoreplan Engineering Limited 76
EXHIBIT 4C MARINAS AND YACHT CLUBS WITHIN THE GREATER TORONTO AREA (GTA)/GOLDEN HORSESHOE – FEES (Continued)
Marina/ Yacht/Boat Club
Rental Rates Winter Storage Rates Waiting List Seasonal Transient
Toronto Sailing & Canoe Club $300.00 initiation fee, $550.00 annual dues senior membership, $1.60/sq. ft wet mooring, $580.00 new wet mooring allocation fee $50.00 summer cradle storage $75.00 summer dinghy storage $200.00 annual keel boat dry sail fee $350.00 annual canoe/kayak membership allows 1 canoe/kayak per rack, $75.00 for second canoe/kayak on same rack , 8 hours work @$25.00/hour
Free up to a maximum of three nights
$1.40/sq. ft. $140.00 haul out or launch $75.00 dinghy storage
Boulevard Club Mimico Cruising Club $4,000.00 initiation fee, $3,500.00
debenture, $1,381.00 annual senior membership with mooring $1,293.00 initiation fee, $500.00 debenture, $1,142.00 annual senior membership dry sailed boat $640.00 - 27’ summer dock $711.00 - 30’ summer dock $831.00 - 35’ summer dock $947.00 - 40’ summer dock $1,044.00 - 44’ summer dock $1,066.00 - 45’ summer dock $1,162.00 - 49’ summer dock $132.00 dry sail - <18’ $498.00 dry sail - 18’+ $100.00 dinghy storage
Match other club’s reciprocal policy, otherwise first two nights free, $15.00 for each subsequent night, maximum 7 nights in any 30 day period
$2.57/sq. ft. (includes haul out, storage, launch)

Recreational Boating Feasibility and Capacity Study – Phase 1 Final Report June 2014
TOURISTICS + Shoreplan Engineering Limited 77
EXHIBIT 4C MARINAS AND YACHT CLUBS WITHIN THE GREATER TORONTO AREA (GTA)/GOLDEN HORSESHOE – FEES (Continued)
Marina/ Yacht/Boat Club
Rental Rates Winter Storage Rates Waiting List Seasonal Transient
Etobicoke Yacht Club $2,200.00 initiation fee, $3,400.00 club debenture, $1,400.00 dock debenture, $900.00 launch & haulout debenture, $605.00 annual dues for senior membership $565.00 dry sail dinghy/multi-hull membership $353.00/yr - keel boat storage $223.00/yr - 16’ to 21’, $167.00/yr - 8’ to 15’ dinghy & cats, $86.00 /yr - up to 7’ on multi-boat rack $500.00 refundable security deposit
Match other club’s reciprocal policy, otherwise first night free, subsequent nights $15.00 each night, maximum 3 nights
$17.16/ft. (includes haul out, storage, launch)
Toronto Humber Yacht Club $1,000.00 initiation fee, $101.00 shares, $675.00 annual membership, $400.00 minimum spending tickets, $1,200.00 seasonal dock rental $225.00 dry sail annual membership, $625.00 for dry sail boat & trailer or trailer only $225.00 annual paddler membership, $100.00 minimum spending tickets, $100.00 canoe/ kayak storage
$225.00 winter storage membership + $725.00 yard storage for boat & trailer
Lakeshore Yacht Club $1,000.00 initiation fee, $2,000.00 refundable wet debenture, $550.00 annual dues for wet membership $4.50/sq. ft. mooring/storage fees $250.00 initiation fee, $500.00 refundable dry debenture, $550.00 annual dues for dry membership $250.00 annual dues social membership
Haul out, storage, launch, mast stepping included in summer moorage/storage fees

Recreational Boating Feasibility and Capacity Study – Phase 1 Final Report June 2014
TOURISTICS + Shoreplan Engineering Limited 78
EXHIBIT 4C MARINAS AND YACHT CLUBS WITHIN THE GREATER TORONTO AREA (GTA)/GOLDEN HORSESHOE – FEES (Continued)
Marina/ Yacht/Boat Club
Rental Rates Winter Storage Rates Waiting List Seasonal Transient
Port Credit Yacht Club $2,500.00 for 30’ slip, $4,000.00 for 35’ & 40’ slips, $5,500.00 for 45’, 50’ & 55’ slip initiation fees, $2,024.16 annual membership fee, $30.00/month house minimum up to age 30, $60.00/month house minimum after age 30 $63.92/ft for slip $100.00 initiation fee dry sail, $667.70 annual membership fee, $30.00/month house minimum up to age 30, $60.00/month house minimum after age 30 $363.85 + $18.20/ft. summer dry sail fee
Match other club’s reciprocal policy, otherwise $1.00/ft. for first night, second night free, limit of two free nights per visit per month
$340.00 + $3.40/sq. ft. (includes haul out, storage, bottom spray, cradle storage, mast stepping & un-stepping, launch) $18.20/ft. dry sail boat
Lakefront Promenade Marina $75.00/ft.- includes one 20 or 30 amp.
$1.42/ft. daily $1.42/ft. weekly (one night free) $18.58/ft. monthly (available only in May, June, September, October)
$333.33 +$3.33/sq. ft. power boats only (includes haul out & launch, block & stands, bottom wash) $16.01/ft. shrink wrap $18.02/ft. with fly bridge
Port Credit Harbour Marina $1,700.00 - up to 25 ft. $2,050.00 - up to 30 ft. $2,250.00 - up to 33 ft. $2,460.00 - up to 36 ft. $3,480.00 - up to 50 ft. (all with 30 amp.) $2,600.00 - up to 36 ft. $3,600.00 - up to 50 ft. (both with 50 amp. $1,575.00 - up to 30 ft. no power +$52.00/ft over boat size no power +$68.00/ft. over boat size 30 amp +$72.00/ft. over boat size 50 amp $4.90/ft. blocking & beams $50.00/season cradle rental $50.00/season blocking rental
$1.40/ft. daily $7.00/ft. weekly
$4.25/sq. ft.- outside (minimum $590.00) $5.85/sq. ft. - inside (minimum $880.00) (includes haul out, storage, launch) $8.00/ft. travel lift $9.00/ft. sling time one hour or less $12.00/ft. sling time overnight $14.00/ft. sling time over weekend $200.00/ season cradle/trailer storage $3.10/ft. bottom wash $3.60/ft. mast stepping/un-stepping $125.00 <30’ tender service $220.00 >30’ tender service $2.25/ft. mast storage $80.00/hr. yard labour one person

Recreational Boating Feasibility and Capacity Study – Phase 1 Final Report June 2014
TOURISTICS + Shoreplan Engineering Limited 79
EXHIBIT 4C MARINAS AND YACHT CLUBS WITHIN THE GREATER TORONTO AREA (GTA)/GOLDEN HORSESHOE – FEES (Continued)
Marina/ Yacht/Boat Club
Rental Rates Winter Storage Rates Waiting List Seasonal Transient
Port Credit Harbour Marina Winter docking $83.00/ft. $1,800.00 - 30 amps $2,300.00 - 50 amps. $2,700.00 - 60 amps. $150.00/season agitator (bubbler) rental - $250.00 deposit Shrink wrapping $14.75/ft. up to 24’ $15.75/ft. 25’ to 35’ $17.75/ft. with bridge $18.25/ft. 36’ to 40’ $20.25/ft. with bridge $20.50/ft. 41’ to 45’ $22.50/ft. with bridge $22.50/ft. 46’ & over $24.50/ft. with bridge $65.00 zipper door
Credit Village Marina $9.73 - for three hours docking at shoppers docks $1.42/ft. overnight serviced slips $1.42/ft. weekly (stay 7 nights for price of 6) $2.11/ft. charter arrival & departure Short term docking free for Snug Harbour Restaurant users
St. Catharines Marina $74.40/ft. $2.75/ sq. ft. for summer storage on land or $0.55/sq. ft./ month $85.00/season cradle or trailer storage (single axle)
$1.25/ft. daily $6,50/ft. weekly
$4.25/sq. ft (includes haul out, storage, launch) $7.75/ft. launch or haul out only $3.50/ft. mast stepping/ Unstopping

Recreational Boating Feasibility and Capacity Study – Phase 1 Final Report June 2014
TOURISTICS + Shoreplan Engineering Limited 80
EXHIBIT 4C MARINAS AND YACHT CLUBS WITHIN THE GREATER TORONTO AREA (GTA)/GOLDEN HORSESHOE – FEES (Continued)
Marina/ Yacht/Boat Club
Rental Rates Winter Storage Rates Waiting List Seasonal Transient
Port Dalhousie Pier Marina $60.00/ft. - 20’ dock, up to 23’ boat $2,100.00 - 24’ dock, up to 27’ boat $2,300.00 - 28’ dock, up to 32’ boat $2,500.00 - 30’ dock, up to 32’ boat $3,100.00 - 40’ dock, up to 42’ boat $4,000.00 - 50’ dock (prices include security, power - 30amp., water, unlimited pump out) $400.00/season for additional 30 amp. service $60.00 each additional foot over limit $7.48/ft. summer dry land storage
$2.00/ft. daily $20.00/ft. per month
$40.00/ft. lift out September $41.00/ft. lift out Oct 1 to Oct 15 $42.00/ft. lift out after Oct 15 (prices include power wash, storage & spring launch) $700.00 - over 24’ boat on trailer, no handling stored in yard $600.00 - under 24’ boat on trailer, no handling stored in yard $600.00 - boat on trailer, no handling stored on parking lot $100.00 stand rentals - 2 per season $8.00/ft. for use of travel lift (minimum $100.00) $3.00/ft. mast hoist (1 man only) $3.00/ft. boat wash $150.00 per season for cradle storage
Dalhousie Yacht Club $750.00 initiation, $771.00 annual dues, $50.00 minimum monthly restaurant charges $37.02/sq. ft . min. $1,050.00 includes summer storage for folding cradles $510.00 dry sail per season $25.00 dry hoist per use $200.00 annual dues dinghy membership, $200.00 storage of dinghy <16’ & unlimited use of launch ramp for that dinghy, $50.00 minimum monthly restaurant charges $200.00 yard boat storage $100.00 dinghy storage <16’ $75.00 trailer storage $100.00 mast storage $8.46/sq. ft. long term storage (more than 1 year) For non-members $3.10/sq. ft. yard boat storage, $110.00 dinghy storage <16, $85.00 trailer storage
First two nights free, subsequent nights $1.00/ft. per night
$2.82/sq. ft. (includes two lifts) minimum $500.00 $100.00 crane haul out/ launch only $200.00 lift only $176.99 winter storage for boat stored on trailer and lifted out with dry hoist after haul out For non-members $3.10/sq. ft. (includes two lifts) minimum $550.00 $165.00 crane haul out/ launch only $330.00 lift only

Recreational Boating Feasibility and Capacity Study – Phase 1 Final Report June 2014
TOURISTICS + Shoreplan Engineering Limited 81
EXHIBIT 4C MARINAS AND YACHT CLUBS WITHIN THE GREATER TORONTO AREA (GTA)/GOLDEN HORSESHOE – FEES (Continued)
Marina/ Yacht/Boat Club
Rental Rates Winter Storage Rates Waiting List Seasonal Transient
Beacon Harbourside Yacht Club Lakecourt Marine
$60.00/ft. $2.00/ft. daily
Foran’s Marine $65.00/ft. 15’ to 25’ no hydro or water $80.00/ft. 30 amp. power & water - back/east $85.00/ft. 30 amp. power & water – west
Fifty Point Marina $68.15/ft. no hydro $73.60/ft. with hydro (if stored previous winter) $85.20/ft. no hydro $92.60/ft. with hydro (not stored previous winter) $450.00 dry sailing monohulls on trailer $665.00 dry sailing catamarans on trailer Triaxle trailer add $215.00 $11.50/ft. for cradle rental (minimum $225.00) $150.00/hour hydraulic trailer use (minimum $75.00) $75.00/hour labour charge $46.00 boat towing in harbour $121.00 outboard motor storage $100.00 tender storage (indoor) $121.00 inflatable boat storage (indoor) $24.65/ft. per month for dockage June, July, August $17.85/ft. per month for dockage April, May, Sept., Oct. $0.90/sq. ft. per month land storage 1st summer $1.40/sq. ft. per month land storage 2nd summer $10.50/night trailer storage $172.00/season if winter stored $314.00/season not winter stored $425.00 triaxle trailer storage $283.50 triaxle trailr winter stored
$1.60/ft. $32.00 minimum $4.70/sq. ft. for sail boats (includes lift-out, wash, launch & mast stepping and or mast standing) minimum $1,150.50 $4.25/sq. ft. for power boats ( includes lift-out, wash, storage system & launch) minimum $1,025.00 $3.52/sq. ft. storage only (no lift-out or wash) minimum $630.00 $7.75/ft. launch or lift out up to 30’ - minimum $200.00 $9.55/ft. 31’ to 35’ $11.25/ft. 36’ to 40’ 41’ & over by quote $140.00 sling time per hour $270.00 sling time overnight per night $60.00 - $110.00 boat wash (depends on size of boat $4.60/ft. of boat length for mast stepping (minimum charge 25’) $3.25/ft of mast length for mast storage on racks, for masts of boats not stored at marina
31’ to 38’ may have a wait of over 1 or 2 years
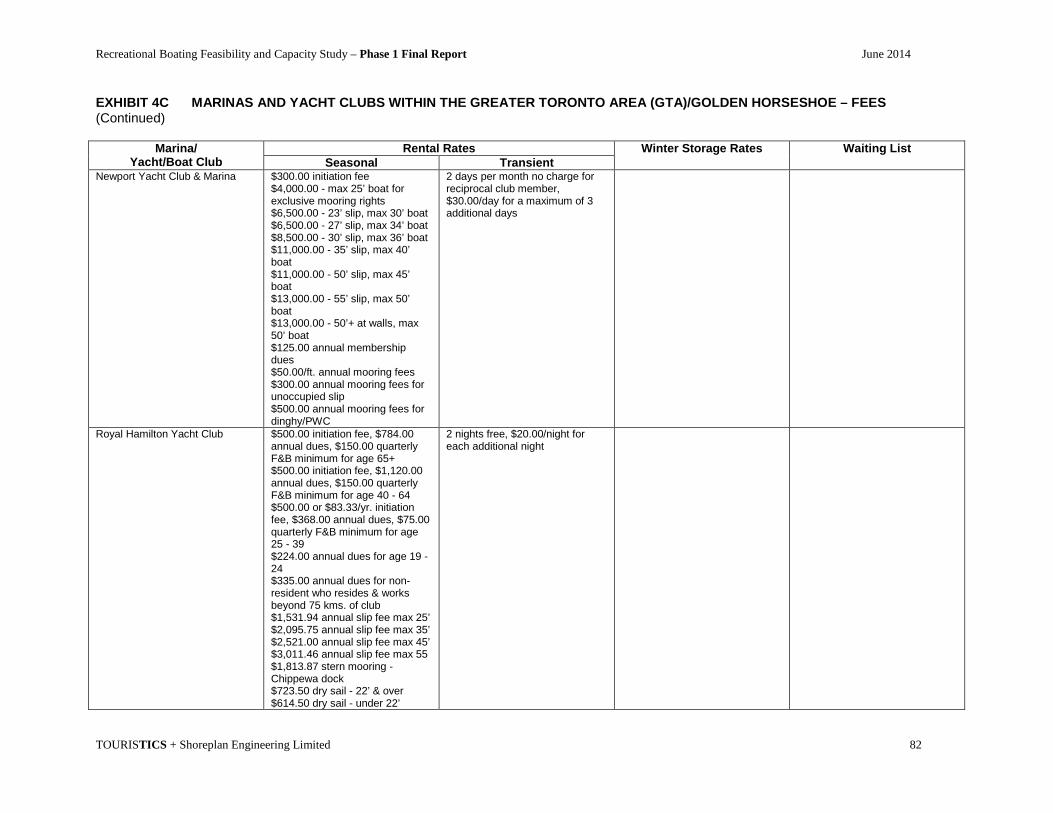
Recreational Boating Feasibility and Capacity Study – Phase 1 Final Report June 2014
TOURISTICS + Shoreplan Engineering Limited 82
EXHIBIT 4C MARINAS AND YACHT CLUBS WITHIN THE GREATER TORONTO AREA (GTA)/GOLDEN HORSESHOE – FEES (Continued)
Marina/ Yacht/Boat Club
Rental Rates Winter Storage Rates Waiting List Seasonal Transient
Newport Yacht Club & Marina $300.00 initiation fee $4,000.00 - max 25’ boat for exclusive mooring rights $6,500.00 - 23’ slip, max 30’ boat $6,500.00 - 27’ slip, max 34’ boat $8,500.00 - 30’ slip, max 36’ boat $11,000.00 - 35’ slip, max 40’ boat $11,000.00 - 50’ slip, max 45’ boat $13,000.00 - 55’ slip, max 50’ boat $13,000.00 - 50’+ at walls, max 50’ boat $125.00 annual membership dues $50.00/ft. annual mooring fees $300.00 annual mooring fees for unoccupied slip $500.00 annual mooring fees for dinghy/PWC
2 days per month no charge for reciprocal club member, $30.00/day for a maximum of 3 additional days
Royal Hamilton Yacht Club $500.00 initiation fee, $784.00 annual dues, $150.00 quarterly F&B minimum for age 65+ $500.00 initiation fee, $1,120.00 annual dues, $150.00 quarterly F&B minimum for age 40 - 64 $500.00 or $83.33/yr. initiation fee, $368.00 annual dues, $75.00 quarterly F&B minimum for age 25 - 39 $224.00 annual dues for age 19 - 24 $335.00 annual dues for non-resident who resides & works beyond 75 kms. of club $1,531.94 annual slip fee max 25’ $2,095.75 annual slip fee max 35’ $2,521.00 annual slip fee max 45’ $3,011.46 annual slip fee max 55 $1,813.87 stern mooring - Chippewa dock $723.50 dry sail - 22’ & over $614.50 dry sail - under 22’
2 nights free, $20.00/night for each additional night
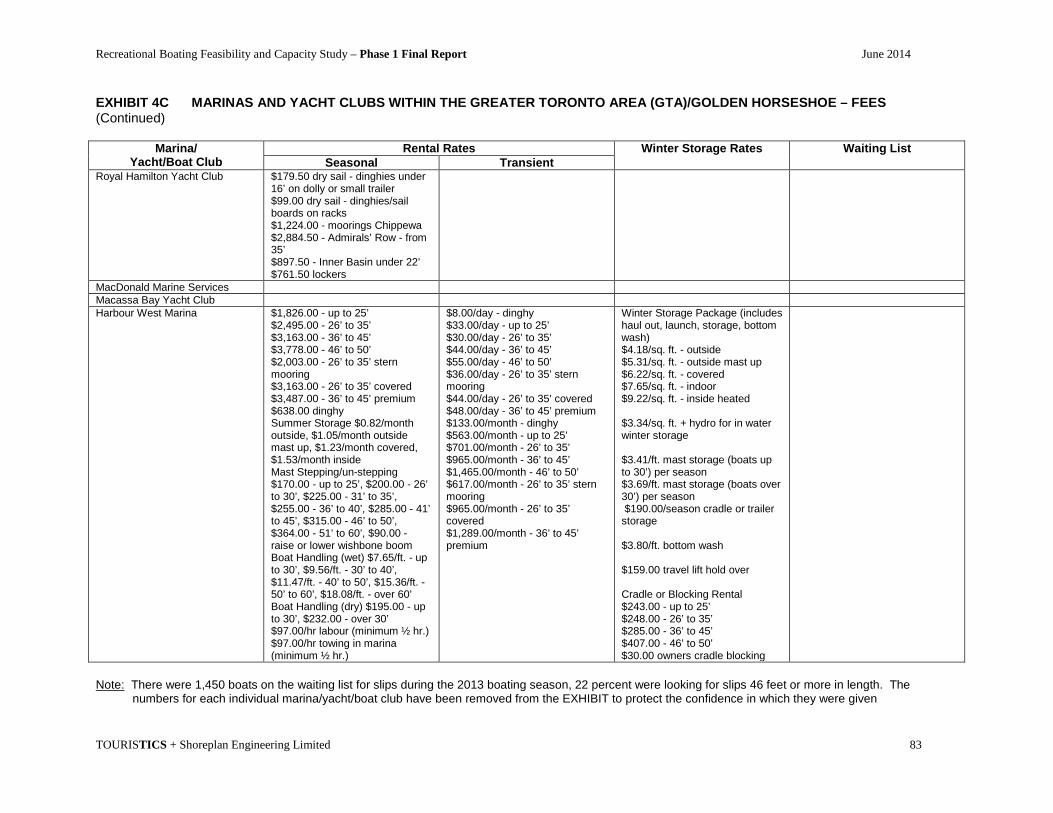
Recreational Boating Feasibility and Capacity Study – Phase 1 Final Report June 2014
TOURISTICS + Shoreplan Engineering Limited 83
EXHIBIT 4C MARINAS AND YACHT CLUBS WITHIN THE GREATER TORONTO AREA (GTA)/GOLDEN HORSESHOE – FEES (Continued)
Marina/ Yacht/Boat Club
Rental Rates Winter Storage Rates Waiting List Seasonal Transient
Royal Hamilton Yacht Club $179.50 dry sail - dinghies under 16’ on dolly or small trailer $99.00 dry sail - dinghies/sail boards on racks $1,224.00 - moorings Chippewa $2,884.50 - Admirals’ Row - from 35’ $897.50 - Inner Basin under 22’ $761.50 lockers
MacDonald Marine Services Macassa Bay Yacht Club Harbour West Marina $1,826.00 - up to 25’
$2,495.00 - 26’ to 35’ $3,163.00 - 36’ to 45’ $3,778.00 - 46’ to 50’ $2,003.00 - 26’ to 35’ stern mooring $3,163.00 - 26’ to 35’ covered $3,487.00 - 36’ to 45’ premium $638.00 dinghy Summer Storage $0.82/month outside, $1.05/month outside mast up, $1.23/month covered, $1.53/month inside Mast Stepping/un-stepping $170.00 - up to 25’, $200.00 - 26’ to 30’, $225.00 - 31’ to 35’, $255.00 - 36’ to 40’, $285.00 - 41’ to 45’, $315.00 - 46’ to 50’, $364.00 - 51’ to 60’, $90.00 - raise or lower wishbone boom Boat Handling (wet) $7.65/ft. - up to 30’, $9.56/ft. - 30’ to 40’, $11.47/ft. - 40’ to 50’, $15.36/ft. - 50’ to 60’, $18.08/ft. - over 60’ Boat Handling (dry) $195.00 - up to 30’, $232.00 - over 30’ $97.00/hr labour (minimum ½ hr.) $97.00/hr towing in marina (minimum ½ hr.)
$8.00/day - dinghy $33.00/day - up to 25’ $30.00/day - 26’ to 35’ $44.00/day - 36’ to 45’ $55.00/day - 46’ to 50’ $36.00/day - 26’ to 35’ stern mooring $44.00/day - 26’ to 35’ covered $48.00/day - 36’ to 45’ premium $133.00/month - dinghy $563.00/month - up to 25’ $701.00/month - 26’ to 35’ $965.00/month - 36’ to 45’ $1,465.00/month - 46’ to 50’ $617.00/month - 26’ to 35’ stern mooring $965.00/month - 26’ to 35’ covered $1,289.00/month - 36’ to 45’ premium
Winter Storage Package (includes haul out, launch, storage, bottom wash) $4.18/sq. ft. - outside $5.31/sq. ft. - outside mast up $6.22/sq. ft. - covered $7.65/sq. ft. - indoor $9.22/sq. ft. - inside heated $3.34/sq. ft. + hydro for in water winter storage $3.41/ft. mast storage (boats up to 30’) per season $3.69/ft. mast storage (boats over 30’) per season $190.00/season cradle or trailer storage $3.80/ft. bottom wash $159.00 travel lift hold over Cradle or Blocking Rental $243.00 - up to 25’ $248.00 - 26’ to 35’ $285.00 - 36’ to 45’ $407.00 - 46’ to 50’ $30.00 owners cradle blocking
Note: There were 1,450 boats on the waiting list for slips during the 2013 boating season, 22 percent were looking for slips 46 feet or more in length. The numbers for each individual marina/yacht/boat club have been removed from the EXHIBIT to protect the confidence in which they were given

Recreational Boating Feasibility and Capacity Study – Phase 1 Final Report June 2014
TOURISTICS + Shoreplan Engineering Limited 84
EXHIBIT 5 COMPARISON OF 2014 SUMMER AND WINTER MARINA FEES IN HALTON REGION AND THE GTA/GOLDEN HORSESHOE AREA Name of Marina Location
Slip
Ren
tal
with
se
rvic
e1
Slip
Ren
tal
with
out
serv
ice
Wet
M
oorin
g
Sum
mer
La
nd
Stor
age
Cra
dle\
tr
aile
r St
orag
e2
Mas
t St
eppi
ng\
un-
step
ping
3
Pum
p ou
t pe
r ser
vice
Tran
sien
t da
ily
Laun
ch
Ram
p
Hau
l out
or
Laun
ch
Win
ter
Stor
age4
LaSalle Park Marina Burlington $66.00/ft $51.00/ season*
$50.00 Seasonal pass*
$40.00 Free $5.72/ft.* $2.28/sq. ft (package)*
Bronte Harbour Oakville $68.80/ft.
$61.44/ft. $53.10/ft. - 30’
$0.93/ sq. ft./ month
$154.50/ Season
$2.16/ft. N/A N/A $17.00 $8.65/ft. $3.50/sq. ft $4.01/sq. ft (package)
Bronte Outer Harbour Marina
Oakville $73.00/ft $4.00/ sq. ft. $1.00/ sq. ft./ month
$150.00/season
$4.50/ft. $16.00 $1.40/ft. $9.00/ft. $4.35/sq. ft $5.35/sq. ft (package)
Oakville Harbour Oakville $68.80/ft
$61.44/ft. $53.10/ft. - 30’
N/A $143.22/season
$2.16/ft. $40.00 Seasonal pass
N/A $17.00 $8.65/ft. $3.50/sq. ft $4.63/sq. ft up to 12’ beam (package) $4.94/sq. ft over 12’ beam (package)
Bluffers Park Marina Scarborough $90.00/ft at fixed docks (shore) $84.00/ft at floating docks
$4.35/ sq. ft.
$120.00/ season
$4.00/ft $20.00 $1.45/ft. $6.80/ft $4.50/sq. ft (package)
Outer Harbour Marina Toronto $94.45/ft $4.45/ sq. ft.
$150.00/ season
$4.25/ft $15.50/ tank
$1.60/ft. $9.30/ft. $4.00/sq. ft $5.60/sq. ft (package)
Toronto Island Marina Toronto $83.00/ft $4.25/ sq. ft.
$50.00/ Season
$6.00/ft. $15.00/ tank
$1.85/ft. $7.50/ft. $4.75/sq. ft (package)
Marina Quay West Toronto $90.00/ft. N/A N/A N/A $10.00 $1.70/ft. N/A N/A Marina 4 Toronto $90.00/ft N/A N/A N/A $10.00 $1.70/ft. N/A N/A Ontario Place Marina Toronto $82.85/ft. $100.00/
Season $15.00 $1.70/ft. $12.00/ft. $3.00/sq. ft
$4.35/sq. ft (package)

Recreational Boating Feasibility and Capacity Study – Phase 1 Final Report June 2014
TOURISTICS + Shoreplan Engineering Limited 85
EXHIBIT 5 COMPARISON OF 2014 SUMMER AND WINTER MARINA FEES IN HALTON REGION AND THE GTA/GOLDEN HORSESHOE AREA (Continued) Name of Marina Location
Slip
Ren
tal
with
se
rvic
e1
Slip
Ren
tal
with
out
serv
ice
Wet
M
oorin
g
Sum
mer
La
nd
Stor
age
Cra
dle\
tr
aile
r St
orag
e2
Mas
t St
eppi
ng\
unst
oppi
ng3 Pu
mp
out
per s
ervi
ce
Tran
sien
t da
ily
Laun
ch
Ram
p
Hau
l out
or
Laun
ch
Win
ter
Stor
age4
Lakefront Promenade Marina
Mississauga $66.37/ft. N/A N/A N/A N/A $1.42/ft. $4.45/sq. ft (package)
Port Credit Harbour Marina
Mississauga $68.33/ft. $52.50/ft. $4.25/ sq. ft.
$200.00/ season
$3.60/ft. N/A $1.40/ft. N/A $8.00/ft. $4.25/sq. ft (package)
Harbour West Marina Hamilton $83.17/ft. $66.77/ft. $4.10/ sq. ft. $0.82/ sq. ft./ month
$190.00/ season
$3.41/ft. N/A $1.23/ft. $4.18/sq. ft. (package)
Fifty Point Marina Winona $92.60/ft $68.15/ft $172.00/ season
$4.60/ft. $13.00/ tank
$1.60/ft. $7.75/ft. $3.52/sq. ft. $4.70/sq. ft. sail boats (package) $4.25/sq. ft. power boats (package)
Foran’s Marine Grimsby $85.00/ft $65.00/ft. N/A $135.00/season
N/A $16.00 $1.30/ft. N/A $4.05/sq. ft (package)
Port Dalhousie Pier Marina
St. Catharines $83.35/ft $7.48/ft. $150.00/ season
$3.00/ft. $16.00 $2.00/ft. $8.00/ft. $3.35/sq. ft. $4.10/sq. ft. (package)
St. Catharines Marina St. Catharines $74.40/ft. $2.75/ sq. ft. $0.55/ sq. ft./ month
$85.00/ season
$3.50/ft. $16.00 $1.25/ft. $7.75/ft. $4.00/sq. ft (package)
Source: EXHIBIT 1C, EXHIBIT 4C, based on 30’ boat 1 Includes water and 30 amp. power 2 Fee for cradle or trailer storage per season whichever is least expensive 3 Mast stepping/unstepping based on single spreader 4 Winter storage package includes (haulout, bottom wash, storage, launch) *Burlington Sailing & Boating Club provides these services for members of the Club and members of LaSalle Park LaSalle Marina

Recreational Boating Feasibility and Capacity Study – Phase 1 Final Report June 2014
TOURISTICS + Shoreplan Engineering Limited 86
EXHIBIT 6 ANNUAL SUMMER AND WINTER RATES AND FEES 2014 (30 foot boat) Name of Marina Seasonal Slip Cost Winter Storage Cost1 Total Annual Cost Outer Harbour Marina $2,833.50 $1,680.00 $4,513.50 Fifty Point Marina $2,778.00 $1,342.50 $4,120.50 Bluffers Park Marina $2,700.00 $1,350.00 $4,050.00 Toronto Island Marina $2,490.00 $1,425.00 $3,915.00 Bronte Outer Harbour Marina $2,190.00 $1,605.00 $3,795.00 Ontario Place Marina $2,485.50 $1,305.00 $3,790.50 Harbour West Marina $2,495.10 $1,254.00 $3,749.10 Foran’s Marine $2,550.00 $1,215.00 $3,765.00 Port Dalhousie Pier Marina $2,500.50 $1,230.00 $3,730.50 Oakville Harbour $2,064.00 $1,389.00 $3,453.00 St. Catharines Marina $2,232.00 $1,200.00 $3,432.00 Lakefront Promenade Marina $1,991.10 $1,335.00 $3,326.10 Port Credit Harbour Marina $2,050.00 $1,275.00 $3,325.00 Bronte Harbour $2,064.00 $1,203.00 $3,267.00 LaSalle Park Marina $1,980.00 $684.00 $3,064.00* Source: EXHIBIT 5 1Based on a package including haul out, launch, storage, bottom wash for boat 30 feet in length with a beam of 10 feet * Price includes BSBC membership of $400.00 in order to have winter storage EXHIBIT 7 MARINA FACILITIES AND SERVICES RATING1
Facilities and Services Rating Value2
Description
Safe Piers, Main & Finger Docks 5 Stable, clean, well maintained docks with adequate mooring cleats Vehicle Parking 5 On-site parking for boater’s vehicles Washrooms 5 On-site washrooms, well maintained and available to boaters 24/7 Water Service on Docks 5 Potable water available on docks Haul-out, Launch & Winter Storage 5 On-site winter storage area with haul-out and hoist equipment Hydro (30 amps.) on Docks 5 Minimum 30 amp. Electrical service compliant with the Ontario
Electrical Safety Code and ABYC Security 24 Hours 5 Secure limited access for summer moorings and winter storage of
vessels Pump Out Service 4 On-site pump out service for holding tanks Fuel Dock 4 On-site fuel dispensing facility for gasoline and diesel fuel Wi Fi Connection 3 Free Wi Fi internet service available within the limits of the marina Staff Available for Assistance 3 On duty staff available to operate marina’s facilities and assist
boaters during normal operating hours Launch Ramp 3 Public launch ramp for launching trailer hauled boats Clean Marine Certification 3 Clean Marine certified facility as per OMOA with on-site waste
collection and recycling facilities Repair Services 2 On-site (or nearby) marine repair facilities Marine Supplies 2 On-site (or nearby) marine chandlery Mast Crane 2 On- site mast crane available Laundry Facilities 1 On-site laundry facilities Maximum Score 62 1 Adapted from Association of Oakville Harbours’ Stakeholders 2012 Rates and Fees Study 2 50 boat owners were interviewed at the Toronto International Boat Show between January 12 and 18, 2014 regarding the features they felt were most desirable at a home marina. They were then asked to rate each feature on a scale of 1 to 5, with 5 being the most desirable. We were not allowed to ask for any personnal information, nor did we ask them to identify their home marina. The rating values are virtual the same as those used in the Association of Oakville Harbours’ Stakeholders 2012 Rates and Fees Study

Recreational Boating Feasibility and Capacity Study – Phase 1 Final Report June 2014
TOURISTICS + Shoreplan Engineering Limited 87
EXHIBIT 8 EVALUATION OF MARINA SERVICES AND FACILITIES IN HALTON REGION AND GTA/GOLDEN HORSESHOE AREA
Evaluation of Services and Facilities Name of Marina Location
Saf
e D
ocks
Veh
icle
Par
king
W
ashr
oom
s
Pot
able
Wat
er o
n D
ocks
Hau
l-out
, Lau
nch
& W
inte
r Sto
rage
Hyd
ro (3
0 am
ps.)
on
Doc
ks
Sec
urity
24
hour
s
Pum
p O
ut S
ervi
ce
Fuel
Doc
k
Wi F
i Con
nect
ion
Sta
ff Av
aila
ble
for
Ass
ista
nce
Laun
ch R
amp
Cle
an M
arin
e C
ertif
icat
ion
Rep
air S
ervi
ces
Mar
ine
Sup
plie
s
Mas
t Cra
ne
Laun
dry
Faci
litie
s
Faci
lity
Rat
ing
Maximum Score 5 5 5 5 5 5 5 4 4 3 3 3 3 2 2 2 1 62 LaSalle Park Marina Burlington 4 5 5 3 4 3 5 4 0 3 2 2 3 0 0 0 0 43 Bronte Harbour Oakville 3 5 5 5 5 5 5 0 0 0 0 2 3 2 2 2 0 44 Bronte Outer Harbour Marina
Oakville 5 5 5 5 5 5 5 4 4 3 3 0 3 0 2 2 0 56
Oakville Harbour Oakville 4 5 5 5 5 5 0 4 0 0 0 2 3 0 0 2 0 40 Bluffers Park Marina Scarborough 4 5 5 5 5 5 5 4 4 3 3 3 3 2 0 2 1 59 Outer Harbour Marina Toronto 5 5 5 5 5 5 0 4 4 0 3 0 3 2 0 0 1 47 Toronto Island Marina Toronto 4 0 5 5 5 5 5 4 4 3 3 0 3 2 0 2 1 51 Ontario Place Marina Toronto 5 5 5 5 5 5 5 4 4 3 3 0 3 0 0 0 1 53 Lakefront Promenade Marina
Mississauga 5 5 5 5 5 5 5 4 4 3 3 3 3 0 0 0 1 56
Port Credit Harbour Marina
Mississauga 4 5 5 5 5 5 5 4 4 3 2 3 3 2 2 2 1 60
Harbour West Marina Hamilton 5 5 5 5 5 5 5 4 4 3 3 3 3 2 2 2 1 62 Fifty Point Marina Winona 5 5 5 5 5 5 5 4 4 3 3 3 3 0 0 2 1 58 Foran’s Marine Grimsby 5 5 5 5 5 5 5 4 4 0 0 3 0 2 2 0 0 50 Port Dalhousie Pier Marina
St. Catharines
4 5 5 5 5 5 5 4 0 3 3 0 3 2 2 2 1 54
St. Catharines Marina St. Catharines
4 5 5 5 5 5 5 4 4 3 3 3 3 2 2 2 1 61

Recreational Boating Feasibility and Capacity Study – Phase 1 Final Report June 2014
TOURISTICS + Shoreplan Engineering Limited 88
EXHIBIT 9 SELECTED SOCIO-DEMOGRAPHIC CHARACTERISTICS OF RESIDENTS WITHIN HALTON REGION
Regional
Municipality of Halton
Oakville Burlington Ontario
Population 2011 493,045
(+12.4%)1 174,780 (+5.6%)1
173,761 (+5.7%)1
12,851,821 (+5.7%)1
2006 438,891 165,529 164,446 12,160,282 Age Males 239,410 84,460 83,550 5,930,700 0 to 15 49,460 17,360 15,240 1,133,850 16 to 24 31,820 12,510 10,670 827,630 25 to 34 26,390
(11.0%)2 7,460
(8.8%)2 9,560
(11.4%)2 742,555 (12.5%)2
35 to 44 37,310 (15.6%)
12,660 (15.0%)
11,990 (14.4%)
937,350 (15.8%)
45 to 54 38,930 (16.3%)
14,760 (17.5%)
13,400 (16.0%)
909,735 (15.3%)
55 to 64 26,620 9,680 9,990 662,075 65+ 28,880 10,030 12,700 717,530 Female 253,630 90,320 90,210 6,229,580 0 to 15 47,270 16, 840 14,340 1,076,950 16 to 24 30,120 12,010 10,220 802,740 25 to 34 29,630
(11.7%)2 8,480
(9.4%)2 10,280
(11.4%)2 793,095 (12.7%)2
35 to 44 40,480 (16.0%)
14,650 (16.2%)
12,960 (14.4%)
979,050 (15.7%)
45 to 54 40,460 (15.9%)
15,600 (17.3%)
14,240 (15.8%)
951,645 (15.3%)
55 to 64 29,030 10,290 11,500 694,435 65+ 36,640 12,450 16,670 931,665 Education Total Population 15 Years and over by Highest Level of School
399,270 141,630 140,800 9,819,420
Non-High School Grad
62,510 20,140 22,210 2,183,625
High School Grad 104,490 34,070 38,040 2,628,575 Some University 18,900
(4.7%)2 7,990
(5.6%)2 6,290
(4.5%)2 405,270
(4.1%)2 University Grad 104,940
(26.3%) 46,200 (32.6%)
33,400 (23.7%)
2,012,060 (20.5%)
College Grad 82,510 25,810 31,210 1,804,775 All Others 25,920 7,420 9,650 785,115 Occupation Total Labour Force 15 Years and over by Occupation
284,020 99,140 99,760 6,473,735
Professional/ Managerial/ Administrative
150,720 (53.1%)2
56,610 (57.1%)2
51,820 (51.9%)2
2,959,030 (45.7%)2
Sales and Service 65,700 22,260 24,790 1,522,820 Skilled Labour 51,420
(18.1%) 15,970 (16.1%)
17,610 (17.7%)
1,363,180 (21.1%)
Non Skilled Labour 16,180 4,300 5,540 628,695
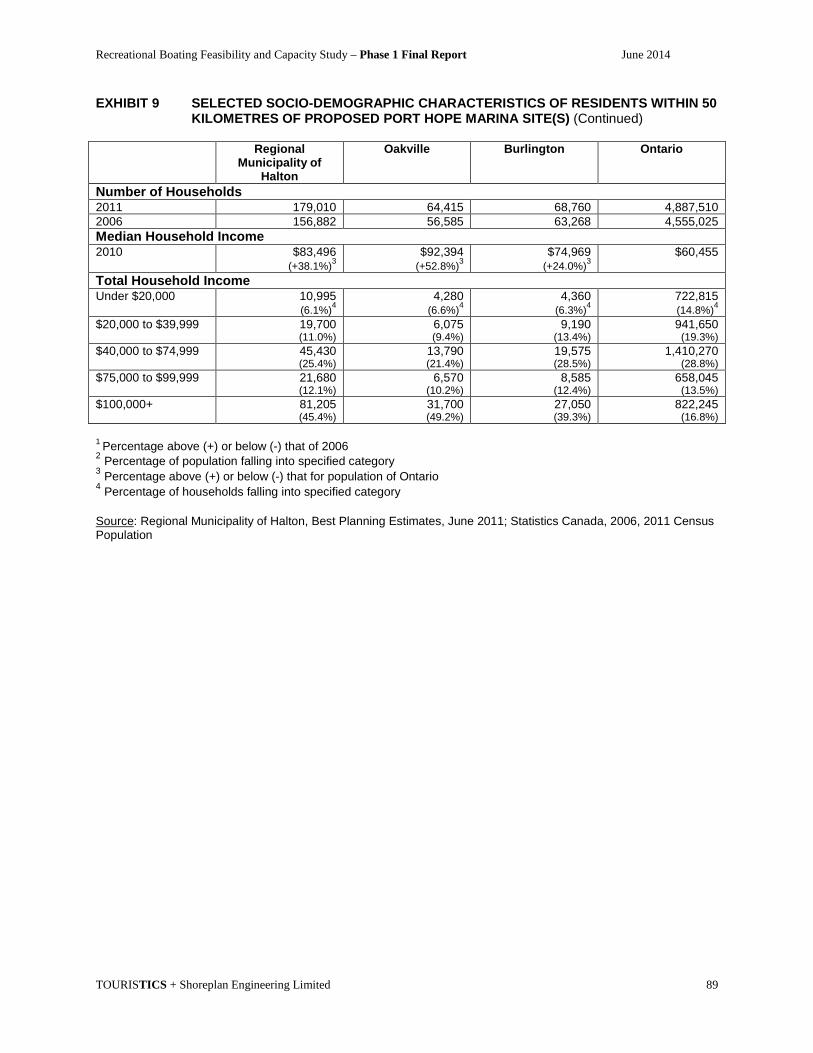
Recreational Boating Feasibility and Capacity Study – Phase 1 Final Report June 2014
TOURISTICS + Shoreplan Engineering Limited 89
EXHIBIT 9 SELECTED SOCIO-DEMOGRAPHIC CHARACTERISTICS OF RESIDENTS WITHIN 50 KILOMETRES OF PROPOSED PORT HOPE MARINA SITE(S) (Continued)
Regional
Municipality of Halton
Oakville Burlington Ontario
Number of Households 2011 179,010 64,415 68,760 4,887,510 2006 156,882 56,585 63,268 4,555,025 Median Household Income 2010 $83,496
(+38.1%)3 $92,394
(+52.8%)3 $74,969
(+24.0%)3 $60,455
Total Household Income Under $20,000 10,995
(6.1%)4 4,280
(6.6%)4 4,360
(6.3%)4 722,815 (14.8%)4
$20,000 to $39,999 19,700 (11.0%)
6,075 (9.4%)
9,190 (13.4%)
941,650 (19.3%)
$40,000 to $74,999 45,430 (25.4%)
13,790 (21.4%)
19,575 (28.5%)
1,410,270 (28.8%)
$75,000 to $99,999 21,680 (12.1%)
6,570 (10.2%)
8,585 (12.4%)
658,045 (13.5%)
$100,000+ 81,205 (45.4%)
31,700 (49.2%)
27,050 (39.3%)
822,245 (16.8%)
1 Percentage above (+) or below (-) that of 2006 2 Percentage of population falling into specified category 3 Percentage above (+) or below (-) that for population of Ontario 4 Percentage of households falling into specified category Source: Regional Municipality of Halton, Best Planning Estimates, June 2011; Statistics Canada, 2006, 2011 Census Population

Recreational Boating Feasibility and Capacity Study – Phase 1 Final Report June 2014
TOURISTICS + Shoreplan Engineering Limited 90
EXHIBIT 10 POPULATION PROJECTIONS FOR HALTON REGION BY AGE AND GENDER CATERGORIES IMPORTANT TO RECREATIONAL BOATING
Age 2011 2011 2011 2012 2012 2012 2013 2013 2013 2014 2014 2014 Total Male Female Total Male Female Total Male Female Total Male Female
0 to 15 96,730 49,460 47,270 97,090 49,510 47,580 97,710 49,730 47,980 99,250 50,980 48,270 16 to 24 61,940 31,820 30,120 67,040 34,430 32,610 68,420 35,140 33,280 69,550 35,570 33,980 25 to 34 56,020 26,390 29,630 63,130 29,790 33,340 64,550 30,460 34,090 66,290 33,160 34,130 35 to 44 77,790 37,310 40,480 78,750 38,080 40,670 79,110 38,320 40,790 79,150 38,340 40,810 45 to 54 79,390 38,930 40,460 83,320 40,850 42,470 84,460 41,770 42,690 85,220 42,440 42,780 55 to 64 55,650 26,620 29,030 56,810 27,190 29,620 58,530 28,030 30,500 60,780 30,170 30,610
65+ 65,520 28,880 36,640 70,020 30,570 39,450 72,480 31,340 41,140 75,100 33,340 41,760 Total 493,040 239,410 253,630 516,160 250,420 265,740 525,260 254,790 270,470 535,340 263,000 272,340
Age 2015 2015 2015 2016 2016 2016 2017 2017 2017 2018 2018 2018
Total Male Female Total Male Female Total Male Female Total Male Female 0 to 15 100,280 51,710 48,570 101,710 52,360 49,350 103,780 53,700 50,080 105,350 54,490 50,860
16 to 24 70,390 36,010 34,380 71,220 36,420 34,800 72,650 37,160 35,490 73,910 37,810 36,100 25 to 34 68,420 34,230 34,190 70,510 35,280 35,230 72,860 36,460 36,400 75,120 37,590 37,530 35 to 44 79,250 38,380 40,870 79,350 38,460 40,890 79,920 38,780 41,140 81,110 39,880 41,230 45 to 54 86,030 43,050 42,980 86,560 43,310 43,250 87,500 44,090 43,410 87,550 44,110 43,440 55 to 64 63,410 31,870 31,540 66,470 33,410 33,060 69,720 35,040 34,680 72,930 36,660 36,270
65+ 77,740 35,420 42,320 80,390 36,640 43,750 83,510 37,380 46,130 86,920 38,430 48,490 Total 545,520 270,670 274,850 556,210 275,880 280,330 569,940 282,610 287,330 582,890 288,970 293,920
Age 2019 2019 2019 2020 2020 2020 2021 2021 2021 2022 2022 2022
Total Male Female Total Male Female Total Male Female Total Male Female 0 to 15 106,540 54,640 51,900 108,580 55,660 52,920 110,960 56,850 54,110 112,870 57,790 55,080
16 to 24 75,330 38,750 36,580 76,540 39,380 37,160 77,960 40,110 37,850 79,010 40,650 38,360 25 to 34 77,410 38,740 38,670 79,470 39,770 39,700 81,420 40,760 40,660 82,930 41,510 41,420 35 to 44 82,860 40,880 41,980 84,640 41,760 42,880 86,770 42,810 43,960 88,660 43,740 44,920 45 to 54 87,610 44,150 43,460 87,660 44,180 43,480 87,720 44,220 43,500 87,770 44,250 43,520 55 to 64 75,920 37,790 38,130 78,500 39,070 39,430 80,580 40,100 40,480 82,060 40,840 41,220
65+ 90,590 40,660 49,930 94,620 42,520 52,100 98,680 44,400 54,280 102,610 46,230 56,380 Total 596,260 295,610 300,650 610,010 302,340 307,670 624,090 309,250 314,840 635,910 315,010 320,900

Recreational Boating Feasibility and Capacity Study – Phase 1 Final Report June 2014
TOURISTICS + Shoreplan Engineering Limited 91
EXHIBIT 10 POPULATION PROJECTIONS FOR HALTON REGION BY AGE AND GENDER CATERGORIES IMPORTANT TO RECREATIONAL BOATING (Continued)
Age 2023 2023 2023 2024 2024 2024 2025 2025 2025 2026 2026 2026 Total Male Female Total Male Female Total Male Female Total Male Female
0 to 15 114,100 58,400 55,700 117,130 59,540 57,590 119,920 61,170 58,750 122,880 62,980 59,900 16 to 24 80,050 41,180 38,870 81,560 41,980 39,580 82,790 42,610 40,180 84,050 43,260 40,790 25 to 34 84,020 42,050 41,970 85,260 42,630 42,630 86,210 43,120 43,090 87,060 43,540 43,520 35 to 44 90,480 44,640 45,840 93,070 46,300 46,770 95,850 47,680 48,170 98,450 48,970 49,480 45 to 54 87,830 44,290 43,540 87,880 44,310 43,570 88,400 44,400 44,000 89,150 44,520 44,630 55 to 64 82,920 41,260 41,660 83,980 41,730 42,250 84,980 42,230 42,750 85,720 42,600 43,120
65+ 106,420 47,980 58,440 111,170 51,000 60,170 116,200 53,310 62,280 121,580 55,750 65,830 Total 645,820 319,800 326,020 660,050 327,490 332,560 674,350 334,520 339,830 688,890 341,620 347,270
Age 2027 2027 2027 2028 2028 2028 2029 2029 2029 2030 2030 2030
Total Male Female Total Male Female Total Male Female Total Male Female 0 to 15 125,370 64,260 61,110 127,700 65,020 62,680 130,310 66,790 63,520 133,000 68,160 64,840
16 to 24 84,830 43,660 41,170 85,500 44,000 41,500 86,140 44,260 41,880 87,160 44,790 42,370 25 to 34 87,700 43,850 43,850 88,170 44,090 44,080 89,040 44,670 44,370 89,770 45,040 44,730 35 to 44 100,480 49,990 50,490 102,270 50,880 51,390 104,220 51,850 52,370 106,060 52,770 53,290 45 to 54 89,830 44,630 45,200 90,890 44,700 46,190 92,580 45,700 46,880 94,380 46,580 47,800 55 to 64 85,980 42,730 43,250 86,240 42,860 43,380 86,500 42,990 43,510 86,760 43,120 43,640
65+ 126,410 58,200 68,210 130,610 60,990 69,620 135,110 63,130 71,980 140,060 65,430 74,630 Total 700,600 347,320 353,280 711,380 352,540 358,840 723,900 359,390 364,510 737,190 365,890 371,300
Age 2031 2031 2031
Total Male Female 0 to 15 136,000 69,700 66,300
16 to 24 88,440 45,440 43,000 25 to 34 90,930 45,620 45,310 35 to 44 108,080 53,780 54,300 45 to 54 96,650 47,700 48,950 55 to 64 87,020 43,250 43,770
65+ 145,420 67,900 77,520 Total 752,540 373,390 379,150
Source: Regional Municipality of Halton, Best Planning Estimates, June 2011; Ontario Ministry of Finance, Ontario Population Projections Update, 2009-2036, Spring 2013; Greater Golden Horseshoe Growth Forecasts to 2041, Technical Report, November 2012, Hemson; TOURISTICS

Recreational Boating Feasibility and Capacity Study – Phase 1 Final Report June 2014
TOURISTICS + Shoreplan Engineering Limited 92
EXHIBIT 11 POPULATION PROJECTIONS FOR ONTARIO BY AGE AND GENDER CATERGORIES IMPORTANT TO RECREATIONAL BOATING
Age 2011 2011 2011 2012 2012 2012 2013 2013 2013 2014 2014 2014 Total Male Female Total Male Female Total Male Female Total Male Female
0 to 15 2,371,080 1,217,160 1,153,920 2,372,570 1,217,690 1,154,880 2,372,910 1,218,280 1,154,630 2,386,460 1,222,340 1,164,120 16 to 24 1,637,170 837,450 799,720 1,649,430 844,510 804,920 1,644,990 841,920 803,070 1,632,360 833,570 798,790 25 to 34 1,848,640 918,240 930,400 1,860,430 924,090 936,340 1,864,960 914,640 950,320 1,931,400 959,560 971,840 35 to 44 1,842,330 910,510 931,820 1,854,070 916,310 937,760 1,844,590 909,360 935,230 1,847,860 907,090 940,770 45 to 54 2,104,360 1,054,210 1,050,150 2,117,780 1,060,930 1,056,850 2,110,210 1,056,530 1,053,680 2,102,310 1,048,120 1,054,190 55 to 64 1,665,550 813,490 852,060 1,676,170 818,670 857,500 1,716,320 839,600 876,720 1,765,590 865,340 900,250
65+ 1,897,160 838,570 1,058,590 1,975,450 877,100 1,098,350 2,051,450 914,170 1,137,280 2,095,630 949,140 1,146,490 Total 13,366,290 6,589,630 6,776,660 13,805,900 6,959,300 6,846,600 13,632,430 6,721,500 6,910,930 13,761,610 6,785,160 6,976,450
Age 2015 2015 2015 2016 2016 2016 2017 2017 2017 2018 2018 2018
Total Male Female Total Male Female Total Male Female Total Male Female 0 to 15 2,390,560 1,226,670 1,163,890 2,398,330 1,231,550 1,166,780 2,418,750 1,242,130 1,176,620 2,440,210 1,253,200 1,187,010
16 to 24 1,612,830 825,410 787,420 1,595,520 817,570 777,950 1,585,540 812,920 772,620 1,575,590 808,320 767,270 25 to 34 1,959,860 977,840 982,020 1,993,550 996,830 996,720 2,011,100 1,005,360 1,005,740 2,029,190 1,014,110 1,015,080 35 to 44 1,843,040 904,600 938,440 1,840,940 902,220 938,720 1,865,840 914,920 950,920 1,891,690 928,180 963,510 45 to 54 2,081,390 1,039,700 1,041,690 2,064,760 1,030,980 1,033,780 2,034,320 1,013,800 1,020,520 2,003,830 996,610 1,007,220 55 to 64 1,841,280 891,640 949,640 1,867,640 918,930 948,710 1,908,240 940,560 967,680 1,949,500 962,460 987,040
65+ 2,165,150 984,700 1,180,450 2,273,460 1,021,670 1,251,790 2,358,550 1,063,270 1,295,280 2,444,390 1,105,150 1,339,240 Total 13,894,110 6,850,560 7,043,550 14,034,230 6,919,750 7,114,480 14,182,340 6,992,960 7,189,380 14,334,400 7,068,030 7,266,370
Age 2019 2019 2019 2020 2020 2020 2021 2021 2021 2022 2022 2022
Total Male Female Total Male Female Total Male Female Total Male Female 0 to 15 2,462,470 1,264,630 1,197,840 2,485,620 1,276,530 1,209,090 2,509,720 1,288,920 1,220,800 2,540,050 1,305,080 1,234,970
16 to 24 1,565,760 803,820 761,940 1,556,000 799,360 756,640 1,546,290 795,010 751,280 1,553,970 799,260 754,710 25 to 34 2,047,930 1,023,150 1,024,780 2,067,360 1,032,510 1,034,850 2,087,210 1,042,090 1,045,120 2,082,410 1,039,040 1,043,370 35 to 44 1,918,260 941,860 976,400 1,945,700 956,020 989,680 1,974,250 970,910 1,003,340 2,012,660 991,060 1,021,600 45 to 54 1,973,330 979,460 993,870 1,942,660 962,330 980,330 1,911,660 945,120 966,540 1,911,780 943,780 968,000 55 to 64 1,991,420 984,750 1,006,670 2,034,190 1,007,410 1,026,780 2,077,770 1,030,380 1,047,390 2,072,110 1,026,940 1,045,170
65+ 2,531,440 1,147,420 1,384,020 2,619,600 1,190,010 1,429,590 2,709,140 1,232,880 1,476,260 2,812,170 1,283,260 1,528,910 Total 14,490,610 7,145,090 7,345,520 14,651,130 7,224,170 7,426,960 14,816,040 7,305,310 7,510,730 14,985,150 7,388,420 7,596,730

Recreational Boating Feasibility and Capacity Study – Phase 1 Final Report June 2014
TOURISTICS + Shoreplan Engineering Limited 93
EXHIBIT 11 POPULATION PROJECTIONS FOR ONTARIO BY AGE AND GENDER CATERGORIES IMPORTANT TO RECREATIONAL BOATING (Continued)
Age 2023 2023 2023 2024 2024 2024 2025 2025 2025 2026 2026 2026 Total Male Female Total Male Female Total Male Female Total Male Female
0 to 15 2,570,950 1,321,280 1,249,670 2,602,110 1,337,320 1,264,790 2,633,420 1,353,430 1,279,990 2,665,030 1,369,300 1,295,730 16 to 24 1,561,930 803,610 758,320 1,569,910 807,840 762,070 1,578,320 812,260 766,060 1,587,270 817,000 770,270 25 to 34 2,076,800 1,035,660 1,041,140 2,070,600 1,031,840 1,038,760 2,063,930 1,027,800 1,036,130 2,056,210 1,023,330 1,032,880 35 to 44 2,051,930 1,011,640 1,040,290 2,091,980 1,032,640 1,059,340 2,132,840 1,054,120 1,078,720 2,174,080 1,076,160 1,097,920 45 to 54 1,911,820 942,270 969,550 1,911,430 940,480 970,950 1,911,530 938,550 972,980 1,911,060 936,420 974,640 55 to 64 2,065,770 1,023,220 1,042,550 2,058,730 1,019,110 1,039,620 2,051,170 1,014,830 1,036,340 2,042,900 1,010,340 1,032,560
65+ 2,916,630 1,334,620 1,582,010 3,022,920 1,387,480 1,635,440 3,129,090 1,440,520 1,688,570 3,236,740 1,493,870 1,742,870 Total 15,155,830 7,472,300 7,683,530 15,327,680 7,556,710 7,770,970 15,500,300 7,641,510 7,858,790 15,673,290 7,726,420 7,946,870
Age 2027 2027 2027 2028 2028 2028 2029 2029 2029 2030 2030 2030
Total Male Female Total Male Female Total Male Female Total Male Female 0 to 15 2,694,010 1,384,110 1,309,900 2,723,110 1,398,950 1,324,160 2,752,180 1,413,950 1,338,230 2,781,410 1,429,080 1,352,330
16 to 24 1,601,270 824,280 776,990 1,615,510 831,570 783,940 1,629,700 838,820 790,880 1,644,010 846,020 797,990 25 to 34 2,051,800 1,021,380 1,030,420 2,046,770 1,019,090 1,027,680 2,041,140 1,016,510 1,024,630 2,034,960 1,013,690 1,021,270 35 to 44 2,195,870 1,086,550 1,109,320 2,118,020 1,097,150 1,020,870 2,240,460 1,107,870 1,132,590 2,263,290 1,118,780 1,144,510 45 to 54 1,938,870 950,690 988,180 1,966,930 965,240 1,001,690 1,995,640 980,010 1,015,630 2,024,760 994,920 1,029,840 55 to 64 2,017,990 996,020 1,021,970 1,992,190 981,350 1,010,840 1,965,260 966,340 998,920 1,937,240 950,940 986,300
65+ 3,346,480 1,548,300 1,798,180 3,456,420 1,602,690 1,853,730 3,566,640 1,656,960 1,909,680 3,676,630 1,711,030 1,965,600 Total 15,846,290 7,811,330 8,034,960 16,018,950 7,896,040 8,122,910 16,191,020 7,980,460 8,210,560 16,362,300 8,064,460 8,297,840
Age 2031 2031 2031
Total Male Female 0 to 15 2,810,260 1,444,070 1,366,190
16 to 24 1,658,240 853,130 805,110 25 to 34 2,027,880 1,010,400 1,017,480 35 to 44 2,286,790 1,129,870 1,156,920 45 to 54 2,054,810 1,010,280 1,044,530 55 to 64 1,907,870 935,070 972,800
65+ 3,786,830 1,765,200 2,021,630 Total 16,532,680 8,148,020 8,384,660
Source: Ontario Ministry of Finance, Ontario Population Projections Update, 2009-2036, Spring 2013; Statistics Canada, 2011 Census data; TOURISTICS

Recreational Boating Feasibility and Capacity Study – Phase 1 Final Report June 2014
TOURISTICS + Shoreplan Engineering Limited 94
EXHIBIT 12 LENGTH OF BOATS REGISTERED WITHIN ONTARIO AND NEARBY U.S. STATES
Ontario1 Length3 2007 2008 2009 2010 2011 2012
Under 6 metres 990,368 994,923 998,292 1,000,560 1,009,174 1,017,904 6 m. to less than 8 metres 58,019 59,392 60,823 62,284 63,033 63,796 8 m. to less than 9 metres 11,208 11,443 11,720 12,010 12,283 12,556 9 m. to less than 11 metres 14,365 15,295 16,145 16,819 17,622 18,525 11 m. to less than 14 metres 8,869 9,394 9,843 10,206 10,682 11,129 14 metres+ 4,775 5,114 5,335 5,580 5,874 6,178 Total 1,087,604 1,095,561 1,102,158 1,107,459 1,118,668 1,130,088 Total 6 metres+ 97,236 100,638 103,866 106,899 109,494 112,184
New York2 Under 6 metres 452,362 444,478 439,003 435,874 427,858 428,382 6 m. to less than 8 metres 19,977 19,450 18,549 18,156 17,800 17,933 8 m. to less than 9 metres 5,432 5,332 5,325 5,333 5,403 5,596 9 m. to less than 11 metres 6,433 6,393 6,389 6,399 6,558 6,998 11 m. to less than 14 metres 6,655 6,727 6,690 6,683 6,870 7,216 14 metres+ 3,161 3,161 3,205 3,244 3,339 3,894 Total 494,020 485,541 479,161 475,689 467,828 470,019 Total 6 metres+ 41,658 41,063 40,158 39,815 39,970 41,637
Pennsylvania2 Under 6 metres 311,608 308,503 306,946 331,952 300,847 305,701 6 m. to less than 8 metres 15,752 15,006 15,604 16,928 15,342 15,567 8 m. to less than 9 metres 3,767 3,458 3,715 4,200 3,807 3,848 9 m. to less than 11 metres 5,821 5,834 5,879 6,498 5,889 6,027 11 m. to less than 14 metres 3,082 3,102 3,149 3,494 3,167 3,198 14 metres+ 2,397 2,413 2,454 2,800 2,538 2,601 Total 342,427 338,316 337,747 365,872 331,590 336,942 Total 6 metres+ 30,819 29,813 30,801 33,920 30,743 31,241

Recreational Boating Feasibility and Capacity Study – Phase 1 Final Report June 2014
TOURISTICS + Shoreplan Engineering Limited 95
EXHIBIT 12 LENGTH OF BOATS REGISTERED WITHIN ONTARIO AND NEARBY U.S. STATES (Continued)
Michigan2
Length3 2007 2008 2009 2010 2011 2012 Under 6 metres 758,333 746,228 740,647 740,438 731,828 701,506 6 m. to less than 8 metres 35,904 34,472 34,460 34,284 33,869 32,537 8 m. to less than 9 metres 9,137 8,659 8,974 9,213 9,251 8,997 9 m. to less than 11 metres 12,470 12,419 12,475 12,673 12,765 12,642 11 m. to less than 14 metres 9,334 9,402 9,450 9,582 9,735 9,583 14 metres+ 5,565 5,571 5,663 5,876 5,942 6,173 Total 830,743 816,752 811,670 812,066 803,391 771,439 Total 6 metres+ 72,410 70,524 71,023 71,628 71,563 69,933 1 Limited provincial data is available therefore breakdown is based on discussions with boat builders/manufacturers; Transport Canada, Service Canada; National Marine Manufacturers Association - Canada; Ontario Marine Operators Association (Boating Ontario); Canadian Yachting Association; and Ontario Sailing Association. A Transport Canada license or registration is mandatory for all pleasure craft equipped with motors of 10 horsepower (7.5 kilowatts) or more) 2 Data from U.S. Coast Guard compiled by National Marine Manufacturers Association in their Annual Statistical Reports 2007 to 2012, New York State Department of Motor Vehicles, Pennsylvania Fish & Boat Commission Licensing & Registration Section, Michigan Department of State, and discussions with U.S. boat builders/manufacturers 3 Under 6 metres (under 20 feet); 6 m. to less than 8 metres (20 ft. to less than 26 ft.); 8 m..to less than 9 metres (26 ft. to less than 30 ft.); 9 m. to less than 11 metres (30 ft. to less than 36 ft.); 11 m. to less than 14 metres (36 ft. to less than 46 ft.); 14 metres + (46 ft. +)

Recreational Boating Feasibility and Capacity Study – Phase 1 Final Report June 2014
TOURISTICS + Shoreplan Engineering Limited 96
EXHIBIT 13 BEAM (WIDTH) OF BOATS REGISTERED WITHIN ONTARIO AND NEARBY U.S. STATES
Ontario1
Beam3 2007 2008 2009 2010 2011 2012 Under 2 metres 514,222 516,586 518,645 520,370 523,919 527,516 2 m. to less than 3 metres 548,149 552,144 555,367 557,729 563,789 569,915 3 m. to less than 4 metres 16,910 17,959 18,874 19,666 20,734 21,860 4 metres+ 8,323 8,872 9,272 9,694 10,226 10,797 Total 1,087,604 1,095,561 1,102,158 1,107,459 1,118,668 1,130,088
New York2 Under 2 metres 228,191 224,079 221,152 219,526 215,759 216,451 2 m. to less than 3 metres 250,647 246,247 242,790 240,907 236,854 238,119 3 m. to less than 4 metres 9,360 9,363 9,338 9,347 9,305 9,424 4 metres+ 5,822 5,852 5,881 5,909 5,910 6,025 Total 494,020 485,541 479,161 475,689 467,828 470,019
Pennsylvania2 Under 2 metres 161,900 159,525 158,934 171,915 155,297 157,282 2 m. to less than 3 metres 172,583 170,505 170,188 184,257 167,116 169,923 3 m. to less than 4 metres 5,324 5,546 5,784 6,497 6,146 6,518 4 metres+ 2,620 2,740 2,841 3,203 3,031 3,219 Total 342,427 338,316 337,747 365,872 331,590 336,942
Michigan2 Under 2 metres 388,251 381,027 378,283 378,166 373,389 357,681 2 m. to less than 3 metres 420,091 412,926 410,133 410,113 405,820 389,933 3 m. to less than 4 metres 14,328 14,569 14,859 15,188 15,435 15,195 4 metres+ 8,073 8,229 8,395 8,598 8,746 8,629 Total 830,743 816,752 811,670 812,066 803,391 771,439 1 Limited provincial data is available therefore breakdown is based on discussions with boat builders/manufacturers; Transport Canada, Service Canada; National Marine Manufacturers Association - Canada; Ontario Marine Operators Association (Boating Ontario); Canadian Yachting Association; and Ontario Sailing Association 2 Data from U.S. Coast Guard compiled by National Marine Manufacturers Association in their Annual Statistical Reports 2007 to 2012, New York State Department of Motor Vehicles, Pennsylvania Fish & Boat Commission Licensing & Registration Section, Michigan Department of State, and discussions with U.S. boat builders/manufacturers 3 Under 2 metres (under 6 feet 6 inches); 2 m. to less than 3 metres (6 ft. 6” to less than 10 feet); 3 m. to less than 4 metres (10 ft. to less than 13 feet); 4 metres + (13 ft. +)

Recreational Boating Feasibility and Capacity Study – Phase 1 Final Report June 2014
TOURISTICS + Shoreplan Engineering Limited 97
EXHIBIT 14 DRAFT OF BOATS REGISTERED WITHIN ONTARIO AND NEARBY U.S. STATES
Ontario1 Draft3 2007 2008 2009 2010 2011 2012
Under 0.61 m. 490,864 493,299 496,316 498,572 503,464 508,284 0.61 m. to less than 0.91 m.
436,164 440,197 442,887 444,910 449,306 453,771
0.91 m. to less than 1.22 m.
130,914 132,124 132,933 133,540 134,805 136,245
1.22 m. to less than 1.52 m.
26,497 26,743 26,906 27,029 27,593 28,187
1.52 m. to less than 1.83 m.
2,177 2,200 2,213 2,331 2,391 2,460
1.83 m.+ 988 998 1,003 1,077 1,109 1,141 Total 1,087,604 1,095,561 1,102,258 1,107,459 1,118,668 1,130,088
New York2 Under 0.61 m. 222,367 218,556 215,607 214,024 210,504 211,432 0.61 m. to less than 0.91 m.
198,498
195,051
192,526
191,132 187,938 188,582
0.91 m. to less than 1.22 m.
59,579
58,545
57,787
57,368 56,424 56,700
1.22 m. to less than 1.52 m.
12,059
11,850
11,696
11,612
11,415
11,691
1.52 m. to less than 1.83 m.
1,046
1,062
1,067
1,073
1,072
1,122
1.83 m.+ 471 477 478 480 475 492 Total 494,020 485,541 479,161 475,689 467,828 470,019
Pennsylvania2 Under 0.61 m. 154,132 152,286 151,976 164,616 149,201 151,569 0.61 m. to less than 0.91 m. 137,588 135,908 135,706 147,007 133,208 135,189 0.91 m. to less than 1.22 m. 41,297 40,793 40,732 44,124 39,993 40,646 1.22 m. to less than 1.52 m. 8,359 8,257 8,244 8,931 8,091 8,381 1.52 m. to less than 1.83 m. 725 740 752 825 760 804 1.83 m.+ 326 332 337 369 337 353 Total 342,427 338,316 337,747 365,872 331,590 336,942

Recreational Boating Feasibility and Capacity Study – Phase 1 Final Report June 2014
TOURISTICS + Shoreplan Engineering Limited 98
EXHIBIT 14 DRAFT OF BOATS REGISTERED WITHIN ONTARIO AND NEARBY U.S. STATES (Continued)
Michigan2
Draft3 2007 2008 2009 2010 2011 2012 Under 0.61 m. 373,931 367,644 365,226 365,370 361,492 347,022 0.61 m. to less than 0.91 m. 333,794 328,105 326,127 326,288 322,742 309,519 0.91 m. to less than 1.22 m. 100,188 98,481 97,887 97,935 96,896 93,061 1.22 m. to less than 1.52 m. 20,279 19,934 19,812 19,823 19,603 19,188 1.52 m. to less than 1.83 m. 1,759 1,786 1,807 1,831 1,841 1,841 1.83 m.+ 791 802 810 819 816 808 Total 830,743 816,752 811,670 812,066 803,391 771,439 1 Limited provincial data is available therefore breakdown is based on discussions with boat builders/manufacturers; Transport Canada, Service Canada; National Marine Manufacturers Association - Canada; Ontario Marine Operators Association (Boating Ontario); Canadian Yachting Association; and Ontario Sailing Association 2 Data from U.S. Coast Guard compiled by National Marine Manufacturers Association in their Annual Statistical Reports 2007 to 2012, New York State Department of Motor Vehicles, Pennsylvania Fish & Boat Commission Licensing & Registration Section, Michigan Department of State, and discussions with U.S. boat builders/manufacturers 3 Under 0.61 metres (under 2 feet); 0.61 m. to less than 0.91 metres (2 ft. to less than 3 feet); 0.91 m. to less than 1.22 metres (3 ft. to less than 4 feet); 1.22 m. to less than 1.52 metres (4 ft. to less than 5 feet); 1.52 m. to less than 1.83 metres (5 ft. to less than 6 feet); 1.83 m. + (6 ft. +)

Recreational Boating Feasibility and Capacity Study – Phase 1 Final Report June 2014
TOURISTICS + Shoreplan Engineering Limited 99
EXHIBIT 15 TYPE OF BOATS REGISTERED IN ONTARIO AND NEARBY U.S. STATES
Ontario1 Type 2007 2008 2009 2010 2011 2012
Outboard boats
715,348
721,929 725,687
728,442 737,155
744,680
Inboard boats 96,066 97,279 98,308 99,199 99,289 100,282 Sterndrive boats
143,241
143,638 144,544
145,298 146,668
148,165
Sailboats 132,949 132,715 133,719 134,520 135,556 136,961 Total 1,087,604 1,095,561 1,102,258 1,107,459 1,118,668 1,130,088
New York2 Outboard boats
324,931
319,951 315,461
312,878
307,703
309,442
Inboard boats 43,636 42,227 41,866 41,757 41,323 41,068 Sterndrive boats
65,064
63,659 62,833
62,389
61,615
61,634
Sailboats 60,389 59,704 59,001 58,665 57,187 57,875 Total 494,020 485,541 479,161 475,689 467,828 470,019
Pennsylvania2 Outboard boats
225,224
222,936
222,360
240,647
218,096
221,830
Inboard boats 30,469 29,559 29,695 32,326 29,406 29,641 Sterndrive boats
45,099
44,356
44,289
47,986
43,672
44,183
Sailboats 41,635 41,465 41,403 44,913 40,416 41,288 Total 342,427 338,316 337,747 365,872 331,590 336,942
Michigan2 Outboard boats 546,403 538,205 534,373 534,125 528,412 507,886 Inboard boats 73,649 71,196 71,141 71,517 71,105 67,634 Sterndrive boats 109,412 107,083 106,435 106,507 105,810 101,159 Sailboats 101,279 100,267 99,722 99,918 98,064 94,760 Total 830,743 816,752 811,670 812,066 803,391 771,439 1 Limited provincial data is available therefore breakdown is based on discussions with boat builders/manufacturers, Canadian Coast Guard Office of Boating, Service Canada, National Marine Manufacturers Association - Canada, Ontario Marine Operators Association (Boating Ontario), Canadian Yachting Association, and Ontario Sailing Association 2 Data from U.S. Coast Guard compiled by National Marine Manufacturers Association in their Annual Statistical Reports 2007 to 2012, New York State Department of Motor Vehicles, Pennsylvania Fish & Boat Commission Licensing & Registration Section, Michigan Department of State, and discussions with U.S. boat builders/manufacturers

Recreational Boating Feasibility and Capacity Study – Phase 1 Final Report June 2014
TOURISTICS + Shoreplan Engineering Limited 100
EXHIBIT 16 NUMBER OF BOATS IN OTHER CANADIAN PROVINCES AND TOP 12 U.S. STATES IN 2012
Province1 Number of Registered
Recreational Boats
Percentage of all
Registered Recreational
Boats
State2 Number of Registered
Recreational Boats
Percentage of all
Registered Recreational
Boats Ontario 1,130,088 42.6 Florida 904,258 7.0 Quebec 531,080 20 California 869,047 6.8 British Columbia
376,696
14.2
Minnesota 821,837
6.4
Alberta 201,391 7.6 Michigan 771,439 6.4 Nova Scotia 102,431 3.9 Wisconsin 638,891 5.0 Saskatchewan 101,441 3.8 Texas 586,490 4.6 Manitoba 98,565 3.7 New York 470,019 3.7 Newfoundland
55,217
2.1
South Carolina
454,972
3.5
New Brunswick
51,991
1.9
Ohio 439,680
3.4
Prince Edward Island
6,497
0.2
North Carolina
398,902
3.1
Illinois 377,359 2.9 Pennsylvania 336,942 2.6 Total 2,655,398 100.0 Total 12,811,807 100.0 Source: 1 2013 Recreational Boating Statistical Abstract National Marine Manufacturers Association - Canada; 2 2013 Recreational Boating Statistical Abstract National Marine Manufacturers Association Note: No data are available for Yukon, Northwest Territories, or Nunavut Note: In 2007 there were 991,680 registered boats in Florida, 964,881 in California, 867,446 in Minnesota, and 944,800 in Michigan

Recreational Boating Feasibility and Capacity Study – Phase 1 Final Report June 2014
TOURISTICS + Shoreplan Engineering Limited 101
EXHIBIT 17 PLEASURE CRAFT LICENSES GRANTED1 BY TRANSPORT CANADA IN 2013
Province/ Territory
Jan Feb Mar Apr May Jun July Aug Sept Oct Nov Dec Total
Ontario 368 486 1,053 2,073 4,062 2,908 2,551 2,208 917 753 421 213 18,013 Quebec 200 232 448 870 2,222 1,883 1,562 1,382 546 399 240 89 10,073 British Columbia
155 176 384 415 835 710 776 829 343 318 229 148 5,318
Alberta 72 70 219 352 974 844 863 796 307 152 98 52 4,799 Saskatchewan 34 38 89 162 451 431 444 342 111 60 39 13 2,214 Manitoba 24 17 69 132 417 397 404 290 102 58 28 11 1,949 New Brunswick
19 29 33 89 222 170 211 171 60 42 18 15 1,079
Nova Scotia 8 13 34 79 173 149 172 130 44 41 21 12 876 Newfoundland & Labrador
14 14 38 42 128 96 121 137 45 36 24 11 706
Prince Edward Island
0 3 7 9 15 12 21 14 8 4 1 0 94
Yukon 0 2 2 5 15 18 21 16 2 4 3 2 90 Northwest Territories
0 0 0 3 31 20 24 11 6 1 0 0 96
Nunavut 0 0 0 1 3 0 0 2 0 0 0 0 6 Total 894 1,080 2,376 4,232 9,548 7,638 7,170 6,328 2,491 1,868 1,122 566 45,313 Source: Transport Canada, Pleasure Craft Licensing, Monthly National Report by Region 1 A Transport Canada license or registration is mandatory for all pleasure craft equipped with motors of 10 horsepower (7.5 kilowatts) or more)

Recreational Boating Feasibility and Capacity Study – Phase 1 Final Report June 2014
TOURISTICS + Shoreplan Engineering Limited 102
EXHIBIT 18 PLEASURE CRAFT LICENSES CANCELLED1 BY TRANSPORT CANADA IN 2013
Province/ Territory
Jan Feb Mar Apr May Jun July Aug Sept Oct Nov Dec Total
Ontario 8 5 9 9 20 19 13 13 12 8 4 2 122 Quebec 3 2 1 3 13 10 6 14 6 7 12 12 89 British Columbia
3 3 5 3 16 7 12 6 2 4 3 4 68
Alberta 1 0 1 0 1 0 1 2 1 2 0 0 9 Saskatchewan 0 0 0 0 1 0 0 0 0 0 0 0 1 Manitoba 0 0 0 0 0 1 0 0 0 0 0 0 1 New Brunswick
0 0 0 0 1 0 0 0 0 0 1 1 3
Nova Scotia 0 0 0 0 1 1 1 0 2 0 1 0 6 Newfoundland & Labrador
0 0 0 0 0 0 1 0 2 1 0 0 4
Prince Edward Island
0 0 0 0 0 0 0 0 0 0 0 0 0
Yukon 0 0 0 0 0 0 0 6 0 0 0 0 6 Northwest Territories
0 0 0 0 0 0 0 0 0 0 0 0 0
Nunavut 0 0 0 0 0 0 0 0 0 0 0 0 0 Total 15 10 16 15 53 38 34 41 25 22 21 19 309 Source: Transport Canada, Pleasure Craft Licensing, Monthly National Report by Region 1 Boat is no longer being operated in Canada (i.e. sold foreign, boat destroyed)

Recreational Boating Feasibility and Capacity Study – Phase 1 Final Report June 2014
TOURISTICS + Shoreplan Engineering Limited 103
EXHIBIT 19 PROJECTED GROWTH BY LENGTH OF BOATS REGISTERED IN ONTARIO (2013 to 2031)
Length1 2013 2014 2015 2016 2017 2018 2019 2020 2021 2022 2023 Under 6 metres 1,022,520 1,027,160 1,031,820 1,036,500 1,041,200 1,044,880 1,048,570 1,052,280 1,056,000 1,059,730 1,062,430 6 m. to less than 8 metres 64,700 65,620 66,550 67,490 68,450 69,080 69,710 70,350 71,000 71,650 71,950 8 m. to less than 9 metres 12,780 13,010 13,240 13,480 13,720 13,900 14,080 14,260 14,450 14,640 14,760 9 m. to less than 11 metres 19,400 20,310 21,270 22,270 23,320 24,300 25,320 26,390 27,500 28,660 29,720 11 m. to less than 14 metres 11,590 12,070 12,570 13,090 13,630 14,130 14,650 15,180 15,730 16,300 16,810 14 metres+ 6,470 6,780 7,100 7,440 7,800 8,130 8,480 8,840 9,220 9,620 9,980 Total 1,137,460 1,144,950 1,152,550 1,160,270 1,168,120 1,174,420 1,180,810 1,187,300 1,193,900 1,200,600 1,205,650 Total 6 metres+ 114,940 117,790 120,730 123,770 126,920 129,540 132,240 135,020 137,900 140,870 143,220
Length1 2024 2025 2026 2027 2028 2029 2030 2031
Under 6 metres 1,065,130 1,067,840 1,070,560 1,073,280 1,074,930 1,076,580 1,078,230 1,079,880 6 m. to less than 8 metres 72,250 72,550 72,850 73,150 73,420 73,690 73,960 74,230 8 m. to less than 9 metres 14,880 15,000 15,120 15,240 15,290 15,340 15,390 15,440 9 m. to less than 11 metres 30,820 31,960 33,150 34,380 35,480 36,620 37,800 39,010 11 m. to less than 14 metres 17,340 17,890 18,450 19,030 19,530 20,050 20,580 21,120 14 metres+ 10,360 10,750 11,160 11,580 11,960 12,350 12,760 13,180 Total 1,210,780 1,215,990 1,221,290 1,226,660 1,230,610 1,234,630 1,238,720 1,242,860 Total 6 metres+ 145,650 148,150 150,730 153,380 155,680 158,050 160,490 162,980 1 Under 6 metres (under 20 feet); 6 m. to less than 8 metres (20 ft. to less than 26 ft.); 8 m..to less than 9 metres (26 ft. to less than 30 ft.); 9 m. to less than 11 metres (30 ft. to less than 36 ft.); 11 m. to less than 14 metres (36 ft. to less than 46 ft.); 14 metres + (46 ft. +) Source: Transport Canada, National Marine Manufacturers Association - Canada, Ontario Marine Operators Association (Boating Ontario), Canadian Yachting Association, Ontario Sailing Association, discussions with Canadian boat builders/manufacturers and boat dealers/brokers, and TOURISTICS

Recreational Boating Feasibility and Capacity Study – Phase 1 Final Report June 2014
TOURISTICS + Shoreplan Engineering Limited 104
EXHIBIT 20 PROJECTED GROWTH BY BEAM (WIDTH) OF BOATS REGISTERED IN ONTARIO (2013 to 2031)
Beam1 2013 2014 2015 2016 2017 2018 2019 2020 2021 2022 2023 Under 2 metres 530,040 532,570 535,130 537,700 540,280 539,830 539,360 538,870 538,350 537,810 534,500 2 m. to less than 3 metres 573,190 576,510 579,840 583,200 586,580 591,220 595,870 600,520 605,200 609,860 615,430 3 m. to less than 4 metres 22,900 23,980 25,110 26,290 27,530 28,920 30,370 31,900 33,510 35,200 37,020 4 metres+ 11,330 11,890 12,470 13,080 13,730 14,450 15,210 16,010 16,840 17,730 18,700 Total 1,137,460 1,144,950 1,152,550 1,160,270 1,168,120 1,174,420 1,180,810 1,187,300 1,193,900 1,200,600 1,205,650
Beam1 2024 2025 2026 2027 2028 2029 2030 2031
Under 2 metres 531,150 527,760 524,340 520,860 519,550 518,210 516,850 515,450 2 m. to less than 3 metres 620,990 626,520 632,020 637,500 639,810 642,090 644,350 646,540 3 m. to less than 4 metres 38,930 40,930 43,020 45,210 47,120 49,110 51,170 53,330 4 metres+ 19,710 20,780 21,910 23,090 24,130 25,220 26,350 27,540 Total 1,210,780 1,215,990 1,221,290 1,226,660 1,230,610 1,234,630 1,238,720 1,242,860 1 Under 2 metres (under 6 feet 6 inches); 2 m. to less than 3 metres (6 ft. 6” to less than 10 feet); 3 m. to less than 4 metres (10 ft. to less than 13 feet); 4 metres + (13 ft. +) Source: Transport Canada, National Marine Manufacturers Association - Canada, Ontario Marine Operators Association (Boating Ontario), Canadian Yachting Association, Ontario Sailing Association, discussions with Canadian boat builders/manufacturers and boat dealers/brokers, and TOURISTICS

Recreational Boating Feasibility and Capacity Study – Phase 1 Final Report June 2014
TOURISTICS + Shoreplan Engineering Limited 105
EXHIBIT 21 PROJECTED GROWTH BY DRAFT OF BOATS REGISTERED IN ONTARIO (2013 to 2031)
Draft1 2013 2014 2015 2016 2017 2018 2019 2020 2021 2022 2023 Under 0.61 m. 511,430 514,610 517,840 521,110 524,440 527,080 529,750 532,460 535,230 538,030 540,080 0.61 m. to less than 0.91 m. 456,580 459,430 462,330 465,270 468,260 470,620 473,010 475,450 477,920 480,440 482,260 0.91 m. to less than 1.22 m. 137,090 137,950 138,820 139,710 140,610 141,320 142,050 142,780 143,520 144,280 144,860 1.22 m. to less than 1.52 m. 28,670 29,180 29,690 30,210 30,740 31,230 31,730 32,240 32,760 33,280 33,780 1.52 m. to less than 1.83 m. 2,510 2,570 2,620 2,680 2,750 2,810 2,870 2,940 3,000 3,060 3,120 1.83 m.+ 1,180 1,210 1,250 1,290 1,320 1,360 1,400 1,430 1,470 1,510 1,550 Total 1,137,460 1,144,950 1,152,550 1,160,270 1,168,120 1,174,420 1,180,810 1,187,300 1,193,900 1,200,600 1,205,650
Draft1 2024 2025 2026 2027 2028 2029 2030 2031
Under 0.61 m. 542,140 544,220 546,370 548,540 550,020 551,530 553,050 554,610 0.61 m. to less than 0.91 m. 484,110 485,990 487,910 489,840 491,180 492,540 493,910 495,300 0.91 m. to less than 1.22 m. 145,450 146,050 146,650 147,260 147,720 148,190 148,670 149,150 1.22 m. to less than 1.52 m. 34,290 34,810 35,330 35,870 36,410 36,960 37,520 38,080 1.52 m. to less than 1.83 m. 3,190 3,260 3,320 3,390 3,460 3,530 3,620 3,700 1.83 m.+ 1,600 1,660 1,710 1,760 1,820 1,880 1,950 2,020 Total 1,210,780 1,215,990 1,221,290 1,226,660 1,230,610 1,234,630 1,238,720 1,242,860 1 Under 0.61 metres (under 2 feet); 0.61 m. to less than 0.91 metres (2 ft. to less than 3 feet); 0.91 m. to less than 1.22 metres (3 ft. to less than 4 feet); 1.22 m. to less than 1.52 metres (4 ft. to less than 5 feet); 1.52 m. to less than 1.83 metres (5 ft. to less than 6 feet); 1.83 m. + (6 ft. +) Source: Transport Canada, National Marine Manufacturers Association - Canada, Ontario Marine Operators Association (Boating Ontario), Canadian Yachting Association, Ontario Sailing Association, discussions with Canadian boat builders/manufacturers and boat dealers/brokers, and TOURISTICS

Recreational Boating Feasibility and Capacity Study – Phase 1 Final Report June 2014
TOURISTICS + Shoreplan Engineering Limited 106
EXHIBIT 22 PROJECTED GROWTH BY TYPE OF BOATS REGISTERED IN ONTARIO (2013 to 2031)
Type 2013 2014 2015 2016 2017 2018 2019 2020 2021 2022 2023 Outboard boats 749,820 755,040 760,330 765,710 771,170 775,620 780,120 784,700 789,350 794,070 797,700 Inboard boats 101,030 101,790 102,560 103,340 104,140 104,800 105,470 106,150 106,840 107,540 108,090 Sterndrive boats 148,990 149,840 150,700 151,570 152,460 153,140 153,830 154,530 155,250 155,980 156,490 Sailboats 137,620 138,280 138,960 139,650 140,350 140,860 141,390 141,920 142,460 143,010 143,370 Total 1,137,460 1,144,950 1,152,550 1,160,270 1,168,120 1,174,420 1,180,810 1,187,300 1,193,900 1,200,600 1,205,650
Type 2024 2025 2026 2027 2028 2029 2030 2031
Outboard boats 801,370 805,120 808,930 812,780 815,690 818,660 821,660 824,710 Inboard boats 108,660 109,220 109,800 110,380 110,840 111,300 111,780 112,250 Sterndrive boats 157,010 157,540 158,080 158,630 158,990 159,360 159,740 160,130 Sailboats 143,740 144,110 144,480 144,870 145,090 145,310 145,540 145,770 Total 1,210,780 1,215,990 1,221,290 1,226,660 1,230,610 1,234,630 1,238,720 1,242,860 Source: Transport Canada, National Marine Manufacturers Association - Canada, Ontario Marine Operators Association (Boating Ontario), Canadian Yachting Association, Ontario Sailing Association, discussions with Canadian boat builders/manufacturers and boat dealers/brokers, and TOURISTICS

Recreational Boating Feasibility and Capacity Study – Phase 1 Final Report June 2014
TOURISTICS + Shoreplan Engineering Limited 107
EXHIBIT 23 PROJECTED GROWTH BY LENGTH OF BOATS REGISTERED IN NEW YORK STATE (2013 to 2031)
Length1 2013 2014 2015 2016 2017 2018 2019 2020 2021 2022 2023 Under 6 metres
429,270 430,160 431,050 431,950 432,850 433,710 434,570 435,430 436,290 437,150 437,970
6 m. to less than 8 metres
17,970 18,010 18,050 18,090 18,130 18,170 18,210 18,250 18,290 18,330 18,360
8 m. to less than 9 metres
5,620 5,640 5,660 5,680 5,700 5,720 5,740 5,760 5,780 5,800 5,820
9 m. to less than 11 metres
7,080 7,170 7,260 7,350 7,440 7,490 7,540 7,600 7,660 7,720 7,760
11 m. to less than 14 metres
7,300 7,380 7,470 7,560 7,650 7,700 7,750 7,800 7,850 7,900 7,940
14 metres+ 4,050 4,210 4,370 4,540 4,720 4,870 5,030 5,190 5,360 5,530 5,680 Total 471,290 472,570 473,860 475,170 476,490 477,660 478,840 480,030 481,230 482,430 483,530 Total 6 metres+
42,020 42,410 42,810 43,220 43,640 43,950 44,270 44,600 44,940 45,280 45,560
Length1 2024 2025 2026 2027 2028 2029 2030 2031
Under 6 metres
438,790 439,610 440,440 441,270 442,060 442,850 443,640 444,430
6 m. to less than 8 metres
18,390 18,420 18,450 18,480 18,510 18,540 18,570 18,600
8 m. to less than 9 metres
5,840 5,860 5,880 5,900 5,920 5,940 5,960 5,980
9 m. to less than 11 metres
7,800 7,840 7,880 7,920 7,960 8,000 8,040 8,080
11 m. to less than 14 metres
7,980 8,020 8,060 8,100 8,120 8,140 8,160 8,180
14 metres+ 5,830 5,990 6,150 6,320 6,460 6,600 6,750 6,900 Total 484,630 485,740 486,860 487,990 489,030 490,070 491,120 492,170 Total 6 metres+
45,840 46,130 46,420 46,720 46,970 47,220 47,480 47,740
1 Under 6 metres (under 20 feet); 6 m. to less than 8 metres (20 ft. to less than 26 ft.); 8 m..to less than 9 metres (26 ft. to less than 30 ft.); 9 m. to less than 11 metres (30 ft. to less than 36 ft.); 11 m. to less than 14 metres (36 ft. to less than 46 ft.); 14 metres + (46 ft. +) Note: Based on our interviews with the marinas and yacht clubs within Halton Region, Ontario and New York State are the source of more than 90 percent of all transient boaters visiting these facilities in Halton Region

Recreational Boating Feasibility and Capacity Study – Phase 1 Final Report June 2014
TOURISTICS + Shoreplan Engineering Limited 108
EXHIBIT 24 PROJECTED GROWTH BY WIDTH OF BOATS REGISTERED IN NEW YORK STATE (2013 to 2031)
Beam1 2013 2014 2015 2016 2017 2018 2019 2020 2021 2022 2023 Under 2 metres
216,680 216,910 217,130 217,350 217,550 217,800 218,060 218,300 218,540 218,760 218,830
2 m. to less than 3 metres
238,570 239,010 239,450 239,870 240,300 240,570 240,840 241,110 241,370 241,620 241,860
3 m. to less than 4 metres
9,770 10,130 10,510 10,900 11,310 11,690 12,070 12,470 12,880 13,310 13,760
4 metres+ 6,270 6,520 6,770 7,050 7,330 7,600 7,870 8,150 8,440 8,740 9,080 Total 471,290 472,570 473,860 475,170 476,490 477,660 478,840 480,030 481,230 482,430 483,530
Beam1 2024 2025 2026 2027 2028 2029 2030 2031
Under 2 metres 218,890 218,940 218,980 219,000 219,080 219,140 219,200 219,240 2 m. to less than 3 metres 242,090 242,300 242,510 242,720 242,790 242,860 242,910 242,960 3 m. to less than 4 metres 14,220 14,700 15,200 15,710 16,230 16,750 17,300 17,850 4 metres+ 9,430 9,800 10,170 10,560 10,930 11,320 11,710 12,120 Total 484,630 485,740 486,860 487,990 489,030 490,070 491,120 492,170 1 Under 2 metres (under 6 feet 6 inches); 2 m. to less than 3 metres (6 ft. 6” to less than 10 feet); 3 m. to less than 4 metres (10 ft. to less than 13 feet); 4 metres + (13 ft. +) Note: Based on our interviews with the marinas and yacht clubs within Halton Region, Ontario and New York State are the source of more than 90 percent of all transient boaters visiting these facilities in Halton Region Source: National Marine Manufacturers Association, New York State Department of Motor Vehicles, discussions with U.S. boat builders/manufacturers and TOURISTICS

Recreational Boating Feasibility and Capacity Study – Phase 1 Final Report June 2014
TOURISTICS + Shoreplan Engineering Limited 109
EXHIBIT 25 PROJECTED GROWTH BY DRAFT OF BOATS REGISTERED IN NEW YORK STATE (2013 to 2031)
Draft1 2013 2014 2015 2016 2017 2018 2019 2020 2021 2022 2023 Under 0.61 m.
211,990 212,550 213,100 213,660 214,250 214,730 215,010 215,300 215,560 215,850 216,290
0.61 m. to less than 0.91 m.
189,050 189,530 190,010 190,500 190,980 191,400 191,710 192,010 192,320 192,620 193,000
0.91 m. to less than 1.22 m.
56,850 57,000 57,150 57,310 57,460 57,600 57,960 58,320 58,700 59,070 59,200
1.22 m. to less than 1.52 m.
11,760 11,830 11,900 11,980 12,050 12,140 12,350 12,570 12,790 13,010 13,120
1.52 m. to less than 1.83 m.
1,140 1,160 1,190 1,210 1,230 1,250 1,260 1,270 1,290 1,300 1,330
1.83 m.+ 500 500 510 510 520 540 550 560 570 580 590 Total 471,290 472,570 473,860 475,170 476,490 477,660 478,840 480,030 481,230 482,430 483,530
Draft1 2024 2025 2026 2027 2028 2029 2030 2031
Under 0.61 m.
216,740 217,200 217,650 218,100 218,510 218,920 219,320 219,730
0.61 m. to less than 0.91 m.
193,370 193,740 194,120 194,510 194,850 195,200 195,540 195,890
0.91 m. to less than 1.22 m.
59,330 59,460 59,590 59,730 59,850 59,960 60,080 60,200
1.22 m. to less than 1.52 m.
13,230 13,340 13,450 13,560 13,680 13,800 13,920 14,040
1.52 m. to less than 1.83 m.
1,360 1,390 1,430 1,460 1,500 1,540 1,590 1,630
1.83 m.+ 600 610 620 630 640 650 670 680 Total 484,630 485,740 486,860 487,990 489,030 490,070 491,120 492,170 1 Under 0.61 metres (under 2 feet); 0.61 m. to less than 0.91 metres (2 ft. to less than 3 feet); 0.91 m. to less than 1.22 metres (3 ft. to less than 4 feet); 1.22 m. To less than 1.52 metres (4 ft. to less than 5 feet); 1.52 m. to less than 1.83 metres (5 ft. to less than 6 feet); 1.83 m. + (6 ft. +) Note: Based on our interviews with the marinas and yacht clubs within Halton Region, Ontario and New York State are the source of more than 90 percent of all transient boaters visiting these facilities in Halton Region Source: National Marine Manufacturers Association, New York State Department of Motor Vehicles, discussions with U.S. boat builders/manufacturers and TOURISTICS

Recreational Boating Feasibility and Capacity Study – Phase 1 Final Report June 2014
TOURISTICS + Shoreplan Engineering Limited 110
EXHIBIT 26 PROJECTED GROWTH BY TYPE OF BOATS REGISTERED IN NEW YORK STATE (2013 to 2031)
Type 2013 2014 2015 2016 2017 2018 2019 2020 2021 2022 2023 Outboard boats
310,400 311,370 312,340 313,320 314,310 315,200 316,080 316,990 317,900 318,810 319,660
Inboard boats
41,220 41,360 41,510 41,660 41,820 41,960 42,110 42,250 42,400 42,540 42,680
Sterndrive boats
61,720 61,820 61,910 62,010 62,100 62,180 62,260 62,340 62,420 62,500 62,570
Sailboats 57,950 58,020 58,100 58,180 58,260 58,320 58,390 58,450 58,510 58,580 58,620 Total 471,290 472,570 473,860 475,170 476,490 477,660 478,840 480,030 481,230 482,430 483,530
Type 2024 2025 2026 2027 2028 2029 2030 2031
Outboard boats
320,500 321,350 322,210 323,070 323,830 324,560 325,300 326,040
Inboard boats
42,820 42,960 43,100 43,240 43,350 43,480 43,610 43,740
Sterndrive boats
62,640 62,710 62,780 62,850 62,950 63,050 63,150 63,250
Sailboats 58,670 58,720 58,770 58,830 58,900 58,980 59,060 59,140 Total 484,630 485,740 486,860 487,990 489,030 490,070 491,120 492,170 Note: Based on our interviews with the marinas and yacht clubs within Halton Region, Ontario and New York State are the source of more than 90 percent of all transient boaters visiting these facilities in Halton Region Source: National Marine Manufacturers Association, New York State Department of Motor Vehicles, discussions with U.S. boat builders/manufacturers and TOURISTICS

Recreational Boating Feasibility and Capacity Study – Phase 1 Final Report June 2014
TOURISTICS + Shoreplan Engineering Limited 111
EXHIBIT 27 ESTIMATED NUMBER OF SEASONAL BOATS WITHIN HALTON REGION
Ontario Regional Municipality of Halton Year Population1 Number of
Boats 6 metres and
over2
Number of Persons Per
Boat
Population3 Number of Boats 6
metres and over
2012 13,505,900 112,184 120.4 516,160 4,287 2013 13,632,430 114,940 118.6 525,260 4,430 2014 13,761,610 117,790 116.8 535,340 4,580 2015 13,894,110 120,730 115.1 545,520 4,740 2016 14,034,230 123,770 113.4 556,210 4,900 2017 14,182,340 126,920 111.7 569,940 5,100 2018 14,334,400 129,540 110.7 582,890 5,270 2019 14,490,610 132,240 109.6 596,260 5,440 2020 14,651,130 135,020 108.5 610,010 5,620 2021 14,816,040 137,900 107.4 624,090 5,810 2022 14,985,150 140,870 106.4 635,910 5,980 2023 15,155,830 143,220 105.8 645,820 6,100 2024 15,327,680 145,650 105.2 660,050 6,270 2025 15,500,300 148,150 104.6 674,350 6,440 2026 15,673,290 150,730 104.0 688,890 6,620 2027 15,846,290 153,380 103.3 700,600 6,780 2028 16,018,950 155,680 102.9 711,380 6,910 2029 16,191,020 158,050 102.4 723,900 7,070 2030 16,362,300 160,490 102.0 737,190 7,230 2031 16,532,680 162,980 101.4 752,540 7,420
Source: 1Ontario Ministry of Finance Population Projections for Ontario and Counties, Spring 2012 2EXHIBIT 12 and EXHIBIT 19
3Regional Municipality of Halton, Best Planning Estimates, June 2011
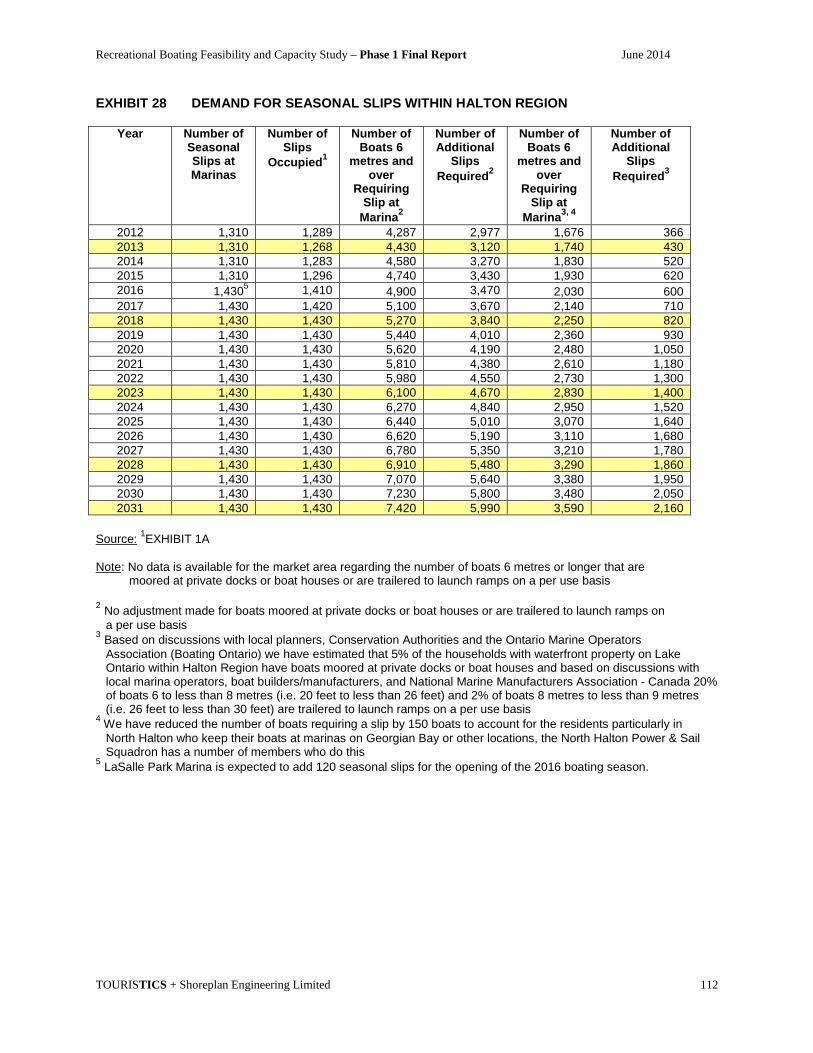
Recreational Boating Feasibility and Capacity Study – Phase 1 Final Report June 2014
TOURISTICS + Shoreplan Engineering Limited 112
EXHIBIT 28 DEMAND FOR SEASONAL SLIPS WITHIN HALTON REGION
Year Number of Seasonal Slips at Marinas
Number of Slips
Occupied1
Number of Boats 6
metres and over
Requiring Slip at
Marina2
Number of Additional
Slips Required2
Number of Boats 6
metres and over
Requiring Slip at
Marina3, 4
Number of Additional
Slips Required3
2012 1,310 1,289 4,287 2,977 1,676 366 2013 1,310 1,268 4,430 3,120 1,740 430 2014 1,310 1,283 4,580 3,270 1,830 520 2015 1,310 1,296 4,740 3,430 1,930 620 2016 1,4305 1,410 4,900 3,470 2,030 600 2017 1,430 1,420 5,100 3,670 2,140 710 2018 1,430 1,430 5,270 3,840 2,250 820 2019 1,430 1,430 5,440 4,010 2,360 930 2020 1,430 1,430 5,620 4,190 2,480 1,050 2021 1,430 1,430 5,810 4,380 2,610 1,180 2022 1,430 1,430 5,980 4,550 2,730 1,300 2023 1,430 1,430 6,100 4,670 2,830 1,400 2024 1,430 1,430 6,270 4,840 2,950 1,520 2025 1,430 1,430 6,440 5,010 3,070 1,640 2026 1,430 1,430 6,620 5,190 3,110 1,680 2027 1,430 1,430 6,780 5,350 3,210 1,780 2028 1,430 1,430 6,910 5,480 3,290 1,860 2029 1,430 1,430 7,070 5,640 3,380 1,950 2030 1,430 1,430 7,230 5,800 3,480 2,050 2031 1,430 1,430 7,420 5,990 3,590 2,160
Source: 1EXHIBIT 1A Note: No data is available for the market area regarding the number of boats 6 metres or longer that are moored at private docks or boat houses or are trailered to launch ramps on a per use basis
2 No adjustment made for boats moored at private docks or boat houses or are trailered to launch ramps on a per use basis 3 Based on discussions with local planners, Conservation Authorities and the Ontario Marine Operators Association (Boating Ontario) we have estimated that 5% of the households with waterfront property on Lake Ontario within Halton Region have boats moored at private docks or boat houses and based on discussions with local marina operators, boat builders/manufacturers, and National Marine Manufacturers Association - Canada 20% of boats 6 to less than 8 metres (i.e. 20 feet to less than 26 feet) and 2% of boats 8 metres to less than 9 metres (i.e. 26 feet to less than 30 feet) are trailered to launch ramps on a per use basis 4 We have reduced the number of boats requiring a slip by 150 boats to account for the residents particularly in North Halton who keep their boats at marinas on Georgian Bay or other locations, the North Halton Power & Sail Squadron has a number of members who do this 5 LaSalle Park Marina is expected to add 120 seasonal slips for the opening of the 2016 boating season.

Recreational Boating Feasibility and Capacity Study – Phase 1 Final Report June 2014
TOURISTICS + Shoreplan Engineering Limited 113
EXHIBIT 29 AVERAGE DISTANCE TRAVELLED AWAY FROM MARINA
Percentage of Days Away from Marina
Distance in Nautical Miles Distance in Kilometres1
60 Within 20 Within 37 20 Within 21 to 40 Within 37.1 to 74.1 10 Within 41 to 60 Within 74.2 to 111.1 6 Within 61 to 80 Within 111.2 to 148.2 4 Beyond 80 Beyond 148.3
Source: 2005 Great Lakes Boating Survey, U.S. Department of Transportation; Michigan Department of
Natural Resources; Michigan State University, Department of Parks, Recreation and Tourism Resources 1 One nautical mile equals 1.852 kilometres
EXHIBIT 30 AVERAGE NUMBER OF DAYS USING A BOAT
Type of Boat
Number of Days1 Northeast United States2 Canada3
Cabin Motorboat 22.5 20.6 Open Motorboat 19.8 18.1 Sailboat 24.6 21.7 Note: 1 Refers to days that boat is away from home slip Source: 2 National Recreational Boating Survey, U.S. Coast Guard, 2011 3 Department of Fisheries and Oceans, 2010
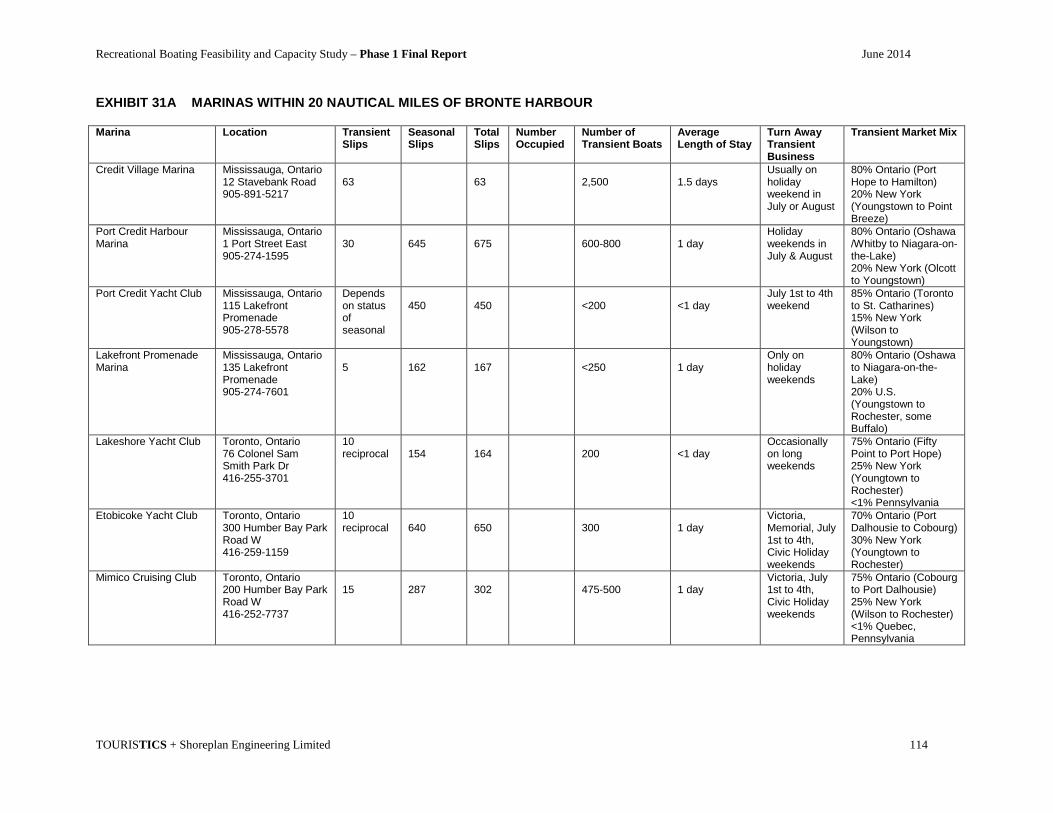
Recreational Boating Feasibility and Capacity Study – Phase 1 Final Report June 2014
TOURISTICS + Shoreplan Engineering Limited 114
EXHIBIT 31A MARINAS WITHIN 20 NAUTICAL MILES OF BRONTE HARBOUR Marina Location Transient
Slips Seasonal Slips
Total Slips
Number Occupied
Number of Transient Boats
Average Length of Stay
Turn Away Transient Business
Transient Market Mix
Credit Village Marina Mississauga, Ontario 12 Stavebank Road 905-891-5217
63
63
2,500
1.5 days
Usually on holiday weekend in July or August
80% Ontario (Port Hope to Hamilton) 20% New York (Youngstown to Point Breeze)
Port Credit Harbour Marina
Mississauga, Ontario 1 Port Street East 905-274-1595
30
645
675
600-800
1 day
Holiday weekends in July & August
80% Ontario (Oshawa /Whitby to Niagara-on-the-Lake) 20% New York (Olcott to Youngstown)
Port Credit Yacht Club Mississauga, Ontario 115 Lakefront Promenade 905-278-5578
Depends on status of seasonal
450
450
<200
<1 day
July 1st to 4th weekend
85% Ontario (Toronto to St. Catharines) 15% New York (Wilson to Youngstown)
Lakefront Promenade Marina
Mississauga, Ontario 135 Lakefront Promenade 905-274-7601
5
162
167
<250
1 day
Only on holiday weekends
80% Ontario (Oshawa to Niagara-on-the-Lake) 20% U.S. (Youngstown to Rochester, some Buffalo)
Lakeshore Yacht Club Toronto, Ontario 76 Colonel Sam Smith Park Dr 416-255-3701
10 reciprocal
154
164
200
<1 day
Occasionally on long weekends
75% Ontario (Fifty Point to Port Hope) 25% New York (Youngtown to Rochester) <1% Pennsylvania
Etobicoke Yacht Club Toronto, Ontario 300 Humber Bay Park Road W 416-259-1159
10 reciprocal
640
650
300
1 day
Victoria, Memorial, July 1st to 4th, Civic Holiday weekends
70% Ontario (Port Dalhousie to Cobourg) 30% New York (Youngtown to Rochester)
Mimico Cruising Club Toronto, Ontario 200 Humber Bay Park Road W 416-252-7737
15
287
302
475-500
1 day
Victoria, July 1st to 4th, Civic Holiday weekends
75% Ontario (Cobourg to Port Dalhousie) 25% New York (Wilson to Rochester) <1% Quebec, Pennsylvania
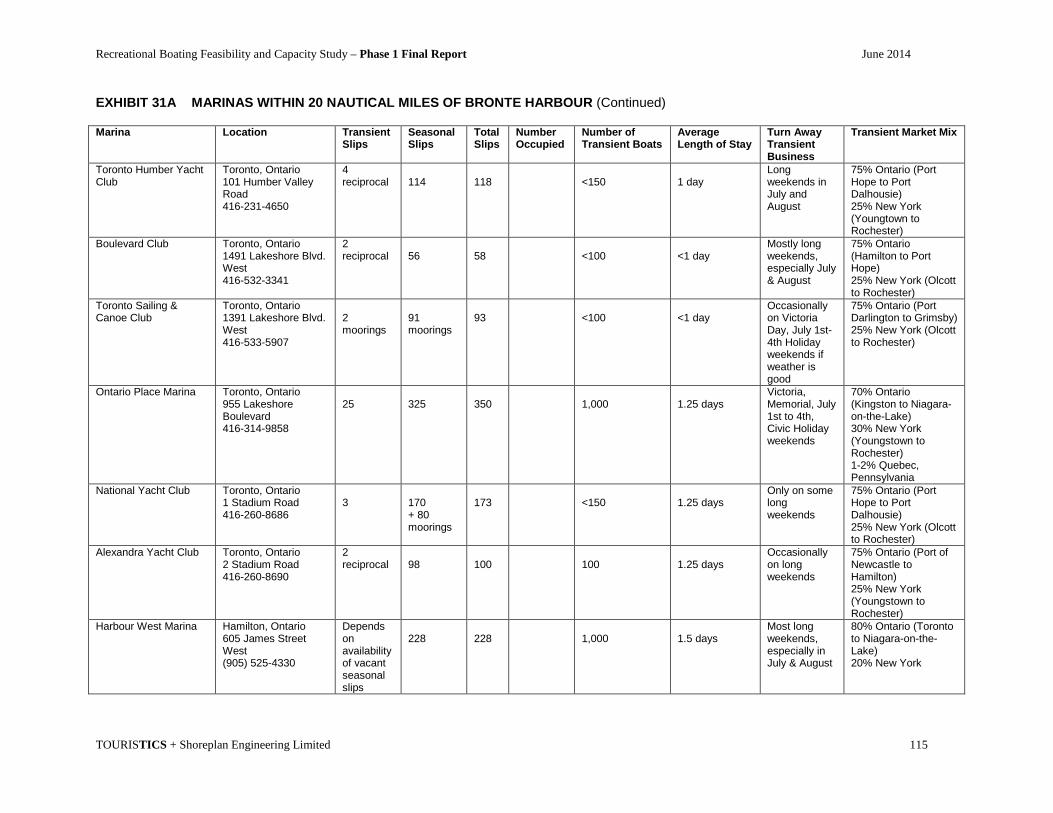
Recreational Boating Feasibility and Capacity Study – Phase 1 Final Report June 2014
TOURISTICS + Shoreplan Engineering Limited 115
EXHIBIT 31A MARINAS WITHIN 20 NAUTICAL MILES OF BRONTE HARBOUR (Continued) Marina Location Transient
Slips Seasonal Slips
Total Slips
Number Occupied
Number of Transient Boats
Average Length of Stay
Turn Away Transient Business
Transient Market Mix
Toronto Humber Yacht Club
Toronto, Ontario 101 Humber Valley Road 416-231-4650
4 reciprocal
114
118
<150
1 day
Long weekends in July and August
75% Ontario (Port Hope to Port Dalhousie) 25% New York (Youngtown to Rochester)
Boulevard Club Toronto, Ontario 1491 Lakeshore Blvd. West 416-532-3341
2 reciprocal
56
58
<100
<1 day
Mostly long weekends, especially July & August
75% Ontario (Hamilton to Port Hope) 25% New York (Olcott to Rochester)
Toronto Sailing & Canoe Club
Toronto, Ontario 1391 Lakeshore Blvd. West 416-533-5907
2 moorings
91 moorings
93
<100
<1 day
Occasionally on Victoria Day, July 1st-4th Holiday weekends if weather is good
75% Ontario (Port Darlington to Grimsby) 25% New York (Olcott to Rochester)
Ontario Place Marina Toronto, Ontario 955 Lakeshore Boulevard 416-314-9858
25
325
350
1,000
1.25 days
Victoria, Memorial, July 1st to 4th, Civic Holiday weekends
70% Ontario (Kingston to Niagara-on-the-Lake) 30% New York (Youngstown to Rochester) 1-2% Quebec, Pennsylvania
National Yacht Club Toronto, Ontario 1 Stadium Road 416-260-8686
3
170 + 80 moorings
173
<150
1.25 days
Only on some long weekends
75% Ontario (Port Hope to Port Dalhousie) 25% New York (Olcott to Rochester)
Alexandra Yacht Club Toronto, Ontario 2 Stadium Road 416-260-8690
2 reciprocal
98
100
100
1.25 days
Occasionally on long weekends
75% Ontario (Port of Newcastle to Hamilton) 25% New York (Youngstown to Rochester)
Harbour West Marina Hamilton, Ontario 605 James Street West (905) 525-4330
Depends on availability of vacant seasonal slips
228
228
1,000
1.5 days
Most long weekends, especially in July & August
80% Ontario (Toronto to Niagara-on-the-Lake) 20% New York
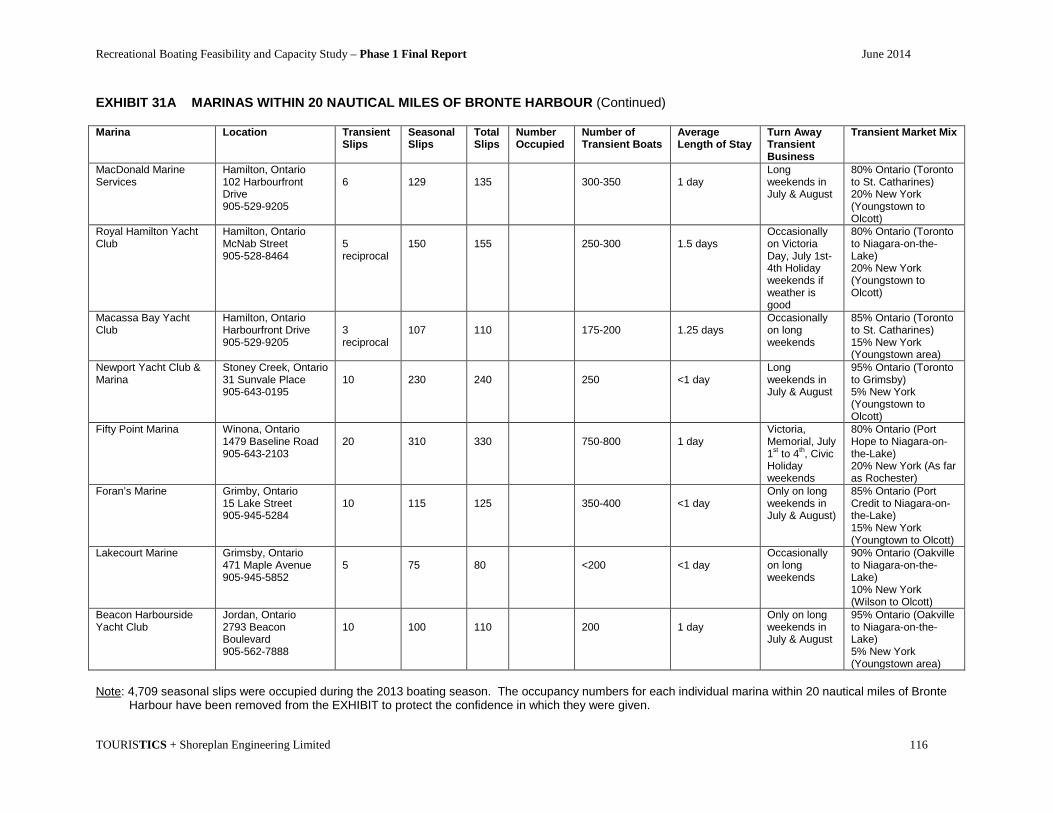
Recreational Boating Feasibility and Capacity Study – Phase 1 Final Report June 2014
TOURISTICS + Shoreplan Engineering Limited 116
EXHIBIT 31A MARINAS WITHIN 20 NAUTICAL MILES OF BRONTE HARBOUR (Continued) Marina Location Transient
Slips Seasonal Slips
Total Slips
Number Occupied
Number of Transient Boats
Average Length of Stay
Turn Away Transient Business
Transient Market Mix
MacDonald Marine Services
Hamilton, Ontario 102 Harbourfront Drive 905-529-9205
6
129
135
300-350
1 day
Long weekends in July & August
80% Ontario (Toronto to St. Catharines) 20% New York (Youngstown to Olcott)
Royal Hamilton Yacht Club
Hamilton, Ontario McNab Street 905-528-8464
5 reciprocal
150
155
250-300
1.5 days
Occasionally on Victoria Day, July 1st-4th Holiday weekends if weather is good
80% Ontario (Toronto to Niagara-on-the-Lake) 20% New York (Youngstown to Olcott)
Macassa Bay Yacht Club
Hamilton, Ontario Harbourfront Drive 905-529-9205
3 reciprocal
107
110
175-200
1.25 days
Occasionally on long weekends
85% Ontario (Toronto to St. Catharines) 15% New York (Youngstown area)
Newport Yacht Club & Marina
Stoney Creek, Ontario 31 Sunvale Place 905-643-0195
10
230
240
250
<1 day
Long weekends in July & August
95% Ontario (Toronto to Grimsby) 5% New York (Youngstown to Olcott)
Fifty Point Marina Winona, Ontario 1479 Baseline Road 905-643-2103
20
310
330
750-800
1 day
Victoria, Memorial, July 1st to 4th, Civic Holiday weekends
80% Ontario (Port Hope to Niagara-on-the-Lake) 20% New York (As far as Rochester)
Foran’s Marine Grimby, Ontario 15 Lake Street 905-945-5284
10
115
125
350-400
<1 day
Only on long weekends in July & August)
85% Ontario (Port Credit to Niagara-on-the-Lake) 15% New York (Youngtown to Olcott)
Lakecourt Marine Grimsby, Ontario 471 Maple Avenue 905-945-5852
5
75
80
<200
<1 day
Occasionally on long weekends
90% Ontario (Oakville to Niagara-on-the-Lake) 10% New York (Wilson to Olcott)
Beacon Harbourside Yacht Club
Jordan, Ontario 2793 Beacon Boulevard 905-562-7888
10
100
110
200
1 day
Only on long weekends in July & August
95% Ontario (Oakville to Niagara-on-the-Lake) 5% New York (Youngstown area)
Note: 4,709 seasonal slips were occupied during the 2013 boating season. The occupancy numbers for each individual marina within 20 nautical miles of Bronte Harbour have been removed from the EXHIBIT to protect the confidence in which they were given.

Recreational Boating Feasibility and Capacity Study – Phase 1 Final Report June 2014
TOURISTICS + Shoreplan Engineering Limited 117
EXHIBIT 31B MARINAS WITHIN 21 TO 40 NAUTICAL MILES OF BRONTE HARBOUR Marina Location Transient
Slips Seasonal Slips
Total Slips
Number Occupied
Number of Transient Boats
Average Length of Stay
Turn Away Transient Business
Transient Market Mix
Marina Quay West Toronto, Ontario 235 Queens Quay West 416-203-1212
20
180
200
500
1.5 days
Every long weekend
80% Ontario (Port Hope to Hamilton) 20% New York (Youngstown to Point Breeze)
Marina 4 Toronto, Ontario 235 Queens Quay West 416-203-1212
10
90
100
200
1.5 days
Most long weekends, especially in July & August
80% Ontario (Port Hope to Hamilton) 20% New York (Youngstown to Point Breeze)
Toronto Island Marina Toronto, Ontario Centre Island 416-203-1055
50
100
150
2,000
1.25 days
Most long weekends, July 1st to 4th in particular
80% Ontario (Newcastle to Hamilton) 20% New York (Youngstown to Olcott)
Hanlan’s Point Toronto, Ontario Hanlan’s Point 416-203-1055
150
150
2,000
2 days
Only on long weekends, probably less than 50 boats
70% Ontario (Cobourg to Hamilton, some Kingston & Niagara Peninsula) 30% New York (Lewiston to Rochester)
Island Yacht Club Toronto, Ontario 400 Queens Quay West 416-362-6588
15
285
300
<500
1.25 days
Victoria, Memorial, July 1st to 4th, Civic Holiday weekends
75% Ontario (Port Hope to Port Dalhousie) 25% New York (Wilson to Rochester)
Queen City Yacht Club Toronto, Ontario Algonquin Island 416-203-0929
6 reciprocal
104
110
300
1.25 days
Victoria, Memorial, July 1st to 4th, Civic Holiday weekends
70% Ontario (Port Hope to Hamilton) 30% New York (Mostly Rochester)
Royal Canadian Yacht Club
Toronto, Ontario Centre Island 416-967-7245
10 reciprocal
390
400
<250
1 day
Mostly on Victoria Day, July 1st to 4th, Civic Holiday weekends
75% Ontario (Port Hope to Port Dalhousie) 25% New York (Youngstown to Rochester)

Recreational Boating Feasibility and Capacity Study – Phase 1 Final Report June 2014
TOURISTICS + Shoreplan Engineering Limited 118
EXHIBIT 31B MARINAS WITHIN 21 TO 40 NAUTICAL MILES OF BRONTE HARBOUR (Continued) Marina Location Transient
Slips Seasonal Slips
Total Slips
Number Occupied
Number of Transient Boats
Average Length of Stay
Turn Away Transient Business
Transient Market Mix
Outer Harbour Marina Toronto, Ontario 475 Unwin Avenue 416-778-6445
10
644
654
350
1 day
Sometimes on the two long weekends in July & August
70% Ontario (Kingston to Niagara-on-the-Lake) 30% New York (Youngstown to Rochester) 1% Quebec, Pennsylvania
Aquatic Park Sailing Club
Toronto, Ontario 2 Leslie Street 416-631-3940
10 + 100 moorings
10
Ashbridge’s Bay Yacht Club
Toronto, Ontario 30 Ashbridge’s Bay Park Road 416-698-4498
6
274
280
200
1 day
Sometimes on long weekends
75% Ontario (Oakville to Port Hope) 25% New York (Youngtown to Olcott, some Rochester)
Toronto Hydroplane & Sailing Club
Toronto, Ontario 20 Ashbridge’s Bay Park Road 416-694-6918
20
190
210
550-600
1 day
Most long weekends in boating season
75% Ontario (Oakville to Port Hope) 25% New York (Youngtown to Olcott, a few from Rochester)
Bluffers Park Marina Scarborough, Ontario 7 Brimley Road South 416-266-4556
20
410
430
900-1,000
1 day
Victoria, Memorial, July 1st to 4th, Civic Holiday weekends
70% Ontario (Fifty Point to Kingston) 30% New York (Youngstown to Rochester) <1 Pennsylvania & Quebec
Bluffers Park Yacht Club
Scarborough, Ontario 2369 Kingston Road 416-261-6993
15
127
142
450-500
1.25 days
Most long weekends, especially July & August
75% Ontario (Hamilton to Port Hope, some Kingston) 25% New York (Youngtown to Olcott, some Rochester) <2%Pennsylvania
Highland Yacht Club Scarborough, Ontario Brimley Road South 416-267-0224
12
108
120
350-400
<1 day
Occasionally on holiday weekends
75% Ontario (Hamilton to Cobourg) 25% New York (Olcott to Rochester)
Scarborough Bluffs Sailing Club
Scarborough, Ontario Brimley Road South 416-264-2692
4 reciprocal
4
<150
<1 day
70% Ontario (Oakville to Cobourg) 30% New York (Olcott to Rochester)

Recreational Boating Feasibility and Capacity Study – Phase 1 Final Report June 2014
TOURISTICS + Shoreplan Engineering Limited 119
EXHIBIT 31B MARINAS WITHIN 21 TO 40 NAUTICAL MILES OF BRONTE HARBOUR (Continued) Marina Location Transient
Slips Seasonal Slips
Total Slips
Number Occupied
Number of Transient Boats
Average Length of Stay
Turn Away Transient Business
Transient Market Mix
Cathedral Bluffs Yacht Club
Scarborough, Ontario Brimley Road South 416-261-0537
15
335
350
400
1 day
Some long weekends in July & August
70% Ontario (Hamilton to Kingston) 30% New York (Rochester and close by)
Wharf Street Marina Pickering, Ontario 1289 Wharf Street 905-839-3681
2
2
<100
<1 day
85% Ontario 15% New York
Frenchman’s Bay Yacht Club
Pickering, Ontario 635 Breezy Drive 905-831-7899
6 reciprocal
84
90
300
<1 day
Some long weekends in July & August
70% Ontario (Hamilton to Port Hope) 30% New York (Rochester to Wilson)
East Shore Marina Pickering, Ontario 1295 Wharf Street 905-839-5036
50
300
350
3,300-3,400
1 day
Most long weekends, especially in July & August
75% Ontario (Hamilton to Port Hope) 25% New York (Olcott to Rochester)
Pickering Yacht Club Pickering, Ontario 1295 Wharf Street 905-839-7804
2 reciprocal
18
20
100
<1 day
Victoria, Memorial, July 1st to 4th long weekends
85% Ontario (Hamilton to Cobourg) 15% New York (Olcott to Rochester)
Swans Marina Pickering, Ontario 590 Liverpool Road 905-420-2141
6
64
70
200-250
1 day
Only on long weekends
85% Ontario (Hamilton to Port Hope) 15% New York (Olcott to Rochester)
Port Dalhousie Pier Marina
St. Catharines, Ontario 80 Lighthouse Road 905-646-5515
20
445
465
>500
1.25 days
Victoria, Memorial, July 1st to 4th, Civic Holiday weekends
80% Ontario (Mississauga to Niagara-on-the-Lake) 20% New York (Youngstown to Rochester) <1% Pennsylvania
Port Dalhousie Yacht Club
St. Catharines, Ontario 74 Lighthouse Road 905-934-8325
10
90
100
300
1 day
Occasionally on long weekends in July & August
85% Ontario (Oakville to Niagara-on-the-Lake) 15% New York (Youngstown to Olcott)

Recreational Boating Feasibility and Capacity Study – Phase 1 Final Report June 2014
TOURISTICS + Shoreplan Engineering Limited 120
EXHIBIT 31B MARINAS WITHIN 21 TO 40 NAUTICAL MILES OF BRONTE HARBOUR (Continued) Marina Location Transient
Slips Seasonal Slips
Total Slips
Number Occupied
Number of Transient Boats
Average Length of Stay
Turn Away Transient Business
Transient Market Mix
St. Catharines Marina St. Catharines, Ontario 200 Broadway Avenue 905-935-5522
20
160
180
600-700
1 day
Some long weekends in boating season
85% Ontario (Oakville to Niagara-on-the-Lake) 15% New York (Youngstown to Point Breeze)
Niagara-on-the-Lake Sailing Club
Niagara-on-the-Lake, Ontario 10 Melville Street 905-468-3966
10
170
180
400-450
1.5 days
Victoria, Memorial, July 1st to 4th, Civic Holiday weekends
70% Ontario (Port Dalhousie to Oakville) 30% New York (Youngstown to Olcott)
Lewiston Landing Marina
Lewiston, New York 115 South Water Street 716-754-8206
3
27
30
150
1 day
Occasionally on long weekends in May & July
85% New York (Olcott to Lewiston & lower Niagara River) 15% Ontario (Port Dalhousie to Niagara-on-the-Lake)
Youngstown Yacht Club
Youngstown, New York 491 Water Street 716-745-7230 ext. 302
5
195 +150 moorings
200
350
1.25 days
Memorial Day, July 4th weekend, some weekends in August
75% New York (Olcott to Youngstown & lower Niagara River) 25% Ontario (Niagara-on-the-Lake to Fifty Point)
Williams Marine Youngstown, New York 555 Water Street 716-745-7000
2
68 +30 moorings
70
300
1 day
Most long weekends in boating season
80% New York (Olcott to Lewiston) 20% Ontario (Niagara-on-the-Lake to Port Dalhousie)
Youngstown Village Docks
489 Water Street Youngstown, New York
3
3
1,000
1.25 days
Every long weekend in boating season
75% New York (Point Breeze to Youngstown & lower Niagara River) 25% Ontario (Whitby to Niagara-on-the Lake)
Sunset Bay Marina Wilson, New York Beccue Island 716-751-9691
6
54
60
200-250
<1 day
Memorial Day, July 4th weekend, some weekends in August
80% New York (Olcott to Youngstown & lower Niagara River) 20% Ontario (Niagara-on-the-Lake to Grimsby)

Recreational Boating Feasibility and Capacity Study – Phase 1 Final Report June 2014
TOURISTICS + Shoreplan Engineering Limited 121
EXHIBIT 31B MARINAS WITHIN 21 TO 40 NAUTICAL MILES OF BRONTE HARBOUR (Continued) Marina Location Transient
Slips Seasonal Slips
Total Slips
Number Occupied
Number of Transient Boats
Average Length of Stay
Turn Away Transient Business
Transient Market Mix
Moyer’s Marina Wilson, New York 1 Bayview Circle 716-751-6684
2
50
52
100
1 day
Memorial Day, July 4th weekend, 1st weekend in September
80% New York (Olcott to Youngstown & lower Niagara River) 20% Ontario (Niagara-on-the-Lake to Port Dalhousie)
Wilson Boatyard & Marina
Wilson, New York 57 Harbor Street 716-751-9202
4
70
74
150
<1 day
Memorial Day and July 4th weekend if weather good
80% New York (Olcott to Youngstown & lower Niagara River) 20% Ontario (Niagara-on-the-Lake to Fifty Point)
Wilson Yacht Club Wilson, New York Treasure Island 716-751-6063
2
58
60
<150
1.25 days
Memorial Day, July 4th weekend, 1st weekend in September
90% New York (Rochester to Youngstown & lower Niagara River) 10% Ontario (Niagara-on-the-Lake Grimsby)
Tuscarora Yacht Club Wilson, New York Mainland Road 716-751-0826
5
35
40
200
1 day
Most long weekends in boating season
80% New York (Olcott to Youngstown & lower Niagara River) 20% Ontario (Niagara-on-the-Lake to Grimsby)
Tuscarora State Park Wilson, New York 3371 Lake Road 716-751-6361
8
8
250-300
1 day
Memorial Day, July 4th weekend, 1st weekend in September
90% New York (Olcott to Youngstown & lower Niagara River) 10% Ontario (Niagara-on-the-Lake to Port Dalhousie)
Note: 5,268 seasonal slips were occupied during the 2013 boating season. The occupancy numbers for each individual marina within 21 to 40 nautical miles of Bronte Harbour have been removed from the EXHIBIT to protect the confidence in which they were given.

Recreational Boating Feasibility and Capacity Study – Phase 1 Final Report June 2014
TOURISTICS + Shoreplan Engineering Limited 122
EXHIBIT 31C MARINAS WITHIN 41 TO 60 NAUTICAL MILES OF BRONTE HARBOUR Marina Location Transient
Slips Seasonal Slips
Total Slips
Number Occupied
Number of Transient Boats
Average Length of Stay
Turn Away Transient Business
Transient Market Mix
Port Whitby Marina Whitby, Ontario 301 Watson Street 905-668-1900
25
395
420
2,200-2,300
1 day
July 1st & Civic Holiday weekends, occasionally Labour Day weekend
80% Ontario (Oakville to Trenton) 20% New York (Olcott to Rochester area)
Whitby Yacht Club Whitby, Ontario 701 Gordon Street 905-668-1391
5
245
250
800-850
1 day
Victoria Day, July 1st to 4th, Civic Holiday weekends
80% Ontario (Mississauga to Port Hope) 20% New York (Youngstown to Olcott)
Wiggers Custom Yachts
Bowmanville, Ontario 125 Port Darlington Road 905-623-5261
15
15
450
<1 day
Some long weekends
90% Ontario (Belleville to Oakville) 10% New York (Olcott to Youngstown, some Rochester)
Port Darlington Marina Bowmanville, Ontario Port Darlington Road 905-623-3501
20
100
120
1,200-1,400
<1 day
Victoria Day, July 1st & Civic Holiday weekends Small waiting list for seasonal slips
75% Ontario (Belleville to Burlington) 25% New York (Mainly Rochester area)
Port of Newcastle Marina
Newcastle, Ontario 377 Baldwin Street 905-987-9871
50
210
260
2,000
<1 day
Usually on holiday weekends in July & August
75% Ontario (Belleviile to Oakville) 25% New York (Olcott to Rochester) <1 Quebec
Olcott Yacht Club Olcott, New York 33 Bayview Circle 716-778-5915
30
30
Small waiting list for seasonal slips
Hedley Boat Company Olcott, New York 5835 Ontario Street 716-778-7771
20
20
40
600
1 day
Memorial Day, July 4th long weekend
75% New York (Youngstown to Rochester) 25% Ontario (Fifty Point to Niagara-on-the-Lake)
Town of Newfane Marina
Olcott, New York 5818 West Main Street 716-778-5462
35
35
1,250-1,300
1 day
Memorial Day, July 4th weekend, some weekends in August
80% New York (Youngstown to Point Breeze) 20% Ontario (Grimsby to Niagara-on-the-Lake)

Recreational Boating Feasibility and Capacity Study – Phase 1 Final Report June 2014
TOURISTICS + Shoreplan Engineering Limited 123
EXHIBIT 31C MARINAS WITHIN 41 TO 60 NAUTICAL MILES OF BRONTE HARBOUR (Continued) Marina Location Transient
Slips Seasonal Slips
Total Slips
Number Occupied
Number of Transient Boats
Average Length of Stay
Turn Away Transient Business
Transient Market Mix
Time-Out Sports Bar and Grill
Olcott, New York 5852 East Main Street 716-778-5890
20
20
500
<1 day
Occasionally on long holiday weekends
90% New York (Youngstown to Point Breeze) 10% Ontario (Port Dalhousie to Niagara-on-the-Lake)
Note: 968 seasonal slips were occupied during the 2013 boating season. The occupancy numbers for each individual marina within 41 to 60 nautical miles of Bronte Harbour have been removed from the EXHIBIT to protect the confidence in which they were given.

Recreational Boating Feasibility and Capacity Study – Phase 1 Final Report June 2014
TOURISTICS + Shoreplan Engineering Limited 124
EXHIBIT 31D MARINAS WITHIN 61 TO 80 NAUTICAL MILES OF BRONTE HARBOUR Marina Location Transient
Slips Seasonal Slips
Total Slips
Number Occupied
Number of Transient Boats
Average Length of Stay
Turn Away Transient Business
Transient Market Mix
Port Hope Yacht Club 40 moorings
40 <100 1 day Occasionally on long holiday weekends
95% Ontario (Picton to Whitby) 5% New York (Oak Orchard to Brockport)
Town of Cobourg Marina
Cobourg, Ontario 55 King Street West 905-372-2397
30
167
197
3,500-4,000
1 day
Victoria Day, July 1st to 4th, Civic Holiday weekends >175 on waiting list
85% Ontario (Picton to Toronto 15% New York (Chaumont Bay to North Pond)
Cobourg Yacht Club Cobourg, Ontario 55 King Street West 905-372-3098
50
50
125-150
1 day
Victoria Day, July 1st to 4th, Civic Holiday weekends
85% Ontario (Picton to Toronto 15% New York (Chaumont Bay to North Pond)
Four C’s Marina Kent, New York 988 Point Breeze Road 585-682-4224
6
44
50
200
1 day
Memorial Day, July 1st to 4th weekends
75% New York (Youngstown to Rochester & lower Niagara River) 25% Ontario (Fifty Point to Niagara-on-the-Lake)
Lake Breeze Marina Kent, New York 990 Point Breeze Road 585-682-3995
4
42
46
150
1 day
Memorial Day, July 1st to 4th weekends, Labor Day weekend
80% New York (lower Niagara River & Youngstown to Rochester) 20% Ontario (Port Dalhousie to Niagara-on-the-Lake)
Oak Orchard Yacht Club
Kent, New York 1103 Archbald Road 585-682-9793
4 reciprocal
196
200
<150
1 day
Only on long weekends in May & July
80% New York (lower Niagara River & Youngstown to Rochester) 20% Ontario (Port Dalhousie to Niagara-on-the-Lake)
Orleans County Marine Park
Carlton, New York Route 98 585-589-3103
15
57
72
500
1.25 days
Holiday weekends, Memorial Day & July 4th
75% New York (Olcott to Sodus Bay) 25% Ontario (Hamilton to Niagara-on-the-Lake)

Recreational Boating Feasibility and Capacity Study – Phase 1 Final Report June 2014
TOURISTICS + Shoreplan Engineering Limited 125
EXHIBIT 31D MARINAS WITHIN 61 TO 80 NAUTICAL MILES OF BRONTE HARBOUR (Continued) Marina Location Transient
Slips Seasonal Slips
Total Slips
Number Occupied
Number of Transient Boats
Average Length of Stay
Turn Away Transient Business
Transient Market Mix
Brockport Yacht Club Hamlin, New York 7493 Sandy Harbor 585-964-5239
3 reciprocal
84
87
100
1.25 days
Memorial Day, July 4th weekend, Labor Day weekend
80% New York (Youngstown to Sodus Bay) 20% Ontario (Mississauga to Port Dalhousie)
Eagle Creek Marina Kendall, New York 1033 Lakeland Beach Road 585-659-8603
50
118
168
2,000
1.25 days
Memorial Day, July 4th weekend
75% New York (Youngstown to Oswego) 25% Ontario (Hamilton to Port Dalhousie)
Note: 741 seasonal slips were occupied during the 2013 boating season. The occupancy numbers for each individual marina within 60 to 81 nautical miles of Bronte Harbour have been removed from the EXHIBIT to protect the confidence in which they were given.

Recreational Boating Feasibility and Capacity Study – Phase 1 Final Report June 2014
TOURISTICS + Shoreplan Engineering Limited 126
EXHIBIT 32 NUMBER OF SEASONAL AND TRANSIENT SLIPS WITHIN TRANSIENT MARKET AREA OF HALTON REGION BOATING FACILITIES
Market Area Number of Seasonal Slips Number of Occupied Slips in 2013 Boating Season
Within 20 nautical miles 4,786 4,709 21 to 40 nautical miles 5,419 5,268 41 to 60 nautical miles 1,000 968 61 to 80 nautical miles 798 741 Total 12,003 11,686 Source: EXHIBIT 31 and TOURISTICS interviews with marina owner/operators and yacht club Commodores, 2013. EXHIBIT 33 NUMBER OF POWER AND SAIL BOATS WITHIN TRANSIENT MARKET AREA OF HALTON REGION BOATING FACILITIES1
Market Area Power Boats Sailboats Within 20 nautical miles 2,579 2,130 21 to 40 nautical miles 2,885 2,383 41 to 60 nautical miles 387 581 61 to 80 nautical miles 452 289
Total 6,303 5,383 1Does not include boats currently stored away from marinas and using launch ramps to enter lakes in market area Source: EXHIBIT 31 and TOURISTICS interviews with marina owner/operators and yacht club Commodores, 2013. EXHIBIT 34 POTENTIAL TRANSIENT BOATS WITHIN MARKET AREA OF HALTON REGION BOATING FACILITIES IN 2013
Market Area Number of Boats1 Number of Boater Days Away from Home Marina2
Ontario New York
Within 20 nautical miles 4,709 37,880 Within 21 to 40 nautical miles 4,593 675 14,340 Within 41 to 60 nautical miles 929 39 1,330 Within 61 to 80 nautical miles 242 499 640
Total 10,473 1,213 54,190 1EXHIBIT 31 and 32 2EXHIBIT 29, 30 and 33 3Reduced by 4 percent to account for bad weather days

Recreational Boating Feasibility and Capacity Study – Phase 1 Final Report June 2014
TOURISTICS + Shoreplan Engineering Limited 127
EXHIBIT 35 PROJECTED NUMBER OF BOATS WITHIN 80 NAUTICAL MILES OF HALTON REGION FACILITIES 2013 TO 2031
Market Area in Nautical
Miles
Historical Projected Number of Boats in Market Area1 20132
Number of Occupied
Slips
2014 2015 2016 2017 2018 2019 2020 2021 2022
0 to 20 4,709 4,830 4,950 5,070 5,200 5,310 5,420 5,530 5,650 5,770 21 to 40 5,268 5,390 5,520 5,650 5,790 5,900 6,020 6,140 6,270 6,400 41 to 60 968 990 1,010 1,030 1,060 1,080 1,100 1,120 1,140 1,160 61 to 80 741 750 760 770 780 790 800 810 820 830 Total 11,686 11,960 12,240 12,520 12,830 13,080 13,340 13,600 13,880 14,160
Projected Number of Boats in Market Area1 2023 2024 2025 2026 2027 2028 2029 2030 2031 0 to 20 5,870 5,970 6,070 6,180 6,290 6,380 6,480 6,580 6,680 21 to 40 6,490 6,590 6,690 6,790 6,900 6,990 7,080 7,180 7,280 41 to 60 1,180 1,200 1,220 1,240 1,260 1,280 1,300 1,320 1,340 61 to 80 840 850 860 870 880 890 900 910 920 Total 14,380 14,610 14,840 15,080 15,330 15,540 15,760 15,990 16,220 Notes: 1Based on projected annual growth of boats in Ontario and New York >6 metres in length, EXHIBIT 19 and 23 Adjusted to account for average number of boats out of service, or retired from the fleet each year 2EXHIBIT 31

Recreational Boating Feasibility and Capacity Study – Phase 1 Final Report June 2014
TOURISTICS + Shoreplan Engineering Limited 128
EXHIBIT 36 PROJECTED NUMBER OF TRANSIENT BOATERS WITHIN 80 NAUTICAL MILES OF HALTON REGION FACILITIES 2013 TO 2031
Market Area in Nautical
Miles
Historical Projected Number of Boater Days in Market Area1
2013 2014 2015 2016 2017 2018 2019 2020 2021 2022
0 to 20 37,880 38,660 39,470 40,300 41,160 41,870 42,600 43,350 44,130 44,930 21 to 40 14,340 14,640 14,950 15,270 15,600 15,870 16,150 16,430 16,720 17,020 41 to 60 1,330 1,360 1,390 1,420 1,450 1,470 1,500 1,530 1,560 1,590 61 to 80 640 650 660 670 680 690 700 710 720 730 Total 54,190 55,310 56,470 57,660 58,890 59,900 60,950 62,020 63,130 64,270
Projected Number of Boater Days in Market Area1 2023 2024 2025 2026 2027 2028 2029 2030 2031 0 to 20 45,560 46,210 46,880 47,570 48,280 48,900 49,530 50,180 50,840 21 to 40 17,260 17,510 17,770 18,030 18,300 18,530 18,770 19,020 19,270 41 to 60 1,610 1,630 1,650 1,670 1,690 1,710 1,730 1,750 1,770 61 to 80 740 750 760 770 780 790 800 810 820 Total 65,170 66,100 67,060 68,040 69,050 69,930 70,830 71,760 72,700 Based on EXHIBIT 29, 30, 32, 33; adjusted to account for average number of boats out of service, or retired from the fleet each year; and reduced by 4 percent to account for bad weather days

Recreational Boating Feasibility and Capacity Study – Phase 1 Final Report June 2014
TOURISTICS + Shoreplan Engineering Limited 129
EXHIBIT 37 ESTIMATED NUMBER OF BOATS IN HALTON REGION LIKELY TO USE A LAUNCH RAMP FOR THEIR BOATING ACTIVITY
Year Number of Boats Less than 6 metres (20 feet)
Number of Boats 6 metres to less than 9
metres (20 feet to less 30 feet)
Total Number of Boats Likely to Use a Launch
Ramp
2012 13,616 493 14,109 2013 13,790 510 14,300 2014 13,990 520 14,510 2015 14,180 530 14,710 2016 14,380 540 14,920 2017 14,640 560 15,200 2018 14,870 570 15,440 2019 15,100 580 15,680 2020 15,330 600 15,930 2021 15,570 610 16,180 2022 15,740 620 16,360 2023 15,850 620 16,470 2024 16,050 630 16,680 2025 16,260 640 16,900 2026 16,470 650 17,120 2027 16,610 660 17,270 2028 16,710 660 17,370 2029 16,850 670 17,520 2030 17,000 680 17,680 2031 17,200 690 17,890
Source: EXHIBITS 12 and 19, and TOURISTICS interviews with marina owner/operators, 2013 Note: Boats that are trailered to launch ramps are typically less than 8 metres (26 feet); 20% of boats 6 to less than 8 metres (i.e. 20 feet to less than 26 feet) and 2% of boats 8 metres to less than 9 metres (i.e. 26 feet to less than 30 feet) are trailered to launch ramps on a per use basis. Launch ramp use is usually concentrated during a three-hour launch period (morning) and three-hour retrieval period (afternoon). The Bronte Beach launch ramp, and Oakville Shipyard Park launch ramp had 2,200 users in 2013. The two launch ramps in Burlington are free of charge and not monitored for use.