i the use of real-time ultrasound to estimate variance components
TRANSCRIPT

i
The use of real-time ultrasound to estimate variance components for growth and carcass traits in Nelore cattle
By
FABIANO RODRIGUES DA CUNHA ARAUJO
B.S. Veterinary Medicine, Universidade Federal de Uberlândia – BRAZIL (1994)
THESIS
Submitted in partial satisfaction of the requirements for the degree of
MASTER OF SCIENCE
in
Animal Science
in the
OFFICE OF GRADUATE STUDIES
of the
UNIVERSITY OF CALIFORNIA
DAVIS
Approved:
Committee in Charge
2003

ii
ACKNOWLEDGMENTS
It is important to get more professional and personal experiences in life, and it
becomes very satisfactory when the people involved are highly committed. During this
period I had the opportunity to work with a marvelous team that were all involved in this
research project, rather life project, for the importance it has and will have in my life and
career. I would first like to thank my major professor, Dr. Sainz, who was tremendously
involved in my entire program, in lectures, in the field and in my personal experiences. I
express my admiration for his dedication in supporting us during the whole teaching
process, which was fundamental in my life experiences. I gratefully acknowledge my
professors Dr. Famula and Dr. Oltjen in their personal support in this project, especially
for their assistance in the data analysis process. I also thank my teachers in Iowa (Dr.
Doyle Wilson and Dr. Gene Rouse, and J. R. Tait and Mike Anderson) and in New York
(Dr. Jim Stouffer), for all their help and friendship.
I would like to say thanks to my family, especially my father, Newton, my
mother, Maria Carmelita, and my sister Maristela (in memoriam) and my brothers
Marcelo and Fernando for all their uninterrupted love and support, trusting in my
dedication and potential to be a better professional.
I would like to express my gratitude for the financial support given by the Andrew
Christensen Scholarship and the University of California at Davis, without which it
would have been impossible to complete the program. I would like to thank the Guaporé
Pecuária, who provided the animals and supported data collection, Claudio Magnabosco
who inititated the work in the first place, and Carina Ubirajara for assistance with data
analyses. Thanks are also due to GEMAC-FMRP/USP and their technical staff, who

iii
contributed to and supported this research. Last but not least, I would like to say thanks to
all my friends that supported me, especially Pancho, Pilar and Nuria that became my
family during all this period at Davis.
I really appreciate all of you.

iv
TABLE OF CONTENTS
Page
Title page i
Acknowledgments ii
Table of contents iv
List of tables vi
List of figures viii
Chapter 1: Background and justification
Beef cattle production in Brazil 1
Consumer demand 4
Beef carcass quality 6
United States carcass grading System 8
Brazilian carcass grading System 12
Meat quality characteristics 15
Tenderness 15
Flavor 16
Juiciness 17
Lean tissue color 17
Fat thickness 18
Fat Color 18
Percentage of intramuscular fat 19
Percentage of retail product 19
Genetic influences on carcass quality 20

v
Application of Real-Time Ultrasound to genetic improvement programs 20
Overall goal 21
Chapter 2: The use of ultrasound to evaluate growth and carcass quality in Nelore cattle
Introduction 23
Materials and methods 24
Results and discussion 28
Conclusions and application 37
Chapter 3: Variance components for carcass traits in Zebu cattle
Introduction 39
Materials and methods 40
Results and discussion 42
Conclusions and application 45
Chapter 4: Conclusions and implications 47
References 50

vi
LIST OF TABLES
Page
Table 1.1 – Land utilization in Brazil 1
Table 1.2 - Production efficiency of beef cattle in Brazil 3
Table 1.3 - Global meat prices 5
Table 1.4 - Correlation between Yield Grade and percent of retail product for primal cuts 10
Table 1.5 - Age of eruption of permanent teeth in beef cattle 13
Table 1.6 - Brazilian beef carcass grading system 14
Table 2.1 - Summary statistics for live-scan ultrasound data 28
Table 2.2 - Type 3 tests of fixed effects for body weight 29
Table 2.3 - Type 3 tests of fixed effects for longissimus muscle area 30
Table 2.4 - Type 3 tests of fixed effects for back fat 30
Table 2.5 - Type 3 tests of fixed effects for rump fat 31
Table 2.6 - Least square means for body weight 31
Table 2.7 - Least square means for longissimus muscle area (cm2) 32
Table 2.8 - Least square means for back fat (mm) 33
Table 2.9 - Least square mean for rump fat (mm) 33
Table 2.10-Type 3 tests for fixed effects and differences in slopes of body weight vs. age 34
Table 2.11 - Type 3 tests for fixed effects and differences in slopes of longissimus muscle area vs. age 34
Table 2.12- Type 3 tests for fixed effects and differences in slopes of Back Fat vs. age 35
Table 2.13-Type 3 tests for fixed effects and differences in slopes of Rump Fat vs. age 35
Table 2.14 - Repeatability coefficients for body weight and ultrasound carcass measurements in Nelore cattle 37

vii
Table 3.1 - Summary statistics for live-scan ultrasound data 42
Table 3.2 - Heritabilities (h2) estimates and genetic correlation for carcass traits in Nelore Cattle 43
Table 3.3 - Means, standard deviations and minimum and maximum Expected Progeny Difference (EPD) and accuracies (ACC) for carcass traits in Nelore cattle
45

viii
LIST OF FIGURES
Page
Figure 1.1 - World stocks of cattle 2
Figure 1.2 - Production efficiency of beef cattle in Brazil 3
Figure 1.3 - Methods for measurement of fat thickness and longissimus muscle area between the 12th and 13th ribs 9
Figure 1.4 - USDA marbling classes for beef 11
Figure 1.5 - USDA Quality Grade system for different degrees of marbling and maturities 12

1
Chapter 1: Background and Justification
Beef cattle production in Brazil
Brazil is a vast country with an area of 8,514,876 km2 (IBGE, 2003), and diverse
environmental conditions. The predominant ecosystems are tropical savannahs
characterized by two distinct seasons, rainy and dry. During the rainy season (October –
May) the weather is hot and humid with temperatures between 20º and 45ºC and relative
humidity around 80 – 85 % (INMET, 2003). During the dry season the temperature is
around 10º and 20ºC and the humidity around 40 – 50 % (INMET, 2003). The total
human population is 169,872,856 (IBGE, 2003).
Table 1.1 – Land utilization in Brazil
Description Area – millions of hectares %
Amazon rain forest 350 41.2
Pasture 220 25.9
Cerrado (tropical savannahs) 151 17.9
Legal reserves 55 5.9
Crop 50 5.8
Urban centers, roads and lakes 20 2.5
Reforestation 5 0.8
TOTAL 851 100
Source: Pineda et al. (2002)
Brazil has the largest commercial cattle herd in the world with 175 million head
(FAO, 2003). The most important genotype in Brazil is Bos indicus (Zebu) cattle
represented by 8 breeds (Nelore, Guzerá, Tabapuã, Brahman, Gir, Indubrasil, Sindhi and
Cangaian). They are characterized by adaptation to tropical conditions where hot

2
temperatures and low pasture quality make the environment too harsh to raise Bos taurus
cattle. The Nelore breed represents around 80% of Bos indicus cattle in Brazil.
Globally, livestock production accounts for more than 40 % of the gross value of
agricultural production (FAO, 2003). Brazil has the largest commercial herd (Figure 1.1)
in the world but productive indices and quality standards are relatively low.
0
50
100
150
200
250
20022001200019991998
Year
No.
of h
ead
(Mill
ion)
.
India Brazil United States of America China European Union (12) Australia
Figure 1.1 - World stocks of cattle
The Brazilian herd size increased at a rate of 1.84 % each year from 1993 to 2003
(Anualpec, 2003) but still needs to improve its harvest (turnoff) percentage (Figure 1.2).
Some variables have been helpful in this process. The increased use of mineral
supplementation, development of effective herd health programs, implementation of
rotational grazing management and investments in soil fertility are some factors

3
responsible for these results. Currently around 65 % of all Brazilian herds are receiving
mineral supplementation and it is expected to be 80 % in 2012 (ANUALPEC, 2003).
Table 1.2 - Production efficiency of beef cattle in Brazil
Year% of
Harvest Year% of
Harvest 1983 17.1 1994 21.0 1984 17.2 1995 23.9 1985 17.3 1996 24.0 1986 17.6 1997 22.3 1987 19.0 1998 22.2 1988 19.6 1999 22.1 1989 19.4 2000 21.9 1990 19.3 2001 22.1 1991 20.3 2002 22.6 1992 21.5 2003 24.2 1993 21.5
15
17
19
21
23
25
27
29
1983
1985
1987
1989
1991
1993
1995
1997
1999
2001
2003
Year
% o
f Har
vest
Figure 1.2 - Production efficiency of beef cattle in Brazil

4
Brazilian cattle breeders are faced with the challenges of producing beef to satisfy
consumer demands for quantity and quality, using abundant, low-cost pasture systems,
raising cattle that are productive and profitable under these environmental conditions.
Also, the competition with other meats makes this project as one of the most important in
the next generation. In particular, the poultry and swine industries are making rapid
progress toward high quality standards at very competitive prices. Until now, the
Brazilian breed associations have developed their genetic selection programs focusing on
growth performance, milk production and fertility. None of the breeds has a program to
improve carcass quality. However, in order to incorporate carcass traits in a genetic
evaluation scheme and to design an appropriate breeding program all the breed-specific
parameters must be established.
Consumer demand
It is well known that demand reflects the interest of consumer in buying a specific
product. This demand depends upon a number of factors, including nutrition, food safety,
culture, education, marketing, lifestyle, convenience, income, prices and other factors
such as geography and logistics of distribution.
Global meat prices declined in 2002 in response to the decrease in the meat
consumption due to food safety problems that happened during this period. Foot and
mouth disease and Bovine Spongiform Encephalopathy (BSE) outbreaks were the most
important diseases that impacted meat prices during 2002. In order to meet international
safety protocols Brazilian producers are adopting a national traceability program,
SISBOV. It was established especially to attend European Union market demands but

5
also it is helpful in many management programs. It is expected, in 2003, to have 1.17
million head in this program (Anualpec, 2003) collecting all information needed for
strategic improvements in order to achieve higher quality standards for the beef market.
Table 1.3 - Global meat prices
Meat International Indicative Prices
International Meat Price Index
(FAO) Chicken1 Swine2 Beef 3 Lamb4
(1990-92=100) (US$/ton) 1994 102 921 2,659 2,384 2,975 1995 99 922 2,470 1,947 2,621 1996 96 978 2,733 1,741 3,295 1997 96 843 2,724 1,880 3,393 1998 83 760 2,121 1,754 2,750 1999 84 602 2,073 1,894 2,610 2000 85 592 2,083 1,957 2,619 2001 84 645 2,077 2,138 2,912 2002 83 602a 1,883a 2257b 3,208b
Source: Beefpoint, 2003;FAO, 2002. 1.Chicken units (American unit for exportation) 2. Frozen pork (American unit for exportation) 3. Manufactured Beef carcass 4. Hole Frozen Lamb carcass a. January through August 2002. b. January through July 2002.
However, the International Food Policy Research Institute of Washington, DC
projected an increase of 55 % in world demand for animal products between 1997 and
2020 (Rosegrant et al., 2001). The world’s appetite for meat is projected to jump
enormously with China accounting for more than 40 % of this increase. The developing
countries alone will increase 70 millions of tons of their meat demand form 2002 to 2020
(Anualpec, 2003). The world’s population is expected to grow from 6 billion people in
2000 to 7.5 billion people in 2020 (Rosegrant et al., 2001). The population growth in

6
Asian countries, especially China, coupled with increases in their exchange rate relative
to the US dollar will enhance meat consumption. In the last four years China’s economy
has grown 7 to 8 %/year and India, South Korea and other Asian countries have grown 5
to 6 %/year (Anualpec, 2003). Availability of land for farming is declining, and water for
agriculture and other forces will challenge the capacity of the world’s food production
system.
In the last three years the international demand for beef has been growing around
300 and 400 thousand tons per year and the same growth rate is expected in the next 10
years (Anualpec, 2003). These authors also project an increase in Brazilian beef
exportation around 170 % and 250 % in volume and price, respectively (Anualpec, 2003).
Brazilian beef producers will need to improve their product quality in order to conform to
international standards.
In order to understand consumer demand it is also important to study long-term
forces such as income growth, population growth and educational changes. Therefore,
strategic investments in research, new technologies, irrigation and logistics of distribution
can contribute to achieve equilibrium between supply and demand. All of this will require
more enlightened policies and substantial investments as cited above.
Beef carcass quality
Carcass quality represents one of the most important factors to define carcass
value and its consistent and accurate determination is essential to the smooth functioning
of the beef market. We can distinguish two major characteristics: retail product yield,

7
and eating quality grade of the meat. Retail yield impacts directly upon income to
producers and packers because it reflects the quantity of saleable meat in the whole
carcass. Eating quality is more complex, being subject to a number of factors related to
color, marbling, tenderness, juiciness and flavor, yet it has an important impact for all
beef industry segments from producers to consumers.
Retail product yield is based on the total amount of muscle in comparison with fat
and bone. The allometry of growth is characterized primarily by early bone development,
then muscle growth and finally fat deposition. The allometry of growth can change based
on genotype, sex, implant and nutrition programs, and all of these factors can affect the
yield of meat.
Eating quality is affected by many characteristics as well. These factors are color,
tenderness, juiciness and flavor. Tenderness is considered one of the most important
factors in meat acceptability (Sainz et al. 2001). Tenderness is higher in young animals
and tends to be lower in older animals because of the increase in connective tissue
between the muscle fibers. Also, myofiber degradation tends to be lower in old animals
during the post-mortem ageing process (Sainz et al., 2001). Juiciness also has an
influence on meat palatability and it is related to fat deposition, specially marbling. All
these characteristics are influenced by the same factors that affect the yield grade:
genotype, age, sex, age, nutrition and use of hormones.
The importance of carcass traits to the beef industry is increasing, especially with
the introduction of more detailed carcass specification systems and the payment of
premiums for products satisfying the requirement and expectations of specific markets.
Beef carcass quality premiums in the US have been based on yield and quality grades

8
affected by the portion of muscle, fat and bone present (Herring et al., 1994; Tait et al.
2001). Brazilian cattle breeders are faced with the challenge to market their carcasses
wheras government agents are responsible only for sanitary control. A packing plant
employee grades the carcasses although some certified beef brands also have an agent
present to check this process.
United States Carcass Grade System (USDA)
In 1916, the US Congress passed a law establishing the National Livestock
Market News Service (Harris et al, 2001), originally created to facilitate accurate market
reporting. Primarily it concerned only Quality Grade; Cutability Grades were added in
1969, and renamed as Yield Grades in 1973. The version for the USDA carcass grading
system which is currently used was last revised in January 1997.
The Quality and Yield Grades contained in the US Department of Agriculture
(USDA) system are used to segregate carcasses of different qualities into different
classes. The Yield Grade represents the total of retail product and is expressed in grades
from 1 to 5, higher to lower respectively. In order to determine this classification, a
longitudinal cut is made to split the carcass in two halves, left and right sides. A
transversal cut is then made between the 12th and 13th ribs, to separate the carcass halves
into front and hind quarters. This exposes the longissimus dorsi (ribeye) muscle, allowing
the grader to estimate the ribeye area and thickness of subcutaneous (back) fat (Figure 1).
Finally, the kidney, pelvic and heart (KPH) fat is estimated as a percentage of carcass
weight. These measurements plus hot carcass weight are included in the calculation of
Yield Grade:

9
Yield Grade = 2.50
+ (2.5 × Adj. fat thickness, in.)
+ (0.2 × Kidney, pelvic, and heart fat, %)
+ (0.0038 × Hot carcass wt., lb.)
– (0.32 × Ribeye area, sq. in.)
Figure 1.3 - Methods for measurements of fat thickness and ribeye area between
12th and 13th rib
The correlation between Yield Grade and four primal beef cuts (Chuck, Rib, Loin
and Round) are presented in Table 1.4. Even though these cuts represent only 80 % of the
total retail product, they represent 95 % of the carcass value therefore are used as an
economic yield index.

10
Table 1.4 - Correlation between Yield Grade and percent of retail product for
primal cuts1
Yield grade % yield of primal cuts 1 52.6 - 54.6 2 50.3 - 52.3 3 48.0 - 50.0 4 45.7 - 47.7 5 43.3 - 45.4
1Primal cuts: rump, loin, rib and chuck.
Source: AMSA, 2001.
The Quality Grade classification is mainly dependent on skeletal maturity and
degree of marbling. Moreover, carcasses from intact bulls are disqualified from the better
grades. In the sex classification, males can be classified as steers, bullocks and bulls.
Females are separated just into heifers and cows. The maturity classes are: A (9 to 30
months), B (30 to 42 moths), C (42 to 72 months), D (72 to 96 months) and E (over 96
months). This classification is done by the size, form and level of bone ossification and
carcass cartilages; the teeth are not evaluated.
Marbling (intramuscular fat) is the major characteristic in the quality grade
classification. Marbling is evaluated visually, accounting for quantity and distribution of
fat in the longissimus dorsi between the 12th and 13th ribs. If necessary, standard USDA
cards are used as a reference for marbling classification to guarantee better accuracy by
USDA graders. Figure 1.4 shows the main marbling classes.

11
Figure 1.4 - USDA marbling classes for beef
Source:AMSA, 2001.
For animals up to 30 months of age (A maturity) without defects (e.g., coarse
texture, discoloration), marbling is the major factor that determines Quality Grade
(Figure 1.5). Carcasses from animals between 30 and 42 months (B maturity) must have
more marbling to be classified as Prime, Choice or Select. Carcasses with C, D or E
maturity are disqualified from these classes and do not receive premiums.

12
Figure 1.5 - USDA Quality Grade system for different degrees of marbling and
maturities
Source: Boggs e Merkel, 1990.
In the United States, where most of the cattle are fed and harvested before 30
months of age, 80 to 90% of carcasses are classified as Choice or Select. An average
difference price of $0.12/lb between these grades encourages US producers to finish their
animals so as to maximize marbling and Quality Grade. At the same time, price grids
impose severe penalties on carcasses with Yield Grades of 4 and 5, so that producers
must avoid getting cattle over-fat. Biologically, maximizing intramuscular fat and
avoiding excess subcutaneous and internal fat is not an easy task.
Brazilian Carcass Grading System (BRASIL)
The Brazilian carcass grading system is called “BRASIL” and was established in
the early 1970’s when a commission was established in order to create the national

13
grading system (Felício, 1999). The grading is done by subjective measurements of
maturity, conformation, fat cover and also sex and hot carcass weight. Maturity is
estimated by evaluation of the permanent teeth as presented in Table 1.5.
Table 1.5 - Age of eruption of permanent teeth in beef cattle (months)
Permanent Approximately age of eruption of permanent teeth
Appearance1 teeth Bos indicus2 Bos taurus3
0 - -
2 20 - 24 18 - 28
4 30 - 36 24 - 31
6 42 - 48 32 - 43
8 52 - 60 36 - 56
Sources: 1Lawrence et al., 2001; 2Corrêa (1996); 3Kirton (1989).
Carcass conformation is subjectively evaluated in five categories: C=convex; Sc =
sub-convex; Re = flat; Sr = sub-flat; Co = concave. In this system the fat cover is also
subjectively evaluated, the quantity of fat, with different scores from 1 to 5: 1 = total
absence of fat; 2 = 1 a 3 mm; 3 = 3 a 6 mm; 4 = 6 a 10 mm; 5 = over 10 mm of fat cover.

14
Hot carcass weight is used in the grading system and in the marketing process as
well. The grading system has some rules regarding minimum weight but no category has
a limit for maximum weight. Together these evaluations comprise the grades using the
letters “BRASIL”, presented in Table 1.6. Some private companies have their own
grading systems and the payment of premiums for carcass quality are still in the initial
stages.
Table 1.6 - Brazilian beef carcass grading system
Class Sex1 Maturity (Permanent
teeth)
Fat Cover2 Carcass confromation3
Minimum carcass weight
(kg) B4 C, F
M 0 – 4
0 2, 3, 4 2,3, 4
C, Sc, Re C, Sc, Re
C=210, F=180 M=210
R C, F 0 – 6 2, 3, 4 C, Sc, Re C=220, F=180 A C, F
M 0 – 6
0 1 and 5 1 and 5
C, Sc, Re, Sr C, Sc, Re, Sr
C=210, F=180 C=210, F=180
S C, F 0 – 8 1 – 5 C, Sc, Re, Sr C=225, F=180 I M, C, F 0 – 8 1 – 5 C, Sc, Re, Sr no restrictions L M, C, F 0 – 8 1 – 5 Co no restrictions 1Sex: C = castrated male; F = female; M = intact male. 2Fat Cover: 1 = total absence of fat; 2 = 1 to 3 mm; 3 = 3 to 6 mm; 4 = 6 to 10 mm; 5 = over 10 mm of fat cover. 3Carcass conformation: C, convex; Sc, sub-convex; Re, flat; Sr, sub-flat; Co, concave. 4The HILTON standard is a B class excluding intact males (M) and fat cover 4. Source: Felício, 1999.

15
Meat quality characteristics
Tenderness
The tenderness of meat is one of the most important factors influencing
palatability. The structural differences among muscles that help determine their
tenderness include their myofibrillar component and the amount of connective tissue. The
most common procedure to objectively evaluate tenderness is the Warner-Braztler shear
force, an objective procedure where the peak force required to shear a cylindrical cooked
core of meat is measured. It is commonly reported in pounds or kilograms. On the other
hand, subjective tenderness can be measured using a trained taste panel or household
consumers that are asked to rate the meat using a hedonic scale. When we compare
values of Warner-Braztler shear force and consumer panels, correlations around 88 %
indicate that both are accurate to determine tenderness (Mc Kenna, 2003).
Factors affecting beef tenderness include the connective tissue component, the
myofibrillar component, and possible cold-shortening. The connective tissue component
affecting tenderness is the amount and solubility of collagen within the muscle. In
addition, specific myofibrillar proteins are degraded during post-mortem ageing of
muscle under chiller conditions and there is evidence that the cysteine proteases, in
particular the calpains, are responsible for this degradation (Hopkins & Thompson, 2000;
Koohmaraie, 1996). In addition, rapid chilling (before rigor mortis), can result in
shortening of the myofibrils, toughening the meat. This is why a minimal amount of fat
cover is essential for maintaining meat quality, as it acts as thermal isolation. The use of
electric stimulation has also been shown to accelerate rigor mortis, preventing cold-

16
shortening and stimulating proteolytic enzyme activity (Riley et al., 2003). Benefits of
electrical stimulation appear to be greater for Brahman or crossbred Brahman beef than
for Bos taurus beef (Riley et al., 2003).
Research done by Shackelford et al. (1995) compared tenderness of ten major
muscles from Bos indicus and Bos taurus cattle showing significant differences in five
muscles when cooked as steaks and four when roasted. Shear force of the longissimus
dorsi muscle was not highly related to shear force of other muscles. Thus, systems that
accurately predict the tenderness of longissimus dorsi of a carcass will likely do little to
predict the tenderness of other muscles.
Reverter et al. (2003), studying tropical breeds in Australia found genetic
correlations of marbling (intramuscular fat) with sensory (consumer) panel tenderness
score) and Warner-Braztler shear force of 0.31 and -0.31 respectively. The cooking
process also has an important influence on the tenderness. Wheeler et al. (1999)
presented results showing small differences in tenderness between Low Select carcasses
and Top Choice carcasses when the consumers cooked the beef well done.
Flavor
Flavor is an important component to define acceptability of any food product.
Especially in meat, it is a very subjective and complex factor. The meat composition
changes by diet, sex, age, and breed and these can have important influences on meat
flavor. The volatile components of lipids within meat are the major contributors to meat
flavor and these can also change during the storage process having a significant influence
on meat flavor. The carbohydrate content of meat can be reduced in the pre-slaughter

17
process; for example stress may increase the intensity of off-flavors in beef, lamb and
pork (Paganini, 2001).
Juiciness
Juiciness is related to the amount of moisture released from the meat during
mastication and to the degree of salivation induced by fat (Paganini, 2001). The water-
holding capacity of meat has a direct effect on shrinkage of meat during storage and
improper storage can make an enormous difference in juiciness. Also during improper
thawing some water crystals can rupture the cellular membrane losing juiciness. Cooking
and processing also has a large influence on the capacity of meat to be juicy. For
example, beef cooked well-done will rarely if ever be juicy. Juiciness is also directly
related with marbling where cuts with more marbling will be juicier.
Lean tissue color
The color of meat is associated with chemical changes in muscle pigments,
primarily myoglobin. The pigment called myoglobin can be found in different forms
(redox states) giving the meat different colors. The heme portion of the pigment is of
special interest because the color of meat is partially dependent on the oxidation state of
the iron within the heme ring. Some factors can cause changes in color such low oxygen
tension, heat, salt, ultraviolet light, low pH and surface dehydration. The animal’s age can
also affect the meat color, due to increasing the myoglobin concentration (Aberle et al.,
2001).

18
Fat thickness at 12th/13th rib
The subcutaneous fat cover is an important trait and has been measured since the
use of A-Mode ultrasound in 1950’s (Stouffer, 1991). The fat thickness is measured
perpendicular to the animal and the measured point is located ¾ of the distance from the
chine (medial) end to the lateral end of the longissimus dorsi muscle. Genetic selection
for this trait can be for increased or decreased fat depth. Increasing fat depth leads to a
decrease in retail yield (Tait el al., 2001). However, most market specifications require a
minimum fat depth. All certified Brazilian beef brands require a minimum of
subcutaneous fat (usually 3 mm) and most of time only around 50 – 60 % of animals
finished on natural pastures can reach this goal and receive their premium benefits. In
other markets such as the US, the selection is for reduced fat thickness and increased
meat yield. Caution should be placed on the selection for extremely low fat EPDs for
replacement heifers as this may indicate females that are more difficult to get in calf.
Fat Color
Some differences in fat color may be observed in animals finished under different
conditions. Reverter el al. (2003) observed that animals finished on grain had
significantly whiter fat than animals finished on pasture. The difference in fat color is
explained by the accumulation of β-carotene in the subcutaneous and intramuscular fat
observed in animals raised and finished on pasture. The fat color is also associated with
genotype, sex and age of animals.

19
Percentage of intramuscular fat
The percentage of intramuscular fat is also called “marbling” and is characterized
by the fat deposition between the muscle bundles. Marbling has been studied in many
research projects because it is associated with quality, flavor, and juiciness, and because
the market places a premium on carcass that grade Choice or above. Consequently
producers in the US are encouraged with premiums to select for highly marbled animals.
Marbling is a moderately heritable trait and it can be selected for without increasing the
Yield Grade.
Percentage retail product
Retail product yield has been a trait of significant importance in beef cattle for
generations. It has economic impact on producers, retailers, packers and also consumers.
It is important to realize that both carcass and ultrasound data can be used to evaluate
cattle for percentage retail product. Tait (2002) presented the impact some traits have on
percentage retail product. He presented some rules of thumb for looking at the changes
related to these measurements, when run through the genetic evaluation percent retail
product equation:
For each 0.1 inch decrease in fat, % retail product increases ~ 1%
For each 1.0 square inch increase in ribeye area, % retail product increases ~ 1.2%
For each 100 lbs decrease in carcass weight, % retail product increases ~ 1.3%
The retail product yield is directly dependent on other factors as gender, use of
hormones and genetics. This trait is moderately heritable (h2 ≈ 0.39; AAA, 2003), and
can be very important in the genetic selection process.

20
Genetic influences on carcass quality
Heritabilities and genetic correlations among carcass traits for several Bos taurus
breeds have been published previously (Moser el al, 1998, Wilson et al. 2001; Reverter,
2003). Carcass traits heritabilities have been determined as high - moderate in several
studies and these vary from 0.29 to 0.64 depending on trait, breed and sex (Wilson et al.
2001; Reverter, 2003). Smith et al. (1992) used ultrasound to estimate the fat thickness to
within 2.54 mm (1/10 inch) in 62 % of the steers. The correlation of carcass and
ultrasound fat thickness measurement is dependent of technician skills and also with
changes during the carcass processing (Smith et al., 1992). Several studies have shown
the favorable and moderate strong genetic correlations between carcass measurements
and ultrasound measurements (Wilson, et al. 1998; Moser et al., 1998). No studies have
examined the use of ultrasound for genetic selection for carcass merit in Bos indicus
breeds.
Application of Real-Time Ultrasound to genetic improvement programs
Several studies have demonstrated that real-time ultrasound (RTU) can be used to
measure carcass composition (Stouffer, 1991; Wilson, 1998; Herring, 1998). Carcass
composition is defined as the relative proportions of lean, fat, and bone in the carcass
(Wilson, 1992). Other electronic evaluation methods include mechanical and optical
probes, electromagnetic scanning, electrical impedance, X-ray measurements,
computerized tomography, and nuclear magnetic resonance. These methods can also be
used to obtain animal measurements but RTU is more cost-effective when used on a large

21
scale and also more practical to use in the field. Real-time ultrasound has been used to
measure rib-eye area, external fat thickness and intramuscular fat. This technology has
been used in both live beef cattle (Stouffer, 1991.; Doyle et al, 1998) and in hot beef
carcass (Stouffer, 1991;Yujun L. et al., 1995; Amin et al, 1995; Perkins T. et al., 2003).
The use of RTU has been used also as an important technology in improving uniformity
of feeder and developing advanced computer modeling (Sainz, R.D., Oltjen J. W., 1994).
Ultrasound carcass evaluation can benefit all segments of the beef industry -
breeder, producer, feeder, packer, retailer and consumer - because of its accuracy in
determining carcass merit. This accuracy was reached in the 1980s when RTU was
introduced with a linear array transducer with a larger number of crystals (64-100). Its
utility in genetic selection programs was demonstrated in the 1990s. Beef cattle seedstock
breeders in Australia have had estimated breeding values (EBV) for scanned carcass traits
including eye muscle area and subcutaneous fat depths between the 12th and 13th ribs and
at the P8 (rump) site since 1990 (Reverter, 2000). RTU has the potential of allowing the
beef cattle industry to obtain expected progeny differences (EPD) for carcass traits for a
much larger share of the seedstock population, and at a much lower cost and significantly
faster rate than is possible with progeny testing (BIF, 1996).
Overall goal
Improvement of carcass and meat quality traits is vital to Brazil’s beef industry
because the domestic and especially the international markets are placing increased
emphasis on product quality. Until now, all genetic improvement programs for Bos
indicus breeds have focused on selection for performance, fertility, milk producing

22
capacity and stayability. Other criteria, such as temperament, have also been used by
some producers. This study was designed to define parameters that are necessary to
develop a carcass merit program. This experiment aimed to evaluate the growth patterns
and optimal age points for carcass evaluation in Nelore cattle raised under pasture and
feedlot conditions. These variables include variance components (i.e., heritabilities,
genetic and phenotypic correlations), that are necessary to establish models and protocols
for a carcass merit selection program. Evaluations of this type will improve the
understanding of the genetics of growth and carcass composition in the Nelore breed, and
possibly provide some economic benefit to the producers. The importance of selection for
carcass quality becomes more important as the value-based marketing programs pay
additional premiums for increased carcass quality.

23
Chapter 2: The use of ultrasound to evaluate growth and carcass quality in Nelore
cattle
Introduction
Real-Time Ultrasound (RTU) scanning gives an accurate and repeatable measure
of external fat and longissimus muscle area in beef cattle (BIF, 1996; Wilson et al., 1998;
Hassen et al., 1999; Crews et al, 2002). For several years, studies has shown the accuracy
of using RTU for carcass evaluation. These studies have also shown the importance of
using highly skilled technicians for image collection in the field and also for the
laboratory interpretation of the images (Wilson et al., 1998). Several studies have shown
the favorable and moderately strong genetic correlations between carcass measurements
and ultrasound measurements (Wilson, et al. 1998; Moser et al., 1998). The traditional
carcass progeny test may be limited by only providing accurate evaluations on a biased
sample of a few popular sires and little information on females (Crews et al. 2002). In
addition, the cost and time needed for these evaluations limits their large-scale
application in genetic selection programs.
Most studies with RTU in beef cattle have been conducted to develop breed-
specific genetic parameters and providing the breed associations the information required
to develop their carcass evaluation programs. Several associations are now publishing
carcass Expected Progeny Differences (EPD), predicted from ultrasound data. No Zebu
breed has developed genetic parameters to predict EPD for carcass traits. Heritabilities
and genetic correlations among carcass traits were published for several Bos taurus

24
breeds (Moser el al, 1998, Wilson et al. 2001; Reverter, 2003). Heritabilities have been
estimated to be moderate for most carcass traits (Wilson et al. 2001; Reverter, 2003).
Before ultrasound measurements of seedstock can be used for genetic prediction
of carcass merit, breed-specific parameters, such as growth curves and optimal age points
for data collection need to be established. Important differences exist between Bos
indicus and Bos taurus animals in growth parameters, such as physiological maturity at
measurement. Differences in management systems, such as pasture vs. concentrate
feeding, may also be important. Beef carcass premiums in the US are based on Yield and
Quality Grades, which are affected by the proportions of muscle, fat and bone in the
carcass (Herring et al., 1994; Tait et al. 2001). Real-time ultrasound technology provides
the opportunity to measure these traits and select animals with high breeding values. This
study was carried out to support the development of carcass evaluation in genetic
selection programs for Zebu cattle raised under grazing systems. The adoption of these
programs becomes more important as value-based marketing programs in Brazil begin to
pay additional premiums for improved carcass quality.
Materials and methods
Live animal data
Data from 1,721 bulls and heifers were collected for these analyses. Animals were
measured at approximately 15, 18, 21 and 24 months of age, but due to the sale of
animals it was not always possible to have records for all different ages for each animal.
The cattle were raised in central Brazil, which is characterized as humid tropics with
predominantly African grasses (e.g., Brachiaria, Panicum spp.) and rainfall around 1800

25
mm. All animals had free-choice access to water and mineral-salt supplement during the
experimental period. All animals were weighed and scanned on the same day by an
APTC-accredited technician. The same technician was also responsible for image
analysis. The ultrasound machine used for scanning was an Aloka 500V (Corometrics
Medical System, Wallingford, CT) using a 3.5-MHz, 17.2cm linear array transducer. The
animals were scanned for ribeye (longissimus dorsi) area (ULMA); fat thickness over the
longissimus dorsi at a point ¾ the length ventrally of the ribeye and between the 12th and
13th ribs (UFAT); and fat thickness over the rump (URFAT), at the junction of the biceps
femoris and gluteus medium between the ischium and illium, and parallel to the vertebrae
as was described by Greiner (2003). Vegetable oil was used as a coupling agent to obtain
adequate acoustic contact. In addition other live-animal measures including body weight
and hip height were taken and recorded for each animal. The images were digitized and
stored using an image capture system (Blackbox, Biotronics, Ames, IA, USA). Images
were analyzed using the Image-J software package (National Institutes of Health, USA).
The perimeter of the longissimus muscle was traced from the digitized images and the
software computed muscle area. Similarly, the subcutaneous fat thickness measurements
were made by marking the top and bottom interfaces of the fat layers, and the linear
measurement made by the program. Contemporary group was defined as animals of the
same sex and herd, raised in the same environment, in the same management group,
scanned and weighed on the same day. The maximum range of ages within ultrasound
contemporary groups was 90 days. Data were edited to remove animals that lacked or had
inconsistent pedigree information. However, animals were not required to have
measurements for all three ultrasound traits, or at all ages.

26
Data analyses
Models were built using the MIXED procedures of SAS (SAS Institute, Cary,
NC) and three different analyses were performed.
Analysis 1. This model was used to determine significant (P < 0.05) fixed effects
for each trait (weight, ULMA UFAT, URFAT):
PROC MIXED; CLASS ID CG AGEc MG MONTHSCAN;
MODEL REA =CG*MG MONTHSCAN AGEc AGEc*MONTHSCAN;
RANDOM ID(CG*MG);
Lsmeans MONTHSCAN / PDIFF=all;
Lsmeans AGEc / PDIFF=all;
Lsmeans AGEc*MONTHSCAN / PDIFF=all;
Contemporary group (CG) included herd of origin, gender, region and scanning
and weight at the same date. There were 23 contemporary groups for all characteristics
analyzed: weight, ULMA, UFAT and URFAT. The animals were grouped in five age
classes (AGEc): A, 15-16 months; B, 17-18 months; C, 19-20 months; D, 21-22 months
and E, 23-24 months. Animals from different management systems were classified in
three different groups; 1, pasture; 2, pasture with supplementation; and 3, fed with high
energy diets. In order to fit the model the month of scan was separated into five groups:
Mar-02, Jun-02, Oct-02, Jan-03 and Mar-03. The F-test statistic was used for each trait to
determine whether the variable in the model was significant.

27
Analysis 2. Least square means were calculated from a fixed effect model to
determine how the seasonality and age might influence body weight and carcass
measurements. The following model was used to perform these analyses:
PROC MIXED; CLASS ID CG AGEc MG MONTHSCAN;
MODEL REA =CG*MG MONTHSCAN AGEc AGEc*MONTHSCAN;
RANDOM ID(CG*MG);
Lsmeans MONTHSCAN / PDIFF=all;
Lsmeans AGEc / PDIFF=all;
Lsmeans AGEc*MONTHSCAN / PDIFF=all;
Analysis 3. In order to test the model for a carcass merit evaluation program and
find out which effects need to be under control, the MIXED procedure of SAS was
performed for each trait (weight, ULMA, UFAT, URFAT). Fixed effects were age in
months (AGEm), month of scanning (MONTHSCAN), contemporary group (including
management group; CG*MG). The interaction between AGEm and MONTHSCAN was
used to test the slopes for homogeneity, and the individual animal within contemporary
and management group was included to account for repeated measures on the same
animal. The following model was performed for these analyses:

28
PROC MIXED; CLASS ID CG AGEc MG MONTHSCAN;
MODEL REA=CG*MG MONTHSCAN AGEm AGEm*MONTHSCAN / SOLUTION;
RANDOM ID(CG*MG);
Lsmeans MONTHSCAN / PDIFF=all;
Results and Discussion
Ultrasound genetic parameters
As shown in Table 2.1, all animals were evaluated in a 9 month age range, from
15 to 24 months of age. Although some animals were extremely heavy, most of the
animals were on pasture (MG = 1), evaluated around 318 kg at 19 months of age. The
animals in MG 2 and 3 were significantly heavier than animals in MG 1 (P < 0.001). The
range in subcutaneous fat (UFAT and URFAT), shows the potential in the Nelore breed
for finishing. Usually, these animals are not able to express their genetic potential
because of the low nutritional level present under tropical pasture conditions.
Table 2.1 - Summary statistics for live-scan ultrasound data
Variable n Mean Median Minimum Maximum Standard deviation
Age, mo 2723 19 19 15 24 2.64 Weight, kg 2719 321 318 156 852 57.52 ULMA, cm2 2600 47.80 47.35 14.73 98.24 8.85 UFAT, mm 2597 1.5 1.3 0.4 11.7 0.62 URFAT, mm 2571 2.0 1.8 0.4 12.1 0.97 Hip height, m 1221 1.38 1.37 1.22 1.62 0.06

29
Significance of model fixed effects
The major objective of this analysis was to study the fixed effects of
contemporary and management group (CG*MG), age class (AGEc), month scanned
(MONTHSCAN), and age class × month of scanning (AGEc*MONTHSCAN) on body
weight and the RTU measurements. The MIXED procedure was performed for each trait.
Table 2.2 presents the fixed effects for body weight. All fixed effects were significant
(P < 0.001) including the AGEc*MONTHSCAN term, indicating a significant interaction
between age and season on body weight.
Table 2.2 - Type 3 tests of fixed effects for body weight
Effect Numerator df
Denominator df F Value Pr > F
Contemporary groups 33 2631 53.98 < 0.0001 Month scanned 4 28 14.1 < 0.0001 Age class 4 28 52.59 < 0.0001 Age class * Month scanned 16 28 3.63 0.0014
The F-test shows significant effects (P < 0.0001) of contemporary and
management group, month scanned and age class on ULMA (Table 2.3). The
AGEc*MONTHSCAN term was also significant, indicating an interaction between age
and season on ULMA. Longissimus muscle area is closely related to body weight, so this
result is consistent with that shown in Table 2.2 above.
30
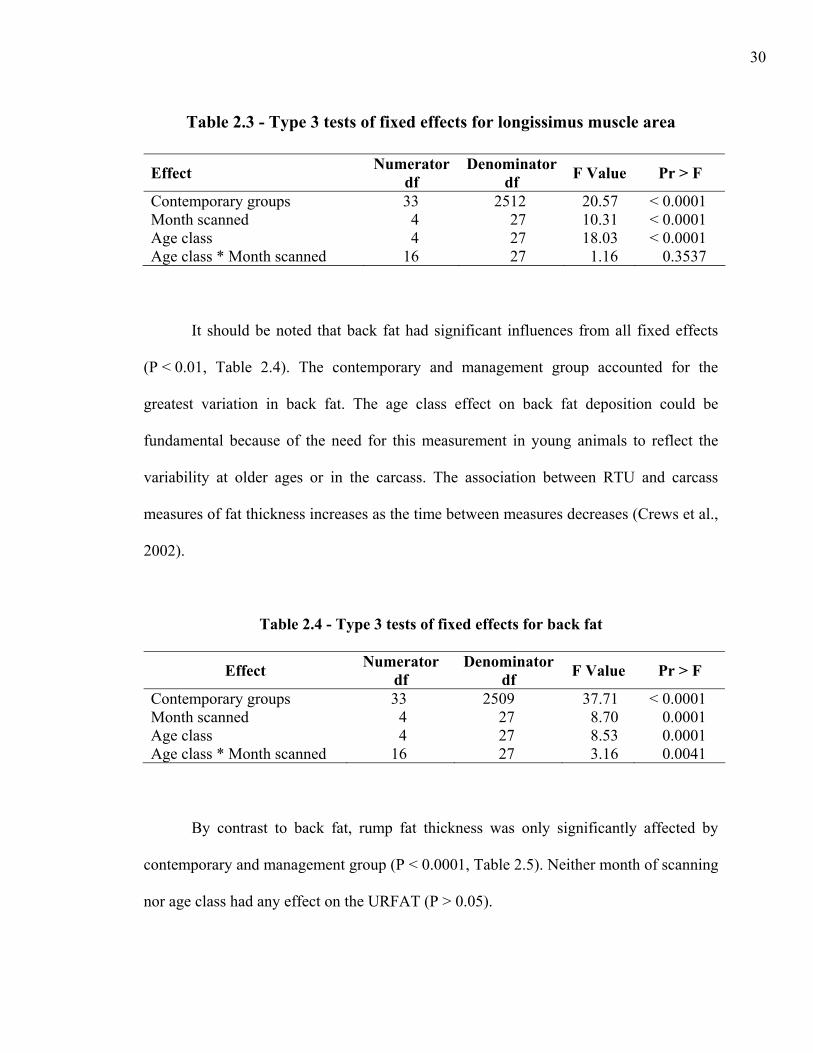
Table 2.3 - Type 3 tests of fixed effects for longissimus muscle area
Effect Numerator df
Denominatordf F Value Pr > F
Contemporary groups 33 2512 20.57 < 0.0001 Month scanned 4 27 10.31 < 0.0001 Age class 4 27 18.03 < 0.0001 Age class * Month scanned 16 27 1.16 0.3537
It should be noted that back fat had significant influences from all fixed effects
(P < 0.01, Table 2.4). The contemporary and management group accounted for the
greatest variation in back fat. The age class effect on back fat deposition could be
fundamental because of the need for this measurement in young animals to reflect the
variability at older ages or in the carcass. The association between RTU and carcass
measures of fat thickness increases as the time between measures decreases (Crews et al.,
2002).
Table 2.4 - Type 3 tests of fixed effects for back fat
Effect Numerator df
Denominator df F Value Pr > F
Contemporary groups 33 2509 37.71 < 0.0001 Month scanned 4 27 8.70 0.0001 Age class 4 27 8.53 0.0001 Age class * Month scanned 16 27 3.16 0.0041
By contrast to back fat, rump fat thickness was only significantly affected by
contemporary and management group (P < 0.0001, Table 2.5). Neither month of scanning
nor age class had any effect on the URFAT (P > 0.05).

31
Table 2.5 - Type 3 tests of fixed effects for rump fat
Effect Numeratordf
Denominatordf F Value Pr > F
Contemporary groups 33 2489 34.88 < 0.0001 Month scanned 4 22 1.49 0.2388 Age class 4 22 2.31 0.0900 Age class * Month scanned 16 22 2.08 0.0556
Seasonality effects on body weight and carcass traits
Least square means for body weight and RTU traits were calculated to present the
phenotypic variation of weight, ULMA, UFAT, URFAT in different ages classes and
more important in different scanning periods (Tables 2.6, 2.7, 2.8, 2.9). These results
illustrate the variation in body weight and RTU that was a concern in evaluation for a
genetic selection program. During the dry season (May – October), animals presented
lower measurements and this could be a concern if the contemporary groups are not
accounted for as we discuss later. Table 2.6 shows the body weight within different age
classes and in different seasons. A linear increase of body weight was observed when we
compare the average within each class. The same was not observed in different scanning
periods where cattle lose weight, especially during June and October.
Table 2.6 - Least square means for body weight (kg)
Month scanned Age class (months) Mar-02 Jun-02 Oct-02 Jan-03 Mar-03 Average
15-16 330 296 313 352 357 330 17-18 358 313 337 382 371 352 19-20 380 342 376 390 404 378 21-22 411 361 414 423 429 408 23-24 425 373 415 464 430 421
Average 381 337 371 402 398 X

32
In Table 2.7, the ULMA measurements in different age classes and scanning
periods are presented. ULMA is a very good indicator of carcass muscling, which is a
large component of the total carcass weight. Therefore, muscle growth also reflects
overall body weight gain. A small decrease in muscle area for all age classes was
observed, similarly to results presented for body weight, especially in June. The highest
average ULMA was observed in January, during the rainy season when the pastures are
at the best nutritional stage. ULMA growth was linear among the age classes. Mean
longissimus muscle area growth rate was approximately 1.34 cm2/month for all age
classes and seasons.
Table 2.7 - Least square means for longissimus muscle area (cm2)
Month scanned Age Class (months) Mar-02 Jun-02 Oct-02 Jan-03 Mar-03 Average
15-16 48.41 45.24 55.97 55.30 56.32 52.25 17-18 51.46 48.06 51.76 58.12 57.91 52.46 19-20 54.32 50.32 57.31 59.10 61.19 56.45 21-22 57.50 55.08 62.05 63.87 60.50 59.80 23-24 62.62 54.99 60.59 66.91 64.81 61.98
Average 54.86 50.74 57.53 60.66 60.14 X
The back fat thickness for different age classes and scanning periods is presented
in Table 2.8. Small differences were observed in back fat deposition among age classes
and scanning periods. It appears from these results that nutritional level was limiting fat
deposition in animals raised under pasture conditions. Low variability of fat thickness in
Nelore cattle due to management and level of nutrition may be a problem in predicting
genetic differences in fat deposition potential (Wilson, 1992).

33
Table 2.8 - Least square means for back fat (mm)
Month scanned Age Class
(months) Mar-02 Jun-02 Oct-02 Jan-03 Mar-03 Average 15-16 2.16 1.85 3.61 1.72 1.95 2.26 17-18 2.14 1.92 1.62 1.77 1.92 1.88 19-20 2.22 1.95 1.82 1.82 1.91 1.94 21-22 2.52 1.95 1.86 1.78 2.14 2.05 23-24 2.14 1.89 1.84 1.78 2.14 1.96
Average 2.24 1.91 2.15 1.77 2.01 X
Rump fat is deposited earlier and is generally greater than back fat. This can be
important in the data analyses in order to minimize errors of interpretation and
identification of animals with fat deposition potential. Rump fat is 34 % greater than
back fat for animals on this plane of nutrition, raised on tropical grass with an average of
1.3 mm for back fat. Similar growth curve patterns are observed for both UFAT and
RUFAT, with small decreases in June and January (Table 2.9).
Table 2.9 - Least square mean for rump fat (mm)
Month scanned Age Class (months) Mar-02 Jun-02 Oct-02 Jan-03 Mar-03 Average
15-16 2.79 2.71 4.26 2.33 2.43 2.90 17-18 2.89 2.74 2.25 2.62 2.50 2.60 19-20 3.05 2.90 2.29 2.67 2.59 2.70 21-22 2.70 2.95 2.44 2.46 2.53 2.61 23-24 2.52 2.91 2.40 2.43 2.86 2.62
Average 2.79 2.85 2.73 2.51 2.58 X
Accounting for contemporary and management group effects
The contemporary and management group and age accounted for a relatively
large portion of observed variance in response variables (P < 0.001). As shown in Table

34
2.10, the month of scanning (i.e., season) had no effect on body weight (P > 0.05) when
the contemporary and management groups are properly accounted for.
Table 2.10- Type 3 tests for fixed effects and differences in slopes of body weight vs. age
Effect Numerator df
Denominator df F Value Pr > F
Contemporary groups 33 2647 61.44 < 0.0001 Month scanned 4 27 1.61 0.2009 Age 1 27 861.77 < 0.0001 Age * Month scanned 4 27 6.76 0.0007
The fixed effects on ULMA are presented in Table 2.11. Again, there were no
significant effects of month of scanning, indicating that there were no significant
seasonality effects (P > 0.05) in the longissimus muscle area measurements. On the other
hand, highly significant effects of contemporary and management group and age were
observed (P < 0.0001). In order to generate Expected Progeny Differences (EPD) it will
be fundamental to have the contemporary and management group under control, and to
standardize the age at scanning.
Table 2.11 - Type 3 tests for fixed effects and differences in slopes of longissimus muscle area vs. age
Effect Numeratordf
Denominatordf F Value Pr > F
Contemporary groups 33 2530 24.70 < 0.0001 Month scanned 4 24 1.93 0.1378 Age 1 24 273.01 < 0.0001 Age * Month scanned 4 24 0.81 0.5292
35
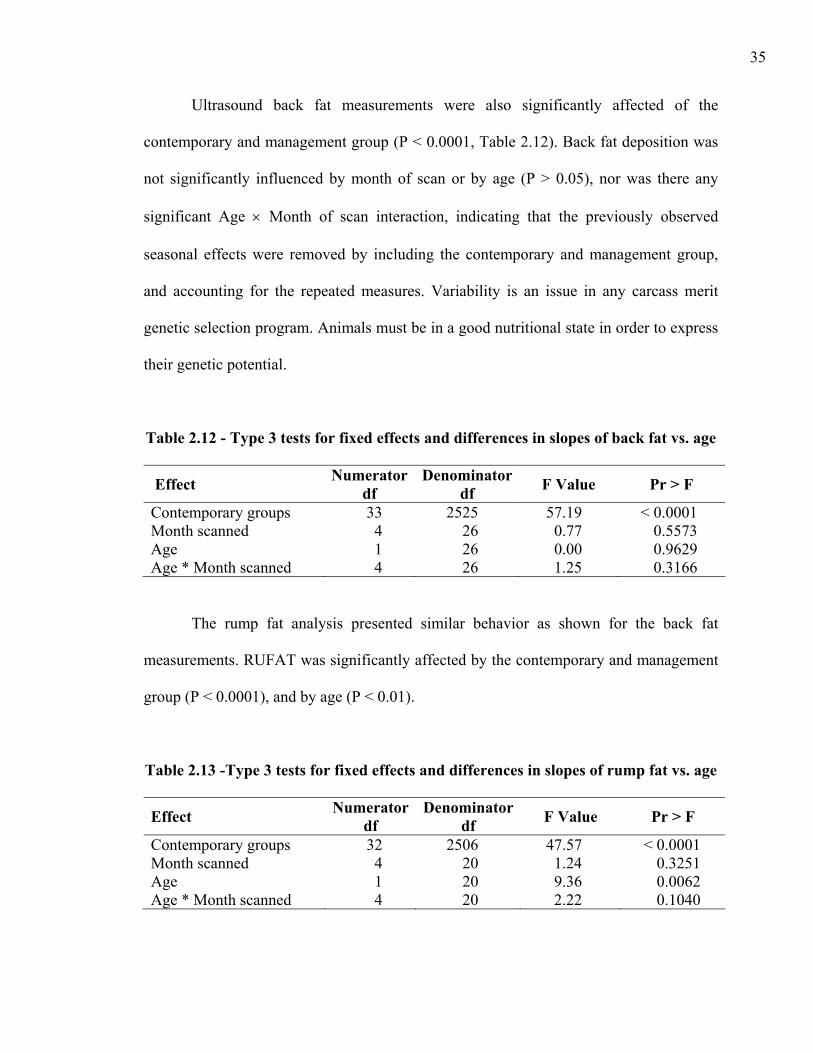
Ultrasound back fat measurements were also significantly affected of the
contemporary and management group (P < 0.0001, Table 2.12). Back fat deposition was
not significantly influenced by month of scan or by age (P > 0.05), nor was there any
significant Age × Month of scan interaction, indicating that the previously observed
seasonal effects were removed by including the contemporary and management group,
and accounting for the repeated measures. Variability is an issue in any carcass merit
genetic selection program. Animals must be in a good nutritional state in order to express
their genetic potential.
Table 2.12 - Type 3 tests for fixed effects and differences in slopes of back fat vs. age
Effect Numeratordf
Denominatordf F Value Pr > F
Contemporary groups 33 2525 57.19 < 0.0001 Month scanned 4 26 0.77 0.5573 Age 1 26 0.00 0.9629 Age * Month scanned 4 26 1.25 0.3166
The rump fat analysis presented similar behavior as shown for the back fat
measurements. RUFAT was significantly affected by the contemporary and management
group (P < 0.0001), and by age (P < 0.01).
Table 2.13 -Type 3 tests for fixed effects and differences in slopes of rump fat vs. age
Effect Numeratordf
Denominatordf F Value Pr > F
Contemporary groups 32 2506 47.57 < 0.0001 Month scanned 4 20 1.24 0.3251 Age 1 20 9.36 0.0062 Age * Month scanned 4 20 2.22 0.1040

36
On-farm age adjustments
Models for adjustment of longissimus muscle area and rump fat from ultrasound
scan on live animals were developed using the MIXED procedure from SAS. The linear
models estimate the longissimus muscle area and rump fat at 550 days of age based on
the actual age and ULMA or RUFAT measurements.
Age regression models would be best fitted using individual within-animal
regressions. In some cases, however, it might be useful to predict the animal’s growth
rate and adjust the nutritional management in early growth stages. Adjustment factors for
REA (cm2) and rump fat (mm) are:
ULMA550 = ULMA + 0.0473 (± 0.00715) x (550 – Age in days)
RUFAT550 = RUFAT + 0.00193 (± 0.00804) x (550 – Age in days)
Repeatability
Another question was to verify whether RTU measurements were made with
sufficient repeatability. In the literature most results for repeatability include both the
image collection (scanning) and the image interpretation (analysis) operations. These
values cover a large range from 0.5 to 0.9 (Renand et al. 1997). The repeatability of back
fat thickness (Table 2.14) was considered very low and it might be explained by the slow
fat deposition in Zebu cattle raised on tropical pasture, i.e., a low energy diet. The
thickness of the subcutaneous fat layer in these bulls compared to the highly variable fat
steers and cows generally used in other experiments was certainly the main reason for the
low repeatability observed for UFAT.

37
Table 2.14 - Repeatability coefficients for body weight and ultrasound carcass measurements in Nelore cattle
Trait Repeatability Live scan weight (wt) 0.37 Longissimus muscle area (ULMA) 0.44 12-13th back fat thickness (UFAT) 0.035 Rump fat thickness (URFT) 0.62
On the other hand, repeatability values for URFAT and ULMA achieved
moderate repeatabilities, 0.62 and 0.44, respectively. It should be noted that these
repeatability values were obtained by serial scans with intervals of three months, not
hours or days as in other studies. Repeatability estimates could be higher if the scanning
interval was shorter.
Conclusions and application
The present study confirmed the obvious, that Nelore cattle raised on tropical
pastures exhibit growth patterns and carcass compositions that are very different from
those observed in Bos taurus cattle raised on high-concentrate diets. It seems logical that
breed-specific research must be done in order to develop a genetic improvement program
for carcass merit. In this study, grazing Nelore bulls had minimal fat deposition, far
below that needed to reach acceptable carcass grades. On the other hand, Nelore bulls and
heifers fed high-energy diets showed that the Nelore breed has the potential to improve
carcass quality and meet international market standards.
The analyses showed that the contemporary and management group is the most
important fixed effect in controlling the body weight and carcass traits. Animals raised on
tropical pastures are directly affected as the seasons (rainy and dry) change. One of the

38
most important issues for this work was to test how the season might influence the
ultrasound scanning protocol for a carcass merit evaluation program. It is normal that
animals evaluated in the dry season have phenotypic differences compared to animals
scanned during the rainy season. Seasonality had no effect on carcass traits and body
weight once the contemporary group was accounted for. With these results, cattle
breeders have a powerful tool to select animals to meet specific market demands. Some
markets will demand lean meat while others will prefer fatter meat but both will be
supplied with high quality carcasses.

39
Chapter 3: Variance components for carcass traits in Nelore cattle
Introduction
Brazilian beef producers are faced with the challenges of meeting increasingly
stringent market demands under vastly different production environments and at an
extremely low cost. To do this successfully, producers require knowledge of genetic
factors that affect the production system and can increase their income. Among these,
carcass quality traits may be considered along with the more traditional performance
characteristics. Heritabilities and genetic correlations among carcass traits for several Bos
taurus breeds have been published (Moser el al, 1998, Wilson et al. 2001; Reverter,
2003). Several studies have shown that carcass traits in Bos taurus cattle are moderately
heritable (Wilson et al. 2001; Reverter, 2003). Ultrasound technology provides an
opportunity to cost-effectively estimate carcass attributes on the live animal (Berthoud,
2000). Genetic evaluations for carcass traits based on ultrasound measurements of Bos
indicus cattle have the potential to increase the rate of genetic progress and reduce the
expense involved in a traditional progeny test.
One of the primary objectives of this research project was to apply real-time
ultrasound (RTU) technology for collection of data on carcass traits in Nelore cattle in
Brazil, and to develop Expected Progeny Differences (EPDs) for these traits. Important
variables, such as differences in anatomy between Bos taurus and Bos indicus cattle, in
physiological maturity at measurement, and in management systems (pasture vs. high
energy diets) were considered in this study.

40
The ultimate goal of this study was to estimate genetic parameters and calculate
EPDs for external 12-13th rib fat (UFAT), rump fat thickness (P8) and ribeye area (REA).
Before RTU measurements of seedstock can be used for genetic prediction of carcass
merit, breed-specific parameters such as heritabilities, genetic and phenotypic
correlations must be determined. This paper summarizes results of evaluations of carcass
traits in Nelore cattle using ultrasound.
Materials and methods
Live animal data
Data from 1,721 bulls and heifers were collected for these analyses. Animals were
measured at approximately 15, 18, 21 and 24 months of age, but due to the sale of
animals it was not always possible to have records for all different ages for each animal.
The cattle were raised in central Brazil, which is characterized as humid tropics with
predominantly African grasses (e.g., Brachiaria, Panicum spp.) and rainfall around 1800
mm. All animals had free-choice access to water and mineral-salt supplement during the
experimental period. All animals were weighed and scanned on the same day by an
APTC-accredited technician. The same technician was also responsible for image
analysis. The ultrasound machine used for scanning was an Aloka 500V (Corometrics
Medical System, Wallingford, CT) using a 3.5-MHz, 17.2cm linear array transducer. The
animals were scanned for ribeye (longissimus dorsi) area (ULMA); fat thickness over the
longissimus dorsi at a point ¾ the length ventrally of the ribeye and between the 12th and
13th ribs (UFAT); and fat thickness over the rump (URFAT), at the junction of the biceps
femoris and gluteus medium between the ischium and illium, and parallel to the vertebrae

41
as was described by Greiner (2003). Vegetable oil was used as an coupling agent to
obtain adequate acoustic contact. In addition other live-animal measures including body
weight and hip height were taken and recorded for each animal. The images were
digitized and stored using an image capture system (Blackbox, Biotronics, Ames, IA,
USA). Images were analyzed using the Image-J software package (National Institutes of
Health, USA). The perimeter of the longissimus muscle was traced from the digitized
images and the software computed muscle area. Similarly, the subcutaneous fat thickness
measurements were made by marking the top and bottom interfaces of the fat layers, and
the linear measurement made by the program. Contemporary group was defined as
animals of the same sex and herd, raised in the same environment, in the same
management group, scanned and weighed on the same day. The maximum range of ages
within ultrasound contemporary groups was 90 days. Data were edited to remove animals
that lacked or had inconsistent pedigree information. However, animals were not required
to have measurements for all three ultrasound traits, or at all ages.
Pedigree
The 1,721 animals in the final data set were produced by 85 different sires and 23
contemporary groups were formed. The full relationship matrix was constructed by
incorporation of all available pedigree data of the University of São Paulo – Ribeirão
Preto and ANCP (National Breeders and Researchers Association). The pedigree file
used for calculation of the inverse numerator relationship matrix contained 25,941
animals, including those augmented so that each animal with data had two ancestral
generations.

42
Genetic evaluations
Heritabilities (h2) were estimated with single-trait analyses. A bi-variate
Restricted Maximum Likelihood (REML) analysis was used to estimate the genetic (rg)
and phenotypic (rp) correlations between pairs of traits. A minimum of three different
start values for genetic and environmental variances was used for single-trait analyses.
Multiple Trait Derivative Free Restricted Maximum Likelihood (MTDFREML) was used
in order to establish the variance components and genetic parameters. The fixed effects in
the model included age of dam and contemporary group. Accuracies of EPDs were
calculated by the software as described by the Beef Improvement Federation (BIF, 1996).
Results and discussion
The number of observations and simple statistics for the traits evaluated in this
study are presented in Table 3.1. Note that the number of records is over 2,500 for all
traits, due to repeated measurements on each of the 1,720 animals.
Table 3.1 - Summary statistics for live-scan ultrasound data
Variable Number
of records
Mean Standard deviation
Coefficient of
variation, %
Longissimus muscle area at the 12th-13th rib, cm2 2597 52.75 9.71 18.4
12-13th rib fat thickness (UFAT), mm 2594 1.8 1.2 65.9 Rump fat (URFAT), mm 2568 2.5 1.7 69.3 Age at measurement, days 2597 576 119 20.7
Heritabilities (h2), genetic (rg) and phenotypic (rp) correlations between pairs of
traits are presented in Table 3.2. Heritability estimates for longissimus muscle area,
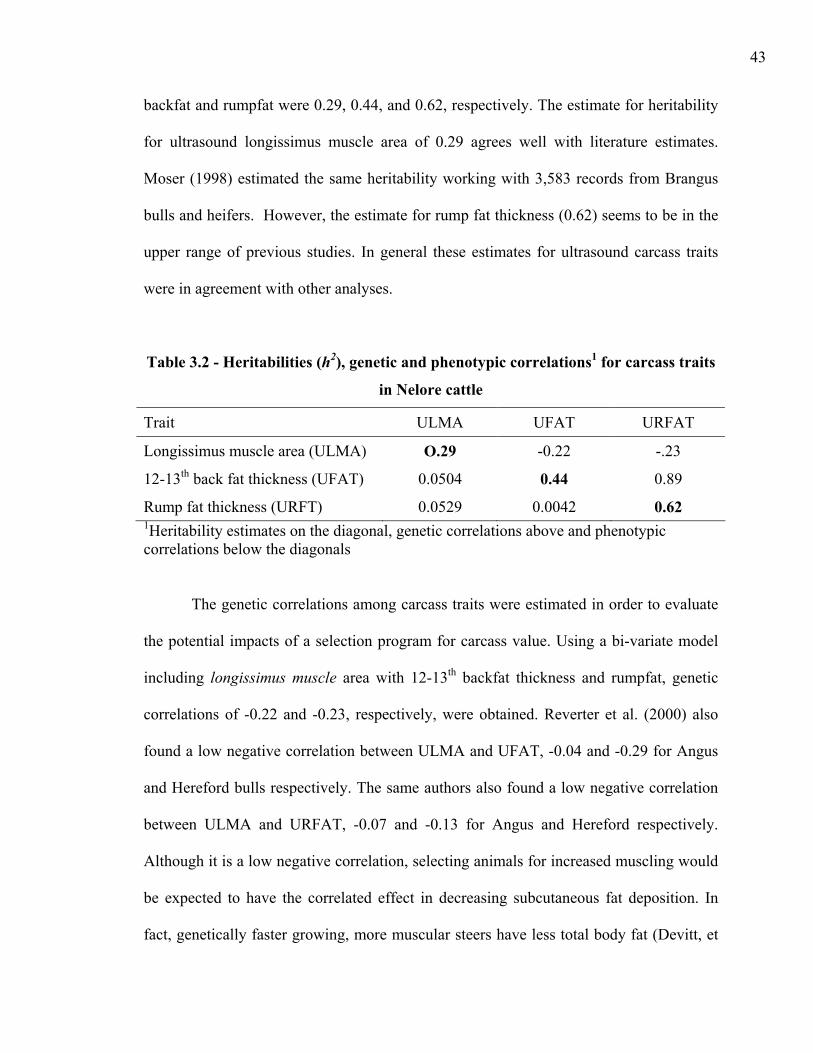
43
backfat and rumpfat were 0.29, 0.44, and 0.62, respectively. The estimate for heritability
for ultrasound longissimus muscle area of 0.29 agrees well with literature estimates.
Moser (1998) estimated the same heritability working with 3,583 records from Brangus
bulls and heifers. However, the estimate for rump fat thickness (0.62) seems to be in the
upper range of previous studies. In general these estimates for ultrasound carcass traits
were in agreement with other analyses.
Table 3.2 - Heritabilities (h2), genetic and phenotypic correlations1 for carcass traits
in Nelore cattle
Trait ULMA UFAT URFAT
Longissimus muscle area (ULMA) O.29 -0.22 -.23
12-13th back fat thickness (UFAT) 0.0504 0.44 0.89
Rump fat thickness (URFT) 0.0529 0.0042 0.62 1Heritability estimates on the diagonal, genetic correlations above and phenotypic correlations below the diagonals
The genetic correlations among carcass traits were estimated in order to evaluate
the potential impacts of a selection program for carcass value. Using a bi-variate model
including longissimus muscle area with 12-13th backfat thickness and rumpfat, genetic
correlations of -0.22 and -0.23, respectively, were obtained. Reverter et al. (2000) also
found a low negative correlation between ULMA and UFAT, -0.04 and -0.29 for Angus
and Hereford bulls respectively. The same authors also found a low negative correlation
between ULMA and URFAT, -0.07 and -0.13 for Angus and Hereford respectively.
Although it is a low negative correlation, selecting animals for increased muscling would
be expected to have the correlated effect in decreasing subcutaneous fat deposition. In
fact, genetically faster growing, more muscular steers have less total body fat (Devitt, et

44
al. 2001). This moderate antagonistic genetic relationship needs to be carefully analyzed.
Selection to improve retail yield percentage reduces fat deposition at all sites through the
body. This may have implications for female fertility because body condition is an
important factor in female reproductive performance and a minimum fat cover may be
necessary for puberty and conception.
Using the bi-variate model, the estimated genetic correlation between 12-13th rib
backfat thickness and rump fat was 0.89. A high genetic correlation of 0.74 was also
reported for 12-13th backfat thickness and rump fat in Bos taurus cattle (Wilson, 2001).
This indicates that animals that are more predisposed to deposit subcutaneous fat do so at
both sites.
The MTDFREML procedure provided a Best Linear Unbiased Prediction (BLUP)
of the EPDs. These EPDs provide estimates of the genetic merit of each animal, by
condensing a broad range of information on each animal and their relativse into a single
number for a given trait. Table 3.3 presents the mean, standard deviation, and range for
each EPD. It is notable that the genetic variation observed in this small group of animals
already demonstrates the potential to make significant genetic progress by selection,
especially for ULMA where the genetic variation is greater. Accuracy is an important
tool for managing risk and needs to be carefully evaluated. In order to make genetic
progress for fat deposition the animals should be under good nutritional management, to
have the opportunity to express their genetic potentials. The EPD for back fat and rump
fat is also present in Table 3.3 with a moderate to high accuracy. The rump fat EPD tends
to be more variable than back fat EPD, and may therefore respond more rapidly to
genetic selection. Caution should be taken in selecting extremely fat or extremely lean

45
animals because either can negatively influence the animal’s physiology and decrease
overall productivity.
Level of accuracy is primarily associated with the trait’s heritability, number of
progeny that have been evaluated for a particular sire, and how the progeny are
distributed among different contemporary groups.
Table 3.3 - Mean, standard deviation and minimum and maximum Expected Progeny Difference (EPD) and accuracy (ACC) for carcass traits in Nelore cattle1
Variablea Mean Standard deviation Minimum Maximum
ULMA, cm2 EPD -0.3660 0.89 -3.2110 3.1665 ACC 0.60
UFAT, mm EPD -0.031 0.12 -0.775 0.970 ACC 0.68
URFAT, mm EPD -0.100 0.26 -1.070 1.315 ACC 0.76
a ULMA= Longissimus muscle area, UFAT= back fat and URFAT= rump fat
Conclusions and application
Ultrasound technology offers a way to cost-effectively measure carcass traits in
live animals with an accuracy level required to develop estimated breeding values (EPD).
Breed-specific parameters should be determined to account for differences in anatomy
and physiology, in order to ultimately to develop a carcass merit program. Heritabilities
for carcass traits in Nelore cattle are moderate to high, varying from 0.29 to 0.62.
Ultrasound and carcass data are now being combined to estimate breeding values (EPDs).
The EPDs for all traits presented a range that gives the possibility to significantly
improve carcass quality in Nelore cattle.

46
This study presents the genetic parameters for carcass traits in Nelore cattle, for
which carcass quality has been an important issue in order to reach an international
standard and expand their market. Ultrasound scanning produced consistent and heritable
results for Nelore cattle. These measurements taken using standardized procedures, may
be used in genetic evaluation scheme to improve growth and carcass traits.

47
Chapter 4 – Conclusions and implications
This research project studied the use of Real-Time Ultrasound to estimate
variance components for growth and carcass traits in Nelore cattle. The Nelore bulls and
heifers exhibited growth patterns and carcass composition very different from Bos taurus
breeds. It was noticeable that Nelore cattle had insufficient fat deposition in order to
reach acceptable carcass grades. In order to evaluate Nelore cattle, especially raised under
pasture conditions, animals should reach at least 16 months in order to express their
genetic potential and have enough fat deposition (over 1.2 mm) for accurate
measurements (Crews, 2001).
The heritability for ultrasound longissimus muscle area was moderate (0.29). The
high correlation between ULMA and percentage of lean meat yield provides an
opportunity to select animals that produce more meat. Heritabilities for subcutaneous fat
depth were 0.44 and 0.62 for UFAT and URFAT, respectively. These are therefore highly
heritable traits and should respond rapidly in any genetic selection program. The genetic
correlation between UFAT and RUFAT was 0.89, indicating that animals that are more
predisposed to deposit subcutaneous fat do so at both sites. Selection for increased fat
deposition should produce animals with the potential to finish at an earlier age. In
selecting animals for decreased fat deposition, caution should be taken because of
potential detrimental effects on female fertility.
Physiologically, it is expected that animals with rapid muscle growth tend to
mature and deposit fat at a later age. The genetic correlation between longissimus muscle
area and subcutaneous fat was lowly negative (-0.22), but some animals presented

48
positive EPDs for both characteristics, showing the opportunity to improve both traits
simultaneously.
Contemporary and management group was the most important fixed effect for all
weight and carcass characteristics. Once these were accounted for, seasonality had no
effect on body weight and carcass traits, indicating that these evaluations may be
conducted during any season, as long as this is done within properly constituted
contemporary groups. Since Expected Progeny Differences (EPDs) are estimated within
contemporary groups, this is not unexpected. No interaction between months of scanning
and age in months was observed (P > 0.05) for any carcass trait, further confirming the
lack of a seasonal effect.
Nelore cattle showed a broad range of EPDs for all RTU traits, especially for
ULMA. The ULMA EPD ranged from -3.21 to +3.16 cm2, showing that a good genetic
selection program could have an important economic impact contributing to the whole
beef industry from breeders to consumers. The URFAT EPD had a range of -1.07 to
+1.32 mm of fat depth. With this genetic variation, in addition to a heritability of 0.62,
the minimum of 3 mm of back fat required by most Brazilian branded beef programs
could be reached in a short period. Accuracy for all traits was moderate to high, around
70, minimizing the producers’ risk in the selection process. The phenotypic correlations
were low for all carcass traits, probably because they were all raised under similar
conditions, thus minimizing environmental variation.
This research project presented the genetic parameters required for a carcass trait
genetic improvement program for Nelore cattle. This breed now has the basic tools to
make significant improvements in their selection process and consequently enhance the

49
quality of the product, a necessary step to gaining new markets and being widely
recognized around the world as the premier tropical beef cattle breed.

50
References
Aberle, E. D.; Forrest, J. C.; Gerrard, D. E. and Mills, E. W. 2001. Principles of Meat
Science. Fourth Edition. Kendall/Hunt Publishing Co., Dubuque, IA.
American Meat Science Association (AMSA). 2001. Meat Evaluation Handbook.
American Meat Science Association, Savoy, IL.
Anualpec. 2003. Uma visão do futuro – A pecuária brasileira daqui a dez anos. Anuário
da Pecuária Brasileira. 10th editon. pp. 14 – 30.
Beef Improvement Federation. 1996. Ultrasound scanning – Application of real-time
ultrasound to improvements program. Guidelines for uniform beef improvements
programs. 6th edition p.155-158.
Beef Improvement Federation. 2002. Ultrasound scanning to measure body composition.
Guidelines for uniform beef improvement programs. 8th edition, pp.37-41.
Beef Point. 2003. Panorama do mercado mundial da carne 2002 e 2003.
http://www.beefpoint.com.br/bn/especiais/artigo.asp?nv=1&id_artigo=5894&per
M=11&perA=2003. Accessed: 1/25/2003.
Boggs, D.L. and Merkel, R.A. 1990. Live Animal and Carcass Evaluation and Selection
Manual. Kendall/Hunt Publishing Co., Dubuque, IA.
Brethtour, J. R. 2000. Using serial ultrasound measures to generate models of marbling
and backfat thickness changes in feedlot cattle. Journal of Animal Science
78:2055-2061.
Corrêa, A.N.S. 1996. Gado de Corte: 500 perguntas, 500 respostas. EMBRAPA, Brasília -
DF.

51
Crews Jr, D. H. and Kemp, R.A. 2001. Genetic parameters for ultrasound and carcass
measures of yield and quality among replacement and slaughter beef cattle.
Journal of Animal Science79:3008-3020.
Crews Jr, D. H. and Kemp, R.A. 2002. Genetic evaluation of carcass yield using
ultrasound measures on young replacement beef cattle. Journal of Animal Science
80:1809-1818.
Crews Jr, D. H.; Pollak, E. J.; Weaber, R. L.; Quaas. R.L. and Lipsey, R. J. 2003. Genetic
parameters for carcass traits and their live animal indicators in Simmental cattle.
Journal of Animal Science 81:1427-1433.
Crews Jr, D. H.; Shannon, N.H.; Crews, R.E. and Kemp, R. A. 2002. Weaning, yearling
and preharvest ultrasound measures of fat and muscle area in steers, bulls, and
heifer. Journal of Animal Science 80:2817-2824.
Devitt, C. J. B.; Wilton, J. W. 2001. Genetic correlation estimates between ultrasound
measurements on yearling bull and carcass measurements on finished steers.
Journal of Animal Science 79:2790-2797.
Felício, P.E. 1999. Perspectivas para a tipificação de carcaça bovina.
http://www.fea.unicamp.br/. Accessed: 08/23/01.
Food and Agriculture Organization of the United Nations (FAO). 2003. FAO Statistical
database – Agriculture Data.
http://apps.fao.org/page/collections?subset=agriculture. Accessed: 07/15/03.
Food and Agriculture Organization of the United Nations (FAO). 2003. Global livestock
information system and knowledge frame work. Agriculture Department Animal

52
Production and Health Division.
http://www.fao.org/ag/againfo/programmes/en/P1.html Accessed: 07/15/03.
Genetic and phenotypic characterisation of animal, carcass, and meat quality traits from
temperate and tropically adapted beef breeds. 1. Animal measures. Australian
Journal of Agricultural Research. 54:107-118.
Greiner, S. P.; Rouse, G. H.; Wilson, D. E.; Cundiff, L.V.; and Wheeler, T. L. 2003.
Accuracy of prediction weight and percentage of beef carcass retail product using
ultrasound and live animal measures. Journal of Animal Science 81:466-473.
Harris, J.J.; Cross, H. R. and Savell. 2001. History of Meat Grading in the United States.
http://meat.tamu.edu/history.html Accessed: 08/01/2001.
Hassen, A.; Wilson, D. E.; Amin, V. R.; and Rouse, G. H. 1999. Repeatability of
ultrasound-predicted percentage of intramuscular fat in feedlot cattle. Journal of
Animal Science 77:1335-1340.
Herring, O.; Williams, S.E.; Bertrand, J. K. Benyshek, L.L and Miller, D. C. 1994.
Comparison of live and carcass equation predicting percentage of cutability, retail
product weight, and trimmable fat in beef cattle. Journal of Animal Science
72:1107-1118.
Herring, W.O.; Kriese, L.A.; Bertrand, J.K.; and Crouch, J. 1998. Comparison of four
real-time ultrasound systems that predict intramuscular fat in beef cattle. Journal
of Animal Science 76:364-370.

53
Hopkins, D. L. and Thompson, J. M. 2000. The relationship between ternderness,
proteolysis, muscle contraction and dissociation of actomyosin. Meat Science
57:1-12.
IBGE. 2003. Intituto Brasileiro de Geografia e Economia. Censo Demográfico 2000.
http://www.ibge.gov.br/. Accessed: 07/18/03.
INMET. 2003. Instituto Nacional de Meteorologia. http://www.inmet.gov.br/index2.html.
Accessed: 11/10/03.
Johnston, D. J.; Reverter, A.; Burrow, H. M.; Oddy, V. H.; and Robinson, D. L. 2003. G
Kirton, A.H. 1989. Principles of classification and grading. (Purchas, R.W., Butler-Hogg,
B.W., e Davies, A.S., Eds.) Meat Production and Processing, p. 143. New Zealand
Society of Animal Production, Hamilton.
Koohmaraie, M. 1996. Biochemical factors regulating the toughening and tenderization
process of meat. Meat Science, 43(Suppl. S):193-201.
Lawrence, T.E.; Whatley, J.D.; Montgomery, T.H.; e Perino, L.J. 2001. A comparison of
the USDA ossification-based maturity system to a system based on dentition.
Journal of Animal Science 79:1683-1690.
Mc Kenna D. 2003. Warner – Bratzler Shear Force Measurement.
http://animalscience.tamu.edu/ansc/publications/meatspubs/ASWeb072-
warnerbratzler.pdf . Accessed: 11/11/03
Moser, D.W.; Bertrand, J. K.; Misztal, I.; Kriese, L. A. and Benyshek, L.L. 1998. Genetic
parameters estimates for carcass and yearling ultrasound measurements in
brangus cattle. Journal of Animal Science 76:2542-2548.

54
Paganini, R.F.V. 2001. The effect of grazing/feeding periods on the performance, meat
quality and economic efficiency of calf-fed, short-and long-yearling. M.S. Thesis.
Dept. of Animal Science. University of California, Davis.
Perkins, T., and Rimal, A., 2003. Evaluation of ultrasonic estimates of fat thickness and
longissimus dorsi muscle area in de-haired hanging beef carcasses at chain speed.
2003. Journal of Animal Science 81 (Supplement):315.
Pineda, N. R. and Marajó, J. C. 2002. Estratégias de marketing e alianças mercadológicas
na cadeia produtiva da carne bovina. III SIMCORTE. Viçosa Federal University.
Renand, G. and Fisher, A. V.1997. Comparison of methods for estimating carcass fat
content of young Charolais bulls in performance testing station. Livestock
Production Science 51: 205-313.
Reverter, A.; Johnston, D. J.; Ferguson, D. M.; Perry, D.; Goddard, M. E.; Burrow, H.
M.; Oddy, V. H.; Thompson, J. M. and Bindon, B. M. 2003. Genetic and
phenotypic characterisation of animal, carcass, and meat quality traits from
temperate and tropically adapted beef breeds. 4. Correlations among animal,
carcass, and meat quality traits. Australian Journal of Agricultural Research.
54:149-158.
Reverter, A.; Johnston, D. J.; Graser H.-U.; Woltcott, M. L.; and Upton, W. H. 2000.
Genetic analyses of live-animal ultrasound and abattoir carcass traits in Australian
Angus and Hereford cattle. Journal of Animal Science 78:1786-1795.
Reverter, A.; Johnston, D. J.; Perry, D.; Goddard, M. E. and Burrow, H. M. 2003.
Genetic and phenotypic characterisation of animal, carcass, and meat quality traits

55
from temperate and tropically adapted beef breeds. 2. Abattoir carcass traits.
Australian Journal of Agricultural Research. 54:119-134.
Riley, D.G.; Chase Jr, C.C.; Hammond, A.C.; West, R.L.; Johnson,D.D.; Olson,T.A. and
Coleman, S.W. 2003. Estimated genetic parameters for palatability traits of steaks
from Brahman cattle. Journal of Animal Science 81: 54-60.
Rosegrant, M. W.; Painsner, M. S.; Meijer, S. and Witcover, J. 2001. 2020 Global Food
Outlook. International Food Policy Research Insitute. Washigton, D. C.
Sainz, R. D. and Araujo, F. R.C.A. 2001 Tipificação de carcaças de bovinos e suínos.
Proc. I Congresso Brasileiro de Ciência e Tecnologia de Carnes, 22 - 25 October,
São Pedro-SP (CD-ROM).
Sainz, R. D.; and Oltjen, J.W., 1994. Improving uniformity of feeder steers using
ultrasound and computer modeling. Proc. Western Section, American Society of
Animal Science. 45:179-181.
Shackelford, S. D.; Wheeler, T. L. and Koohmaraie M.1995. Relationship between shear
force and trained sensory panel tenderness ratings of 10 major muscles from Bos
indicus and Bos taurus cattle. Journal of Animal Science 73:3333–3340.
Smith, M. T.; Oltjen, J. W.; Dolezal, H. G.; Gill, D. R. and Behrens, B.D. 1992.
Evaluation of ultrasound for prediction of carcass fat thickness and longissimus
muscle area in feedlot steers. Journal of Animal Science 70:29-37.
Stouffer, J. R., 1991. Using ultrasound to objectively evaluate composition and quality of
livestock. 21st Century concepts important to meat animal evaluation. Wisconsin.
p 49-54.

56
Tait, J. R.; Rouse, G. H.; Wilson, D. E. 2002. Predicting percent retail product in beef
cattle. Proc. 34th Annual BIF meeting conference.
http://www.beefimprovement.org/proceedings/tait.html . Accessed: 6/11/03.
Tait, J. R.; Rouse, G. H.; Wilson, D. E. and Hays, C. L. 2001. Comparison of ultrasound
and carcass measures to predict the percentage of lean beef from four primal cuts.
Beef Research Report. A. S. Leaflet R1755. Cooperative Extension Service, Iowa
State Univ., Ames. IA.
USDA. 1997. United States Standards for Grades of Carcass Beef.
http://meat.tamu.edu/pdf/beef-car.pdf . Accessed: 08/31/03.
Wheeler, T. L.; Shackelford, S. D. and Koohmaraie, M. 1999. Tenderness Classification
of Beef: IV. Effect of USDA quality grade on the palatability of “Tender” beef
longissimus when cooked well done. Journal of Animal Science 77: 882-888.
Wilson, D. E. 1992. Application of ultrasound for genetic improvement. Journal of
Animal Science 70:973-983.
Wilson, D. E.; Rouse, G. H.; Graser, G. H.; and Amin, V.,1998. Prediction of carcass
traits using live animal ultrasound. Beef Research Report. A. S. Leaflet R1530.
Cooperative Extension Service, Iowa State Univ., Ames. IA.
Wilson, D. E.; Rouse, G. H.; Hays, C. L.; 2001. Carcass EPDs from Angus heifer real-
time ultrasound scan. Beef Research Report. A. S. Leaflet R1736. Cooperative
Extension Service, Iowa State Univ., Ames. IA.