i shall not today attempt further to define the kinds of material i understand to be embraced... but...
TRANSCRIPT

I shall not today attempt further to define the kinds of material I understand to be embraced . . . but I know it when I see it.
1964 – Justice Potter Stewart

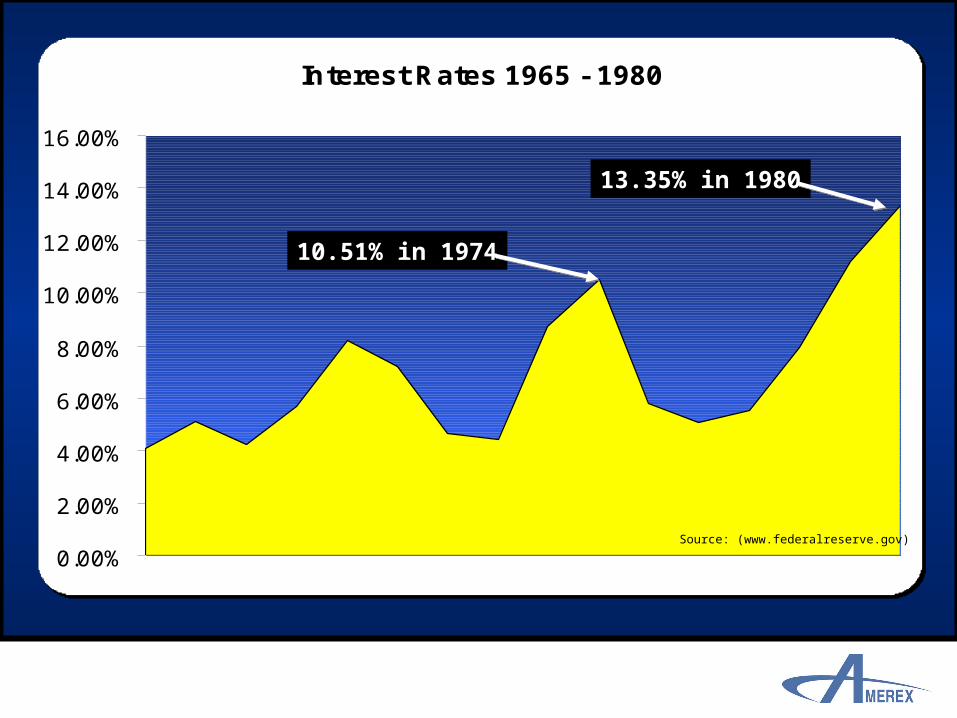
Interest rate chart
Interest Rates 1965 - 1980
0.00%
2.00%
4.00%
6.00%
8.00%
10.00%
12.00%
14.00%
16.00%
10.51% in 1974
13.35% in 1980
Source: (www.federalreserve.gov)
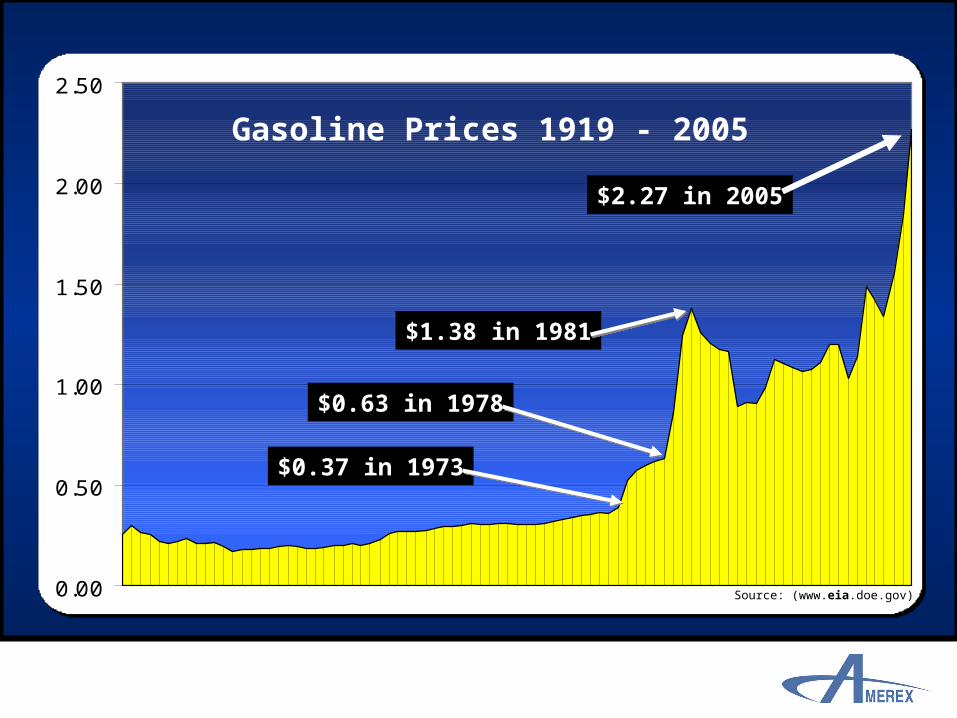
Long term gasoline chart
0.00
0.50
1.00
1.50
2.00
2.50
Gasoline Prices 1919 - 2005
$1.38 in 1981
$2.27 in 2005
$0.37 in 1973
$0.63 in 1978
Source: (www.eia.doe.gov)
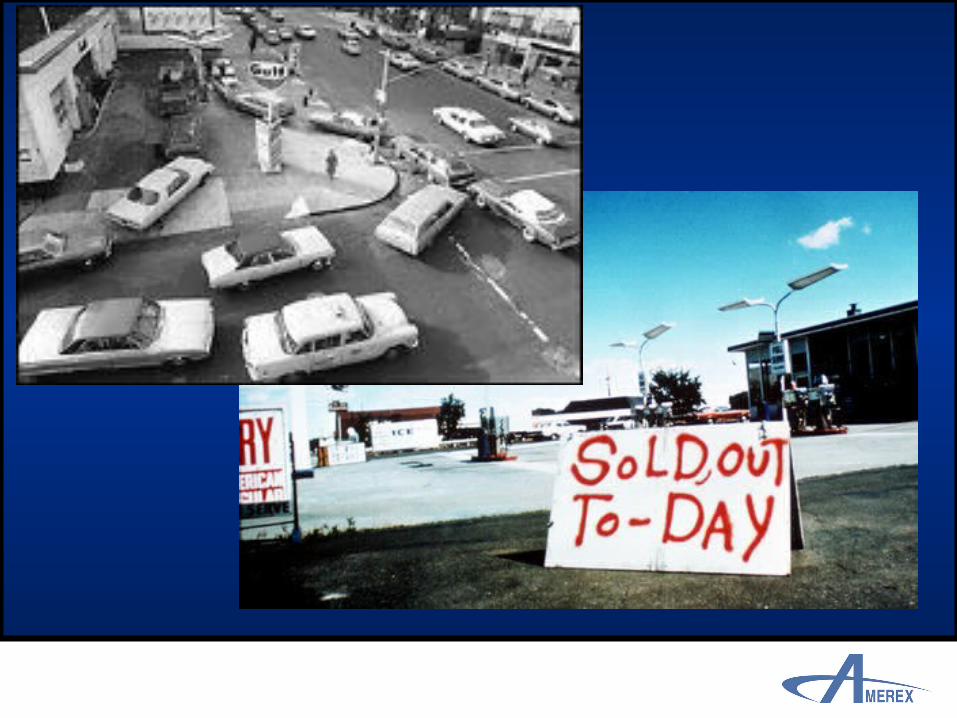
Emergency Petroleum Allocation Act of 1973
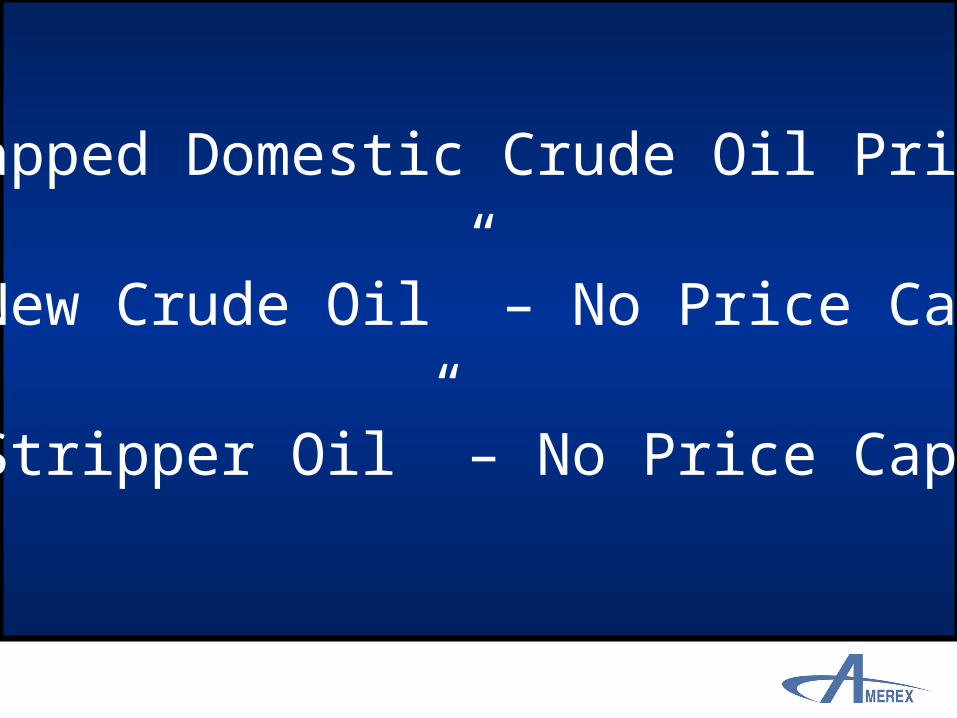
•Capped Domestic Crude Oil Prices
•“New Crude Oil” – No Price Cap
•“Stripper Oil” – No Price Cap


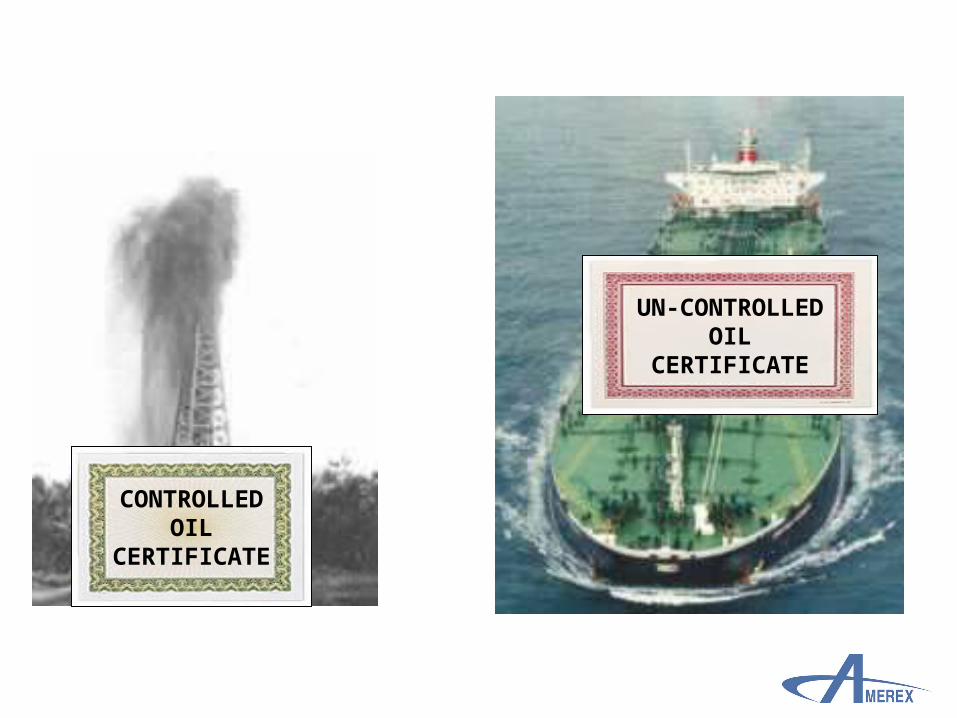
CONTROLLEDOIL
CERTIFICATE
UN-CONTROLLEDOIL
CERTIFICATE


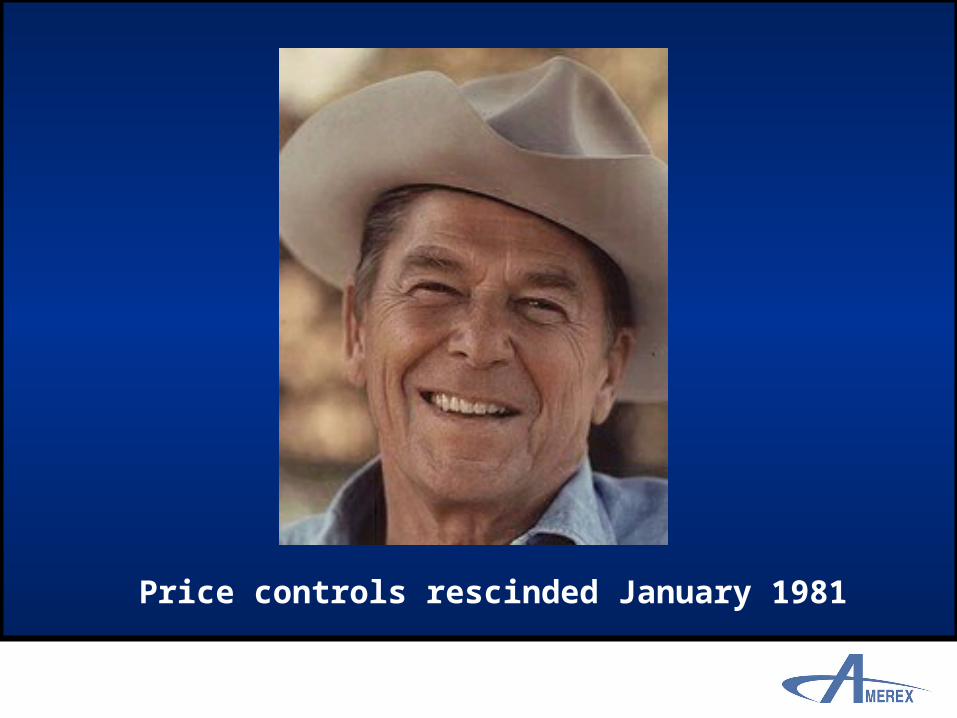
Price controls rescinded January 1981


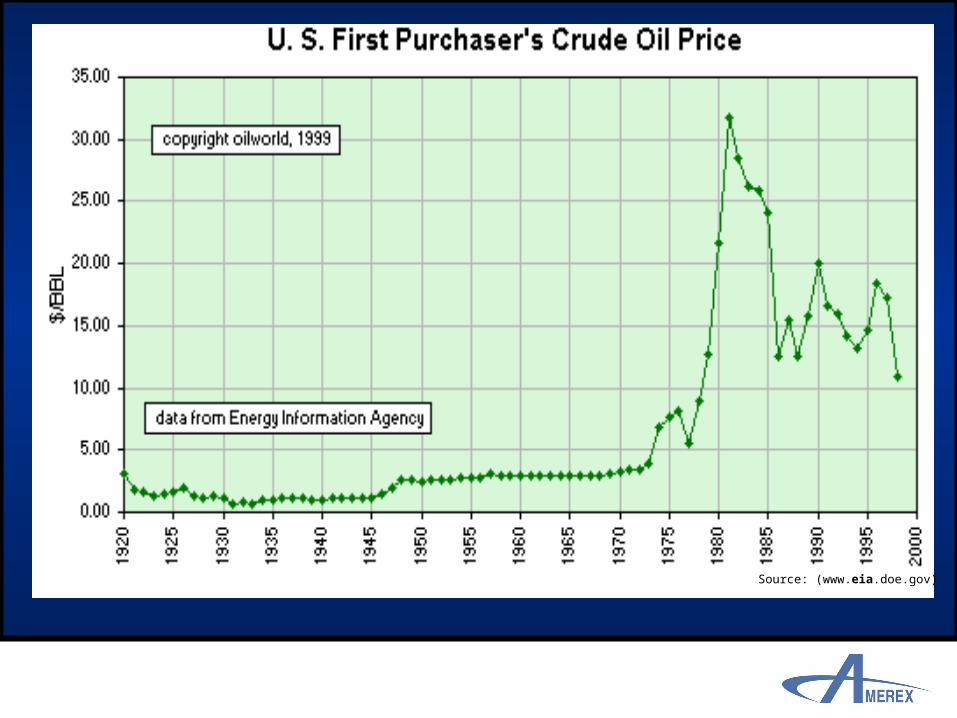
long term crude chart
Source: (www.eia.doe.gov)

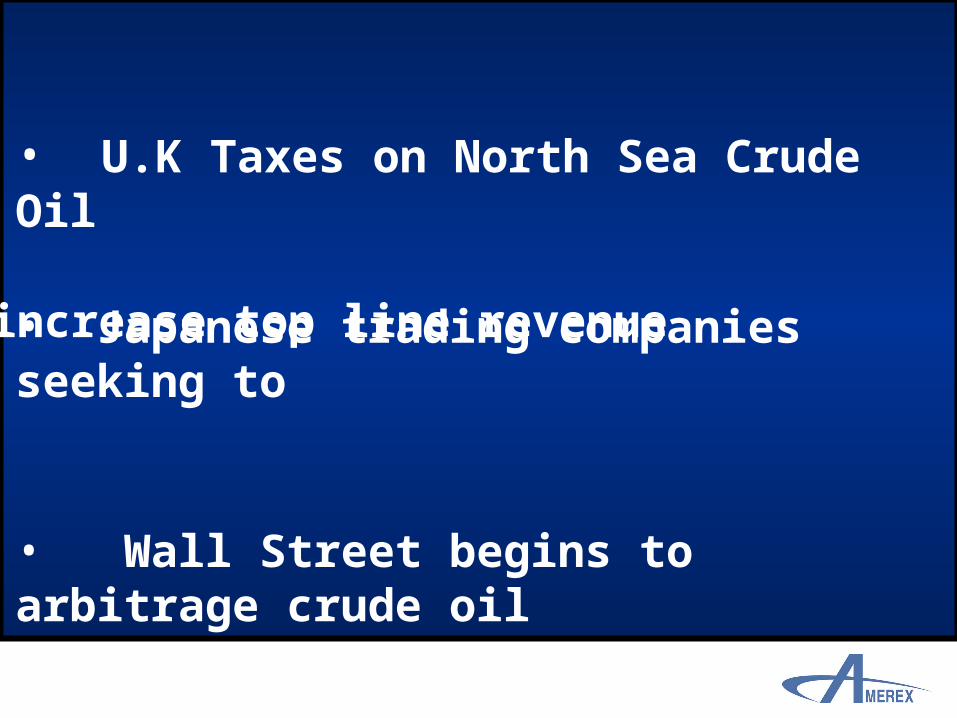
• U.K Taxes on North Sea Crude Oil
• Japanese trading companies seeking to
• Wall Street begins to arbitrage crude oil
increase top line revenue

National Energy Policy Act - 1992


“you have to understand that market realities have diverged from traditional valuation methodologies”
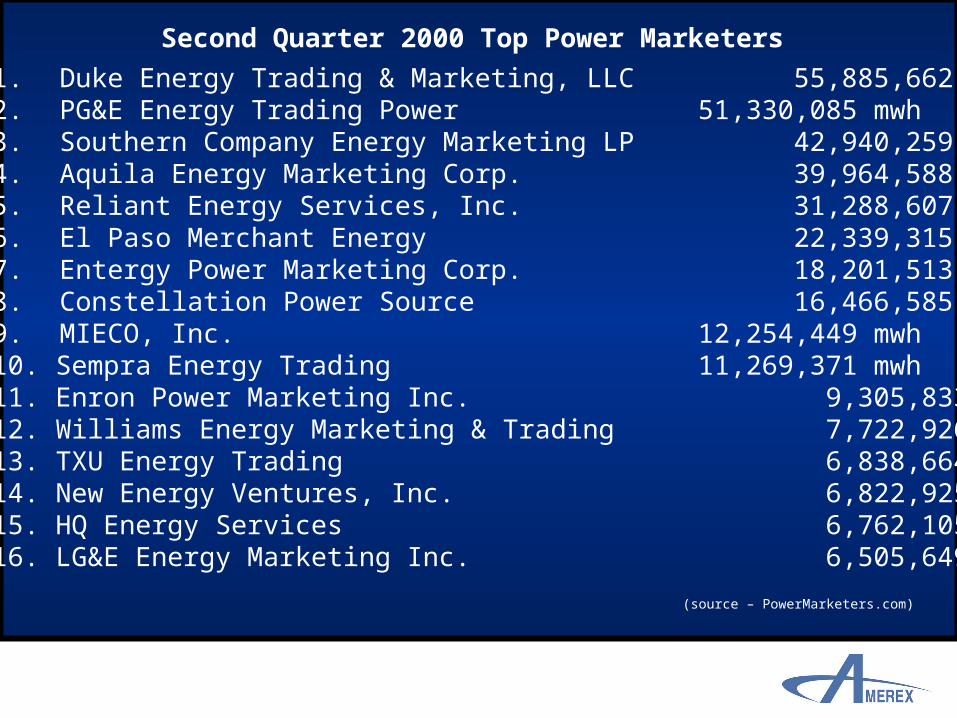
1. Duke Energy Trading & Marketing, LLC 55,885,662 mwh2. PG&E Energy Trading Power 51,330,085 mwh 3. Southern Company Energy Marketing LP 42,940,259 mwh4. Aquila Energy Marketing Corp. 39,964,588 mwh5. Reliant Energy Services, Inc. 31,288,607 mwh6. El Paso Merchant Energy 22,339,315 mwh7. Entergy Power Marketing Corp. 18,201,513 mwh8. Constellation Power Source 16,466,585 mwh9. MIECO, Inc. 12,254,449 mwh10. Sempra Energy Trading 11,269,371 mwh11. Enron Power Marketing Inc. 9,305,833 mwh12. Williams Energy Marketing & Trading 7,722,926 mwh13. TXU Energy Trading 6,838,664 mwh14. New Energy Ventures, Inc. 6,822,925 mwh 15. HQ Energy Services 6,762,105 mwh16. LG&E Energy Marketing Inc. 6,505,649 mwh
Second Quarter 2000 Top Power Marketers
(source – PowerMarketers.com)
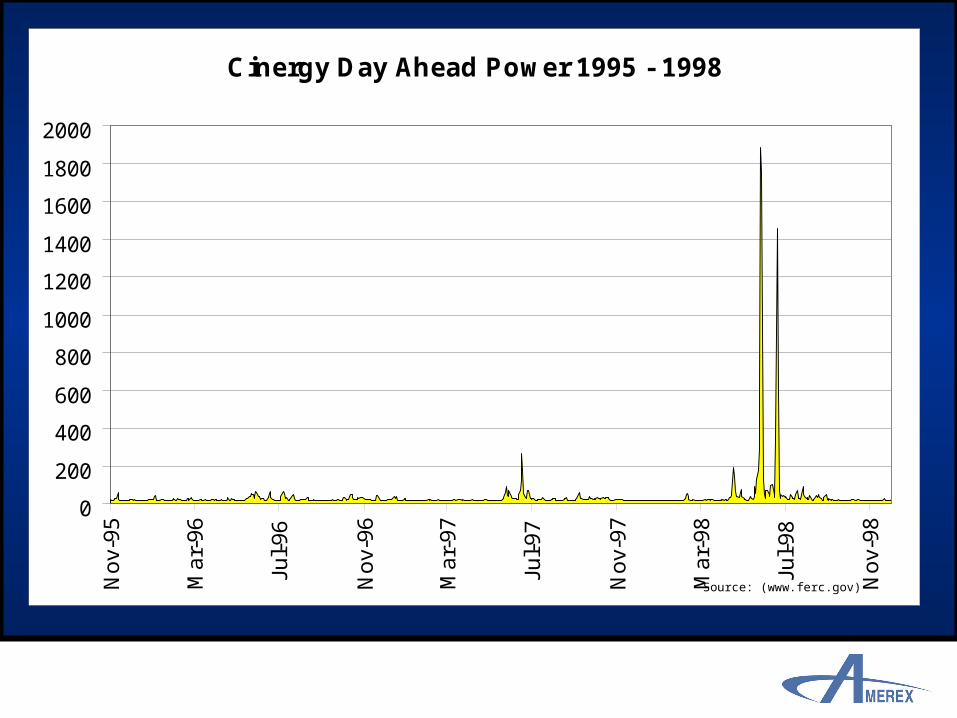
Cinergy Day Ahead Power 1995 - 1998
0
200
400
600
800
1000
1200
1400
1600
1800
2000N
ov-
95
Ma
r-9
6
Jul-
96
No
v-9
6
Ma
r-9
7
Jul-
97
No
v-9
7
Ma
r-9
8
Jul-
98
No
v-9
8
Source: (www.ferc.gov)

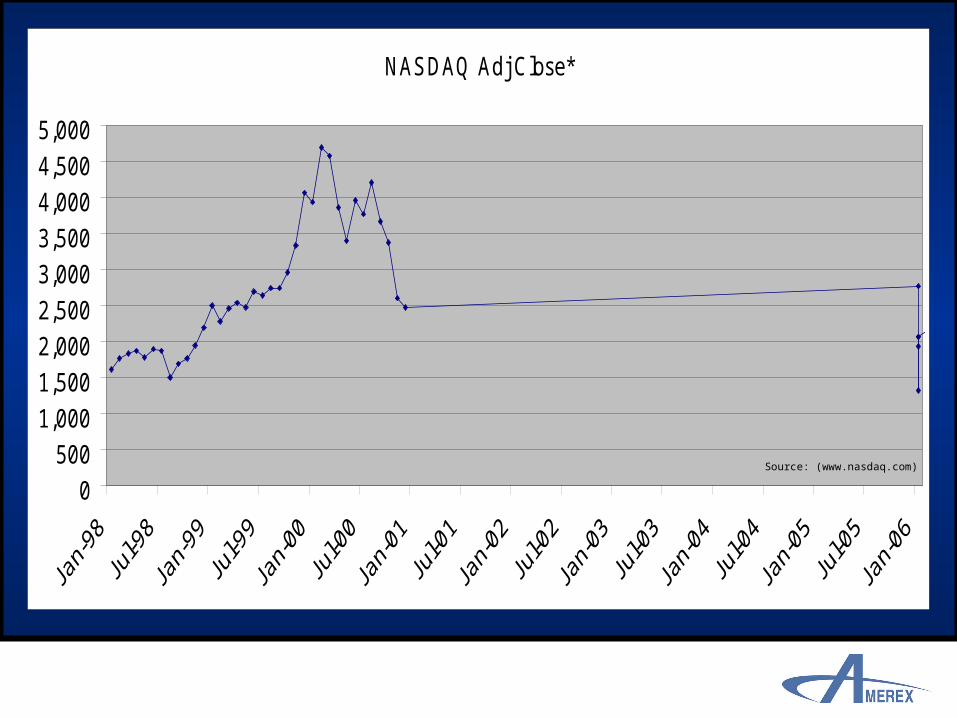
NASDAQ Adj Close*
0
500
1,000
1,500
2,000
2,500
3,000
3,500
4,000
4,500
5,000
Source: (www.nasdaq.com)

Current market expansion
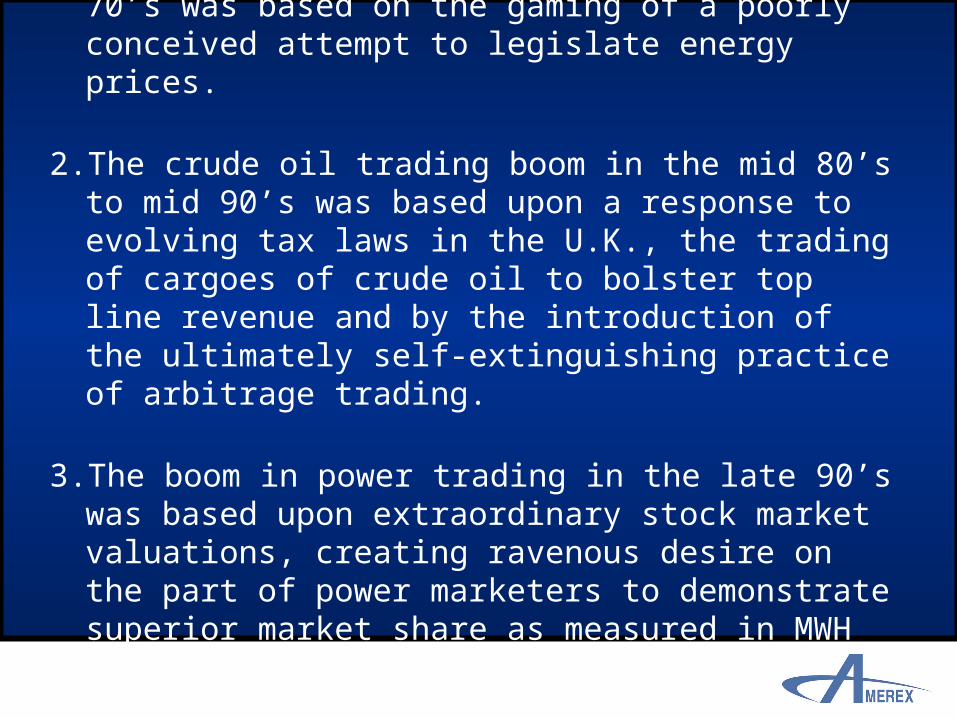
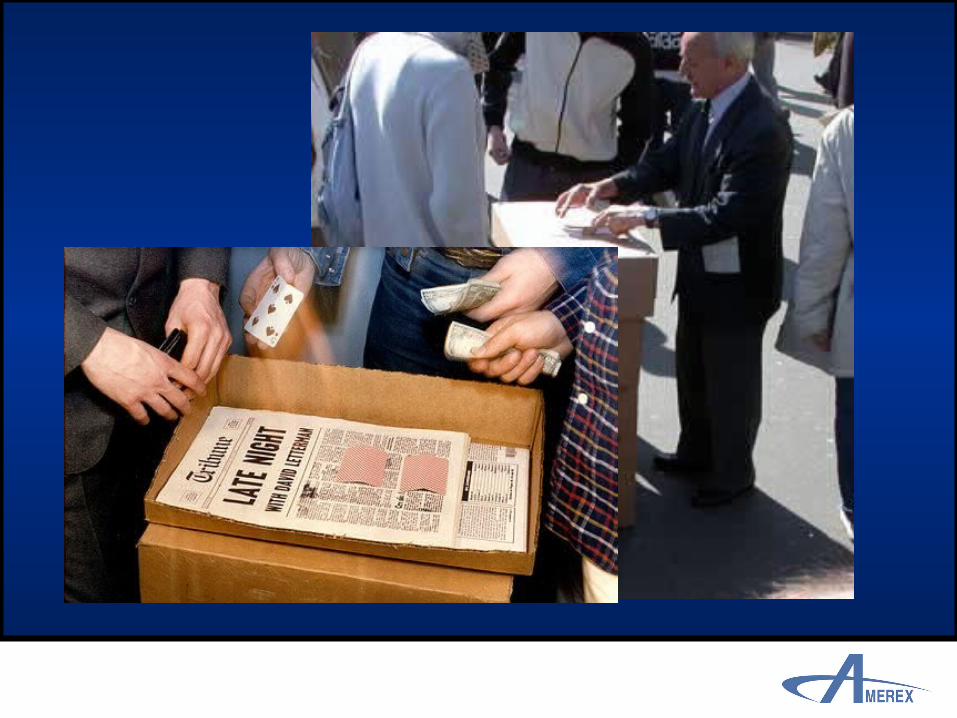
1. The crude oil trading boom of the late 70’s was based on the gaming of a poorly conceived attempt to legislate energy prices.
2. The crude oil trading boom in the mid 80’s to mid 90’s was based upon a response to evolving tax laws in the U.K., the trading of cargoes of crude oil to bolster top line revenue and by the introduction of the ultimately self-extinguishing practice of arbitrage trading.
3. The boom in power trading in the late 90’s was based upon extraordinary stock market valuations, creating ravenous desire on the part of power marketers to demonstrate superior market share as measured in MWH traded.
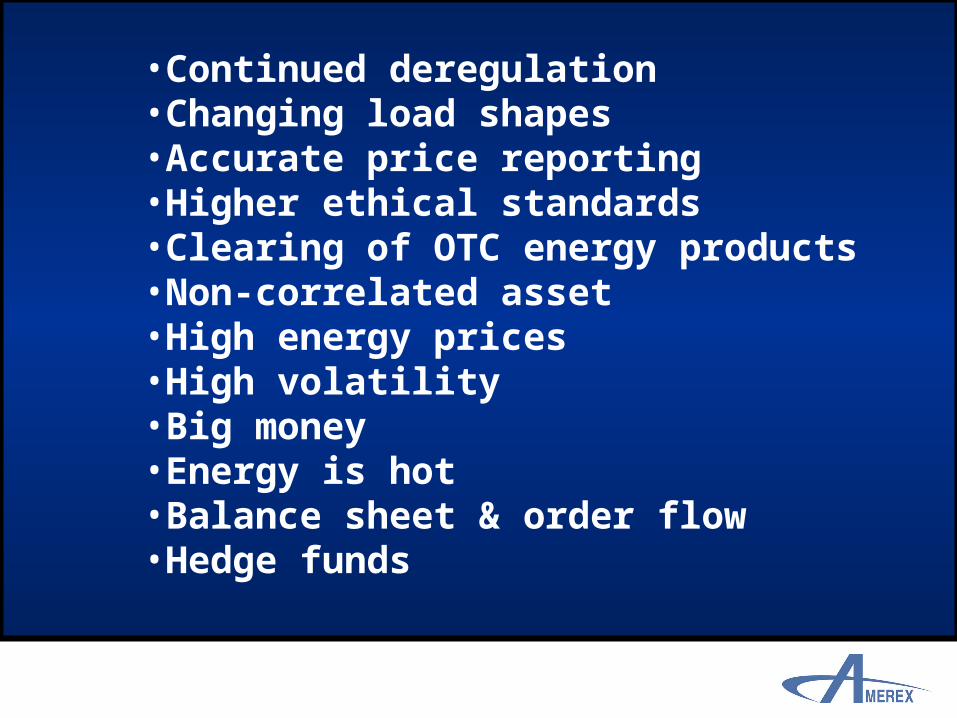
•Continued deregulation•Changing load shapes•Accurate price reporting•Higher ethical standards•Clearing of OTC energy products•Non-correlated asset•High energy prices•High volatility•Big money•Energy is hot•Balance sheet & order flow•Hedge funds

Where do we go from here?
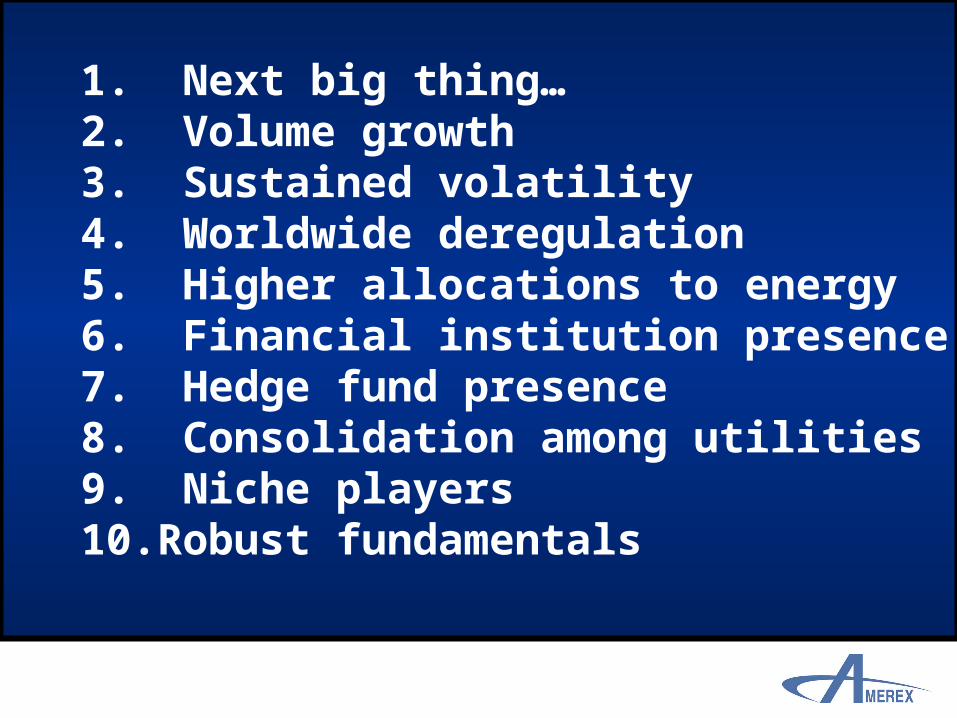
1. Next big thing…2. Volume growth3. Sustained volatility4. Worldwide deregulation5. Higher allocations to energy6. Financial institution presence7. Hedge fund presence8. Consolidation among utilities9. Niche players10.Robust fundamentals

We have just begun…