i s b usiness owners - home page | fiscal policy …€¦ · immigrant small business owners june...
TRANSCRIPT

I M M I G R A N T S M A L L B U S I N E S S
O W N E R S A S I G N I F I C A N T A N D G R O W I N G
P A R T O F T H E E C O N O M Y
A REPORT FROM THE FISCAL POLICY INSTITUTE’S IMMIGRATION RESEARCH INITIATIVE
WWW.FISCALPOLICY.ORG
JUNE, 2012

Immigrant Small Business Owners
June 2012
Core support for the Fiscal Policy Institute’s Immigration Research Initiative is provided by the Carnegie Corporation of New York.
The statements made and views expressed are solely the responsibility of the Fiscal Policy Insti-tute.

AcknowledgmentsThe principal author of Immigrant Small Busi-ness Owners is David Dyssegaard Kallick, se-nior fellow of the Fiscal Policy Institute (FPI) and director of FPI’s Immigration Research Initiative. James Parrott, FPI’s chief economist and deputy director, provided constant support and research guidance. The report was pre-pared under the oversight of Frank Mauro, the Fiscal Policy Institute’s executive director, who gave particularly valuable input on property tax issues. Research associate Jonathan De-Busk conducted extensive data analysis for the report and gave valuable input on the findings. Carolyn Boldiston, senior fiscal policy analyst, and Jo Brill, FPI’s communications director, gave helpful feedback throughout the research process.
The Immigration Research Initiative gratefully acknowledges the guidance of its expert advi-sory panel, which is listed in full on the final page of this report.
Particular thanks are also due to the dedicated staff of the Census Bureau and the Bureau of Labor Statistics.

Table of Contents
Acknowledgments
Executive Summary . . . . . . . . . . . . . . . . . . . . . . . . . . . . . . . . . . . . . . . . . . . . . . . . . 1 Introduction . . . . . . . . . . . . . . . . . . . . . . . . . . . . . . . . . . . . . . . . . . . . . . . . . . . . . . . 5
1. Small Businesses . . . . . . . . . . . . . . . . . . . . . . . . . . . . . . . . . . . . . . . . . . . . . . . . . 6
2. Small Business Owners . . . . . . . . . . . . . . . . . . . . . . . . . . . . . . . . . . . . . . . . . . . . 8
Conclusion . . . . . . . . . . . . . . . . . . . . . . . . . . . . . . . . . . . . . . . . . . . . . . . . . . . . . . . . 26
Appendix A . . . . . . . . . . . . . . . . . . . . . . . . . . . . . . . . . . . . . . . . . . . . . . . . . . . . . . . 27Definitions and data sources for immigrant small business owners
Appendix B . . . . . . . . . . . . . . . . . . . . . . . . . . . . . . . . . . . . . . . . . . . . . . . . . . . . . . . 29Full broad and detailed industries for immigrant small business owners
Appendix C . . . . . . . . . . . . . . . . . . . . . . . . . . . . . . . . . . . . . . . . . . . . . . . . . . . . . . . 31Broad and detailed industries by race/ethnicity of immigrants and by gender of U.S.- and foreign-born
Expert Advisory Panel for FPI’s Immigrant Research Initiative . . . . . . . . . . . . . . . 32
Immigrant Small Business Owners
FPI June 2012 1
Executive SummaryImmigrant entrepreneurship is widely recog-nized as an important aspect of the economic role immigrants play. Surprisingly, until now, there has been relatively little basic informa-tion available about the number and character-istics of immigrant small business owners.
This report breaks new ground in identifying small immigrant businesses and immigrant small business owners. It gives a detailed profile of who immigrant business owners are, based primarily on two data sources: the Survey of Business Owners (SBO), looking at businesses with between 1 and 99 employees; and the American Community Survey (ACS), looking at people who own an incorporated business and whose main job is running that business.
Immigrant-owned small businesses: 4.7 million employees, $776 billion in receipts
Small businesses—firms with at least one and fewer than 100 people working for them—employed 35 million people in 2007, accord-ing to the most recent SBO, accounting for 30 percent of all private-sector employment.
Of these small businesses, firms for which half or more of the owners are immigrants employed an estimated 4.7 million people, 14 percent of all people employed by small business owners. These firms generated an esti-mated total of $776 billion in receipts in 2007, the most recent year for which these data are available.
18 percent of small business owners in the United States are immigrants
Looking at small business owners rather than small businesses, we can see that there are 900,000 immigrant small business owners in the United States, 18 percent of the 4.9 mil-
lion small business owners overall. These data come from the 2010 ACS, where we define business owners as people who own an incor-porated business and whose main job is to run that business.
The immigrant share of small business own-ers, at 18 percent, is higher than the immigrant share of the overall population (13 percent) and the immigrant share of the labor force (16 percent).
More than half—57 percent—of these small businesses have at least one paid employee in addition to the owner, the same share for both U.S.- and foreign-born business owners. And, of those with employees, the average number of employees is 13.6 (11.0 for immigrants, 13.9 for U.S.-born).*
More immigrant business owners in professional and business services than in any other sector
The largest number of immigrant business owners are in the professional and business services sector (141,000 business owners), followed by retail (121,000), construc-tion (121,000), educational and social ser-vices (100,000), and leisure and hospitality (100,000).
Within the broad sectors, the types of small businesses most commonly owned by immi-grant business owners are restaurants, physi-cian’s offices, real estate firms, grocery stores, and truck transportation services.
* Number of small business owners and the 1990 to 2010 trend are based on the 2010 ACS 1-year estimate. All other ACS data are from an ACS 2010 5-year esti-mates—which includes data from the years 2006-10—to allow for greater detail. Share of people who own an incorporated business and are self-employed, as well as average number of employees, are from CPS Contingent Work Supplement (2005).

2 FPI June 2012
Immigrant Small Business Owners
Immigrants are also playing a disproportion-ate role in some industries. The sector where immigrants make up the biggest share of small business owners is leisure and hospitality. Im-migrants represent 28 percent of small busi-ness owners in leisure and hospitality. Within leisure and hospitality, immigrants make up 43 percent of hotel and motel owners, and 37 percent of restaurant owners.
Other types of businesses where immigrants are strongly overrepresented include taxi service firms (65 percent of owners are immi-grants), dry cleaning and laundry services (54 percent), gas station owners (53 percent), and grocery store owners (49 percent). Interest-ingly, immigrants are underrepresented among construction business owners, though they are highly overrepresented among construction workers.
Immigrants are more likely to be business owners, but their businesses tend to be smaller
In all, immigrant small business owners had $63 billion in annual personal income, accord-ing to the ACS 5-year estimate, 15 percent of the $419 billion in personal earnings from small businesses overall (in wage and salary plus proprietor’s earnings). Immigrant business owners tend to have smaller businesses than U.S.-born owners, as indicated by a smaller share of earnings than of the number of busi-ness owners.
30 percent of recent small business growth is due to immigrants
Over the past two decades, between 1990 and 2010, the number of small business owners grew by 1.8 million, from 3.1 to 4.9 million. Immigrants made up 30 percent of that growth, as the immigrant share of small business owners kept in step with the increasing im-migrant share of the labor force. As a result, there were 539,000 more immigrant small
business owners in 2010 than in 1990. In the Great Recession, both U.S.- and foreign-born small business owners suffered, but there is some indication that the number of small busi-ness owners is gradually beginning to increase again.
Mexicans make up biggest number of business owners, while immigrants from Middle East, Asia, and Southern Europe playing a dispro-portionate role
Mexican immigrants are less likely than other groups to be small business owners, perhaps in part because a high share of Mexican immi-grants are not legally authorized to work in the United States.
Yet there are nonetheless more small business owners from Mexico than from any other sin-gle country. This is no surprise, perhaps, given the size of the Mexican population, though this does not seem to be the common image of immigrant small business owners. Immigrants born in Mexico make up 12 percent of im-migrant small business owners, followed by immigrants born in India, Korea, Cuba, China, and Vietnam.
Immigrants from some countries—including some with relatively small numbers in the overall population—are disproportionately likely to be business owners. Immigrants from the Middle East, Asia, and Southern Europe are particularly inclined toward business own-ership. Immigrants from Greece, for example, are a tiny fraction of all immigrants in the la-bor force, but 16 percent of Greek immigrants in the labor force are business owners—the highest share of any group. Immigrants born in Israel/Palestine (the Census does not disag-gregate the two) are the group with the second-highest rate of business ownership, followed by Syria, Iran, Lebanon, Jordan, Italy, Korea, South Africa, Ireland, Iraq, Pakistan, and Tur-key.

Immigrant Small Business Owners
FPI June 2012 3
The overall rate of small business ownership for immigrants is 3.5 percent, and for U.S.-born it is 3.3 percent.
Immigrants who have been here longer are more likely to own businesses
As immigrants develop roots and become more established in the United States, they become correspondingly more likely to own a business. Immigrants who have been here for over 10 years are more than twice as likely to be small business owners as those who have been here for 10 years or less. That is particularly true for some groups. For example, just 2 percent of more recently arrived immigrants from India are small business owners, while 9 percent of longer-established immigrants from India are small business owners.
Most immigrant business owners do not have a college degree
There has been a great deal of focus in national immigration debates on whether preferences should be given to highly educated immi-grants. In relation to entrepreneurship, indeed, better-educated immigrants are more likely to be business owners: 5.4 percent of immigrants with a college degree or more are business owners, compared to 2.8 percent of those with-out a college degree.
Yet, the majority of immigrant small business owners, like the majority of their U.S.-born counterparts, do not have a college degree. Fifty-eight percent of immigrant small busi-ness owners do not have a degree, about the same as for U.S.-born small business owners (56 percent).
Immigrant business owners are most likely to be white, Asian, or Latino
Among immigrant business owners, roughly equal numbers are white (34 percent), Asian
(31 percent), and Latino (28 percent), with another 5 percent blacks and 2 percent identi-fying their race as “other.”
White and Asian immigrants are considerably more likely to be small business owners than black or Latino immigrants—and, indeed, also much more likely than U.S.-born work-ers. Among immigrants in the labor force, 6.8 percent of whites and 4.7 percent of Asians are small business owners. By contrast, 2.0 percent of Latino immigrants in the labor force and 2.1 percent of black immigrants are small business owners. The share for U.S.-born overall is 3.3 percent, and for U.S.-born whites, the high-est among U.S.-born groups, the figure is 3.8 percent.
Immigrant women closing the ownership gap
Immigrant women are playing a particularly important role as small business owners.
Women are underrepresented as business owners among both immigrants and U.S.-born workers. However, the gender gap is slightly lower among immigrants than among U.S.-born women. Twenty-nine percent of foreign-born business owner are women, as are 28 percent of U.S.-born business owners. Both U.S.- and foreign-born women have made modest progress toward closing this gender gap: In 1990, 24 percent of U.S.-born business owners were women, as were 26 percent of foreign-born business owners.
Foreign-born women in all racial/ethnic groups are at least slightly more likely than their U.S.-born counterparts to be small business owners. Foreign-born white and Asian women are par-ticularly likely to be small business owners.

4 FPI June 2012
Immigrant Small Business Owners
Immigrant business owners in the 25 largest metropolitan areas and 50 states
Immigrant business owners are playing a big-ger role in some parts of the country than oth-ers. Among the 25 largest metropolitan areas, Miami has the largest immigrant share of busi-ness owners: 45 percent of business owners in metro Miami are immigrants. This is followed by metro Los Angeles (44 percent), metro New York (36 percent), and metro San Francisco (35 percent). In virtually all metro areas, the ratio of immigrant small business ownership to U.S.-born business ownership is quite close. It is 1.1 overall, meaning that immigrants are 10 percent more likely than U.S.-born workers to be small business owners.
Among the 50 states plus the District of Co-lumbia, the highest concentration of immigrant business owners is in California, where a third (33 percent) of all small business owners are immigrants. California is followed by New York, New Jersey, Florida, and Hawaii. Ari-zona, a state that has been much in the news in recent months due to a controversial state immigration enforcement law, is 15th on this list, there are a total of 16,000 immigrant small business owners in Arizona.
Immigrant small business owners are playing a large role in today’s economy, a role that has grown over the past 20 years in step with the increasing immigrant share of the labor force. Immigrant small business owners contribute to economic growth, to employment, and to producing the goods and services that support our standard of living.
With one in six small business owners being born in another country, it is clear that immi-grants are an important part of America’s small business environment. Immigrants bring ideas, connections to new markets, and a spirit of en-trepreneurship with them to the United States. Understanding who the one million immigrant
small business owners are—what countries they come from, what kinds of businesses they own, their level of educational attainment, and more—can only help as the country struggles to achieve a better set of immigration policies.

Immigrant Small Business Owners
FPI June 2012 5
IntroductionOverview
Immigrant entrepreneurship is widely recog-nized as an important aspect of the economic role immigrants play. Surprisingly, until now, there has been little comprehensive analysis of the number and characteristics of immigrant business owners.
This report will use look at two different angles on immigrant entrepreneurship, using two related data sets.
First, we look at small businesses—firms with at least one but fewer than 100 employees. What share are these small businesses of the overall economy, and what is the role of im-migrants in them?
Second—and for the larger part of this re-port—we look at the immigrant small business owners. Who are immigrant small business owners: what countries do they come from, what is their level of educational attainment, what kinds of businesses do they own? To get this demographic information, we focus on people who own an incorporated business and whose main job is to run that business.
These two concepts—small businesses and small business owners—are closely related but not identical. For a detailed discussion of the data sources from which they are drawn, see Appendix A.
Note: Throughout this report, the terms “im-migrant” and “foreign-born” are used inter-changeably. Data about immigrants refers to people residing in the United States who were born in another country, regardless of their legal status. The data does not separate docu-mented from undocumented immigrants; how-ever, the number of undocumented immigrants who own a business is likely to be relatively
small, and those who own an incorporated business smaller still.
When looking at race and ethnic groups, “White” refers to non-Hispanic white, “black” to non-Hispanic black, and “Asian” to non-Hispanic Asian. The terms “Latino” and “Hispanic” are used interchangeably, as is the practice in the Census data.

6 FPI June 2012
Immigrant Small Business Owners
*The SBO reports 117 million people employed by firms. This is nearly the same number shown in the Cur-rent Employment Statistics from 2007 as total private-sector employment—115 million; in both cases 35 million is a 30 percent share.
1. Small businessesSmall businesses—privately held firms with between 1 and 99 employees—are an impor-tant part of the nation’s economy. In all, 35 million people work for these small businesses, according to the Survey of Business own-ers (SBO), conducted every five years, most recently in 2007. This represents 30 percent of the 117 million people the SBO reports work-ing for all businesses—publicly held, nonprof-it, and privately held firms.* [Figure 1.]
And, small businesses are responsible for $6 trillion in receipts in 2007, or 21 percent of the $29 trillion total receipts of all businesses.
The balance of the private-sector economy—about two thirds of private-sector workers and about 80 percent of receipts—is made up of publicly held companies (the largest share), privately held businesses with over 100 em-ployees, nonprofit employers (such as hospi-tals, churches; or civic groups), and people who are self-employed but do not have a busi-ness with employees. Within this small business sector, immigrants are playing an important role. Small busi-nesses where half or more of the owners are immigrants generated at least $591 billion in receipts in 2007. For more than a quarter of firms, however, the nativity of the ownership is not reported to the SBO. A likely overall esti-mate of receipts by firms in which immigrants are at least half of the ownership is $776 bil-lion. This figure is calculated by applying the share of receipts for which nativity of owners is known (13 percent) to the receipts for which nativity is not known. [Figure 2.]
Small businesses
• 35 million people work for small busi-nesses—firms with at least one but under 100 employees. This represents 30 per-cent of total private-sector employment.
• Small businesses where immigrants make up half or more of the owners gen-erated an estimated $776 billion in an-nual receipts (and at least $591 billion).
• Small businesses where immigrants make up half or more of the owners em-ployed an estimated total of 4.7 million employees, and employed at least 3.5 million people.
Figure 1. Source: Fiscal Policy Institute analysis of Survey of Business Owners (SBO) 2007. Note: Some firms that are classified as having employees had zero employees at the date of the survey—shown in the bottom row.
Small businesses make up nearly a third of private-sector employment2007 SBOFirms with employees at date of survey Firms
(1,000)Receipts (trillions)
Employment (millions)
Payroll (billions)
All firms classifiable by characteristics of owners (privately held firms) 4,615 $9.9 57 $1,911
1-99 employees (small businesses) 4,551 $6.0 35 $1,180100-499 employees 57 $1.9 11 $381500 or more 7 $1.9 11 $350
Publicly held firms, nonprofits, and others not classifiable by ownership 502 $19.0 61 $2,876Total with employees at time of survey 5,116 29 117 4,787Small businesses (1-99 employees) as a share of all firms with employees 89% 21% 30% 25%
Firms with employees that had no employees as of date of survey 619 $0.2 0 $35

Immigrant Small Business Owners
FPI June 2012 7
And, small businesses with half or more of the ownership foreign-born employed at least 3.5 million people, and a likely estimate is 4.7 mil-lion (again applying the proportions of cases where nativity of owners is known to those where it is not known). Firms where half or more of the owners are immigrants account for 14 percent of employment among those firms where ownership is known. [Figure 3.]
Receipts in billions
Share of those with
known nativity
of owners
Majority native-born $3,971 87%Immigrant ownership at least half $591 13%
Majority foreign-born $517 11%Equally foreign-/native-born $74 2%
Foreign-born status indeterminate $1,427Additional foreign-born, if indeterminate follows same pattern $185
Estimated total foreign-born ownership $776Total of privately owned firms with 100 employees or fewer $5,989
Employment
Share of those with
known nativity
of ownersMajority native-born 22,214,104 86%Immigrant ownership at least half 3,478,441 14%
Majority foreign-born 2,965,561 12%Equally foreign-/native-born 512,880 2%
Foreign-born status indeterminate 9,350,796Additional foreign-born, if indeterminate follows same pattern 1,265,978
Estimated total foreign-born ownership 4,744,419Total of privately owned firms with 100 employees or fewer 35,043,340
$776 billion in estimated receipts of immigrant-owned businesses2007 SBO
4.7 million estimated employees of immigrant-owned firms2007 SBO
Figure 2. Fiscal Policy Institute analysis of Survey of Business Owners (SBO) 2007.
Figure 3. Source: Fiscal Policy Institute analysis of Survey of Business Owners (SBO) 2007.

8 FPI June 2012
Immigrant Small Business Owners
2. Small business ownersTo look at the detailed demographic and other characteristics of business owners, we will turn to the American Community Survey. Here, we define small business owners as people who own an incorporated business and whose main job is to run that business. More than half have at least one employee—57 percent, according to the Current Population Survey Contingent Work Supplement from 2005 (a figure that is the same for U.S.- and foreign-born).
Among those firms with at least one paid employee, the average number of people em-ployed is 13.6 (11.0, for foreign-born business owners, and 13.9 for U.S.-born owners). Ef-fectively all of these are businesses with under 100 employees (98 percent for foreign-born owners, 99 percent for U.S.-born owners, for a total of 99 percent overall). We will thus refer to them here as small business owners.
Of the 4.9 million small business owners in the United States, 18 percent, or 900,000, are immigrants, according to the American Com-munity Survey (ACS) 2010.
The immigrant share of business owners is thus considerably higher than the immigrant share of the population (13 percent), and slightly higher than the immigrant share of the overall labor force (16 percent). [Figure 4.]
The following sections will focus in some depth on this population of immigrant business owners. Where we look at trends—and in the data for figure 3—we use the ACS single-year estimates. To delve more fully into details such as country of origin and level of educational attainment we will rely on the ACS 5-year esti-mates, a cross-sectional data sample that com-bines the years 2006 to 2010, giving sufficient sample size to retain statistical significance in looking at small populations.
Small business owners
• Of the 4.9 million small business own-ers in the United States, 900,000, or 18 percent, are immigrants.
• Immigrant share of business owners is higher than immigrant share of the popu-lation (13 percent) and of the labor force (16 percent).
• Immigrant business owners have $63 billion in annual earned income, 15 per-cent of the $419 billion of earned income of business owners overall.
• The majority of these (57 percent) are small businesses with at least one em-ployee. Virtually all have fewer than 100 employees. Among those with at least one employee, the average number employed is 11 for immigrant business owners and 14 for U.S.-born business owners.
900,000 immigrant business owners2010 ACS
Figure 4. Source: Fiscal Policy Institute analysis of the 2010 American Community Survey (ACS), 1-year estimate. “Population” is total population, all ages. Labor force is civilian labor force 16 years and older.
Population Labor ForceBusiness
ownersUS-Born 269,432,814 130,511,865 4,035,346Foreign-Born 39,916,875 25,461,093 899,842Total 309,349,689 155,972,958 4,935,188Foreign-born share 13% 16% 18%

Immigrant Small Business Owners
FPI June 2012 9
Figure 5.Source: FPI analysis of 2010 ACS 5-year estimate. Note that the 5-year estimate shows a total of 17 percent of all small business owners are immigrants, while the 2010 1-year estimate shows an 18 percent share.
Types of businesses of immigrant business owners
Immigrant small business owners are play-ing an important role among a wide variety of industries.
The largest number of immigrant business owners are in professional and business ser-vices, with 141,000 immigrant small busi-ness owners. This is followed by retail trade (122,000), construction (121,000), educational and social services (100,000), and leisure and hospitality (100,000), according to the ACS 2010 5-year estimate. [Figure 5.]
The highest concentration of immigrants are in leisure and hospitality (where immigrants make up a large share of hotel and restaurant owners), with immigrant business owners making up 28 percent of the total. Immigrants make up 26 percent of business owners in transportation and warehousing, and 22 percent in retail trade.
To a surprising extent, immigrants are spread across all the broad occupational categories: immigrants make up between 12 and 28 per-cent of small business owners in every broad industrial category except agriculture and min-ing.*
To get a finer-grained sense of the types of businesses owned by immigrants, Figure 6 shows the top 10 detailed industries of immi-grant small business owners.
Type of businesses owned by immigrant business owners2010 ACS 5-year estimate
* Note that the 2010 5-year estimate shows immigrants having a 17 percent overall share of small business own-ers, while the 2010 1-year estimate shows an 18 percent share. This may be because of a slight uptick in recent years, although such a small difference should be read with caution.
Small business ownership by broad industry
US-BornForeign-
Born All
Foreign-born
shareProfessional and business services 926,677 140,945 1,067,622 13%Retail trade 433,530 121,694 555,224 22%Construction 737,505 121,076 858,581 14%Educational, health and social services 396,928 100,014 496,942 20%Leisure and hospitality 254,833 99,710 354,543 28%Other Services 260,875 68,687 329,562 21%Finance, insurance, and real estate 439,580 60,489 500,069 12%Transportation and warehousing 140,623 48,658 189,281 26%
Wholesale trade 183,834 47,180 231,014 20%
Manufacturing 237,552 41,449 279,001 15%Information and communications 62,150 8,444 70,594 12%Agriculture, forestry, fishing and hunting 141,124 6,938 148,062 5%Mining 15,528 515 16,043 3%Total 4,230,749 865,799 5,096,548 17%
Foreign-Born
Foreign-born share
Restaurants and other food services 76,915 37% Offices of physicians 37,072 26% Real estate 34,964 13% Grocery stores 23,599 49% Truck transportation 21,434 20% Computer systems design and related services 20,000 20% Management, scientific, and technical consulting services
19,55611%
Services to buildings and dwellings 18,979 24% Automotive repair and maintenance 18,328 17% Landscaping services 16,708 17%All other 578,244 15%Total 865,799 17%
Top 10 businesses of immigrant business owners (detailed industry)2010 ACS 5-year estimate
Figure 6.Source: FPI analysis of 2010 ACS 5-year estimate. (No detailed industries for construction—see text.)
10 FPI June 2012
Immigrant Small Business Owners
Perhaps unsurprisingly, there are more immi-grant restaurant owners than any other cat-egory of small business owners. It may be less obvious, however, that the next two categories of small business owners are doctors (physi-cians with their own practice) and real estate businesses. Grocery stores, truck transporta-tion, computer systems design, management consulting, building services, automotive repair, and landscaping fill out the top 10 list.
Construction is excluded from this list, since there are no detailed industries in the ACS industry breakdown. It is also worth noting that some broad industries give far greater detail than others. There are 279,000 immigrants with small businesses in manufacturing, for example, but no single detailed category makes the top 10 list, because the detailed industry categories are so specific. See Appendix B for a full list of detailed industry categories and how they fit into the broad industries.
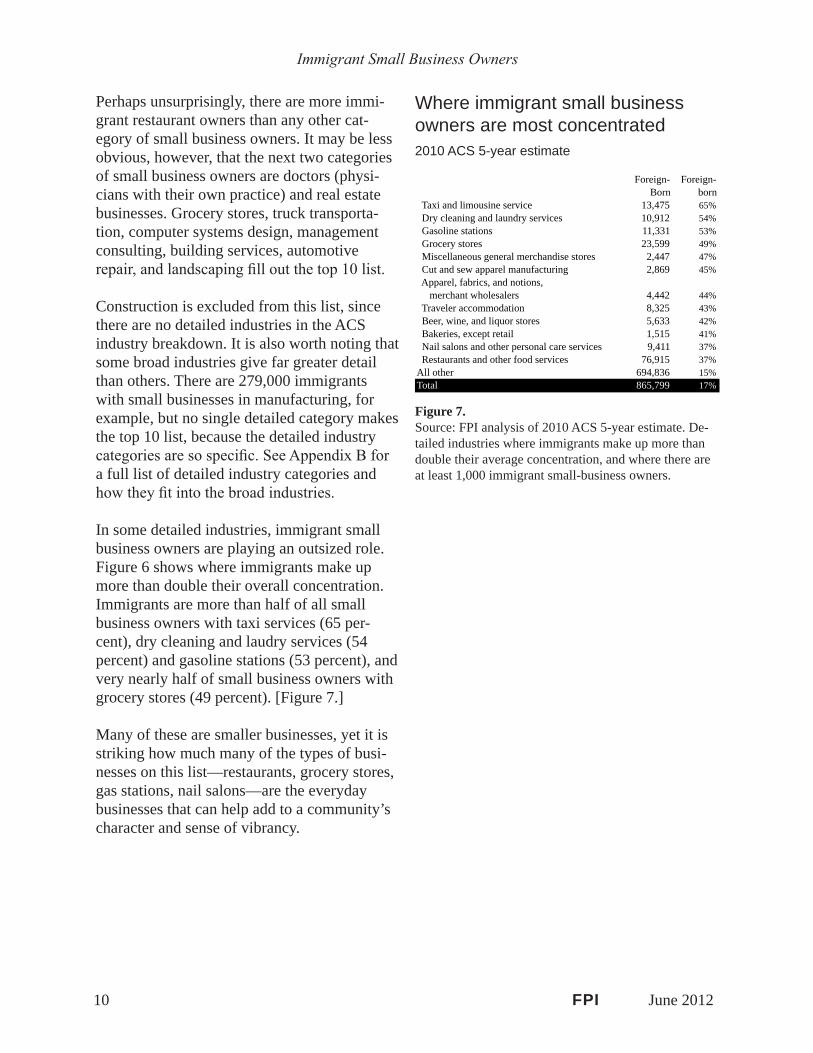
In some detailed industries, immigrant small business owners are playing an outsized role. Figure 6 shows where immigrants make up more than double their overall concentration. Immigrants are more than half of all small business owners with taxi services (65 per-cent), dry cleaning and laudry services (54 percent) and gasoline stations (53 percent), and very nearly half of small business owners with grocery stores (49 percent). [Figure 7.]
Many of these are smaller businesses, yet it is striking how much many of the types of busi-nesses on this list—restaurants, grocery stores, gas stations, nail salons—are the everyday businesses that can help add to a community’s character and sense of vibrancy.
Where immigrant small business owners are most concentrated2010 ACS 5-year estimate
Figure 7.Source: FPI analysis of 2010 ACS 5-year estimate. De-tailed industries where immigrants make up more than double their average concentration, and where there are at least 1,000 immigrant small-business owners.
Foreign-Born
Foreign-born
Taxi and limousine service 13,475 65% Dry cleaning and laundry services 10,912 54% Gasoline stations 11,331 53% Grocery stores 23,599 49% Miscellaneous general merchandise stores 2,447 47% Cut and sew apparel manufacturing 2,869 45% Apparel, fabrics, and notions, merchant wholesalers 4,442 44% Traveler accommodation 8,325 43% Beer, wine, and liquor stores 5,633 42% Bakeries, except retail 1,515 41% Nail salons and other personal care services 9,411 37% Restaurants and other food services 76,915 37%All other 694,836 15%Total 865,799 17%
Immigrant Small Business Owners
FPI June 2012 11
Earnings of immigrant small business owners
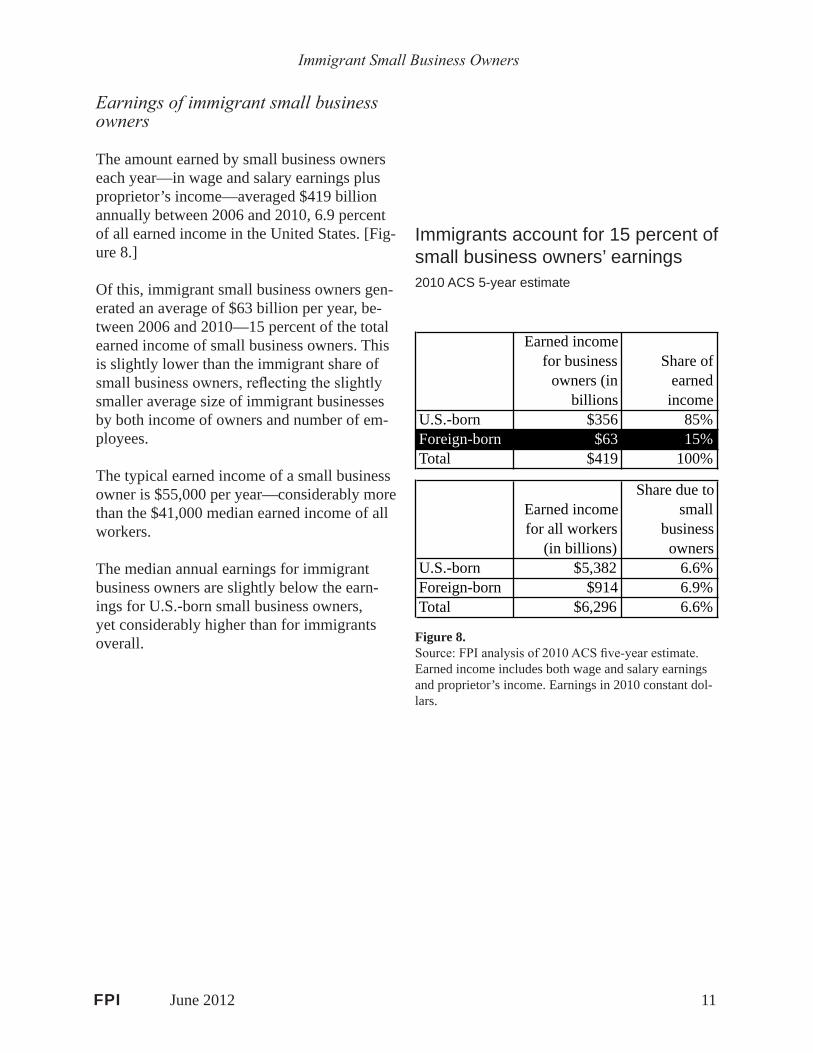
The amount earned by small business owners each year—in wage and salary earnings plus proprietor’s income—averaged $419 billion annually between 2006 and 2010, 6.9 percent of all earned income in the United States. [Fig-ure 8.]
Of this, immigrant small business owners gen-erated an average of $63 billion per year, be-tween 2006 and 2010—15 percent of the total earned income of small business owners. This is slightly lower than the immigrant share of small business owners, reflecting the slightly smaller average size of immigrant businesses by both income of owners and number of em-ployees.
The typical earned income of a small business owner is $55,000 per year—considerably more than the $41,000 median earned income of all workers.
The median annual earnings for immigrant business owners are slightly below the earn-ings for U.S.-born small business owners, yet considerably higher than for immigrants overall.
Earned income for business
owners (in billions
Share of earned
incomeU.S.-born $356 85%Foreign-born $63 15%Total $419 100%
Earned income for all workers
(in billions)
Share due to small
business owners
U.S.-born $5,382 6.6%Foreign-born $914 6.9%Total $6,296 6.6%
Figure 8.Source: FPI analysis of 2010 ACS five-year estimate. Earned income includes both wage and salary earnings and proprietor’s income. Earnings in 2010 constant dol-lars.
Immigrants account for 15 percent of small business owners’ earnings2010 ACS 5-year estimate

12 FPI June 2012
Immigrant Small Business Owners
In industry after industry, immigrant small business owners earn less than U.S.-born small business owners (the one exception is in educational, health and social services, where a high concentration of foreign-born doctors may help push immigrant earnings higher than U.S.-born). Overall, immigrant small business owners earn 84 percent of the earnings of U.S.-born small business owners. [Figure 9.]
Median earnings for foreign-born business
owners
Compared to median
earnings for U.S.-born
business owners
Compared to median
earnings for foreign-born
overall industry (employees and
business owners)
Agriculture, Forestry, Fishing and Hunting $38,482 0.95 1.83Mining $71,508 0.94 1.32Construction $45,571 0.86 1.56Manufacturing $50,820 0.85 1.57Wholesale Trade $54,000 0.83 1.60Retail Trade $39,334 0.83 1.40Transportation and Warehousing $39,600 0.81 1.05Information and Communications $56,368 0.93 0.95Finance, Insurance, Real Estate, and Rental and Leasing $60,762 0.86 1.31Professional, Scientific, Management, Administrative, and Waste Services $60,000 0.82 1.46Educational, Health and Social Services $108,160 1.08 2.70Arts, Entertainment, Recreation, Accommodations, and Food Services $40,000 0.92 1.79Other Services, Except Public Administration $30,386 0.76 1.25Total $48,609 0.84 1.50
Figure 9.Source: FPI analysis of 2010 ACS five-year estimate. Utilities and Public Administration deleted from chart. Wages are for full-time (35+ hours), year-round (50 weeks/year) workers with at least $100 in annual earnings. Medians include wage and salary earnings and proprietors’ earnings. Proprietors’ earnings does not significantly affect overall earnings. Earnings in 2010 constant dollars.
Immigrant small business owners earn more than immigrants overall, but less than U.S.-born small business owners2010 ACS 5-year estimate
Although immigrant business owners may not be doing as well as U.S.-born business own-ers, they are doing considerably better than the overall average for immigrant workers. At $49,000 a year, median earnings for immigrant small business owners are 50 percent higher for immigrants overall, and immigrant small business owners have higher earnings than immigrant workers overall in every industry except information and communications.

Immigrant Small Business Owners
FPI June 2012 13
12%
18%
9%
16%
0%
2%
4%
6%
8%
10%
12%
14%
16%
18%
20%
1990 2000 2010
Immigrant share of self-employed incorporated
Immigrant share of labor force
Immigrant share of small business owners has grown in step with immi-grant share of the labor force1990 and 2000 Census and 2010 ACS
Figure 10.Source: FPI analysis of 1990 and 2000 Census; 2010 ACS (single year).
Immigrant labor force and immigrant small business ownership grow in sync
In 1990, immigrants made up 9 percent of the labor force and 12 percent of small business owners. As immigration grew over the subse-quent 20 years, immigrant share of both labor force and small business owners grew with it. By 2010, immigrants made up 16 percent of the labor force, and 18 percent of small busi-ness owners. [Figure 10.]
Between 1990 and 2010, the number of immi-grant small business owners grew by 539,000, making up 30 percent of the overall growth of 1.8 million small business owners in that period. [Figure 11.]
1990 2000 2010
Change 1990 to
2010U.S.-born 2,757,209 3,525,250 4,035,346 1,278,137Foreign-born 361,291 556,747 899,842 538,551Total 3,118,500 4,081,997 4,935,188 1,816,688
Share of growth due to foreign-born 30%
30 percent of the growth in number of small business owners is due to immigrants, 1990 to 20101990 and 2000 Census and 2010 ACS
Figure 11.Source: FPI analysis of 1990 and 2000 Census; 2010 ACS (single year).

14 FPI June 2012
Immigrant Small Business Owners
361
557
809 853 868 866
842
900
0
100
200
300
400
500
600
700
800
900
1,000
1990 2000 2005 2006 2007 2008 2009 2010
Tho
usan
ds
Immigrant small business ownership peaks and the Great Recession1990 and 2000 Census; ACS 1-year estimatesin thousands
Figure 12.Source: FPI analysis of 1990 and 2000 Census; 2010 ACS (single year).
The severity of the Great Recession gives rise to a natural question about what has happened to immigrant small business owners in the years after the economic peak.
Figure 12 shows that immigrant small business ownership rose to a peak of 868,000 in 2007, and declined in the subsequent years, reach-ing a low of 842,000 in 2009—the same trend as for U.S.-born small business owners (not shown here). There may be some uptick in the number of immigrant small business owners in 2010, as the economy begins slowly to recover, but for statistical reasons that uptick should read with caution until 2011 data are avail-able.*
* The increase shown between 2009 and 2010 must be read with caution due to differences between the 2009 ACS (which is weighted based on the 2000 Census plus estimated annual change) and the 2010 ACS (which is weighted based on the 2010 Census). Data from the 2010 ACS are fully comparable to data from the 1990 and 2000 Census.

Immigrant Small Business Owners
FPI June 2012 15
Immigrants from around the world
Immigrant small business owners come from countries around the world. Mexicans, who make up the largest single country of birth for immigrants, also make up the largest number of immigrant small business owners.
There are 105,000 Mexican-born small busi-ness owners in the United States, making up 12 percent of all immigrant small business own-ers. Seven percent of all small business own-ers were born in India, 6 percent in Korea, 4 percent in Cuba, 4 percent in China, 4 percent in Vietnam, 3 percent in Canada, 3 percent in Iran, 2 percent in the Philippines, and 2 percent in Italy. [Figure 13.]
There is a great deal of variation in the level of entrepreneurship for immigrants from different countries. Figure 14 shows how likely certain immigrants from different countries are to be small business owners. Immigrants from the Middle East, Asia, and Southern Europe are particularly likely to be small business owners, as are immigrants from South Africa.
The ten groups with the highest rate of small business ownership are Greece (16 percent of the Greek-born labor force are small busi-ness owners), Israel/Palestine (13 percent)*, Syria (12 percent), Iran (12 percent), Lebanon (11 percent), Jordan (11 percent), Italy (10 percent), Korea (10 percent), South Africa (9 percent), and Ireland (8 percent). After the top 10, the next three countries on the list are Iraq, Pakistan, and Turkey.
The ten countries with the lowest rates of small business ownership are Trinidad and Tobago (3 percent), Guyana, Jamaica, Dominican Repub-lic, Philippines, Honduras, El Salvador, Guate-mala, Haiti (all with 2 percent), and Mexico (1 percent).
*The Census Bureau gives data for Israel and Palestine combined, and does not distinguish between the two.
Number of immigrant
business owners
Share of immigrant
business owners
Share of immigrant
labor forceMexico 105,247 12% 31%India 62,526 7% 4%Korea 56,073 6% 2%Cuba 35,769 4% 2%China 34,181 4% 3%Vietnam 31,283 4% 3%Canada 27,648 3% 2%Iran 25,289 3% 1%Philippines 19,788 2% 5%Poland 17,448 2% 1%Italy 16,910 2% 1%Colombia 16,578 2% 2%Taiwan 15,729 2% 1%Germany 14,980 2% 1%El Salvador 13,858 2% 3%Pakistan 13,592 2% 1%England 13,524 2% 1%Greece 12,105 1% 0.3%Brazil 11,929 1% 1%Israel/Palestine 11,567 1% 0.4%Dominican Republic 11,451 1% 2%Jamaica 10,659 1% 2%Other USSR/Russia 9,406 1% 1%United Kingdom, ns 8,943 1% 1%Guatemala 8,907 1% 2%Peru 8,769 1% 1%Lebanon 8,432 1% 0.3%Argentina 7,961 1% 0.4%Ecuador 7,826 1% 1%Ukraine 7,745 1% 1%Japan 7,568 1% 1%Hong Kong 6,958 1% 1%Venezuela 6,706 1% 0.4%Romania 6,267 1% 0.4%Nigeria 6,000 1% 1%Ireland 5,713 1% 0.3%Haiti 5,579 1% 2%Egypt/United Arab Rep. 5,564 1% 0.3%Iraq 5,414 1% 0.3%Honduras 5,413 1% 1%Nicaragua 5,365 1% 1%South Africa 5,175 1% 0.2%Portugal 5,104 1% 0.4%Turkey 4,940 1% 0.3%France 4,813 1% 0.4%Thailand 4,640 1% 0.5%Trinidad and Tobago 4,196 0.5% 1%Guyana/British Guiana 4,124 0.5% 1%Syria 3,932 0.5% 0.1%Jordan 3,908 0.5% 0.1%All other countries 112,289 13.0% 12.0%Total 865,791 100% 100%
Top 50 countries of birth for immigrant small business owners2010 ACS 5-year estimate
Figure 13.Source: FPI analysis of 2010 ACS (five-year estimate).

16 FPI June 2012
Immigrant Small Business Owners
By way of comparison, small business owners make up about 3 percent of the U.S.-born labor force (3.3 percent), and very slightly more of the immigrant labor force overall (3.5 percent).
One factor that may reduce the rate of small business ownership for immigrants from Mexico is that a significant share of immi-grants from Mexico lack legal status to work in the United States.
According to Jeffrey Passel of the Pew Hispan-ic Center, 53 percent of immigrants from Mex-ico are not authorized to work in this country (as is true for 29 percent of immigrants overall, and 48 percent of Central Americans). It may be that Mexicans and Central Americans are as a result less likely to be small business owners. It may also be that immigrant business owners from Mexico and Central America are more likely to have unincorporated rather than incor-porated businesses. (Pew Hispanic Center cal-culations were made for this report, based on Jeffrey Passel and D’Vera Cohn, “Unauthor-ized Immigrant Population: National and State Trends, 2010,” Pew Hispanic Center 2011.)
One big factor in how likely immigrants are to be business owners is how long they have been in the United States. As immigrants be-come more established in this country, the also become more likely to have an incorporated business.
Immigrants who have been here for 10 years or more are considerably more likely than U.S.-born workers to own a small business.
Among immigrants who have been in the United States for 10 years or more, 4.4 percent own an incorporated business, compared to 3.3 percent for U.S.-born and 3.5 percent for immigrants who have been in the United States for less than 10 years. [Figure 15.]
Number of business owners
Number in labor force
Business owners as a
share of labor force
Greece 12,105 74,978 16%Israel/Palestine 11,567 87,748 13%Syria 3,932 32,479 12%Iran 25,289 213,760 12%Lebanon 8,432 74,747 11%Jordan 3,908 36,304 11%Italy 16,910 170,509 10%Korea 56,073 573,202 10%South Africa 5,175 56,201 9%Ireland 5,713 69,547 8%Iraq 5,414 66,264 8%Pakistan 13,592 166,582 8%Turkey 4,940 63,833 8%Argentina 7,961 109,121 7%Egypt/United Arab Rep. 5,564 81,313 7%Taiwan 15,729 230,928 7%England 13,524 205,093 7%Cuba 35,769 554,356 6%Venezuela 6,706 106,242 6%Canada 27,648 444,091 6%United Kingdom, ns 8,943 145,511 6%Romania 6,267 102,813 6%Poland 17,448 297,433 6%India 62,526 1,093,220 6%France 4,813 87,417 6%Germany 14,980 293,691 5%Portugal 5,104 102,687 5%Brazil 11,929 248,407 5%Hong Kong 6,958 150,871 5%Ukraine 7,745 172,495 4%Other USSR/Russia 9,406 209,836 4%Japan 7,568 169,412 4%China 34,181 813,492 4%Vietnam 31,283 765,074 4%Nigeria 6,000 146,744 4%Colombia 16,578 411,871 4%Thailand 4,640 121,572 4%Nicaragua 5,365 172,075 3%Peru 8,769 281,254 3%Ecuador 7,826 284,623 3%Trinidad and Tobago 4,196 157,032 3%Guyana/British Guiana 4,124 172,497 2%Jamaica 10,659 450,777 2%Dominican Republic 11,451 501,968 2%Philippines 19,788 1,142,099 2%Honduras 5,413 326,362 2%El Salvador 13,858 843,880 2%Guatemala 8,907 546,460 2%Haiti 5,579 371,867 2%Mexico 105,247 7,598,985 1%All immigrants 865,791 24,457,632 3.5%All U.S.-born 4,230,744 129,904,580 3.3%Total (all U.S. residents) 5,096,535 154,362,212 3.3%
Countries of birth with highest rates of business ownership2010 ACS 5-year estimate
Figure 14.Source: FPI analysis of 2010 ACS (five-year estimate).
Immigrant Small Business Owners
FPI June 2012 17
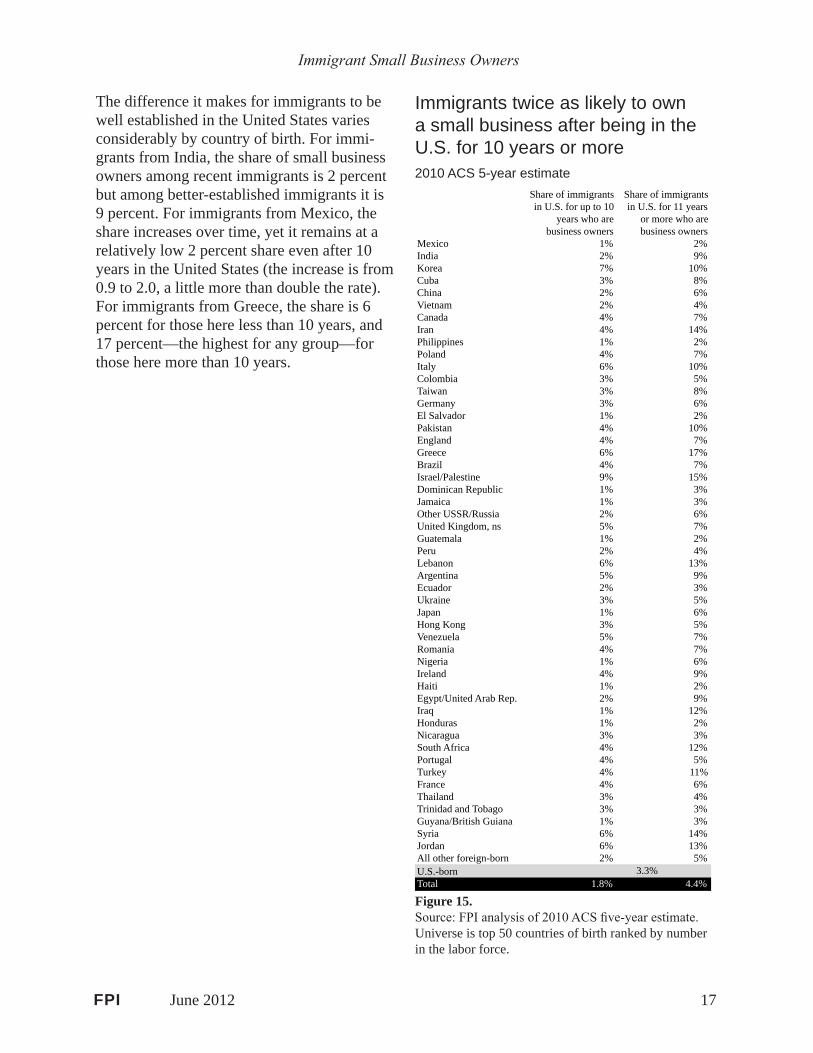
The difference it makes for immigrants to be well established in the United States varies considerably by country of birth. For immi-grants from India, the share of small business owners among recent immigrants is 2 percent but among better-established immigrants it is 9 percent. For immigrants from Mexico, the share increases over time, yet it remains at a relatively low 2 percent share even after 10 years in the United States (the increase is from 0.9 to 2.0, a little more than double the rate). For immigrants from Greece, the share is 6 percent for those here less than 10 years, and 17 percent—the highest for any group—for those here more than 10 years.
Immigrants twice as likely to own a small business after being in the U.S. for 10 years or more2010 ACS 5-year estimate
Figure 15.Source: FPI analysis of 2010 ACS five-year estimate. Universe is top 50 countries of birth ranked by number in the labor force.
Share of immigrants in U.S. for up to 10
years who are business owners
Share of immigrants in U.S. for 11 years
or more who are business owners
Mexico 1% 2%India 2% 9%Korea 7% 10%Cuba 3% 8%China 2% 6%Vietnam 2% 4%Canada 4% 7%Iran 4% 14%Philippines 1% 2%Poland 4% 7%Italy 6% 10%Colombia 3% 5%Taiwan 3% 8%Germany 3% 6%El Salvador 1% 2%Pakistan 4% 10%England 4% 7%Greece 6% 17%Brazil 4% 7%Israel/Palestine 9% 15%Dominican Republic 1% 3%Jamaica 1% 3%Other USSR/Russia 2% 6%United Kingdom, ns 5% 7%Guatemala 1% 2%Peru 2% 4%Lebanon 6% 13%Argentina 5% 9%Ecuador 2% 3%Ukraine 3% 5%Japan 1% 6%Hong Kong 3% 5%Venezuela 5% 7%Romania 4% 7%Nigeria 1% 6%Ireland 4% 9%Haiti 1% 2%Egypt/United Arab Rep. 2% 9%Iraq 1% 12%Honduras 1% 2%Nicaragua 3% 3%South Africa 4% 12%Portugal 4% 5%Turkey 4% 11%France 4% 6%Thailand 3% 4%Trinidad and Tobago 3% 3%Guyana/British Guiana 1% 3%Syria 6% 14%Jordan 6% 13%All other foreign-born 2% 5%U.S.-bornTotal 1.8% 4.4%
3.3%

18 FPI June 2012
Immigrant Small Business Owners
Most small business owners do not have a college degree
There has been considerable focus in national immigration debates about whether prefer-ences should be given to “highly educated” immigrants. Interestingly, however, most small business owners do not have a college degree.
The education level of immigrants is indeed an important predictor of the likelihood that they will own a small business. Six percent of immigrants with an advanced degree own a small business, as do five percent of those with a bachelor’s degree. By contrast, just two percent of those with less than a high school degree, three percent of those with high school, and four percent with some college but no degree are small business owners—similar to the ratios for U.S.-born small business owners. [Figure 16.]
On the other hand, it is important to note that immigrants with a college degree make up less than half of all immigrant small business owners. The clear majority (58 percent) of im-migrant small business owners have less than a college degree—15 percent with less than high school, 21 percent with a high school degree and no more, and 22 percent with some college but no degree. This is not particular to immi-grants: it is also the case that most U.S.-born small business owners (56 percent) do not have a college degree.
Indeed, the educational profile of U.S.-born small business owners is in general not very different from that of immigrants. The big-gest contrast is that just 4 percent of U.S.-born business owners have less than a high school degree, whereas 15 percent of foreign-born business owners have less than a high school degree—due primarily to the fact that people with less than high school are a bigger share of the immigrant labor force.
Figure 16.Source: FPI analysis of 2010 ACS five-year estimate. Universe is in the civilian labor force, 16 years and older.
Most small business owners—whether immigrants or U.S.-born—do not have a college degree2010 ACS 5-year estimate
Business owners as share of education level
US-BornForeign-
BornLess than HS 2% 2%High school 3% 3%Some College 3% 4%Total with less than a college degree 2.6% 2.8%Bachelors 4% 5%Advanced Degree 6% 6%Total with college degree 4.9% 5.4%Total 3.3% 3.5%
Business owners by education
US-BornForeign-
BornLess than HS 4% 15%High school 22% 21%Some College 30% 22%Total with less than a college degree 56% 58%Bachelors 26% 22%Advanced Degree 18% 20%Total with college degree 44% 42%Total 100% 100%
Civilian labor force by education level
US-BornForeign-
BornLess than HS 9% 29%High school 28% 23%Some College 34% 20%Total with less than a college degree 71% 72%Bachelors 19% 16%Advanced Degree 10% 12%Total with college degree 29% 28%Total 100% 100%

Immigrant Small Business Owners
FPI June 2012 19
Immigrant entrepreneurship by race/ethnicity and by gender
Among U.S.-born small business owners, the overwhelming majority are white. Ninety percent of all U.S.-born business owners are white, 4 percent are black, 4 percent Latino, and one percent Asian. [Figure 17.]
Immigrant small business owners, however, are relatively evenly divided among whites (34 percent), Asians (31 percent) and Latinos (28 percent); another five percent of immigrant small business owners are blacks, and two percent classify their race as “other.”
There are, of course, not equal numbers of workers in each ethnic and racial group, either among U.S. or foreign-born, so one would expect the share of business owners to reflect that.
But, that is not the full story. Some groups have considerably higher rates of small busi-ness ownership than others. Whites and Asians have particularly high rates of business owner-ship—3.8 percent of U.S.-born whites in the labor force and fully 6.8 percent of foreign-born whites are small business owners. Simi-larly, 2.5 percent of U.S.-born Asians and 4.7 percent of foreign-born Asians are small busi-ness owners. By contrast, 1.1 percent of U.S.-born blacks in the labor force and 2.1 percent of foreign-born blacks are business owners, as are 1.6 percent of U.S.-born Latinos and 2.0 percent of foreign-born Latinos. [Figure 18.]
There are 250,000 immigrant women who are business owners, making up 18 percent of all women business owners in the country, a slightly higher share than for men. [Figure 19.]
Women overall are considerably less likely to be business owners than men—28 percent of U.S.-born business owners and 29 percent of foreign-born business owners are women.
Figure 18.Source: FPI analysis of 2010 ACS five-year estimate.
White and Asian immigrants have the highest rate of entrepreneurship2010 ACS 5-year estimate
Roughly equal shares of immigrant white, Asian, and Latino business owners2010 ACS 5-year estimate
Figure 17.Source: FPI analysis of 2010 ACS five-year estimate.
Share of small business owners by race/ethnicityUS-Born Foreign-Born
White 90% 34%Black 4% 5%Latino/Hispanic 4% 28%Asian 1% 31%Other 1% 2%Total 100% 100%
Business owners as a share of labor force
US-Born Foreign-BornWhite 3.8% 6.8%Black 1.1% 2.1%Latino/Hispanic 1.6% 2.0%Asian 2.5% 4.7%Total 3.3% 3.5%

20 FPI June 2012
Immigrant Small Business Owners
White and Asian immigrant women have high rates of entrepreneurship2010 ACS 5-year estimate
18 percent of women business own-ers are immigrants2010 ACS 5-year estimate
Figure 21.Source: FPI analysis of 2010 ACS five-year estimate.
Figure 19.Source: FPI analysis of 2010 ACS five-year estimate.
This relationship holds true over time, as both U.S.-born and foreign-born women have made modest progress in closing the gender gap in business ownership. In 1990, 24 percent of U.S.-born business owners were women, as were 26 percent of foreign-born business own-ers. [Figure 20.]
Foreign-born women in all racial/ethnic groups are at least slightly more likely than their U.S.-born counterparts to be small business owners. Foreign-born white and Asian women are particularly likely to be small business own-ers—3.8 percent of white immigrant women in the labor force own their own small business, as do 3.6 percent of Asian immigrant women. [Figure 21.]
To see what kinds of businesses are owned by immigrant women and by immigrants who are white, black, Latino and Asian, see Appendix C.
U.S-bornForeign-
born
Foreign-born
shareWomen 1,174,359 250,465 18%Men 3,056,385 615,327 17%Total 4,230,744 865,792 17%
US-BornForeign-
BornWhite 2.2% 3.8%Black 0.7% 1.0%Latino/Hispanic 1.0% 1.5%Asian 1.7% 3.6%Total 1.9% 2.5%
Immigrant women are more likely to be small business owners1990 Census and 2010 ACS 5-year estimate
24% 26% 28% 29%
0%
5%
10%
15%
20%
25%
30%
35%
1990 2010
Share of women among U.S.-born business owners
Share of women among foreign-born business owners
Figure 20.Source: FPI analysis of 1990 Census and 2010 ACS five-year estimate.

Immigrant Small Business Owners
FPI June 2012 21
Immigrants in the 25 largest metro areas
Throughout this report we have looked at the United States as a whole. But there is a great deal of variety around the country. In some parts of the country immigrants make up a much more substantial part of the local popula-tion and labor force than in others.
In Immigrants and the Economy, a 2009 report from the Fiscal Policy Institute, we saw that growth in immigration over the past 20 years has been closely linked to economic growth. Among the 25 largest metropolitan areas of the country, the fastest-growing economies also saw among the fastest growth in immigrant labor force between 1990 and 2007, and the slowest-growing economies saw the slowest growth in immigrant labor force.*
Economists see no big surprise here. Immi-grants go where there are jobs, and do not go where there are not. In areas where immigrants (or other workers) are drawn to a growing la-bor market, they also help spur further growth by buying goods and services in the local economy.
We can now add to that picture, and see that where immigrants are playing a significant role in the labor force they are also playing a big role as business owners.
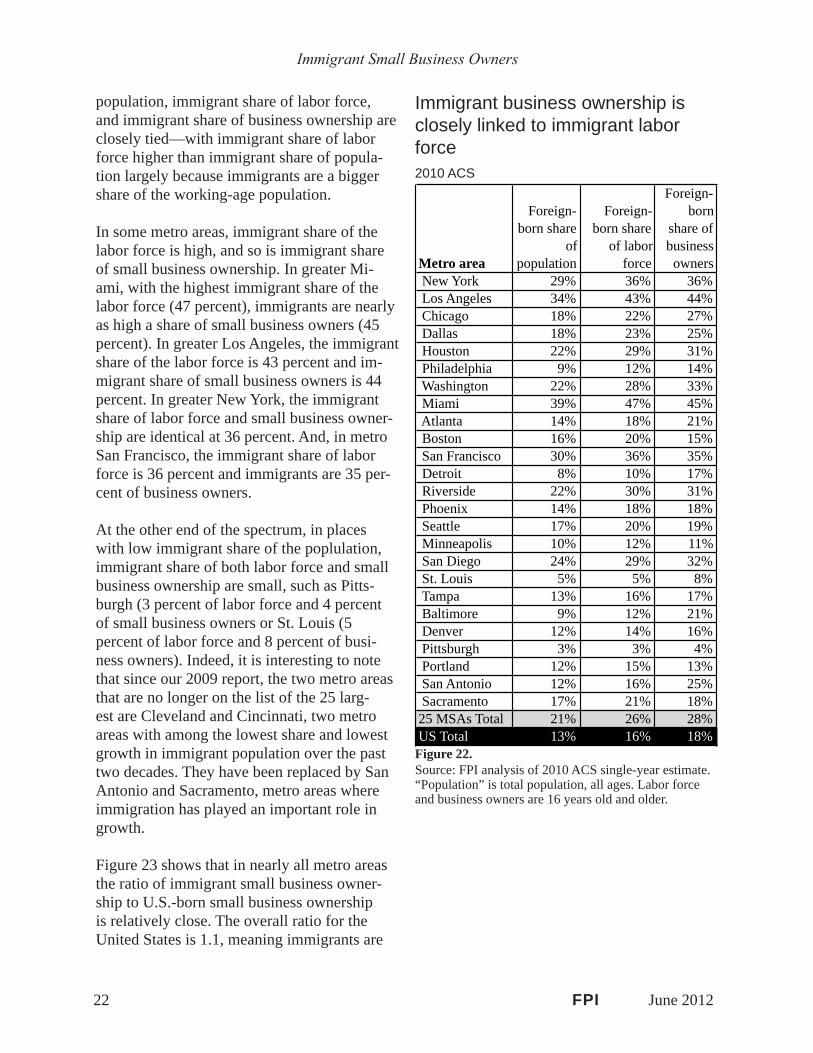
In Figure 22, the 25 largest metropolitan areas are listed in order of size of total population. These metro areas combined make up 41 per-cent of the total United States population, and 66 percent of the country’s immigrant popula-tion.
Here, too, we can see that immigrant share of
* See Immigrants and the Economy: Contribution of Immigrant Workers to the Country’s 25 Largest Metro-politan Areas, pages 8-9.
22 FPI June 2012
Immigrant Small Business Owners
population, immigrant share of labor force, and immigrant share of business ownership are closely tied—with immigrant share of labor force higher than immigrant share of popula-tion largely because immigrants are a bigger share of the working-age population.
In some metro areas, immigrant share of the labor force is high, and so is immigrant share of small business ownership. In greater Mi-ami, with the highest immigrant share of the labor force (47 percent), immigrants are nearly as high a share of small business owners (45 percent). In greater Los Angeles, the immigrant share of the labor force is 43 percent and im-migrant share of small business owners is 44 percent. In greater New York, the immigrant share of labor force and small business owner-ship are identical at 36 percent. And, in metro San Francisco, the immigrant share of labor force is 36 percent and immigrants are 35 per-cent of business owners.
At the other end of the spectrum, in places with low immigrant share of the poplulation, immigrant share of both labor force and small business ownership are small, such as Pitts-burgh (3 percent of labor force and 4 percent of small business owners or St. Louis (5 percent of labor force and 8 percent of busi-ness owners). Indeed, it is interesting to note that since our 2009 report, the two metro areas that are no longer on the list of the 25 larg-est are Cleveland and Cincinnati, two metro areas with among the lowest share and lowest growth in immigrant population over the past two decades. They have been replaced by San Antonio and Sacramento, metro areas where immigration has played an important role in growth.
Figure 23 shows that in nearly all metro areas the ratio of immigrant small business owner-ship to U.S.-born small business ownership is relatively close. The overall ratio for the United States is 1.1, meaning immigrants are
Metro area
Foreign-born share
of population
Foreign-born share
of labor force
Foreign-born
share of business owners
New York 29% 36% 36% Los Angeles 34% 43% 44% Chicago 18% 22% 27% Dallas 18% 23% 25% Houston 22% 29% 31% Philadelphia 9% 12% 14% Washington 22% 28% 33% Miami 39% 47% 45% Atlanta 14% 18% 21% Boston 16% 20% 15% San Francisco 30% 36% 35% Detroit 8% 10% 17% Riverside 22% 30% 31% Phoenix 14% 18% 18% Seattle 17% 20% 19% Minneapolis 10% 12% 11% San Diego 24% 29% 32% St. Louis 5% 5% 8% Tampa 13% 16% 17% Baltimore 9% 12% 21% Denver 12% 14% 16% Pittsburgh 3% 3% 4% Portland 12% 15% 13% San Antonio 12% 16% 25% Sacramento 17% 21% 18%25 MSAs Total 21% 26% 28%US Total 13% 16% 18%
Immigrant business ownership is closely linked to immigrant labor force2010 ACS
Figure 22.Source: FPI analysis of 2010 ACS single-year estimate. “Population” is total population, all ages. Labor force and business owners are 16 years old and older.

Immigrant Small Business Owners
FPI June 2012 23
Areas with few immigrants have among the highest rates of immigrant business ownership2010 ACS
Figure 23.Source: FPI analysis of 2010 ACS single-year estimate. “Population” is total population, all ages. Labor force and business owners are 16 years old and older.
about 10 percent more likely than U.S.-born workers to be small business owners. (Note that this relationship is very slightly different than in Figure 15 because we are looking here at 1-year rather than 5-year data).
In nearly all metro areas the ratio stays close to 1. In a few metro areas it is somewhat lower—immigrants are 90 percent as likely as U.S.-born workers to be small business owners in San Francisco, Minneapolis, and Miami metro areas, and they are 80 percent as likely in Sac-ramento, Portland and Boston metro areas.
There is greater variation at the other end of the spectrum. In metro Baltimore and Detroit, immigrants about twice as likely as U.S.-born workers to be business owners, and in San An-tonio and St. Louis they are also considerably more likely to be business owners.
In several cases, metro areas with smaller immigrant populations—Baltimore, Detroit, St. Louis—have a disproportionate number of business owners among immigrants. This may be in part because these are also areas with a higher share of immigrants who are well established (the flip side of having a smaller number of new arrivals), and a higher share of well-educated immigrants—both predictors of small business ownership. Other metro areas with high levels of immigrant entrepreneurship don’t fit this pattern. Metro San Antonio and Chicago, for instance, have substantial immi-grant share of population and also have a high rate of entrepreneurship among immigrants.
Business owners as a share of U.S.-born
labor force
Business owners as a share of
foreign-born labor
force
Ratio of foreign-
born share to to U.S.-born share
Baltimore 3.0% 6.1% 2.1 Detroit 2.7% 5.1% 1.9 San Antonio 2.1% 3.6% 1.7 St. Louis 3.1% 4.7% 1.5 Chicago 3.3% 4.4% 1.3 Washington 3.0% 3.8% 1.3 Atlanta 3.8% 4.6% 1.2 Philadelphia 2.9% 3.5% 1.2 Pittsburgh 2.5% 3.0% 1.2 San Diego 3.1% 3.5% 1.1 Dallas 2.5% 2.9% 1.1 Denver 4.2% 4.7% 1.1 Houston 2.4% 2.7% 1.1 Tampa 4.4% 4.8% 1.1 Los Angeles 3.5% 3.7% 1.1 Riverside 2.2% 2.3% 1.1 Phoenix 3.3% 3.3% 1.0 New York 3.7% 3.7% 1.0 Seattle 3.8% 3.7% 1.0 San Francisco 2.9% 2.7% 0.9 Minneapolis 3.5% 3.3% 0.9 Miami 6.4% 5.8% 0.9 Sacramento 2.4% 1.9% 0.8 Portland 3.7% 3.0% 0.8 Boston 3.0% 2.3% 0.825 metro areas 3.3% 3.7% 1.1United States 3.1% 3.5% 1.1

24 FPI June 2012
Immigrant Small Business Owners
Variation in immigrant small business ownership by state
As with metro areas, there is considerable variation by state in the immigrant share of population, labor force, and small busi-ness ownership. Again, however, these three are linked: immigrant share of labor force is consistently higher than immigrant share of population, since immigrants tend to come to the United States in prime working age, and the children of immigrants are U.S. citizens by birth. And, immigrant share of small business owners is overall a little higher than immigrant share of labor force—sometimes considerably higher, sometimes a little lower.
The immigrant share of small business owners is highest in California, where 33 percent of all small businesses are owned by immigrants. It is next highest in New York State (29 per-cent), New Jersey (28 percent), and Florida (26 percent)—the same order as for immigrant share of both population, and nearly the same as for immigrant share of labor force (Nevada has a very slightly higher immigrant share of labor force than Florida). [Figure 24.]
The smallest immigrant share of small business owners is, not surprisingly, in the states with the smallest immigrant share of population and labor force. The states with the lowest share of immigrant business owners—Montana, North Dakota, South Dakota—are also among those with the smallest immigrant share of labor force.
Figure 25 gives a closer sense of the states where immigrants are playing a disproportion-ate role as business owners. It is interesting to see Louisiana, Mississippi, Ohio, and Michi-gan at the top of the list of states where immi-grants are playing a role as businesss owners disproportionate to the size of the immigrant population. Ohio and Michigan might be said to be following the same trend as we saw
Immigrant share of population, labor force, and business owners by state2010 ACS 5-year estimate
Figure 24.Source: FPI analysis of 2010 ACS five-year estimate. “Population” is total population, all ages. Labor force and business owners are 16 years old and older.
Foreign-born share
of population
Foreign-born share
of labor force
Number of foreign-born
business owners
Foreign-born share of business
ownersCalifornia 27.1% 34.5% 181,651 33.4%New York 21.7% 26.9% 97,231 29.4%New Jersey 20.2% 25.7% 48,225 28.0%Florida 18.9% 23.9% 133,966 26.1%Hawaii 17.2% 20.6% 5,354 22.5%Illinois 13.7% 17.4% 48,425 21.8%Maryland 12.8% 16.4% 22,524 20.9%Texas 16.0% 20.6% 61,482 20.3%Nevada 19.1% 24.8% 8,278 20.2%District of Columbia 12.7% 16.7% 1,450 18.2%Massachusetts 14.4% 17.3% 17,914 17.9%Virginia 10.4% 13.7% 22,719 17.1%Connecticut 13.0% 16.0% 10,257 16.0%Washington 12.5% 15.1% 18,412 15.0%Arizona 14.5% 18.3% 15,999 14.8%Georgia 9.3% 12.6% 27,763 14.8%Rhode Island 12.7% 15.2% 2,230 12.9%Delaware 7.8% 9.8% 1,617 10.6%Michigan 6.0% 6.9% 16,744 10.4%Alaska 6.7% 8.7% 1,002 9.8%Oregon 9.7% 12.1% 6,803 9.2%Colorado 10.0% 11.7% 11,751 9.2%Pennsylvania 5.4% 6.4% 14,962 9.1%North Carolina 7.1% 9.4% 13,392 8.6%New Mexico 9.8% 12.1% 2,629 8.4%New Hampshire 5.2% 5.9% 1,720 7.7%Louisiana 3.3% 4.3% 5,235 7.6%Tennessee 4.1% 5.4% 4,965 7.2%Utah 8.1% 10.9% 3,950 6.9%Ohio 3.8% 4.3% 10,026 6.7%Minnesota 6.8% 7.9% 6,327 6.0%South Carolina 4.4% 5.7% 4,272 6.0%Missouri 3.5% 4.2% 5,071 5.8%Oklahoma 5.2% 6.9% 3,383 5.6%Kansas 6.3% 7.9% 2,302 5.3%Idaho 5.7% 7.3% 1,690 5.3%Indiana 4.3% 5.1% 4,937 5.1%Wisconsin 4.4% 5.0% 4,339 4.7%Kentucky 2.8% 3.8% 2,614 4.6%Mississippi 1.9% 2.7% 1,604 4.5%Alabama 3.0% 4.0% 2,735 4.3%Arkansas 4.1% 5.5% 1,818 4.2%Vermont 3.7% 3.6% 603 4.2%West Virginia 1.2% 1.5% 729 4.0%Nebraska 5.9% 7.1% 1,284 3.8%Maine 3.3% 3.3% 830 3.2%Wyoming 2.9% 3.3% n/a 2.9%Iowa 4.0% 4.7% 1,455 2.9%North Dakota 2.4% 2.5% n/a 1.8%Montana 1.9% 1.9% n/a 1.7%South Dakota 2.2% 2.6% n/a 1.1%Total 13% 16% 865,792 17%

Immigrant Small Business Owners
FPI June 2012 25
Immigrants are 10 percent more likely than U.S.-born workers to be business owners overall, with considerable variation by state 2010 ACS 5-year estimate
Figure 25.Source: FPI analysis of 2010 ACS five-year estimate. “Population” is total population, all ages. Labor force and business owners are 16 years old and older.
with metro areas, where well established and relatively small immigrant communities have some of the characteristics more associated with business ownership. This is less obviously the case in Louisiana or Mississippi. (West Vir-ginia has a very small immigrant population, just one percent; as a result, the ratio of im-migrant business owners to labor force should be read with great caution and may lack robust statistical signficance.)
At the other end of the spectrum, it is in Kan-sas, Utah, Iowa, and Nebraska that immigrants have the lowest ratio of small business owner-ship. One likely part of this story is that these are states where many immigrants work in agriculture, and comparatively few farm or other agricultural small business owners are immigrants.
Arizona and Alabama have been particularly in the news in recent months due to aggressive state immigration laws.
It is interesting to note that Alabama ranks to-ward the bottom of the list of immigrant share of population (3 percent) and labor force (4 percent), but is in the top half of the 50 states plus the District of Columbia (at 20th) in the ratio of foreign-born share of business own-ers to U.S.-born share. In Alabama, immigrant workers are 10 percent more likely than U.S.-born counterparts to be small business owners.
In Arizona, where the immigrant share of population (15 percent) and labor force (18 percent) are much higher, immigrants are also playing a bigger role as small business own-ers. There are 16,000 immigrant small busi-ness owners in Arizona reflected in the 2010 five-year ACS data (as seen in Figure 24). Yet, as seen in Figure 25, immigrant in Arizona are 80 percent as likely as U.S.-born workers to be small business owners, below the national average and 39th among the 50 states and the District of Columbia.
Business owners as a share of U.S.-born labor force
Business owners as a
share of foreign-born labor force
Ratio of foreign-born
share to U.S.-born share
West Virginia 2.2% 5.8% 2.7Louisiana 3.1% 5.8% 1.8Mississippi 2.6% 4.4% 1.7Ohio 2.5% 3.9% 1.6Michigan 3.1% 4.8% 1.6Pennsylvania 2.5% 3.7% 1.5Missouri 2.8% 4.0% 1.4Maryland 3.3% 4.4% 1.3Tennessee 2.2% 3.0% 1.3New Hampshire 2.9% 3.9% 1.3Illinois 3.1% 4.2% 1.3Virginia 3.2% 4.1% 1.3Kentucky 2.8% 3.4% 1.2Georgia 3.8% 4.6% 1.2Vermont 4.1% 4.7% 1.2Alaska 2.7% 3.1% 1.1New York 3.2% 3.7% 1.1Florida 5.5% 6.2% 1.1New Jersey 3.6% 4.1% 1.1Hawaii 3.6% 4.0% 1.1District of Columbia 2.4% 2.6% 1.1Delaware 3.4% 3.7% 1.1Alabama 2.9% 3.1% 1.1South Carolina 3.2% 3.4% 1.1Massachusetts 2.8% 2.9% 1.0Indiana 2.9% 3.0% 1.0Washington 3.6% 3.6% 1.0Connecticut 3.4% 3.3% 1.0Texas 2.5% 2.5% 1.0Maine 3.7% 3.6% 1.0California 3.0% 2.9% 1.0Wisconsin 3.0% 2.8% 1.0North Carolina 3.4% 3.1% 0.9Rhode Island 3.2% 2.6% 0.8Oklahoma 3.4% 2.8% 0.8Arizona 3.7% 2.9% 0.8Nevada 3.2% 2.5% 0.8Colorado 4.9% 3.8% 0.8Arkansas 3.2% 2.4% 0.8Minnesota 3.6% 2.7% 0.8Oregon 3.9% 2.9% 0.7Idaho 4.4% 3.1% 0.7New Mexico 3.4% 2.3% 0.7Kansas 3.0% 2.0% 0.7Utah 4.5% 2.7% 0.6Iowa 3.1% 1.9% 0.6Nebraska 3.6% 1.8% 0.5Montana 5.0% n/a n/aNorth Dakota 3.1% n/a n/aSouth Dakota 3.6% n/a n/aWyoming 4.0% n/a n/aTotal 3.3% 3.5% 1.1

26 FPI June 2012
Immigrant Small Business Owners
ConclusionImmigrant small business owners are playing a large role in today’s economy, a role that has grown over the past 20 years in step with the increasing immigrant share of the labor force. Immigrant small business owners contribute to economic growth, to employment, and to producing the goods and services that support our standard of living.
With one in six small business owners born in another country, it is clear that immigrants are an important part of America’s small busi-ness environment. Immigrants bring ideas, connections, and a spirit of entrepreneurship with them to the United States. Understanding who the one million immigrant small business owners are—what countries they come from, what kinds of businesses they own, their level of educational attainment, and more—can only help as the country struggles to achieve a better set of immigration policies.

Immigrant Small Business Owners
FPI June 2012 27
Appendix ADefinitions and data sources for immigrant small business owners
This report breaks new ground in identifying small immigrant businesses and immigrant small business owners.
In looking at immigrant small businesses, we use data from the Survey of Business Owners, conducted every five years by the Census Bu-reau, most recently in 2007. This gives defini-tive data about the number of businesses, the number of employees, the annual receipts and payroll of these businesses.
There is readily accessible data from the SBO about business owners who are Hispanic, Asian, black, women, and several other groups, but data about immigrants has been only sparsely available. In previous reports—incud-ing some from the Fiscal Policy Institute—His-panic- and Asian-owned businesses have been examined to get a rough sense of immigrant-owned businesses. This has never been a very satisfying proxy—many immigrants are not Hispanic or Asian, and many Hispanics and Asians are not immigrants—and is even less so as immigration becomes increasingly diverse.
As far as we know, this is the first substantial report to use data from the 2007 SBO regard-ing immigrant-owned businesses. In using the SBO, we consider only those businesses with employees, in order to leave aside side businesses and other more marginal business activity. Also excluded are publicly held firms and nonprofit organizations—in both cases the concept of a “business owner” does not apply. Finally, among privately held firms we look just at those with fewer than 100 employees, in order to zero in on small busi-nesses.
One significant limitation of the Survey of Business Owners, however, is that a substan-tial portion of respondents do not fill out the question about whether the owner was born in another country. For firms with under 100 em-ployees, 29 percent are “indeterminate” with regard to the nativity of the owners. Another limitation is that the SBO asks only a limited number of demographic questions.
Thus, to look at immigrant small business own-ers, as well as to cross-check the SBO data, we use the American Community Survey and matching data from the decennial Census. In these data, we focus on immigrants who own an incorporated business, and whose main job is running that business.
To make sure the businesses are well estab-lished, we concentrate on people who are self-employed and who own an incorporated business. Here, again, this report is the first we are aware of to use the data about incorporated business owners to look at immigrant business ownership.
Other reports have looked at the total self-employed population as a proxy for immigrant business ownership.This may be particularly appropriate in looking at business formation rather than business ownership, since in the early stages businesses are often unincorpo-rated. However, restricting our data to self-employed people who own an incorporated business allows us to focus on people who own relatively established enterprises, and to estab-lish a data set that is close to businesses with employees in the SBO.
According to the CPS Contingent Work Sup-plement in 2005, 57 percent of both U.S.- and foreign-born incorporated self-employed have at least one employee in addition to the busi-ness owner. At the same time, the supplement shows that 99 percent have fewer than 100 employees (98 percent for foreign-born). The

28 FPI June 2012
Immigrant Small Business Owners
number with under 100 employees in the SBO in 2007 is 4.9 million, while the number of self-employed business owners in the ACS in 2010 is also 4.9 million. This cannot be consid-ered an exact match—the SBO includes both incorporated and unincorporated businesses with employees, for example, and the ACS includes people who have an incorporarted business with no employees. Still, it is reassur-ing that the numbers, from these two data sets and related but not identical definitions, are in the same ballpark.
Reassuring, too, is that the share of businesses in which half or more of the owners are immi-grants—16 percent in the SBO—is very much in line with the 18 percent share of business owners who are immigrants in the ACS.
In other studies, self-employment—including both incorporated and unincorporated business owners—sometimes has been used to gauge immigrant entrepreneurship. One third of the people who are self-employed own an incorpo-rated business, and two thirds are unincorporat-ed, so including the unincorporated population significantly increases the size of the group. This may be particularly legitimate in think-ing about the question of business formation, since many businesses start as unincorporated entities.
For several reasons, however, we exclude from our definition of small business owners people who are self-employed but not incorporated.
First, we want to look at established busi-nesses. Although some businesses may never incorporate—and thus, there are some owners of established businesses among the unincor-porated self-employed—by and large incorpo-ration is a reasonable standard for gauging an established business.
More important, among the unincorporated self-employed are a large number of people
who would not generally be considered busi-ness owners. A substantial share of the un-incorporated self-employed are freelance workers, independent contractors, and people who are looking for salaried employement but doing side jobs to make ends meet.
Another concern with including the unincorpo-rated self-employed is a problem that has come to the attention of labor law enforcement offi-cials: a substantial and likely increasing num-ber of workers are misclassified as independent contractors—thereby making it possible for employers to evade unemployment, worker’s compensation, and other taxes—when the workers are in fact employees.
In using the ACS data, we rely where possible on the 1-year estimates from 2010. For de-tailed analysis, we use a 2010 5-year estimate, a cross-sectional sample created by combining data from each of the years 2006 to 2010.

Immigrant Small Business Owners
FPI June 2012 29
Appendix BFull broad and detailed industries for immigrant small business owners
All detailed industries with over 1,000 immigrant business owners2010 5-year data
Figure B1.Source: FPI analysis of 2010 ACS five-year estimate. All detailed industries with more than 1,000 foreign-born small business owners.
US-BornForeign-
Born All
Foreign-born share
Agriculture, forestry, fishing, and hunting 141,124 6,938 148,062 5% Crop production 69,957 3,478 73,435 5% Animal production 49,463 1,883 51,346 4%Mining 15,528 515 16,043 3%Construction 737,505 121,076 858,581 14%Manufacturing 237,552 41,449 279,001 15% Miscellaneous manufacturing, n.e.c. 16,631 3,166 19,797 16% Cut and sew apparel manufacturing 3,558 2,869 6,427 45% Furniture and related products manufacturing 16,179 2,868 19,047 15% Printing and related support activities 27,187 2,667 29,854 9% Retail bakeries 5,639 2,645 8,284 32% Medical equipment and supplies manufacturing 9,083 2,438 11,521 21%
Electronic component and product manufacturing, n.e.c. 5,112 1,753 6,865
26% Machinery manufacturing, n.e.c. 9,927 1,560 11,487 14% Bakeries, except retail 2,220 1,515 3,735 41% Machine shops, turned product, screw, nut, and bolt manufacturing
14,976 1,511 16,4879%
Miscellaneous wood products 8,654 1,226 9,880 12% Motor vehicles and motor vehicle equipment manufacturing
7,257 1,176 8,43314%
Miscellaneous nonmetallic mineral product manufacturing
2,707 1,018 3,72527%
Structural metals, and boiler, tank, and shipping container manufacturing
9,541 1,014 10,55510%
All other manufacturing 98,881 14,023 112,904 12%Wholesale trade 183,834 47,180 231,014 20% Groceries and related products, merchant wholesalers 20,467 6,388 26,855 24% Miscellaneous nondurable goods, merchant wholesalers 17,361 5,600 22,961 24% Miscellaneous durable goods, merchant wholesalers 9,376 4,493 13,869 32% Apparel, fabrics, and notions, merchant wholesalers 5,736 4,442 10,178 44% Wholesale electronic markets, agents and brokers 11,799 3,696 15,495 24% Professional and commercial equipment and supplies, merchant wholesalers
15,312 3,539 18,85119%
Motor vehicles, parts and supplies, merchant wholesalers
12,672 2,959 15,63119%
Machinery, equipment, and supplies, merchant wholesalers
24,950 2,933 27,88311%
Electrical goods, merchant wholesalers 10,613 2,255 12,868 18% Not specified wholesale trade 5,620 2,019 7,639 26% Drugs, sundries, and chemical and allied products, merchant wholesalers
5,184 1,995 7,17928%
Furniture and home furnishings, merchant wholesalers 6,046 1,770 7,816 23% Lumber and other construction materials, merchant wholesalers
7,655 1,203 8,85814%
All other wholesale trade 31,043 3,888 34,931 11%
Retail trade 433,530 121,694 555,224 22% Grocery stores 24,125 23,599 47,724 49% Gasoline stations 10,067 11,331 21,398 53% Miscellaneous retail stores 31,950 7,449 39,399 19% Clothing stores 17,393 7,301 24,694 30% Automobile dealers 36,556 6,678 43,234 15% Beer, wine, and liquor stores 7,927 5,633 13,560 42% Jewelry, luggage, and leather goods stores 11,597 5,267 16,864 31% Furniture and home furnishings stores 34,796 5,186 39,982 13% Specialty food stores 10,647 5,049 15,696 32% Radio, TV, and computer stores 16,606 4,748 21,354 22% Health and personal care, except drug stores 11,598 4,622 16,220 28% Not specified retail trade 16,993 4,506 21,499 21% Other direct selling establishments 14,355 3,464 17,819 19% Pharmacies and drug stores 12,899 2,872 15,771 18% Miscellaneous general merchandise stores 2,709 2,447 5,156 47% Building material and supplies dealers 27,378 2,278 29,656 8% Sporting goods, camera, and hobby and toy stores 17,582 2,266 19,848 11% Auto parts, accessories, and tire stores 19,311 2,197 21,508 10% Retail florists 9,047 2,186 11,233 19% Electronic shopping 6,737 1,638 8,375 20% Used merchandise stores 7,975 1,583 9,558 17% Gift, novelty, and souvenir shops 8,141 1,563 9,704 16%All other retail trade 77,141 7,831 84,972 9%Transportation and warehousing 140,623 48,658 189,281 26% Truck transportation 86,532 21,434 107,966 20% Taxi and limousine service 7,149 13,475 20,624 65% Services incidental to transportation 21,552 6,710 28,262 24% Couriers and messengers 11,389 3,501 14,890 24% Bus service and urban transit 3,558 1,439 4,997 29%All other transportation and warehousing 10,443 2,099 12,542 17%Information and communications 62,150 8,444 70,594 12% Motion pictures and video industries 24,378 3,062 27,440 11% Periodical, book, and directory publishers 13,157 1,537 14,694 10% Broadcasting, except Internet 7,284 1,218 8,502 14%All other information and communications 17,331 2,627 19,958 13%Finance, insurance, and real estate 439,580 60,489 500,069 12% Real estate 236,084 34,964 271,048 13% Securities, commodities, funds, trusts, and other financial investments
62,104 8,851 70,95512%
Insurance carriers and related activities 88,514 7,531 96,045 8% Non-depository credit and related activities 36,573 7,207 43,780 16%All other finance, insurance, and real estate 16,305 1,936 18,241 11%
Table continued on next page.

Professional and business services 926,677 140,945 1,067,622 13% Computer systems design and related services 77,794 20,000 97,794 20% Management, scientific, and technical consulting services
150,796 19,556 170,35211%
Services to buildings and dwellings, except construction cleaning
59,676 18,979 78,65524%
Landscaping services 80,802 16,708 97,510 17% Architectural, engineering, and related services 81,884 12,184 94,068 13% Accounting, tax preparation, bookkeeping, and payroll services
75,050 8,902 83,95211%
Legal services 151,621 8,386 160,007 5% Specialized design services 42,779 6,568 49,347 13% Travel arrangements and reservation services 12,813 5,639 18,452 31% Other professional, scientific, and technical services 25,928 5,314 31,242 17% Employment services 28,418 4,152 32,570 13% Advertising and related services 37,295 3,817 41,112 9% Business support services 27,145 2,679 29,824 9% Investigation and security services 20,250 2,149 22,399 10% Other administrative and other support services 13,809 1,706 15,515 11% Scientific research and development services 8,223 1,687 9,910 17% Veterinary services 19,191 1,150 20,341 6%All other professional and business services 13,203 1,369 14,572 9%Educational, health and social services 396,928 100,014 496,942 20% Offices of physicians 106,361 37,072 143,433 26% Offices of dentists 56,420 13,761 70,181 20% Child day care services 34,728 11,677 46,405 25% Other schoolsand instruction, and educational services 33,779 6,191 39,970 15% Other health care services 19,569 5,095 24,664 21% Hospitals 13,650 4,353 18,003 24% Outpatient care centers 19,603 4,120 23,723 17% Offices of other health practitioners 30,405 4,049 34,454 12% Home health care services 10,467 3,667 14,134 26% Office of chiropractors 22,404 2,194 24,598 9% Individual and family services 15,741 2,077 17,818 12% Residential care facilities, without nursing 5,144 1,998 7,142 28% Elementary and secondary schools 8,126 1,177 9,303 13% Offices of optometrists 11,699 1,104 12,803 9%All other educational, health and social services 8,832 1,479 10,311 14%
Leisure and hospitality 254,833 99,710 354,543 28% Restaurants and other food services 132,267 76,915 209,182 37% Traveler accommodation 10,843 8,325 19,168 43% Independent artists, performing arts, spectator sports, and related industries
53,118 8,039 61,15713%
Other amusement, gambling, and recreation industries 37,872 4,134 42,006 10% Drinking places, alcoholic beverages 14,644 1,583 16,227 10%All other leisure and hospitality 6,089 714 6,803 10%Other services 260,875 68,687 329,562 21% Automotive repair and maintenance 91,513 18,328 109,841 17% Beauty salons 56,579 15,122 71,701 21% Dry cleaning and laundry services 9,328 10,912 20,240 54% Nail salons and other personal care services 15,717 9,411 25,128 37% Personal and household goods repair and maintenance 17,077 4,335 21,412 20% Other personal services 18,367 3,087 21,454 14% Commercial and industrial machinery and equipment repair and maintenance
17,790 2,295 20,08511%
Car washes 7,282 1,984 9,266 21% Electronic and precision equipment repair and maintenance
9,615 1,627 11,24214%
Barber shops 6,586 1,457 8,043 18%All other "other services" 11,021 129 11,150 1%Total 4,230,749 865,799 5,096,548 17%
Table continued from previous page

Immigrant Small Business Owners
FPI June 2012 31
Small business ownership by broad industry by gender and nativity
U.S.-born men
Share of U.S.-born
menForeign-
born men
Share of foreign-
born menU.S.-born
women
Share of U.S.-born
women
Foreign-born
women
Share of foreign-
born women
Agriculture, Forestry, Fishing and Hunting 114,321 4% 5,416 1% 26,802 2% 1,523 1%Mining 12,716 0% n/a n/a 2,811 0% n/a n/aConstruction 651,034 21% 111,765 18% 86,471 7% 9,311 4%Manufacturing 183,369 6% 31,492 5% 54,182 5% 9,957 4%Wholesale Trade 143,305 5% 35,467 6% 40,528 3% 11,709 5%Retail Trade 286,333 9% 80,907 13% 147,198 13% 40,784 16%Transportation and Warehousing 116,632 4% 43,946 7% 23,991 2% 4,712 2%Information and Communications 44,281 1% 6,238 1% 17,881 2% 2,208 1%Finance, Insurance, Real Estate and Rental and Leasing 299,098 10% 39,222 6% 140,484 12% 21,268 8%Professional, Scientific, Management, Administrative, and Waste Management Services 654,296 21% 98,535 16% 272,381 23% 42,409 17%Educational, Health and Social Services 231,794 8% 56,274 9% 165,129 14% 43,737 17%Arts, Entertainment, Recreation, Accommodations, and Food Services 155,738 5% 64,313 10% 99,094 8% 35,397 14%Other Services (Except Public Administration) 163,465 5% 41,308 7% 97,411 8% 27,376 11%Total 3,056,382 100% 615,320 100% 1,174,363 100% 250,470 100%
Immigrant small business ownership by broad industry by race and ethnicity Foreign-
born white
Share of foreign-
born white
Foreign-born
black
Share of foreign-
born black
Foreign-born
Hispanic/Latino
Share of foreign-
born Hispanic/
Latino
Foreign-born
Asian
Share of
foreign-born
AsianForeign-
born total
Share of foreign-
born totalAgriculture, forestry, fishing, and hunting 2,273 1% n/a n/a 3,031 1% 1,585 1% 6,938 1%Mining n/a n/a n/a n/a n/a n/a n/a n/a n/a n/aConstruction 46,180 16% 4,827 12% 56,440 23% 11,513 4% 121,076 14%
Manufacturing 17,951 6% n/a n/a 10,208 4% 11,817 4% 41,449 5%Wholesale trade 15,337 5% n/a n/a 11,726 5% 18,362 7% 47,180 5%Retail trade 36,981 13% 3,755 9% 25,444 10% 52,582 19% 121,694 14%Transportation and warehousing 14,293 5% 7,446 18% 18,216 7% 7,796 3% 48,658 6%Information and communications 4,494 2% n/a n/a 1,952 1% 1,376 1% 8,444 1%Finance, insurance, and real estate 24,139 8% 3,853 9% 15,634 6% 15,724 6% 60,489 7%Professional and business services 50,466 17% 6,609 16% 45,087 18% 36,042 13% 140,945 16%Educational, health and social services 31,076 11% 5,809 14% 20,006 8% 41,339 15% 100,014 12%
Leisure and hospitality 32,738 11% 2,325 6% 17,974 7% 45,546 17% 99,710 12%Other services 17,847 6% 3,785 9% 18,782 8% 27,483 10% 68,687 8%Total 294,007 100% 40,846 100% 244,710 100% 271,207 100% 865,799 100%
Appendix CBroad and detailed industries by race/ethnicity of immigrants and by gender of U.S.- and foreign-born
Figures C1 and C2.Source: FPI analysis of 2010 ACS five-year estimate.

32 FPI June 2012
Immigrant Small Business Owners
Expert Advisory Panel for FPI’s Immigrant Research Initiative
Algernon Austin, director of the Race, Ethnic-ity, and the Economy program of the Economic Policy Institute.
Muzaffar Chishti, director of the Migra-tion Policy Institute’s office at the New York University School of Law, and former director of the immigration project at UNITE. He has written, testified, and worked extensively on immigration issues.
Gregory DeFreitas, professor of econom-ics and director of the labor studies program, Hofstra University. He is author of Hispanics at Work: Hispanics in the U.S. Labor Force, and Young Workers in the Global Economy: Job Challenges in North America, Europe and Japan.
Maralyn Edid, Senior Extension Associate, Cornell University’s ILR School, and author of reports on immigrants in upstate New York.
Héctor Figueroa, secretary-treasurer, 32BJ of the Service Employees International Union, member of the editorial board of the New La-bor Forum, and former research associate and economist with the Amalgamated Clothing and Textile Workers Union.
Nancy Foner, distinguished professor of sociology at Hunter College and the Graduate Center of the City University of New York, and author of From Ellis Island to JFK: New York’s Two Great Waves of Immigration and In a New Land: A Comparative View of Immigration.
Philip Kasinitz, professor of Sociology, CUNY Graduate Center, and author of Carib-bean New York: Black Immigrants and the Politics of Race and co-author (with John H. Mollenkopf, Mary C. Waters, and Jennifer Holdaway) of Inheriting the City: The Children of Immigrants Come of Age.
Peter Kwong, professor of urban affairs, Hunt-er College. He is author of The New China-
town, Forbidden Workers: Illegal Chinese Im-migrants and American Labor, and co-author (with Dušanka Miščević) of Chinese America.
Ray Marshall, Former Secretary of Labor, Audre and Bernard Rapoport Centennial Chair in Economics and Public Affairs at the Univer-sity of Texas, Austin. Marshall was chair of the AFL-CIO Immigration Task Force.
John H. Mollenkopf, distinguished professor of Political Science and Sociology at the Grad-uate Center of the City University of New York and director of the Center for Urban Research, and co-author (with Philip Kasinitz, Mary C. Waters, and Jennifer Holdaway) of Inheriting the City: The Children of Immigrants Come of Age.
Jeffrey S. Passel, senior demographer, Pew Hispanic Center, and author of many of the most frequently cited studies of undocumented immigrants in the United States.
Max J. Pfeffer, Professor of Development Sociology at Cornell University, and an expert on farm workers in New York State.
Rae Rosen, senior economist and assistant vice president, Federal Reserve Bank of New York.
Heidi Shierholz, economist, Economic Policy Institute.
Audrey Singer, senior fellow in the Metropoli-tan Policy Program at the Brookings Institu-tion, and co-editor of Twenty-First Century Gateways: Immigrant Incorporation in Subur-ban America, and numerous Brookings reports on immigration and metropolitan change, including The State of Metropolitan America.
Roger Waldinger, distinguished professor of Sociology at UCLA, and author of Strangers at the Gates: New Immigrants in Urban America, Through the Eye of the Needle: Immigrants and Enterprise in New York’s Garment Trades, and Still the Promised City? African Americans and New Immigrants in Post-Industrial New York.

The Fiscal Policy Institute (FPI) is an independent, nonpartisan, nonprofit research and education organization committed to improving public policies and private practices to better the economic and social conditions of all new Yorkers. Founded in 1991, FPI works to create a strong economy in which prosperity is broadly shared. FPI’s Immigration Research Initiative looks at immigration issues in New York State, and around the country. 11 Park Place, 7th Floor New York, NY 10007 212-721-7164 One Lear Jet Lane Latham, NY 12210 518-786-3156 Immigration Research Initiative: 212-721-7164 www.fiscalpolicy.org
OTHER MAJOR REPORTS FROM THE FISCAL POLICY INSTITUTE’S IMMIGRATION RESEARCH INITIATIVE New Americans on Long Island: A Vital Sixth of the Economy The Changing Profile of Long Island’s Economy: How U.S.-born Workers Have Fared as Immigration has Grown Across the Spectrum: The Wide Range of Jobs Immigrants Do Immigrants and the Economy: The Contribution of Immigrant Workers to the Country’s 25 Largest Metropolitan Areas Working for a Better Life: A Profile of Immigrants in the New York State Economy