i roinn na mara i le exploitation and survival of .' river shannon
TRANSCRIPT

I I I
ISSN 0332-1789
I ROINN NA MARA
I le EXPLOITATION AND SURVIVAL OF .' RIVER SHANNON REARED SALMON
11
'I
I I I I 11 11
I,' 1"\
1I 11
I I 11
by
NIALL 0· MAOILEIDIGH, JOHN BROWNE, T. McDERMOTT,
ANNE CULLEN,' NIGEL BOND, BRIAN MCEVOY,
MARTIN 0· FARRELL AND WILLlAM 0· CON NOR
Fishery Leaflet 164 Dublin 1994

I (
I
I,
1.-11:
I' 1I
I
I: I
I" I I I I I
ISSN 0332-1789
EXPLOITATION AND SURVIVAL OF RIVER SHANNON REARED SALMON
by
NIAllO' MAOllEIDIGH, JOHN BROWNE, TOM McDERMOTT, ANNE CUllEN, NIGEl BOND, BRIAN MCEvOY
Fisheries Research Centre, Abbotstown, Dublin 15
and
MARTIN O' FARREll, WllllAM O' CONNOR ESB Fisheries Conservation/Hydro Group, Ardnacrusha, Limerick.
-,.,
Fishery Leaflet 164 December 1994
Department of the Marine Dublin 2.
SUMMARY
Following the construction of the River Shannon hydroelectric scheme the Electricity ~ •• __ J
Supply Board (ESB) have maintained a Juvenile salmon restocking programme. Tagging
of smolts with coded wire tags (microtags) was initiated in 1980 to examine the migration
and survival of these stocked fish. In 1991, an estimated 292,000 hatchery reared salmon
smolts (micro tagged and adipose finclipped) migrated from the River Shannon, County
Limerick. This allowed an assessment to be made of the contribution of these fish to the
high seas fisheries at West Greenland and Faroes, and also to homewater net and rod
fisheries. Over 12,000 grilse from this release programme were estimated to have been
taken by commercial nets with 525 taken on rods and 3,147 surviving to spawn. The
return rate of 2 sea winter fish was much lower with 150 taken by commercial nets, 93
taken by rods and 202 estimated to have spawned. The Greenland fishery took
approximately 107 potential 2 sea winter fish which is a high proportion of the overall 2
sea winter stock. Tag returns from groups of smolts released by helicopter proved to be
highest. Groups released above the dams and which had to navigate through these
installations also showed comparatively good returns. Early presmolt and smolt releases
(i.e. December and February) did not give as good return rate in comparison to the other
release groups.
1'··' 11
I ~ J
I. 1' I.-
I: I I I I I I I·"
I I I I
Nia/l O'Mao#eidigh et al.: Exploitation and survival of River Shannon reared salmon
INTRODUCTION
The national microtag recovery programme was initiated in 1980. to provide information on the exploitation rates by commercial and recreational fisheries based on recaptures of tagged reared and wild smolts (Browne, 1982). Tagging of smolts from rivers located around the Irish coast has been carried out annually by the Fisheries, Research Centre using binary coded wire nose tags. A comprehensive tag recovery pro gramme in all of the major salmon landing ports during the year ensures a high degree of tag recovery and associated recovery information.
With the co-operation of the Electricity Supply Board (ESB), salmon tagging has been carried out using Shannon hatchery stock since 1980.. Approximately 40.,0.0.0. smolts from Parteen Hatchery have been tagged annually. Howeve:r, with the formulation of the River Shannon Management Group in 1990., it was decidedtc:dncrease the intensity for one year and tag all outgoing smolts in the hatchery (over 30.0.,0.0.0.). The increase in tag output ensured a significant improvement in the quality and quantity of return information and ensured greatly improved estimates of marine survival, exploitation in high seas and homewater fisheries and subsequent return ratesto:the Shannon. This programme was in line with an International Council for the Exploration of the Sea (ICES) recommendation to improve existing knowledge of salmon life histories and factors causing population or stock declines. The new tagging programme also facilitated the broodstock development programme as the success of specially reared salmon could be compared and evaluated against standard groups with the long term aim of increasing returns to the river and establishing a strong 2 sea winter (larg~pring. salmon) component in the River Shannon stock.
This report is a summary of tag returns for the salmon smolts released in 1991, and includes return rates of 1 sea winter (lSW) salmon returning in 1992 and 2 sea winter (2SW) salmon returning in 1993.
METHODS
Batches of smolts were tagged from September to December of 1990. and released at various locations in the Shannon system. In all, 36 groups were released using strategies which varied by time, place and method ofre1ease. From the fish tagged in 1990. - 1991, it was estimated that the number of hatchery smolts migrating the following spring was 292,046.
Catches from homewater fisheries using drift nets were monitored at 15 major salmon landing ports in Ireland during the summer of 1992 and 1993. Declared salmon landings in each of the corresponding areas collected by the seven Regional Fisheries Boards were compiled into a national dataset by the Dept. of the Marine. Salmon landings were also provided by the Foyle Fisheries Commission and tag recovery information was provided by the Dept. of Agriculture for Northern Ireland. The number of tagged fish taken in these fisheries was estimated by multiplying the number of tags recovered in each fishery area (Figure 1) by the ratio (raising factor) of the reported commercial catch in these areas to the sample size examined. There is also a substantial non-catch fishing mortality (NCFM) associated with these fisheries which includes all sources of losses from nets and non-reporting of catches. An estimate of NCFM is derived annually from local
3

Fishery Leaflet 164 - 1994
knowledge and experience. This can then be.usec:LtO'adjust the actual number of recovered tags to indicate the total stock available at the time.
Figure!
55.5
55
54.5
54
Q) 53.5 "0 ,§
'" .....l 53
52.5
52
51.5
51
Donegd
~_-,---__ I (
t'--~~¥'>";;J"~·~·
'I- .... .j. .... ¥ ' I . (rion Rl,el :Ji!
I
Mayo
Wesl Cork
12 11 10 9 ,8 7 6 5
Longitude west
")",,-
. Homewater recapture areas for the salmon microtag recovery programme.
For the purposes of this analysis it is assumed that the tags are randomly distributed throughout the fishery and that non-recognition or non-detection of tags is minimal. Exploitation is estimated by dividing the number of fish caught in a fishery by the number available to the fishery.
Tag recoveries were generated from international high-seas fisheries in the Faroes and Greenland. To maximise the amount of information which could be generated from the large number of tagged smolts released in the Shannon, an Irish scientist travelled to Greenland to join the international team from Denmark, UK, Canada and the USA
4
I I I I I .)
"·1 I I I I I I I
"·1 -I I I I I I

I
I I I I.·
I I I I I 1-
I I' I I I I I I
Mall O'Maoileidigh et al.: Exploitation and survival of River Shannon reared salmon
engaged in scanning for tags. Temporal and spatial raising factors were generated for Greenland tag recoveries based on estimates given by Russell et al (1993). Raising factors for the Faroes long-line fishery are given in Anon (1993). As this fishery was operating as an experimental fishery only, all fish caught were scanned for tags and therefore a raising factor of 1 was used.
An accurate assessment of the upstream number of Shannon migrants was necessary in order to assess the overall survival and exploitation of the Shannon reared stock. An 'Atlantic Type 22' upstream/downstream resistivity counter has been operating in the fish pass at Ardnacrusha since December 1991.
The operation of the fish lift is described by Hennessy (1960). In summary, the pass consists of two gates (bottom of lift and top of lift) and a vertical lift 34.5m high. The pass is built on the site left for the No. 6 turbine and operates ID ~:fycle of six lifts per day. Each lift takes approximately 2 hours to complete and,tlfe dii!:m is passable for approximately seventy minutes. The lifttimes were as follows: 0000 hrs, 0400 hrs, 0800 hrs, 1200 hrs, 1600 hrs, 2000 hrs.
The counter consists of three metaLeledrodes 39 cm apart built into the wooden flume which is 1.8 m long, 0.9 m wide and 0.45 'm deep. The counter operates on the basis of changes in electrical resistance. The two bodies of water between each pair of electrodes aremade sensitive by a high frequency low voltage (12V) supplied by an oscillator housed in the control unit. Each body of water has a set resistance and entry of fish into the flume constitutes a change in resistance. The change alters the potential across the circuit and results in a count being registered; A thfeshold is set on the counter so that only grilse or salmon sized fishare counted. The three electrodes allow the direction of the count (i.e.
'u;pstream or downstream) to be determined.
The accuracy of this counter was examined in 1991 using time lapse video techniques. This enabled a total upstream count to be taken and alsoalloweddiscrirnination between clipped (hatGhery) salmon and unclipped (wild) salmon. A surveillance system was incorporated .into the fish pass in 1990 to allow detection of all fish passing through the fish pass and to verify previous counts of salmon from other years. This comrnprised of a low light camera linked to a high speed SVHS video recorder.
Fish are intercepted annually at Parteen from September and retained as broodstock, thus allowing an estimate to be made of thenurnbers of hatchery and wild fish passing into the upper Shannon ,by this route. A correction. was made to allow for a·· small number of salmon which migrate past this point before September.
An e~timate ofthe rod catches in the system was made from angling tag returns and local catch information. The total stock returning to the river was estimated by surnrriing the counts of reared salmon moving upstream, together with those taken by the recreational fishery.
RESULTS
Over 7,000 tags from the 1991 smolt release programme were recovered subsequently. This represents an overall recovery of 2.4%. This value compares favourably with tag
5

111 !.
11
! !I
'I I,
Fishery Leaflet 164 - 1994
recoveries from other salmon producing sites (Report on the Coded Wire Tag Returns, 1992).
Figure 2 gives the overall distributjon ,of tag returns of both 1 SW and 2SW salmon subdivided by sea capture area and river returns. The category 'other' refers to tag recoveries in areas other than those named or tags where the exact origin is not known.
4500T 43374190 1 SeaWlnler ii 2 Sea Winter 1W.il"", Grilse Salmon
4000
.., 3500 ., \l: 'tiI 3000 Q)
f 2500 ,+ ;:11 2295:
"52000 ... ID
~ 1500 m IB1Im . __ 852
500 428
£ l.u t . 14 ~Illlll 6 52 11111. 107 15 31 20 36 48 93 20 182
0 (J) "0 ii3 b E ~ o~ - - '-.oo:L...::,e (I) '"0 \0 0 E.,..l! c..:::i:. -- _:L. (0 '-:1
~ ti m ~ ~ ~ ~ a ~ ~ 2 ~ ; H ~ ~ ~ ~ ~ ~ ~ ~ ~ ~ 2 ~ ; g ~ ~ ~ 2 V ~ ~ u 8 8 0 ~ g w ~ ~ ~ 2 ~ c ~ u 8 8 0 ~ g 0 ~ ~ 8 ~ g 5 m w U ~ ~ ~ 8 ~ g 5 m w U ~
o ~ m ~ 0 ~ m ~ m m
T og recovery ~ocatlon
Figure 2. Estimated numbers of tagged salmon captured. Rods, counter and broodstock refer' to counts or recaptures in the River Shannon. The Faroes ratch was taken by longline and the other catagories represent drift net catches in these areas. ,..- . ~
Catch distributions indicate that· the highest number of 1 SW fish was caught in the Galway/Limerick sea area and in the Shannon estuary. The catch of Shannon salmon tcll,cen in Donegal, Kerry, Cork and the South coast was small in comparison.
The number of hatchery reared Shannon salmon taken In the Faroes longline fishery was very small (14). However, over 100 salmon were caught in the Greenland drift net fishyry in 1992 as ISW salmon; . The Greenland catch is significant as these fish would potentially have been 2SW salmon on their return from Greenland and the number of 2$W salmon which retmn to homewaters has been very low in recent years.
Two sea winter salmon appeared in drift net catches from Donegal to Kerry but the numbers taken were small. The numbers of 2SW salmon accounted for by rods was also low, though relatively high compared to the overall numbers of 2SW salmon teturning.to the river." A single 2SW recapture was recorded from the Faroes longline fishery' in 1992/93 fishing season also indicating a low level of exploitation.
In the fish pass at Ardnacrusha, total counts and observations are available for the day time lifts from 0800 hrs to 1600 hrs and partial observations for the 2000 hrs lift (April to July), The distribution by month for each of these lifts is shown in Figure 3. Differences in r~te of salmon movement by season areappare'nt with early morning lifts used most in
6
I I I I I
-.1 _il ..
I :1 ~I
,I I I I
-'1" -.
"I I I \1 I ,I

I I
I I -
- -
I I I I I I I I·" 1-I I I I I
Mall O'Maoileidigh et al.: Exploitation and survival Of River Shannon reared salmon
June and July, followed by a greater rate of 1110V ement in the afternoonin subsequent months. Very few salmon used the fish lift during the hours of darkness.
A total of 2,431 salmon used the fish pass at Ardnacrusha in 1992 in their upstream migration. This comprised 792 hatchery salmon (32.6%) and 1,6:39 wild sahlion (67.4%). The proportions of hatchery and wild salmon using the lift are shown in FigtU'e 4, CleC\.fly, the main runs of wild and hatchery fish through Ardnacrusha oecured in June, comprising over 40% of the upstream counts. Both runs are characterised by a second peak of fish movement in October and November with fish passing upstream until December. Overall
. monthly proportions of wild and hatchery fish were similar.
1000
900
800
700
... 600 Q) .c 500 E ::J Z 400
300
200
100
0
Figure 3
c: to
--:>
till 2000 hrs
1illlill1600 hrs
o 1200hrs
El 0800 hrs
.0 Ol
LL
Monthly video counts of salmon in each lift of the BorJand fish pass.
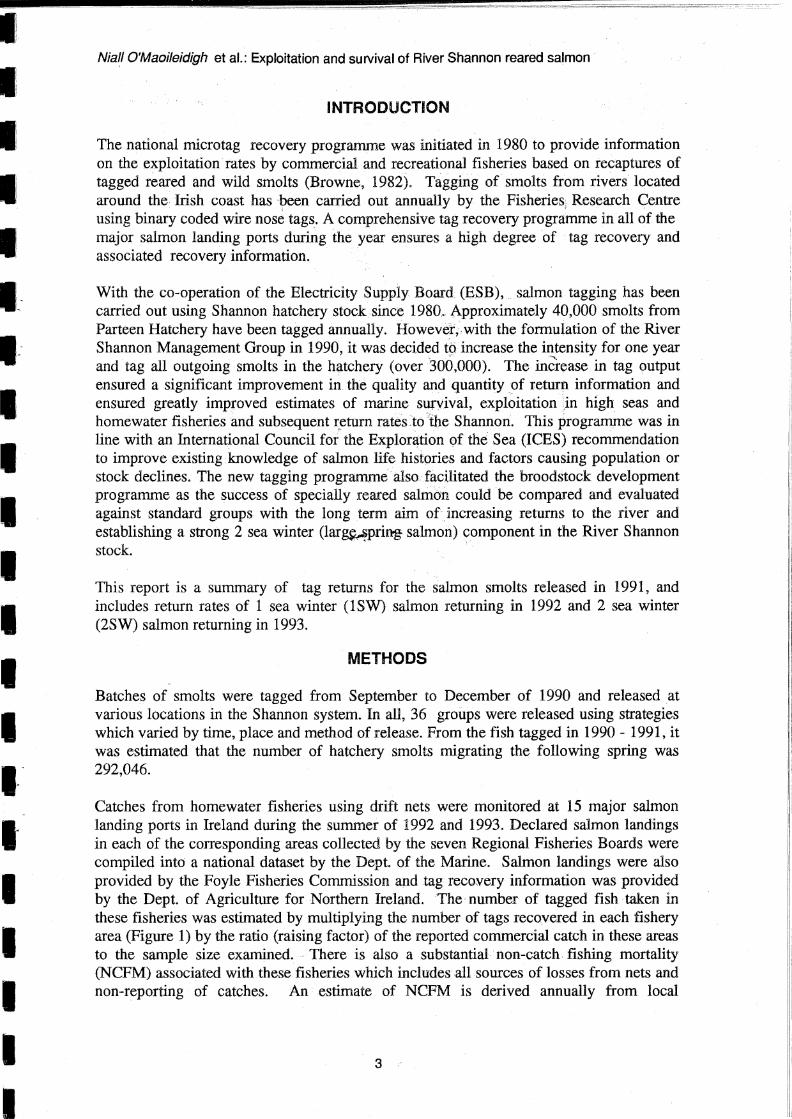
The total stock returning to the Irish coast was 15,865 1SW salmon and 433 2SW salmon (Figure 5). This represents a survival to the coast from the total smolt release of 5.4% (ISW) and 0.15 % (2SW). Approximately 77% of the ISW stock returning to' the Shannon was intercepted by drift nets while rods accounted for a further 3% of the total homewater stock. Hatchery reared salmon tend to remain at sea or in estuuaries for longer periods than wild fish and are thus available to commercial nets for a longer period. This also reduces the time during which they are available to the rods. It is possible also that the rod catch may have been underestimated.
The successful performance of these release groups was based on the rate of return to drift nets and estuary nets and then the return to the broods tack and rod catches as an indication of successful return to the river.
Drift net and estuary return rates were particularly poor for early! released groups (December and February.) The April releases were significantly-better. Releases by helicopter showed a particularly successful return compared to the other groups and were similar to the rates of return from the small group of River Fergus released smolts. A good return to the coast. was also noted for headrace releases, which were slightly better than
7

Fishery Leaflet 164- 1994
tailrace and Killaloegroups.Considering that theheadrace and Killaloe groups migra~ecl through the turbines at Ardnacrusha, the overall rate of return using this release strategy compared remarkably well with other strategies,
1 COO
900
:t [J Hatchery
• Wild
.. 600 Cl .c
500 E :::I Z 400
300
200
100
0 c ..0 ....
~ (l) ~ -- 1i 13 > (.J ID .5. tI) o::l (l) C :3 ::I 0 0 (l)
J LL 2 -< 2 :3 J 01 (l)
Z 0 J ::I Cl)
«
Figure 4. Monthly video counts of hatchery and wild salmon at Ardnacrusba,
The numbers of salmon which survived to spawn represented approximately 20% of the stock reaching homewaters or 1.1 % of the total tagged smolt output.
. ~
The exploitation and survival of the 2SW'C'omponent (Figure 5) of the stock was more evenly distributed. Approximately 28% were taken by Irish drift nets, 17 % by rods and 20 % by the Greenland fishery;· 37% survived to spawn. However the overall number of 2SW salmon produced from the Parteen hatchery is very low.
Nine. separate release strategies were examined (Figure 6). Presmolts were released in December of 1991 and February of 1992 by truck in the old river channel or at Parteen (Truck downstream). Other releases took place in April by truck in the old channel, River Fergus and downstream of the regulating weir. Helicopter releases occurred at similar locations (Helicopter downstream), while other helicopter releases occurred downstream of Parteen (Helicopter Parteen), in the headrace and tailrace of Ardnacrusha (Ardnacrusha headrace, Ardnacrusha Tailrace), and at Killaloe.
A slightly different distribution was apparent from brood stock and rod returns for ISW salmon. In general the brood stock returns were poor for the early releases (December and February) and were best for April truck and helicopter releases in the old channel and downstream of Parteen. The Ardnacrusha headrace and tailrace groups were also well represented with the tailrace group doing slightly better in the broodstock. A significant number of smolts released into the Fergus also returned to Parteen and were identified in the broodstock.
8
Nic
Tt. bu no
T, h~ of m re b~
re
i {
Niall O'Maoileidigh et al.: Exploitation and survival of River Shannon reared salmon
The rod returns indicate that the February release group did well in returning to the river, but as the overall number of tags recovered in the rod fishery was small these figures may not be representative.
Two sea winter returns (Figure 7) were well represented in releases by truck and h~lioQPt~]' in the old Gnanntil Of downstream of the dam, HOweYer, a~ with the rod ga,tCft of lBW salmon, the number of tag recoveries was small and likely to be influ~nced by the numbers of fish making up the release strategy categories, with a higher chance of recovering tags from larger groups. Returns of 2SW salmon to the broodstock give a better indication of the release strategy effects. Once again it appears that the helicopter release strategy is best represented in the overall tag recovery.
1 SW hatchery salmon
80.00 12,192 ~ % Exploitation
70.00 11 % Survival to river 60.00 -50.00 c
Cl) 40.00 ~
:. 30.00
20.00 3,147
10.00 14 525
0.00 High seas Faroes
Rods .survival Nets
2SW hatchery salmon
202
150
Nets Rods Survival.
Figure 5. Exploitation and survival of River Shannon hatchery salmon.
9

~
Fishery Leaflet 164 - 1994
600
500 c Q
i 400 Cl)
15 300 "-Il)
.c E 200 ::J
Z
c o
100
o
120
100
E 80 13
Cl)
'0 60 .... III .c E ;:I
Z 20
Seanels
iI E ~ 1Llqy !l€lis
Gl
1 u Gl
Cl
::/U :::!I
..Q Gl
LI..
• Rod;
[] Brood;tock
o I , ... ,., I
j ~ Gl
Cl
::-10 :::I
i LI..
e It!
olJI.Gl u= :::I .. - c .... ~
o '1:1
e IU
~G) u= ::J .. ... c .... I
o '1:1
... e Gllt! - Gl 0.-0-
.S:! :! 131: ::r:.g
... Si! Gl IU
i~ u .. :ail ::r:.g
... .!! C Q,Gl o Gl I~ 1: 1i IU ::r:1l.
§ C o.G) o Gl u'" :ai fa ::r:1l.
to iG) 2 ~ 16-= c: :g ~.c
IQ .cGl .,. u ::J IQ tl.; le! IQ
- .§ Gl _.c ..:(
IU
iG) ::J U ... IU U ... :gr; -0-
.et
IQ
-fiGl ::I U - IU U _ IU~ C IU
'1:1-
.et
Gl
~ ~
Gl o :si ~
.,. i ~
.,. 5. ii
LI..
Figure 6. Comparison of 1SW return rates per 10,000 smoltS released using different strategies. .~
DISCUSSION
Exploitation on this stock has always been very low in the Faroes fishery (Fisheries Research Centre, Report on the Coded Wire Tag Recoveries, 1981 to 1993) and it is unlikely that the recent buy out of the quota of this fishery will be noticed in return rates in Irish waters. Browne and Piggins (1986) indicated that exploitation by the Greenland fishery may be high on Irish 2 sea-winter stocks. The leasing of the Greenland fishery in 1993 may yield considerably more 2 sea-winter salmon to the Shannon system.
10
I ,I 'I I I
',,1
'·1 I I I I I I I
':1 -I I I I I I
I I I I I I:
1 I:
I I I. ~- "
I.' I I I I I I
Niall O'Maoi/eidigh et al.: Exploitation and survival of River Shannon reared salmon .
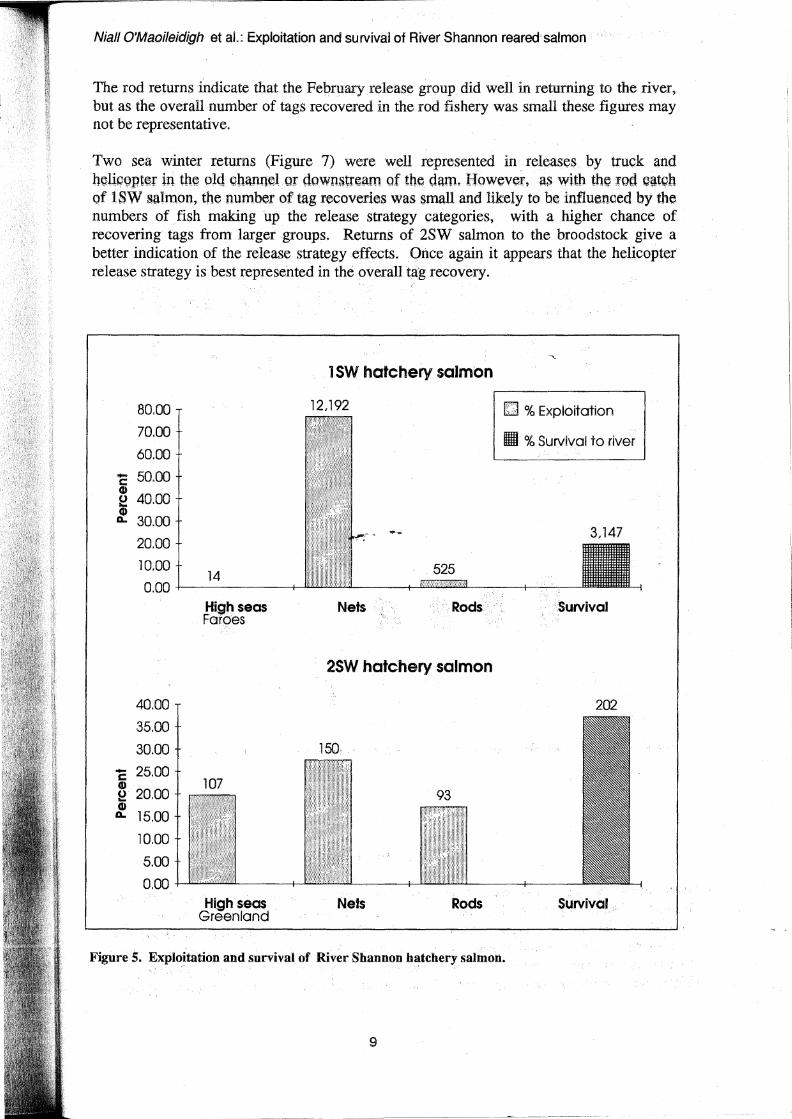
However, the first salmon returns to Ireland resulting from this buyout did not appear until 1994. As these fish generally return as early spring fish, they are not subjected to coastal exploitation at the same. rate as 1 sea-winter salmon. Preliminary results from regional fisheries board information and private fishery owners suggest that there were noticeably more 2 sea-winter salmon entering rivers and higher numbers being encountered by anglers in the early part of the season,
12 IIli Qeeriand
10 m Drlftnet c 0 E 8 I2J Es1uay a3 U) - 6 0 .. al .c
4 E ::t Z
2
0 as e;. lE '" lE iil C
ItI ItI Cl) lot
.&J ItI IV .!!Z .c Cl) .c Cl .:1 -Cl) .. .. Cl) ~
Cl lE :I ~ Cl) o.G) ~ .. U.:: 0. ...
8-= :I IU :I C.I as G) .&J 0- Cl,,! ti ~ C.I Cl) 2 !:! C.I .. ;.: ItI i.2 u.. Cl) L!. l- II i ~Q.
ItI ItI 1Vr:; :I: C G) C·IU C 0 %0 "E.c "CI-
"Cl "Cl -cc ..cc ~.,
10 IIlI Rod> 9
[ill Brood> tock 8 c
0 7 S a3 6 U) - 5 0 "-tU 4 .c E 3 ::t Z 2
0 ;:; e;. lE '" El j C
ItI ItI G) .. IV BItI .c Cl) .c Cl :I
.&J III o.G) .. .. Cl) ~ Cl lE :I .:o:!! o.!!! U
Cl G) :I ItI :I Col as G) .a u_ 0- U'l: Cl-a '"1tI ~ (,) Cl) 2! ~I ::1tI CJ .. L!. Cl) u.. ... :I: Cl)c.. IV IU ~:::
IQ ::t: C G) CItI 0 :c.g ~.;c "CI-
"Cl -cc ..cc
Figure 7. Comparison of 2SW retnrn rates per 10,000 smolts released using different strategies.
Exploitation of the Shannon stock by drift nets was high with nearly 77% of the lSW homewater stock taken during the summer months by commercial engines. This is slightly higher than the exploitation rates of 70% in 1993 and 1992 for Burrishoole hatchery salmon (0' Maoileidigh et aI1994).
11 .

Fishery Leaflet 164 - .19,94
The smolt release programme produces significant numbers of salmon returning to the Shannon. The numbers of 2SW fish in the returns were very low, indicating that these fish do :(lot constitute a significant proportion of the stock,
Analysis of the release strategies clearly indicates that bettef return rateli can bt;} achieved depending on the date and place of release. Poor return rates were shown from releases of presmolts. Helicopter releases proved to be most successful in terms of overall numbers of fish surviving to homewaters. Best returns were from helicopter releases at Parteen and downstream of the dam at Ardnacrusha. Releases at Killaloe and into the headrace and tailrace at Ardnacrusha also produced significant returns despite the operation of the turbines.
The results from the microtagging and recovery programme shows the fate of hatchery reared smolts released into the Shannon system. Return rates are influenced not only by the numbers of smolts released but also by marine mortality factors, exploitation and differences in release groups and strategies. Marine mortality (thennal habitat, predation etc) cannot be controlled but exploitation, husbangry techniques and release strategies can be adjusted to improve return rates overall or to particular elements of the fishery.
One of the key areas to be addressed in future stock management strategies is the development of a strong 2SW component of the stock. The extent to which this can be influenced is not yet known but the smolt release programme developed to date by the River Shannon Salmon Group has indicated some possible strategies which will benefit the Shannon salmon stock and the salmon fishery overall.
ACKNOWLEDG,iMENTS
We are indebted to B. Doolan (Fisheries Research Centre) who assisted with the National Coded Wire Tagging and Recovery Programme and the many bursar students who have participated in the programme. We are grateful to Mr. Paddy Barry (ESB) and Mr. Declan Quigley (Salmara) and Salmara hatchery staff for providing recovery material and broodstock information and also for providing invaluable assistance during tagging and tag recovery operations.
This programme was carried out under the auspices pf the River Shannon Salmon Management Progratnmechaired by Mr. J. C. 0' Dowd., Mr. John Cantwell and the Electricity· Supply Board are gratefully acknowledged for providing every assistance necessary to complete this programme. We would like to thank the other members of the River Shannon Salmon Management Group for providing an invaluable input into the overall planning of the programme. Declared salmon landings are provided by the Regional Fisheries Board Managers for each of the seven Regional Fisheries areas and by the Foyle Fisheries Commission.
This programme could not have been carried out without the full co-operation and .assistance of the many, salmon dealers,and processors, to whom we are indebted.
12
I I I I 1 ~.I
'·1 I I I I I ,I 'I
'JI '!I'" '.
I I :,'1··,
,. ,.
'I il
I I I I I I:
I I I I I I I I: I
• ----
Nial/ O'Maoileidigh et al.: Exploitation ahd survival of River Shannon reared salmon
REFERENCES
Anon. (1993). Report of the Meeting of the Working Group on North Atlantic Salmon. ICES CM 1994 ... Assess. 10,
Browne J. (1982). First results from a new method of tagging salmon - the coded wire tag. Fishery Leaflet 114, Dublin,
Br-owne J and Piggins D. J. (1986). Exploitation of Rew.ed Salmon Released into the BurrlllhoolelUver System. ICES CM 1986/ M:21
Hennessy H.A. (1960). Construction of a Bor/and type fish pass at Ardnacrusha Generating Station. Institution of Civil Engineers of Ireland. 4th April 1960.
0' Maoileidigh N., Browne J., Cullen A., McDennott T. and Keatinge M. (1994). Exploitation and survival of reared salmon released into the Burrishoole River system. Fishery Leaflet 161, Dublin.
Report on the Coded Wire Tag Recoveries (1980 to 1993). Annual Reports, Fisheries Research Centre, Abbotstown, Dublin.
Russell LC, Potter E.C.E, Reddin D.G. and Friedland K.D. (1993). Recoveries of coded wire microtags from salmon caught at West Greenland in 1992. ICES CM 1993/M:19.
13