i presentation · of operations, business strategies, product development plans, competitive...
TRANSCRIPT
INVESTOR PRESENTATION MAY 2018 JIM GAYNOR, PRESIDENT AND CEO DEVIN STANDARD, VP CORPORATE BUSINESS DEVELOPMENT

Safe Harbor Statement
This presentation contains “forward-looking” statements that are based on our beliefs and assumptions and on information currently available to us. Forward-looking statements include information concerning our possible or assumed future results of operations, business strategies, product development plans, competitive position, potential growth opportunities, use of proceeds and the effects of competition. Forward-looking statements include all statements that are not historical facts and can be identified by terms such as “anticipate,” “believe,” “could,” “seek,” “estimate,” “intend,” “may,” “plan,” “potential,” “predict,” “project,” “should,” “will,” “would” or similar expressions and the negatives of those terms. Forward-looking statements involve known and unknown risks, uncertainties and other factors that may cause our actual results, performance or achievements to be materially different from any future results, performance or achievements expressed or implied by the forward-looking statements. Forward-looking statements represent our beliefs and assumptions only as of the date of this presentation. Except as required by law, we assume no obligation to update these forward-looking statements publicly, or to update the reasons actual results could differ materially from those anticipated in the forward-looking statements, even if new information becomes available in the future. This presentation includes certain non-GAAP financial measures as defined by the SEC rules. We believe these non-GAAP financial measures are appropriate indicators to assist in the evaluation of our operating performance on a period-to-period basis. We have provided a reconciliation of those measures to the most directly comparable GAAP measures, which is available in this presentation.
2

Strength Through Diversification
v30 years of leadership in precision optics,
visible and infrared
vDeep expertise in optical aspheric lens
design for visible and IR applications
vMarkets include industrial, commercial,
medical, defense, datacom
vLow cost / high volume manufacturing
capability in China, Europe and US
vContinued Profitability with High Margins
while Investing for Future Growth
v331 Employees: 117 in United States, 126 in
China, and 88 in Europe
v Accelerated growth opportunities through acquisition of ISP Optics which became a wholly owned subsidiary in December 2016
3

Leaders in optical and infrared solutions LightPath Confidential – DO NOT DISTRIBUTE
Q3 2018 Market Dynamics
6
Market Status Product
Telecom Weak- signs of life PMO/CCA
Defense Recovering IR/Vis optics
Mobility/Auto Safety Strong Lidar/IR/Vis optics
Medical Strong IR/Vis optics/Endoscopy
Commercial Strong Lidar/IR/Vis optics
Drones Strong IR/Vis optics
Catalog Maintain Various

5
The Good News
LPTH investments in • Diamond Turning Capacity
• Optical Coating Capacity
• Material Polishing Capability
• LCR Precision Glass Molding Capacity
• Engineering Bench Strength
• Salesforce Technical Training
• Proprietary Materials IP
Is starting to payoff in wins in Defense, Public Safety(Fire),Mobility (LIDAR & illumination) & more.

6
Telecom Weakness
Focus Actions • Invest in cost saving activities • Drive volume through LCR • Data mine to harvest existing
customer base • Upsell existing customer base • Prepare for 5G(China/US) • Grow in growth areas outside
telecom • 3Q18 bookings increase from
2Q18
Experiencing some base business softness

7
Defense & Pub Safety +$80mm IR Optics Opportunity

8
Uncooled Thermal Sights-Optics Commercial
• >$30 mm
• ATN • DRS(fire fighting) • FLIR • Leupold • NIVISYS • Night Optics USA • N Vision Optics • Pulsar • Thermoteknix • Torrey Pines Logic • Trijicon • Seek Thermal
Military • >$50 mm
• Controp • Elbit • Diehl • FLIR • DRS • L-3 Insight • N2 Imaging (UTC) • Nivisys • Northrop Grumman • Opgal • RAYTHEON • Sagem • Thales • Trijicon
LPTH currently capturing ~20% of commercial market and moving into the military market ITAR regs = major hurdle outside of USA Legend:
Green: Active customer currently buying lenses and assemblies Yellow: In talks with customer about a specific project Red: Not yet a customer

9
LIDAR/Autonomous Vehicles Industry
• LiDAR market expected to reach a value of $3 billion by 2022
• CAGR of 12.7% during the forecast period, 2017-2022
• Market growth: – Automotive – Mapping – New sectors like drone
delivery
Providing collimating and Receiving optics to industry for:
• Lidar enhanced Fork lifts • Lidar enhanced Automobiles
LPTH entering with several LIDAR/night vision outfits -- fiber collimation, free form, & IR imaging
$1.5 Billion in 2016

10
Medical Imaging- Endoscopy
Partner with a cutting-edge, low-cost, instrument manufacturer in a $1.7B market/5.8 million surgeries (15 patents)

11
Commercial Applications
• Oil and Gas monitoring • Power gen and distribution control • Quality control • HVAC • Drones • Automotive headlights • Housing inspection • Laser tools/range finding
FLIR, Huawei, Osram, Chauvin, Renishaw, Hilti, Fluke

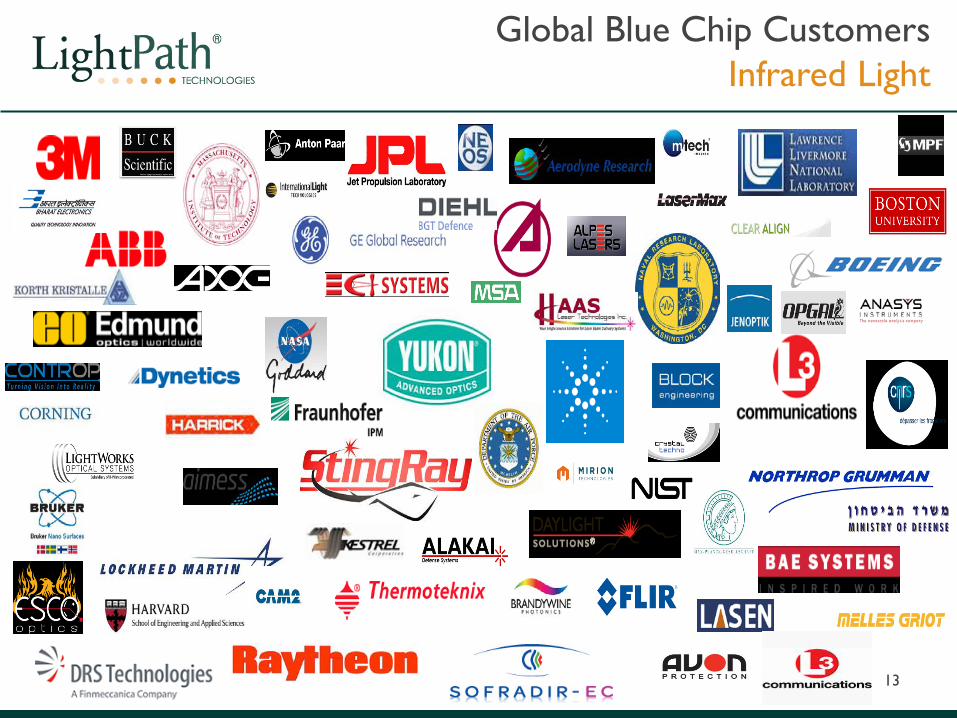
Global Blue Chip Customers Infrared Light
13

Acquisition Assessment
Customer Count • 2016 -- 786 Active Customers
• 2017 -- 965 Active Customers
Product Count • 2016 -- 1,183 SKUs
• 2017 -- 1,895 SKUs
Countries with Sales • 2016 -- 18 Countries
• 2017 -- 31 Countries
22% Increase
60% Increase
72% Increase
14
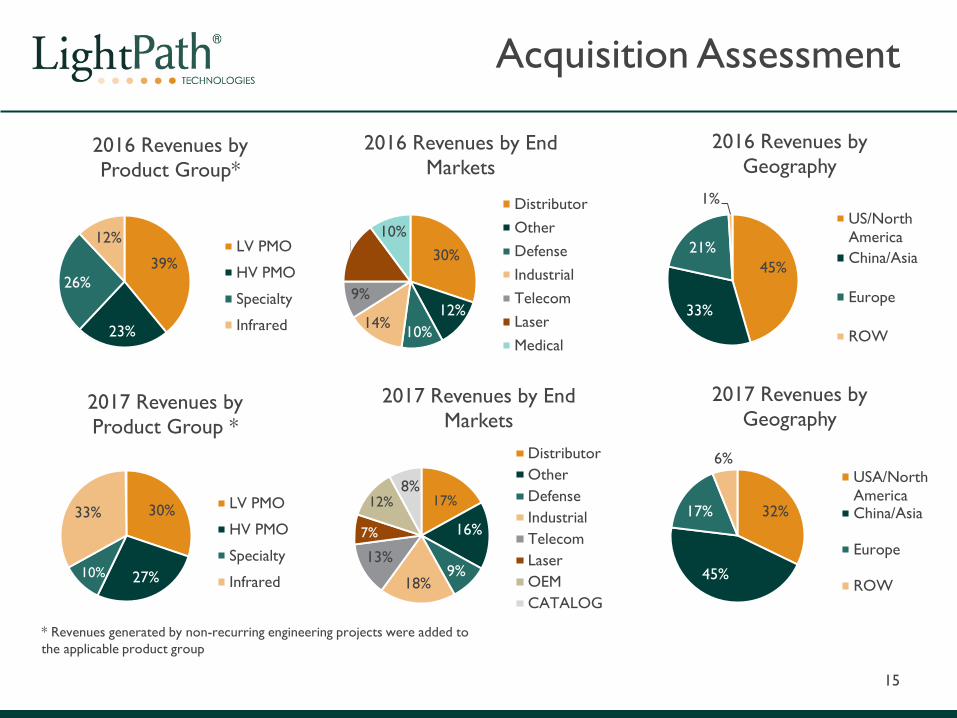
Acquisition Assessment
39%
23%
26%
12%
2016 Revenues by Product Group*
LV PMO
HV PMO
Specialty
Infrared
30%
12% 10% 14%
9%
[PERCENTAGE] 10%
2016 Revenues by End Markets
DistributorOtherDefenseIndustrialTelecomLaserMedical
45%
33%
21%
1%
2016 Revenues by Geography
US/NorthAmericaChina/Asia
Europe
ROW
30%
27%
33%
2017 Revenues by Product Group *
LV PMO
HV PMO
Specialty
Infrared
32%
45%
17%
6%
2017 Revenues by Geography
USA/NorthAmericaChina/Asia
Europe
ROW
16%
9% 18%
13%
8%
2017 Revenues by End Markets
DistributorOtherDefenseIndustrialTelecomLaserOEMCATALOG
12%
* Revenues generated by non-recurring engineering projects were added to the applicable product group
15
17%
7%
10%

Financial Performance (Fiscal year ended June 30)
16
In 3QFY18, debt was reduced by $3.3 million or 32% through a debt restructuring and minimal use of cash on hand
($000’s) FY 2015 FY 2016 FY 2017 9Mo FY 2018
Total Sales $13,662 $17,272 $28,367 $24,437YoY Growth 15% 26% 64% 26%
Total Infrared Sales $1,220 $2,029 $9,408 $12,173YoY Growth 149% 66% 364% 131%
Gross Margin % 44% 54% 52% 41%
Non-GAAP Operating Inc* $26 $2,357 $4,137 $868
Non-GAAP Operating Inc %* 0% 14% 15% 4%
Non-GAAP Net Inc* $34 $1,711 $8,171 $2,062
Non-GAAP Net Inc %* 0% 10% 29% 8%
GAAP EPS - basic (0.05)$ 0.09$ 0.39$ ** 0.08$
Non-GAAP EPS * 0.00$ 0.11$ 0.41$ ** 0.08$
Cash $1,644 $2,908 $8,085 $6,388
Debt - - $11,038 $6,938
**Includes $0.27 per share impact of deferred tax benefit driven by acquisition of ISP
Vision
LightPath will be the best at what we do!
What do we do? We bend light! Ø LightPath manufactures products that manage light so it can be used
to do useful work Ø LightPath uses innovative technology to provide products to our
customers at the best value Ø LightPath leverages its manufacturing and R&D capabilities to be a
fully integrated manufacturer of visible and infrared optical components
17
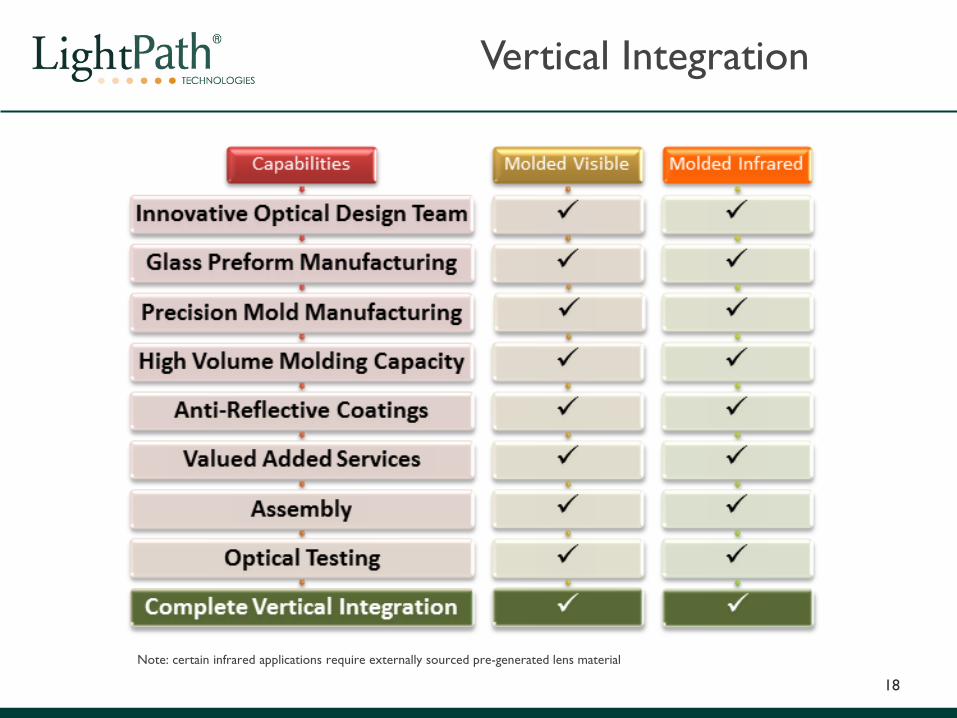
Vertical Integration
18
Note: certain infrared applications require externally sourced pre-generated lens material

LightPath Unique #1
• Mold • Diamond Turn • CNC • Conventional Grind & Polish • Flexible Materials
Flexible Fabrication
19

Flexible Fabrication Manufacturing Capabilities
• Vertically Integrated Processes – Lens Fabrication Capabilities
• Precision Molding • Diamond Turning • CNC Polishing • Conventional Grind and Polish
– Large Variety of Glass Materials Available – Large Lens Capability – AR and DLC Coating for visible and infrared – Full Range of Metrology – High Volume Manufacturing – Facilities
• North America 39,000 sq ft Added 13,000 sq ft (ISP) • Europe 27,000 sq ft Added 27,000 sq ft (ISP) • Asia 41,000 sq ft Added 13,000 sq ft
20

LightPath Unique #2
• Concept to high volume manufacturer Optical
Solutions
21

Optical solutions – Design & Investment
• LightPath employs 45 Engineers as of 5/15/18
• Capital Investments for Growth and Cost Reduction – 2016 $1.1 million – 2017 $2.2 million – 2018 $2.5 million invested in first nine months of year
22
4, 9%
13, 29%
28, 62%
Degree Breakdown
PhD.
M.S.
B.S.
[VALUE], 18%
16, 35% [VALUE], 27%
[VALUE], 20%
Location Breakdown
New York
Orlando
Riga
Zhenjiang31, 69%
3, 7%
6, 13%
[VALUE], 11%
Discipline Breakdown
Manufacturing
Material
Optical
Opto-Mechanical

LightPath Unique #3
• Manufacturing Facilities • Asia • North America • Europe
Worldwide Organization
23

Optical Solutions Diversified High Potential Platforms
Diversification is Core Strength • 2 Segments - Visible and Infrared • Multiple Product Platforms • International Reach • High Growth Market Trends • Large Strategic Partners • Broad Customer Base
24
Market Status Product
Telecom Weak PMO/CCA
Defense Recovering IR/Vis optics
Public Safety Strong IR/Vis optics
Mobility/auto safety Strong Lidar/IR/Vis optics
Medical Strong Endoscopy/ PMO
Commercial IR Strong IR optics
Drones Strong Lidar/IR/Vis optics
LPTH strategic investments, and NPD, is driving growth in new areas

Experienced Management Team
Alan Symmons Executive Vice President, Operations
CEO since January 2008, previously Corporate Vice President of Operations from July 2006 to January 2008. Prior to joining LightPath: Director of Operations for Puradyn Filter Technologies, Vice President of Operations and General Manager for JDS Uniphase Corporation’s Transmission Systems Division.
J. James Gaynor Chief Executive Officer
Dorothy Cipolla Chief Financial Officer
Hui Yue General Manager, China
CFO since February 2006. Prior to joining LightPath: CFO for both public and private companies including LaserSight Technologies, Inc. (NASDAQ), Network Six, Inc. (NASDAQ), Vice President of Finance with Goliath Networks, Inc., Department Controller of Alliant Energy Corporation. She is a certified public accountant.
Executive Vice President of Operations since February 2015, previously Vice President of Corporate Engineering from September 2010 to February 2015 and Director of Engineering from October 2006 to September 2010. Prior to joining LightPath: Engineering Manager for Aurora Optical, a subsidiary of Multi-Fineline Electronix and worked for Applied Image Group – Optics, (AIG/O).
General Manager of LightPath Optical Instrumentation Co (Shanghai) since 2012 and General Manager of LightPath Optical Instrumentation Co (Zhenjiang) since 2013, previously served as Sales Manager from April 2007 to 2013. Prior to joining LightPath: Senior Director of Sales at Walsin Fujikura.
Devin Standard Vice President Corporate Business Development
Vice President of Corporate Development since April 2017. Prior to joining LightPath was the Worldwide Sales Manager and Business Development for Infrared Optical Material for Schott N.A., a Senior Account Manager for Janos Technology and the Director of Business Development & Marketing for Insight Technology. Prior to that he held senior positions in business development for Smith & Wesson Holding Corp., The Hach Company and Quasark America.
25

Accomplished Board of Directors
Sohail Khan Director
CEO since January 2008, previously Corporate Vice President of Operations from July 2006 to January 2008. Prior to joining LightPath: Director of Operations for Puradyn Filter Technologies, Vice President of Operations and General Manager for JDS Uniphase Corporation’s Transmission Systems Division.
J. James Gaynor Chief Executive Officer
Robert Ripp Chairman of the Board
Dr. Steven Brueck Director
Director and Chairman of the Board since 1999, during portions of fiscal year 2002, he also served as interim President and CEO. Previously he was Chairman and CEO of AMP Incorporated and VP and Treasurer of IBM. He has also served on the board of directors of PPG Industries, Axiall Corporation and Ace Limited, all on the New York Stock Exchange.
Director since 2005. Previously he was Chairman and CEO of ViSX Systems, Inc., CEO and director of Lilliputian Systems, managing partner of K5 Innovations, President and CEO and directors of SiGe Semiconductor, and Entrepreneur in Residence and Operating Partner of Bessemer Venture Partners. He has also served on the board of directors of Intersil Corporation.
Director since 2001. Distinguished Professor, Emeritus of Electrical and Computer Engineering and of Physics at the University of New Mexico in Albuquerque, New Mexico. He is a fellow of The Optical Society, the Institute of Electrical and Electronics Engineers, the American Association for the Advancement of Science, and the National Academy of Inventors.
Director since 1996. A self-employed business consultant. Previously was senior financial advisor and VP of Finance of The Fetzer Institute and audit manager for Price Waterhouse & Co. Member of Financial Foundation Officers Group and the chairman and trustee for the John E. Fetzer Memorial Trust Fund.
Louis Leeburg Director
Craig Dunham Director
M. Scott Faris Director
Director since 2016, previously served as a consultant to the Board. A self-employed business and M&A consultant. Previously was CEO of Applied Pulsed Power Inc., President, CEO of Dynasil Corporation, partner with a private equity group to pursue acquisitions of mid-market manufacturing companies, VP/General Manager of the Tubular Division at Kimble Glass Corporation, and various increasing leadership responsibilities at Corning Incorporated. Director of Applied Pulsed Power Inc and Dynasil Corporation.
Director since 2011. Experienced entrepreneur with almost two decades of operating, venture-financing, and commercialization experience, involving more than 20 start-up and emerging-growth technology companies. Chief Business Officer of Luminar Technologies, Inc., founder and Chief Executive Officer of Enterprise Corporation, a technology accelerator, director of the Florida Seed Capital Fund and Technology Commercialization at the Center for Microelectronics Research, and past chairman of the Metro Orlando EDC. Previously a director of Open Photonics, Inc. and Aerosonix, Inc., both of which were private companies. 26

• Consistently strong financial performance in past years bolstered by ISP acquisition
• Accelerating revenue growth opportunities with new products, markets and cross-selling strategies
• Core markets are diversified and experiencing solid growth
• Catalysts include engagement in exciting, high volume potential secular market trends
• IR markets generating high ASP and GM business opportunities
• Profitable in FY17; EBITDA* margins exceeding cash requirements; Debt reduction in 3QFY18
• Backlog of $12.9M at 3/31/18, up 5% from $12.3M at 12/31/17 and up 38% from $9.3M at 6/30/17
• High volume manufacturing efficiencies
• Capital expenditures for 9 months FY18 was $2.5M, up 76% as compared with 9 months FY17, raising production capacity approximately 60% depending on product mix
• Leading IP/technology portfolio includes molding and diamond turning capabilities
• Strategic acquisitions will be part of our growth story
• Experienced management; significant insider/affiliate ownership
Investment Highlights
27 * See Appendix for reconciliation of non-GAAP items

APPENDIX

Industry Available Products Growth Driver Application
Defense: DT Assembly DT Element Molded Element Molded Assembly Window/Beamsplitter Laser Collimator/Fused PMO Zoom Lens
Dense Homeland Security
Missiles Driver Vision Enhancement Night Vision Apps Aiming + Illumination ISR Robots/ Training Force Protection
Automotive: Molded B6 element/assembly DT Ge element/assembly Laser Headlight Collimator Lidar Collimator Windows
Population growth Safety Efficiency operations Vehicle efficiency Manufacturing efficiency
Autonomous Vehicles Manufacturing Illumination Night vision Lidar/collision avoidance
Datacom: PMO 99% Fiber Delivery System 1%
Smart Phones Urbanization Globalization
Fiber Networks Phone accessories Switching etc.
LightPath Opportunity Matrix
29

LightPath Opportunity Matrix
Industry Available Products Growth Driver Application
Medical & Pharmaceutical/ Consumer Products:
Endoscopes PMO Laser Collimators IR Microscope Objectives IR Assemblies/ Molded/ Diamond Turned Beam Splitter/ Window Gradium
Better Life Growing Population Baby Boom – Old Imaging/ Non-contact Process Control Drug development Product development
B.M.S./ Colgate Novartis/ Unilever Teva / P&G Pfeizer/ Millemium Takada/ Phillips Strykker/ J&J Warner Lambert/ Revlon Medical Equipment
Univ/ Govt. & Lab/Science:
PMO Collimator Microscope Objectives Mirrors IR Assemblies/ Windows Zoom Lenses/ Spectrometers Telescopes
Discovery NASA Fraunhofer DARPA ARL, NRL, ONR, etc EPA Universities
30

Fiscal 2018 Third Quarter Income Statement (Unaudited)
31
Three Months Ended Nine Months EndedMarch 31, March 31, March 31, March 31,
2018 2017 2018 2017
Revenue, net 8,503,628$ $ 8,490,042 $ 24,437,094 $ 19,360,109Cost of sales 5,211,602 4,267,318 14,344,015 9,007,180
Gross margin 3,292,026 4,222,724 10,093,079 10,352,929
Operating expenses:Selling, general and administrative 2,362,578 2,329,762 7,054,996 6,190,705New product development 384,380 308,394 1,178,849 853,939Amortization of intangibles 329,270 304,809 987,812 304,809Loss on disposal of property and equipment — — 3,315 —
Total operating costs and expenses 3,076,228 2,942,965 9,224,972 7,349,453
Operating income 215,798 1,279,759 868,107 3,003,476
Other income (expense):Interest expense (118,890) (154,639) (434,671) (167,832)Interest expense - debt costs 461,686 (38,338) 382,459 (38,338) Change in fair value of warrant liability - (748,169) (194,632) (457,784)Other income (expense), net 484,531 27,985 927,383 (228,935)Total other income (expense), net 827,327 (913,161) 680,539 (892,889)
Income before income taxes 1,043,125 366,598 1,548,646 2,110,587Provision for income taxes (183,154) 265,774 (318,678) 771,600
Net income 1,226,279$ 100,824$ 1,867,324$ 1,338,987$
Foreign currency translation adjustment 77,477 38,636 200,886 113,818
Comprehensive income 1,303,756$ 139,460$ 2,068,210$ 1,452,805$
Earnings per common share (basic) 0.05$ 0.00$ 0.08$ 0.07$
Number of shares used in per share calculation (basic) 25,546,512 23,818,136 24,763,458 18,621,072
Earnings per common share (diluted) 0.04$ 0.00$ 0.07$ 0.07$
Number of shares used in per share calculation (diluted) 27,281,010 25,628,703 26,618,956 20,145,976
LIGHTPATH TECHNOLOGIES, INC.Consolidated Statements of Comprehensive Income
(unaudited)

Fiscal 2018 Third Quarter Balance Sheet (Unaudited)
32
March 31, June 30,
Assets 2018 2017Current assets:
Cash and cash equivalents $ 6,388,164 $ 8,085,015 5,672,071 5,890,113
Inventories, net 6,409,118 5,074,576 Other receivables 59,375 29,202 Prepaid expenses and other assets 1,043,603 641,469
Total current assets 19,572,331 19,720,375
Property and equipment, net 12,322,111 10,324,558 Intangible assets, net 9,387,240 10,375,053 Goodwill 5,854,905 5,854,905 Deferred tax assets, net 285,000 285,000 Other assets 137,084 112,323
Total assets $ 47,558,671 $ 46,672,214 Liabilities and Stockholders’ Equity
Current liabilities: Accounts payable $ 2,039,090 $ 1,536,121 Accrued liabilities 514,479 966,929 Accrued payroll and benefits 1,113,840 1,896,530 Loans payable, current portion 1,458,800 1,111,500 Capital lease obligation, current portion 219,688 239,332
Total current liabilities 5,345,897 5,750,412
Capital lease obligation, less current portion 271,175 142,101 Deferred rent 400,605 458,839 Deferred tax liabilities - 182,349 Warrant liability - 490,500 Loans payable, less current portion 5,479,565 9,926,844
Total liabilities 11,497,242 16,951,045
Stockholders’ equity:Preferred stock: Series D, $.01 par value, voting;
500,000 shares authorized; none issued and outstanding — — Common stock: Class A, $.01 par value, voting;
44,500,000 shares authorized; 25,730,544 and 24,215,733shares issued and outstanding 257,305 242,157
Additional paid-in capital 229,749,154 225,492,252 Accumulated other comprehensive income 496,282 295,396 Accumulated deficit (194,441,312) (196,308,636)
Total stockholders’ equity 36,061,429 29,721,169
Total liabilities and stockholders’ equity $ 47,558,671 $ 46,672,214
Trade accounts receivable, net of allowance of $19,358 and $7,356
LIGHTPATH TECHNOLOGIES, INC.Consolidated Balance Sheets
(unaudited)

33
Fiscal 2018 Third Quarter Non-GAAP Reconciliation (Unaudited)
(Unaudited) (Unaudited)Quarter Ended: Nine Months Ended:
March 31, 2018
March 31, 2017
March 31, 2018
March 31, 2017
Net income 1,226,279$ 100,824$ 1,867,324$ 1,338,987$ Change in fair value of warrant liability — 748,169 194,632 457,784
Adjusted net income 1,226,279$ 848,993$ 2,061,956$ 1,796,771$
% of revenue 14% 10% 8% 9%
(Unaudited) (Unaudited)Quarter Ended: Nine Months Ended:
March 31, 2018
March 31, 2017
March 31, 2018
March 31, 2017
Net income 1,226,279$ 100,824$ 1,867,324$ 1,338,987$ Depreciation and amortization 866,329 721,636 2,492,003 1,240,232 Provision for income taxes (183,154) 265,774 (318,678) 771,600Interest expense (342,796) 192,977 52,212 206,170 EBITDA 1,566,658$ 1,281,211$ 4,092,861$ 3,556,989$ Change in fair value of warrant liability — 748,169 194,632 457,784
Adjusted EBITDA 1,566,658$ 2,029,380$ 4,287,493$ 4,014,773$
% of revenue 18% 24% 18% 21%