i of a donor munitions stack and responses of a thin ... · ratio) standoff distance, computations...
TRANSCRIPT
ARMY RESEARCH LABORATORY
I l
I L
I ’
I c
Standoff Variation Study II: Detonation of a Donor Munitions Stack and
Responses of a Thin Rectangular Water Barricade and an Acceptor Stack
Richard E. Lottero
AFCLTR-1948 . ..__._
May 1999
‘I 9990628 044 .i Approved for public release; distribution is unlimited.
L I
The fiidings in this report are not to be construed as an official Department of the Army position unless so designated by other authorized documents.
Citation of manufacturer’s or trade names does not constitute an offkial endorsement or approval of the use thereof.
Destroy this report when it is no longer needed. Do not return it to the originator.
Army Research Laboratory Aberdeen Proving Ground, MD 2 1005-5066
ARL-TR-1948 May 1999
Standoff Variation Study II: Detonation of a Donor Munitions Stack and Responses Barricade
of a Thin Rectangular Water
and an Acceptor Stack
Richard E. Lottero Weapons and Materials Research Directorate, ARL
Approved for public release; distribution is unlimited.
Abstract
This report documents the second stage of the continuation of the fully coupled numerical modeling of the detonation of a simplified munitions stack in a temporary storage area and the subsequent effects on the immediate surroundings of the stack. Three plausible configurations of this munitions stack, referred to as the “donor” stack, an intervening water barricade, and an “acceptor” munitions stack are modeled in two-dimensional (2-D) Cartesian hydrocode computations using the CTH hydrodynamics computer code. The distance between each munitions stack and the barricade, referred to here as the “standofY’ distance, is varied from one computation to the next, with the physical characteristics of the munitions stacks and barricade themselves remaining unchanged. The donor stack is modeled as an uncased, condensed high-explosive charge with a rectangular cross section. The water barricade has a relatively thin rectangular cross section, and the acceptor stack is a solid iron rectangle. The loadings on both the barricade and the acceptor stack are computed, as are their fully coupled responses to those loadings. Only a relatively weak inverse functional relationship with standoff distance was found in the barricade response. Weak correlations with both standoff distance and face separation were also found for all parameters that were evaluated for the acceptor stack response, except for the whole-body acceleration. The results are compared with those of the first part of this study on the coupled blast loading and response computations for a massive water barricade with a trapezoidal cross section.
ii
.

ACKNOWLEDGMENTS
Technical consultation on the selection of munitions to be modeled and on mu- nitions storage layouts was provided by Drs. Robert Frey and John Starkenberg of the U.S. Army Research Laboratory (ARL). T ec h nical consultation and support in the use of the latest versions of the CTH hydrodynamics computer code were pro- vided by Messrs. Stephen Schraml and Kent Kimsey of ARL and Dr. Eugene Hertel of Sandia National Laboratories (SNL). T ec h nical and financial support were pro- vided by Mr. Duane Scarborough of the U.S. Army Defense Ammunition Logistics (Ammolog) Activity. Their assistance and support are gratefully acknowledged.
1..
111

.
INTENTIONALLY LEFT BLANK
iv
TABLE OF CONTENTS
.
LIST OF FIGURES ...............................
LIST OF TABLES ................................
1. INTRODUCTION ................................
2. COMPUTATIONAL APPROACH AND GEOMETRY ............
Page
2.1. The
2.2. The
2.3. The
2.4. The
Hydrocode Model ..............................
Donor Munitions Stack ..................... 1 .....
Barricade ............................... ; ...
Acceptor Munitions Stack ..........................
3. THE HYDROCODE COMPUTATIONS ........ : ...........
3.1. Flow Field Development ............. ; ................
3.2. Barricade Dynamics ...............................
3.3. Acceptor Stack Dynamics ............................
3.4. Acceptor Stack Left Surface Pressures ......................
4. CONCLUSION ..................................
REFERENCES ...................................
DISTRIBUTION LIST ..................... ; ........
REPORT DOCUMENTATION PAGE ......................
vii
xi
1
2
2
3
4
5
5
5
34
47
56
60
61
63
67
V

INTENTIONALLY LEFT BLANK
vi
Figure LIST OF FIGURES
Page
1
2
3
4
5
6
7
8
9
10
11
12
13
14
15
Flow Field at Time = 0.0 for Computation 980825, 3.05-m Standoff, Thin Rectangular Barricade . . . . . . . . . . . . . . . . . . . . . . . . . . . . . .
Flow Field at Time = 0.0 for Computation 980505, 3.05-m Standoff, Massive Trapezoidal Barricade . . . . . . . . . . . . . . . . . . . . . . . . . . . . . .
Flow Field at Time = 5.0 ms for Computation 980825, 3.05-m Standoff, Thin Rectangular Barricade . . . . . . . . . . . . . . . . . . . . . . . . . . . . . .
Flow Field at Time = 5.0 ms for Computation 980505, 3.05-m Standoff, Mas- sive Trapezoidal Barricade . . . . . . . . . . . . . . . . . . . . . . . . . . . .
Flow Field at Time = 7.5 ms for Computation 980825, 3.05-m Standoff, Thin Rectangular Barricade . . . . . . . . . . . . . . . . . . . . . . . . . . . . . .
Flow Field at Time = 7.5 ms for Computation 980505, 3.05-m Standoff, Mas- sive Trapezoidal Barricade . . . . . . . . . . . . . . . . , . . . . . . . . . . .
Flow Field at Time = 10.0 ms for Computation 980825, 3.05-m Standoff, Thin Rectangular Barricade . . . . . . . . . . . . . . . . . . . . . . . . . . . . . .
Flow Field at Time = 10.0 ms for Computation 980505, 3.05-m Standoff, Massive Trapezoidal Barricade . . . . . . . . . . . . . . . . . . . . . . . . . .
Flow Field at Time = 12.5 ms for Computation 980825, 3.05-m Standoff, Thin Rectangular Barricade . . . . . . . . . . . . . . . . . . . . . . . . . . . . . .
Flow Field at Time = 12.5 ms for Computation 980505, 3.05-m Standoff, Massive Trapezoidal Barricade . . . . . . . . . . . . . . . . . . . . . . . . . .
Flow Field at Time = 15.0 ms for Computation 980825, 3.05-m Standoff, Thin Rectangular Barricade . . . . . . . . . . . . . . . . . . . . . . . . . . . . . .
Flow Field at Time = 15.0 ms for Computation 980505, 3.05-m Standoff, Massive Trapezoidal Barricade . . . . . . . . . . . . . . . . . . . . . . . . . .
Flow Field at Time = 20.0 ms for Computation 980825, 3.05-m Standoff, Thin Rectangular Barricade . . . . . . . . . . . . . . . . . . . . . . . . . . . . . .
Flow Field at Time = 20.0 ms for Computation 980505, 3.05-m Standoff, Massive Trapezoidal Barricade . . . . . . . . . . . . . . . . . . . . . . . . . .
Flow Field at Time = 30.0 ms for Computation 980825, 3.05-m Standoff, Thin Rectangular Barricade . . . . . . . . . . . . . . . . . . . . . . . . . . . . . .
7
8
9
10
11
12
14
15
16
17
18
19
20
21
22
/ vii
Figure LIST OF FIGURES (continued)
Page
16
17
18
19
20
21
22
23
24
25
26
27
28
29
30
Flow Field at Time = 30.0 ms for Computation 980505, 3.05-m Standoff, Massive Trapezoidal Barricade . . . . . . . . . . . . . . . . . . . . . . . . . .
Flow Field at Time = 40.0 ms for Computation 980825, 3.05-m Standoff, Thin Rectangular Barricade . . . . . . . . . . . . . . . . . . . . . . . . . . . . . .
Flow Field at Time = 40.0 ms for Computation 980505, 3.05-m Standoff, Massive Trapezoidal Barricade . . . . . . . . . . . . . . . . . . . . . . . . . .
Flow Field at Time = 0.0 for Computation 980826, 2.50-m Standoff, Thin Rectangular Barricade . . . . . . . . . . . . . . . . . . . . . . . . . . . . . .
Flow Field at Time = 5.0 ms for Computation 980826, 2.50-m Standoff, Thin Rectangular Barricade . . . . . . . . . . . . . . . . . . . . . . . . . . . . . .
Flow Field at Time = 10.0 ms for Computation 980826, 2.50-m Standoff, Thin Rectangular Barricade . . . . . . . . . . . . . . . . . . .’ . . . . . . . . . . .
Flow Field at Time = 15.0 ms for Computation 980826, 2.50-m Standoff, Thin Rectangular Barricade . . . . . . . . . . . . . . . . . . . . . . . . . . . . . .
Flow Field at Time = 20.0 ms for Computation 980826, 2.50-m Standoff, Thin Rectangular Barricade . . . . . . . . . . . . . . . . . . . . . . . . . . . . . .
Flow Field at Time = 30.0 ms for Computation 980826, 2.50-m Standoff, Thin Rectangular Barricade . . . . . . . . . . . . . . . . . . . . . . . . . . . . . .
Flow Field at Time = 40.0 ms for Computation 980826, 2.50-m Standoff, Thin Rectangular Barricade . . . . . . . . . . . . . . . . . . . . . . . . . . . . . .
Flow Field at Time = 0.0 for Computation 980827, 2.00-m Standoff, Thin Rectangular Barricade . . . . . . . . . . . . . . . . . . . . . . . . . . . . . .
Flow Field at Time = 5.0 ms for Computation 980827, 2.00-m Standoff, Thin Rectangular Barricade . . . . . . . . . . . . . . . . . . . . . . . . . . . . . .
Flow Field at Time = 10.0 ms for Computation 980827, 2.00-m Standoff, Thin Rectangular Barricade . . . . . . . . . . . . . . . . . . . . . . . . . . . . . .
Flow Field at Time = 15.0 ms for Computation 980827, 2.00-m Standoff, Thin Rectangular Barricade . . . . . . . . . . . . . . . . . . . . . . . . . . . . . .
Flow Field at Time = 20.0 ms for Computation 980827, 2.00-m Standoff, Thin Rectangular Barricade . . . . . . . . . . . . . . . . . . . . . . . . . . . . . .
23
25
26
27
28
29
30
31
32
33
35
36
37
38 .
39
. . . Vlll
Figure LIST OF FIGURES (continued)
Page
31
32
33
34
35
36
37
38
39
40
41
42
43
44
Flow Field at Time = 30.0 ms for Computation 980827, 2.00-m Standoff, Thin Rectangular Barricade . . . . . . . . . . . . . . . . . . . . . . . . . . . . . .
Flow Field at Time = 40.0 ms for Computation 980827, 2.00-m Standoff, Thin Rectangular Barricade . . . . . . . . . . . . . . . . . . . . . . . . . . . . . .
Water Barricade X-Direction Momentum Toward Acceptor Stack, Computa- tions 980825 Through 980827 (Rectangular), Plus 980505 (Trapezoidal) . . .
Water Barricade X-Direction Velocity Toward the Acceptor Stack, Computa- tions 980825 Through 980827 (Rectangular), Plus 980505 (Trapezoidal) . . .
Water Barricade X-Direction Acceleration Toward the Acceptor Stack, Com- putations 980825 Through 980827 (Rectangular), Plus 980505 (Trapezoidal)
Water Barricade Initial X-Direction Acceleration Toward the Acceptor Stack, Computations 980825 Through 980827 (Rectangular), Plus 980505 (Trape- zoidal) . . . . . . . . . . . . . . . . . . . . . . . . . . . . . . . . . . . . . . .
Water Barricade Left Surface Total X-Direction Impulse per Meter Depth, Computations 980825 Through 980827 (Rectangular), Plus 980505 (Trape- zoidal) . . . . . . . . . . . . . . . . . . . . . . . . . . . . . . . . . . . . . . .
Water Barricade X-Direction Distance Moved Toward the Acceptor Stack, Computations 980825 Through 980827 (Rectangular), Plus 980505 (Trape- zoidal) . . . . . . . . . . . . . . . . . . . . . . . . . . . . . . . . . . . . . . .
Normalized (Direct Ratio) Barricade Parameters Versus Standoff Distance, Computations 980825 Through 980827 . . . . . . . . . . . . . . . . . . . . .
Normalized (Direct Ratio) Barricade Parameters Versus Normalized (Indirect Ratio) Standoff Distance, Computations 980825 Through 980827 . . . . . . .
Normalized (Direct Ratio) Barricade Parameters Versus Normalized (Indirect Ratio) Standoff Distance (Resealed), Computations 980825 Through 980827
Acceptor Stack X-Direction Momentum for Computations 980825 Through 980827 (Rectangular), Plus 980505 (Trapezoidal) . . . . . . . . . . . . . . .
Acceptor Stack X-Direction Velocity, Computations 980825 Through 980827 (Rectangular), Plus 980505 (Trapezoidal) . . . . . . . . . . . . . . . . . . . .
Acceptor Stack X-Direction Acceleration for Computations 980825 Through 980827 (Rectangular), Plus 980505 (Trapezoidal) . . . . . . . . . . . . . . .
40
41
42
43
44
45
46
47
48
48
49
50
51
52
ix
Figure LIST OF FIGURES (continued)
Page
45
46
47
48
49
50
51
52
53
54
Acceptor Stack X-Direction Total Impulse per Meter Depth, Computations 980825 Through 980827 (Rectangular), Plus 980505 (Trapezoidal) . . . . . .
Acceptor Stack X-Direction Distance Moved, Computations 980825 Through 980827 (Rectangular), Plus 980505 (Trapezoidal) . . . . . . . . . . . . . . .
Normalized (Direct Ratio) Acceptor Stack Parameters Versus Standoff Dis- tance, Computations 980825 Through 980827 . . . . . . . . . . . . . . . . .
Normalized (Direct Ratio) Acceptor Stack Parameters Versus Normalized (In- verse Ratio) Standoff Distance, Computations 980825 Through 980827 . . .
Normalized (Direct Ratio) Acceptor Stack Parameters Versus Normalized (In- verse Ratio) Standoff Distance (Resealed), Computations 980825 Through 980827 . . . . . . . . . . . . . . . . . . . . . . . . . . . . . . . . . . . . . . .
Normalized (Direct Ratio) Acceptor Stack Parameters Versus Face Separation, Computations 980825 Through 980827 . . . . . . . . . . . . . . . . . . . . .
Normalized (Direct Ratio) Acceptor’Stack Parameters Versus Normalized (In- verse Ratio) Face Separation, Computations 980825 Through 980827 . . . .
Acceptor Stack Left Surface Overpressure, 3.05-m Standoff, Computations 980825 (Rectangular) and 980505 (Trapezoidal) . . . . . . . . . . . . . . . .
Acceptor Stack Left Surface Overpressure, 2.50-m Standoff, Computations 980826 (R ec an u ar and 980521 (Trapezoidal) . . . . . . . . . . . . . . . . t g 1 )
Acceptor Stack Left Surface Overpressure, 2.00-m Standoff, Computations 980827 (Rectangular) and 980610 (Trapezoidal) . . . . . . . . . . . . . . . .
53
53
54
55
55
56
57
58
59
59
X

LIST OF TABLES Table Page
1 Barricade Peak X-Direction Bulk-Motion Parameters ............. 43
2 Acceptor Stack Peak X-Direction Bulk-Motion Parameters .......... 50
.
.
xi

.
INTENTIONALLY LEFT BLANK
.
xii
1. INTRODUCTION
This report documents the continuation of a study of the detonation of a single munitions stack within a postulated munitions temporary storage area and the subsequent effects on its surroundings. The terminology for the main features that are modeled in the storage area are the same as before.l? 2 The detonating munitions stack is referred to as the “donor” stack; the remaining munitions stacks that are in the storage area and subject to blast loading from the donor stack are the “acceptor” stacks; a postulated, field-expedient, protective wall between any two munitions stacks is the “barricade;” and the distance from the base of a munitions stack to the base of a barricade is the “standoff” distance. As stated before, the primary purpose of protective barricades is to prevent a direct, line-of-sight path from existing for either blast or fragments between munitions stacks in proximity to one another. Additionally, the impact of any part of a barricade on an acceptor stack must not be capable of initiating an exothermic reaction in the acceptor stack. This computational study is one part of a larger study by the U.S. Army Research Laboratory (ARL) on behalf of its customer, the U.S. Army Defense Ammunition Logistics (Ammolog) Activity. This part involves a computational analysis of the dynamics of a detonating munitions stack and the effectiveness of field-expedient barricades in preventing a subsequent chain reaction among acceptor stacks.
The logic for considering the development of field-expedient barricades was given as follows.2
Military units operating in rapidly changing situations typically cannot store mu- nitions using standard safe-distance guidelines normally applicable for permanent storage in a safe area. Munitions must be readily accessible either for use or re- location with minimal delay. At times such as these, it is sometimes considered necessary by commanders in the field to store munitions in closely spaced stacks in the open with no protective barricades between them. An incidence of extremely close spacing of munitions stacks with no barricading that occurred in the buildup of ammunition stocks at the port of Al Jubayl, Saudia Arabia, before the opening of hostilities in the Gulf War was cited in an earlier report1 [same reference num- ber in both reports]. Fortunately, no initiating incident occurred. The same earlier report included, as examples of what can occur, photographs showing some of the destruction at Doha, Kuwait, in 1991 after a fire started a chain reaction among unprotected, closely spaced munitions stacks.
The first study of the effects of standoff variation on the loading and response of the acceptor stack was done for a massive water barricade having a trapezoidal cross section.2 It showed that the sloping sides of the trapezoidal water barricade were effective in deflecting blast and explosive products upward and away from the acceptor stack. The normalized blast loading on the trapezoidal barricade and its whole-body response were relatively weak functions of the inverse of the normalized standoff distance. An analysis of the blast and
1
impact loading on the acceptor stack showed that it was a three-stage process, with the first stage from the air blast, and the next two stages from a water wave at the top of the barricade and then the impact of the lower section of the barricade. The blast loading on the acceptor stack was negligible, and the normalized impact loading of the water barricade on the acceptor stack had a nearly one-to-one correspondence with the inverse of the normalized standoff distance. The five standoff distances in this first fully coupled computational2 study were 3.048 m (10.0 ft), 2.75 m (9.02 ft), 2.50 m (8.20 ft), 2.25 m (7.38 ft), and 2.00 m (6.56 ft).
This report describes a series of fully coupled computations for three different stand- off distances: Computation 980825 for a 3.048-m (lO.O-ft) standoff (hereinafter rounded to 3.05 m for simplicity except when specifically used to calculate a parameter), Computation 980826 for a 2.50-m (8.20-ft) standoff, and Computation 980827 for a 2.00-m (6.56;ft) stand- off. The donor stack and acceptor stack are modeled in a way that is identical to that used in the previous studies. 1, 2 The barricade is modeled as a simple rectangle having the same height as both the donor and acceptor stacks and, therefore, the same height as the trape- zoidal barricade in the previous studies. All computations are fully coupled in the sense that the detonation of the munitions stack; the blast loading on and response of the barricade; and loading from all sources on and the response of acceptor stack are modeled in a single, continuous computation.
,
2. COMPUTATIONAL APPROACH AND GEOMETRY
2.1. The Hydrocode Model
The three coupled computations that are reported here were performed using the then- latest general-release version, CTH_9801, of the CTH3 hydrocode developed at Sandia Na- tional Laboratories (SNL). It also includes the May 1998 and August 1998 “patches” (i.e., coding updates) that were released by SNL. CTH solves the inviscid Euler equations using a second-order accurate, explicit time-stepping method. A brief description of the CTH hydrocode was given in the previous report. 2 The reader is referred to McGlaun et al.3 for a full discussion of the CTH hydrocode, and to the appropriate users’ manuals for practical information about the structure and use of the CTHGEN4 grid generation code, the CTH5 hydrocode, and their supporting utilities.
The three computations presented here were performed using the two-dimensional (2-D) Cartesian coordinates system option in CTH, just as was done for the previous computations. The choice of 2-D Cartesian coordinates meant that the computations provided a worst-case blast loading for the simplified, uncased charge of condensed high explosives by eliminating the possibility of having any compression or expansion waves in the direction of depth of the munitions stacks and barricade. (Depth is a measure parallel to both the ground and the side walls of the munitions stack, and normal to the page in the flow field plots shown later.) In effect, the donor and acceptor stacks and the barricade have an infinite depth

in that coordinate system. In the CTH hydrocode model, which uses the centimeter-gram- second (cgs) units system, this implies a unit depth of 1.0 cm. The same gridding was used. The nominal computational cell dimensions are 4.0 cm in both Ax (width) and Ay (height). These computations were performed on the Silicon Graphics, Inc., (SGI) Origin 2000 unclassified computers at the ARL Major Shared Resource Center (MSRC) at Aberdeen Proving Ground (APG), MD. Th is is one of four MSRCs in the United States that are administered by the High Performance Computing Modernization Office (HPCMO). Each of these 2-D Cartesian computations took about 250,000 central-processor-unit (CPU) seconds.
2.2. The Donor Munitions Stack
The donor stack is modeled the same as in the previous reports,ll 2 as an uncased charge with no packing materials. This reduced the analysis to one of blast loading only, with no production of fragments or other debris. The explosive mass of the donor stack is modeled as a single, condensed charge rather than as a distributed set of smaller condensed charges. The choice of the munitions in the donor munitions stack was made by consulting a previous ARL report on fragment propagation probabilities by Starkenberg et al.” The donor munitions stack was assumed to be of the same size as one consisting of 72 pallets of Ml07 155- mm projectiles, stacked three pallets high by four wide by six deep. Each pallet contains eight rounds. The dimensions of this particular stack are 2.44 m high by 2.94 m wide by 2.19 m deep (8.00 ft by 9.63 ft by 7.20 ft). A single Ml07 round can contain either 6.62 kg (14.6 lbm, where “lbm” denotes pounds mass, avoirdupois) of TNT or 6.98 kg (15.4 lbm) of Composition-B (hereinafter referred to as “Comp-B”). The total mass of a pallet, including packaging, is 362 kg, (797 lbm). 7 Thus, a presumed stack of Ml07 munitions would contain 576 rounds, having a total mass of Comp-B equal to 4,024 kg (8,870 lbm). For simplicity, the nominal explosive mass of Comp-B for this computational study was taken as 4,000 kg (8,818 lbm) for the donor stack, the regulatory maximum.8 The total mass of an actual stack containing 72 pallets of Ml07 rounds is 26,029 kg (57,384 lbm), including all packaging materials. This equates to a mass of 118.61 kg/cm of depth for the actual stack with all materials considered. The acceptor stack was assumed to be of the same physical dimensions and total mass as those of the donor stack.
The explosive modeled was Comp-B, taken at its reference density of 1.72 g/cm3 in its undetonated state, and modeled9 within the SesamelO equation-of-state (EOS) package. The SNL Sesame EOS package includes tabular data for high explosives and separate imple- mentations of data for the Mie-Gruneisen, Jones-Wilkins-Lee (JWL), and ideal-gas equations of state. The explosive charge was placed within the computational flow field with its center coincident with that of the Ml07 donor stack described before. After assigning the donor stack the nominal explosive mass of 4,000 kg and using the actual stack depth of 2.19 m, this equated to an explosive charge mass of approximately 18.227 kg/cm of depth of the stack to be modeled in the unit-depth 2-D Cartesian coordinates flow field in CTH. This mass of Comp-B was modeled as a rectangle whose width and height were in direct proportion to
3
. .
those for the donor stack. Specifically, the explosive charge was 93.91 cm high and 113.04 cm wide (i.e., the full width, and not one-half width for symmetry), located with its center of mass 121.92 cm above the ground plane. The ground plane was designated as a frictionless, perfectly reflective boundary.
A small central section of the explosive charge at the left symmetry boundary served as a computational “booster” charge. It was detonated using the programmed burn4 model using a constant detonation velocity 7.98 km/s for reference-density Comp-B.ll This model simulates the complete detonation of any part of an explosive charge that is passed by the expanding theoretical detonation front moving at that constant velocity. The remainder of the detonation was modeled using the “history variable reaction burn” (HVRB) model.lO The HVRB model evaluates the thermodynamic state of a mass of undetonated explosive in a given computational flow field cell to determine if that material should be detonated in that time step. The detonation initiation point was located at the center of the explosive charge at the (X,Y) point (0.0, 121.92 cm).
2.3. The Barricade
The barricade shape chosen for the computations is a simple rectangle with a nominal height of 2.44 m (8.0 ft), the same height as that for the munitions stacks and for the trape- zoidal barricade studied previously. 2 The width chosen for this thin rectangular barricade is equal to the average width (measured front face to back face in the 2-D terminology used in this report) of a sand-filled Concertainer barricade, marketed by Hesco Bastion Limited12 that was tested against a detonated pallet of Ml07 rounds for ARL13 by the Aberdeen Test Center (ATC). Th e actual measurements of the sand-filled Concertainer barricade were taken at several points,14 giving an average width of 1.173 m (46.2 in) (hereinafter rounded to 1.17 m for brevity). Other than using this nominal value for the width of the rectangular water barricade, the rectangular water barricade simulated in the computations reported here has no relation, direct or indirect, to Concertainer or any other product by Hesco Bas- tion. Any data related to or evaluation of the rectangular water barricade simulated here also should not be construed as having any relation to any commercial product by Hesco Bastion. An idealized cross section that has no internal air spaces and consists only of water is assumed. No construction or supporting materials are considered. The mass of water for the barricade is 28.61 kg/ cm of depth. The water in the barricade was modeled using the CTH Sesame EOS for water. l5 The face of the barricade closest to the donor stack was placed at the defined standoff distance, which varied from 3.05 m (10 ft) to 2.00 m (6.56 ft), from the nearest side of the donor stack. The standoff distance here is measured from the face of what would have been the actual side of the donor munitions stack, not the condensed explosive charge representing the stack.
.
.
c
2.4. The Acceptor Munitions Stack
The acceptor munitions stack was modeled in all computations as a simple, relatively inert mass of iron16 with the same height (2.44 m) and width (2.94 m) as the reference Ml07 munitions stack. This is identical to the way the acceptor stack was modeled in all previous11 2 computations. The acceptor stack in each computation was located at a standoff distance equal to that between the donor stack and the barricade. The purpose in modeling the acceptor stack as a full-sized mass of iron was for the convenience of having a massive, relatively non-responding object with the correct physical dimensions in order to observe wave interactions on the surface and to provide surface blast loading data through the use of CTH’s “tracer” particles placed in the air near the surfaces. Tracer particles are massless points that are specified at desired locations by the user at grid generation time. They may be fixed in computational space or be free to move along one or more of the principal axes in the grid. A relatively full complement of data describing the thermodynamic state and other physical parameters at the location of each tracer is recorded for later processing by the user. When analyzing the whole-body response of the acceptor stack later in this report, the correct acceptor stack mass (118.61 kg/ cm of depth) was used to compute the motion of the acceptor stack from the X-direction momentum of the massive iron stack. Some of the details of the blast development in this computational series and subsequent interactions between the blast and the barricade and then the barricade and the acceptor stack are surely artifices of the simplified geometries, but the overall dynamics appear to be quite reasonable.
3. THE HYDROCODE COMPUTATIONS
3.1. Flow Field Development
Computation 980825 simulated a fully coupled blast and impact loading sequence at a standoff of 3.05 m (10.0 ft). E ven though the standoff is the same as that in Computation 980505,* there are two very significant differences in the barricades beyond the obvious difference in the cross sections and slopes of the left and right faces. The trapezoidal water barricade mass is 58.71 kg/cm of depth with an X-direction distance of its center of mass equal to 4.96 m from the right face of the donor stack. The rectangular water barricade has a mass of 28.61 kg/ cm of depth with an X-direction distance of its center of mass equal to 3.63 m from the right face of the donor stack. Thus, the rectangular water barricade has approximately 0.49 times the mass of the trapezoidal barricade, and has the distance of its center of mass from the donor stack right face at 0.73 times that for the trapezoidal barricade. Figure 1 shows the computational flow field at the start of Computation 980825 at the instant, of the initiation of the detonation (hereinafter referred to as “initiation”) with time defined to be equal to zero. The “Y” axis at the left of the figure represents the height measured from the ground plane. In this simple 2-D Cartesian coordinate system, the left boundary at the Y axis is designated as a frictionless, perfectly reflective plane of

F
symmetry. The “X” axis represents the measure of width in the system and coincides with the frictionless, perfectly reflective ground plane. The Y axis at the X = 0.0 location is also a vertical bisector of the donor stack. The air in the flow field, modeled with data from Graboske17 within the Sesame lo EOS package, is shown with the color yellow. The top and right transmissive boundaries are marked by the top and right edges of that yellow region. These transmissive boundaries were designated as zero-gradient, outflow-only boundaries to minimize the possibilities of generating spurious, mathematically generated reflected waves or inflows when those boundaries are struck by large-gradient outflows. The explosive charge representing the donor stack is shown as the red (one-half) rectangle on the left symmetry boundary, the water barricade is shown as the blue rectangle, and the acceptor stack is shown as the black rectangle (the object closest to the right transmissive boundary). These settings and general descriptions, except for the shape of the barricade, are the same as for the previous series 2 of computations. In order to facilitate direct comparison of the flow fields for the 3.05-m standoff for the rectangular versus the trapezoidal barricade, flow fields from Computation 9805052 are also presented. Figure 2 shows the flow field at the instant of initiation for Computation 980505 for the trapezoidal barricade. A comparison between Figures 1 and 2 clearly shows the greater actual spacing and mass of the trapezoidal barricade.
Figure 3 shows the computational flow field for 980825 at 5.0 ms after the initiation of the donor stack. The detonation process had already been completed by this time (theoretically at 0.092 ms). The expanding explosive products and leading shock have deformed and accelerated the barricade. A section of the expanding explosive products has already passed over the acceptor stack. The lower section of the barricade is translating laterally toward the acceptor stack as a relatively unified block. Much of the top section of the water barricade has deformed into an S-shaped curve, with all but the top-most part of it trailing behind the lower section. As yet, no part of the barricade appears to have arrived at the left face of the acceptor stack, and no explosive products appear to have reached the acceptor stack. For comparison, Figure 4 shows the computational flow field for 980505 at 5.0 ms after the initiation of the donor stack. The more massive trapezoidal water barricade in that computation is also showing the leading action of the lower section of the barricade, but with a different set of dynamics. The leading section is a manifestation of a growing wave that travels up the right face of the barricade, as described previously.2 It is also considerably farther from the accepter stack left face at this time than the lower, leading section of the rectangular barricade shown in Figure 3.
Figure 5 shows the computational flow field at 7.5 ms after the initiation of the donor stack. The barricade is already in the process of impacting the left face of the acceptor stack along its entire height. Figure 6, on the other hand, shows the flow field for the trapezoidal barricade computation at the same time. The bottom-to-top wave on the right face of the barricade is still in the early stage of its development, with its rightward leading edge still more than 2 m away from the acceptor stack left face.
6

kg/cm depth: CompB=18.2 H20=28.6; Standoff=3.05 m 20 1 I I I I I I I I I
C-Bboostar
18 -
16 -
14 -
12 -
x lo- >-
a -
6 -
4 -
-11191 C-B stack
q barricade
n acceptor
q air
0 VOID
0 4 a 12 16 20
2DR Block 1 x (4 980825 RECT ~20 BARR, 3.05 M STANDOFF HYKEZW G 08/25/98 10:56:16 CTHGEN 0 Time=O.
Figure 1. Flow Field at Time = 0.0 for Computation 980825, 3.05-m Standoff, Thin Rect- a.ngu1a.r Barricade.
7

20 kg/cm depth: CompB=18.2 H20=58.7; Standoff=3.05 m
I I I I I I I I I m C-Bbooster
18 q C-B stack
cl barricade
16 n acceptor
14 q air _
cl VOID
12
10
8
6
4
L----m- 0 4 8 12 16 20
2DR Block 1 x cm> 980505 TRAP H20 BARR, 3.05 M STANDOFF FPQDPI G 06/16/98 16:40:26 CTHGEN 0 Time=O.
Figure 2. Flow Field ak Time = 0.0 for Computation 980505, 3.05-m Standoff? Massive Tra.pezoida.1 Barricade.
.
* I
8
20
18
16
14
6
4
2
0
2DR
kg/cm depth: CompB=18.2 H20=28.6; Standoff=3.05 m I I I I I I I I I
I I
H C-Bbooster
n C-B stack
cl barricade
n acceptor
0 air
cl VOID
0 4 8 12 16 20
Block 1 x b-d
980825 RECT H20 BARR, 3.05 M STANDOFF HYLBQN 08/26/98 07:09:43 CTH 3415 Time=5.00133x10⁻³
Figure 3. Fl ow Field at Time = 5.0 ms for Computation 980825; 3.05-m Standoff, Thin Rectangu1a.r Barricade.
9

20
18
16
14
12
x 10 >
8
2DR
ka/cm depth: CompB=18.2 H20=58.7; Standoff=3.05 m
* H C-Bbooster
q C-B stack
Cl barricade
m acceptor
0 air
cl VOID
0
Block 1
8 12
x cm>
16 20
980505 TRAP H20 BARR, 3.05 M STANDOFF FPQDYE 06/17/98 12:17:14 CTH 3213 Time=5.00258x10s3
Figure 4. ,Flow Field at Time = 5.0 ms for Computation 980505, 3.05-m Standoff, Massive Trapezoidal Barric.ade.
10

20
18
16
14
12
3 10 >
8
2DR
Ltn /cm death: CompB=18.2 H20~28.6: Standoff=3.05 m
n C-Bbooster
n C-B stack
cl barricade
n acceptor
q air
cl VOID
0 4 8 12
Block 1 x (m)
16 20
980825 RECT H20 BARR, 3.05 M STANDOFF HYLBQN 08/26/98 13:33:11 CTH 4599 Time=7,50086x10⁻³
.
. Figure 5. Fl ow Field at Time = 7.5 ms for Computation 980825, 3.05-m Standoff, Thin Rect,angular Barricade.
11
20
18
16
14
12
z 10 >
8
0
2DR
kg/cm depth: CompB=18.2 H20=58.7; Standoff=3.05 m
0 4 8 12
Block 1 x cm>
16 20
q C-Bbooster
n c-a stack
q barricade
1 acceptor
0 air
cl VOID
980505 TRAP H20 BARR, 3.05 M STANDOFF FPQDYE 06/17/98 20:14:41 CTH 4268 Time=7.50168x10⁻³
Figure 6. Flow Field at Time = 7.5 ms for Computation 980505, 3.05-m Standoff, Ma.ssive Trapezoidal Barricade.
12

Figure 7 shows the computational flow field at 10.0 ms after initiation. The portion of the barricade that impacted the left face of the acceptor stack has rebounded from it and is moving in the negative X direction. The remainder of the barricade has been dispersed upward and away from the acceptor stack. Some explosive products are relatively close to the top-rear corner of the acceptor stack, and some are approaching the bottom-left corner. Figure 8 for 980505 shows continued development of the wave on the right surface of the barricade, with its rightward-leading tip still more than 1 m away from the acceptor stack.
Figure 9 shows that, by 12.5 ms after initiation, the thin rectangular barricade no longer has any useful structural integrity and no readily recognized shape. A small amount of explosive products appears to be making contact with the lower-left corner of the acceptor stack, and a large region of explosive products seems to be moving very close to the top-left corner of the stack. In contrast, Figure 10 shows that for the trapezoidal barricade, the leading wave of water is still about 0.7 m away from impacting the acceptor stack and the barricade is still maintaining a distorted but relatively integral shape. No explosive products are in the immediate vicinity of the acceptor stack.
Figure 11 shows the computational flow field for the rectangular barricade at 15.0 ms after initiation. The barricade has been reduced to simply being widely distributed water, with some of it already swept out of the computational grid. Explosive products are close to portions of the left and top faces of the acceptor stack. Figure 12, which shows the flow field for the trapezoidal barricade in Computation 980505, shows a distorted but still-intact barricade with the tip of the wave on its right-rear face almost at the point of its first contact with the left face of the acceptor stack. Most of the air blast and virtually all of the explosive products have been deflected upward and away from the acceptor stack by the trapezoidal barricade.
Figure 13 shows the computational flow field at 20.0 ms after initiation. Much of the top face of the barricade has contact or near-contact with explosive products, as does its lower- left corner. Some explosive products are nearing the back face. Figure 14 for 980505 shows the first interaction of water from the wave on the right face of the trapezoidal barricade with the top section of the acceptor stack. The barricade is still largely intact, and no explosive products are near the surfaces of the acceptor stack.
Progressing further in time, Figure 15 shows the computational flow field for the thin rectangular barricade at 30.0 ms after initiation. The removal of the remaining water from the barricade from the computational flow field is nearly complete. Much of the left face of the acceptor stack, most of the top face, and small parts of the right face appear to be in contact with explosive products. Figure 16 shows the flow field for 980505. The interac.tion of the ba.rricade with the left surface of the acceptor stack is continuing, with the peak overpressure loadings on the acceptor stack yet to occur. The air gap at the bottom of the left face of the acceptor stack is still being compressed by the oncoming water from the barricade. The now-distributed but still-intact barricade is serving as a protective barrier by continuing to keep explosive products away from the acceptor stack faces.
13
20
18
16
14
6
4
2
2DR
kq/cm depth: CompB=18.2 H20=28,6; Standoff=3.05 m n C-Bbooster
m C-B stack
cl barricade
n acceptor
q air
cl VOID
0
Block 1
8 12
x cm>
16 20
980825 RECT H20 BARR, 3.05 M STANDOFF HZQCNJ 08126198 20:36:48 CTH 5746 Time=1.00003x10⁻²
Figure 7. Fl ow Field at Time = 10.0 ms for Computation 980825, 3.05-m Standoff, Thin
Recta,ngular Barricade.
14

kn /cm death: CompB=18.2 H20=58.7; Standoff=3.05 m
18
16
14
II C-Bbooster
n C-B stack
cl barricade
n acceptor
0 air
cl VOID
12
z 10 >
8
6
4
0 4 8 12 16 20
2DR Block 1 x cm> 980505 TRAP H20 BARR, 3.05 M STANDOFF FPQDYE 06/18/98 07:33:39 CTH 5369 Time=1.0002x10⁻²
Figure 8. Flow Field a.t Time = 10.0 ms for Computation 980505, 3.05-m Standoff, Massive ‘Trapezoidal Barricade.
15

18
16
14
2DR
ka /cm death: ComDB=18.2 H20=28.6; Standoff=3.05 m
0 4 8
Block 1 x cm>
12 16 20
980825 RECT H20 BARR, 3.05 M STANDOFF HZQCNJ 08/27/98 04:09:08 CTH 7012 Time=1.2501x10⁻²
q C-Bbooster
n C-B stack
Cl barricade
n acceptor
q air
cl VOID
Figure 9. Flow Field at Time = 12.5 ms for Computation 980825, 3.05-m Standoff, Thin R.ectangular Barricade.
16

E >-
20
18
16
10
8
6
4
2DR
kq/cm depth: CompB=18.2 H20=58.7; Standoff=3.05 m VI
I I I I I I I I I
0 4 8 12 16
Block 1 x cm> 980505 TRAP H20 BARR, 3.05 M STANDOFF FPQDYE 06/18/98 15:17:32 CTH 6410 Time=1.25021x10⁻²
.
Figure 10. Flow Field at Tra.pez0ida.l Barric.ade.
3
n C-Bbooster
n C-R stack
cl barricade
n acceptor
0 air
q VOID
20
Time = 12.5 ms for Computation 980505, 3.05-m Standoff, Massive
17
E _
>-
18
16
10
8
6
4
2
0
2DR
kg/cm depth: CompB=18.2 H20=28.6; Standoff=3.05 m
0 4 8 12
Block 1 x cm>
16 20
980825 RECT HZ0 BARR, 3.05 M STANDOFF HZQCNJ 08/27/98 09:53:08 CTH 7991 Time=1.5002x10⁻²
q C-Bbooster
w C-B stack
II barricade
n acceptor
c] air
cl VOID
.
Figure 11. Flow Field at Time = 15.0 ms for Computation 980825, 3.05-m Standoff, Thin Rectangular Barricade.
18
18
16
0
2DR
kg/cm depth: CompB=18.2 H20=58.7; Standoff=3,05 m I I I I I I I I I
0 4 8 12
Block 1 x cm>
16 20
980505 TRAP H20 BARR, 3.05 M STANDOFF FPQDYE 06/18/98 21:18:19 CTH 7345 Time=1.50014x10⁻²
Figure 12. Flow Field at Trapezoidal Barricade.
q C-Bbooster
n C-B stack
cl barricade
n acceptor
q air
cl VOID
Time = 15.0 ms for Computation 980505, 3.05-m Standoff, Massive
19
20
18
16
14
6
4
2
0
ka/cm death: CompB=18.2 H20=28.6; Standoff=3.05 m WI
I I I I I I I I I
q C-Bbooster
q C-B stack
cl barricade
n acceptor
c] air
0 VOID
0 4 8 12 16 20
2DR Block 1 x cm> 980825 RECT HZ0 BARR, 3.05 M STANDOFF HOPAIV 08/27/98 21:46:58 CTH 9610 Time=2.00032x10⁻²
. I
Figure 13. Flow Field at Time = 20.0 ms for Computation 980825, 3.05-m Standoff, Thin R.ectangu1a.r Barricade.
20
ka/cm death: Compl3=18.2 H20=58.7; Standoffz3.05 m 20
18
16
14
12
z 10 +
8
0
2DR
0 4 8 12
Block 1 x cm>
16 20
980505 TRAP H20 BARR, 3.05 M STANDOFF FPQDYE 06/19/98 08:51:17 CTH 9103 Time=2.00003x10⁻²
q C-Bboostar
n C-B stack
q barricade
n acceptor
q air
cl VOID
I l
Figure 14. Flow Field at Time = 20.0 ms for Computation 980505, 3.05-m Standoff, Massive Trapezoidal Barricade.
21

18
16
10
8
6
4
2
0
2DR
ka/cm depth: CompB=18.2 H20=28.6; Standoff=3.05 m
0 4 8 12
Block 1 x cm>
16 20
q C-Bbooster
g C-B stack
0 barricade
n acceptor
q air
q VOID
980825 RECT H20 BARR, 3.05 M STANDOFF HOPAIV 08/28/98 16:27:51 CTH 12347 Time=3.00014x10⁻²
Figure 15. Flow Field at Rectangular Barric.ade.
Time = 30.0 ms for Computation 980825, 3.05-m Standoff, Thin
22
20
18
16
14
12
x 10 >
8
6
4
2
0
2DR
kn/cm depth: ComPB=18.2 H20~58.7; Standoff=3.05 m “3f -‘.. --I- I
I 1 I I I I I I I
n C-Bbooster
H C-B stack
cl barricade
H acceptor
0 air
q VOID
0 4 8 12
Block 1 x cm>
16 20
980505 TRAP H20 BARR, 3.05 M STANDOFF FPQDYE 06/20/98 02:16:36 CTH 11722 Time=3.00023x10⁻²
Figure 16. Flow Field at Time = 30.0 ms for Computakion 980505, 3.05-m Standoff, Massive Trapezoidal Barricade.
23

Finally, Figure 17 shows the computational flow field for the rectangular water barricade at 40.0 ms after initiation. The acceptor stack is surrounded by, and in general contact with, explosive products. There is little water left in the computational flow field, and virtually none near the acceptor stack. Figure 18 for the trapezoidal barricade in Computation 980505 shows the water that has completed its strongest interaction with the left face of the acceptor stack (at around 32.5 ms) and is now in a rebound stage at 40.0 ms. The highly distorted barricade is still functioning as a barrier that is keeping explosive products away from the acceptor stack faces. Thus, it is readily apparent, at least from a qualitative point of view from comparing the flow fields, that the thin rectangular water barricade was considerably less capable in protecting the acceptor stack than was the more massive trapezoidal bar- ricade. Before quantifying this statement, similar sequences of the flow fields for the thin rectangular water barricade for a 2.50-m and a 2.00-m standoff are shown. They both show similar behavior to that for 980825, so fewer snapshots in time are presented. No direct com- parisons to corresponding flow fields for the trapezoidal barricade for Computations 980521 and 980610, respectively,2 are shown.
Computation 980826 simulated a standoff distance of 2.50 m for the same thin rectangu- lar water barricade. Figure 19 shows the computational flow field at time = 0.0. Except for the standoff distance, the computational flow field, the munitions stacks, and the barricade are identical to those for 980825 (see Figure 1).
Figure 20 shows the computational flow field at time = 5.0 ms for Computation 980521. This shows similar behavior to that shown in Figure 3 for 980825, except that the barricade is closer in space and time to its initial contact with the acceptor stack left face. Figure 21 shows the flow .field at 10.0 ms after initiation. The barric.ade has already completed its most significant impact on the acceptor stack left face and is now rebounding from it. The barricade no longer has a recognizable rectangular shape. It is highly distorted, with what had been the upper section being dispersed into the flow field above the acceptor stack. Explosive products are approaching the top surface of the acceptor stack. Figures 22, 23, 24, and 25 show the flow field at 15.0 ms, 20.0 ms, 30.0 ms, and 40.0 ms, respectively, with the continued dispersal of the water from the barricade and increasing impingement of explosive products on various faces of the acceptor stack.
The last computation in this series, Computation 980827, simulated a standoff distance of 2.00 m. Figure 26 shows the computational flow field at time = 0.0. Except for the standoff distance, the computational flow field, the munitions stacks, and the barricade are identical to those for the Computations 980825 and 980826. A comparison with Figure 1 shows how much closer the layout of the stacks and barricade is in 980827. The bottom-left corner of the barricade is 1.048 m closer to the donor stack tha,n in 980825, and the bottom- right corner of the barricade is simiIarIy 1.048 m closer to the acceptor stack. Therefore, the acceptor stack in 980827 is 2.096 m closer to the donor stack than in 980825. The finite-difference grid and overall dimensions of the computational flow field, left boundary to right boundary and bottom boundary to top boundary, are identical in Computations 980825, 980826, and 980827. Figures 27, 28, 29, 30, 31, and 32 show the computational flow
24
.
20
18
16
14
12
z 10 2-
8
2DR
ka/cm detsth: CompB=18,2 H20=28.6; Standoff=3.05 m d,
I I I I I I I I I I
0
Block 1
8 12
x cm>
16 20
m C-Bbooster
1 C-B stack
cl barricade
n acceptor
q air
cl VOID
980825 RECT HZ0 BARR, 3.05 M STANDOFF HOPAIV 08/29/98 10:33:16 CTH 15139 Time=4.00024x10⁻²
Figure 17. Flow Field at Time = 40.0 ms for Computation 980825, 3.05-m Standoff, Thin R.ectangular Barricade.
25

20
18
16
14
12
x 10 >
8
6
4
2
0
2DR
ka/cm death: ComDB=18.2 H20=58.7; Standoff=3.05 m s C-Bbooster
q C-B stock
Cl barricade
m acceptor
0 air
cl VOID
0
Block 1
8 12
x (m)
16 20
980505 TRAP HZ0 BARR, 3.05 M STANDOFF GWQBBC 07/24/98 05:24:34 CTH 14381 Time=4.00007x10⁻²
Figure 18. Flow Field at Time = 40.0 ms for Computation 980505, 3.05-m Standoff, Massive Trapezoidal Barricade.
26
18
16
20 kg/cm depth: CompB=l8.2 H20=28.6; Standoff=2.50 m
I I I I I I I I I
6
n C-Bbooster
_ m C-B stack
q barricade
n acceptor
0 air
cl VOID
0 4 8 12 16 20
2DR Block 1 x (ml 980826 RECT H20 BARR, 2.50 M STANDOFF HZKAEF G 08/26/98 10:01:49 CTHGEN 0 Time=O.
Figure 19. Flow Field a.t Time = 0.0 for Computakion 980826, 2.50-m Standoff, Thin R.ect- angular Barricade.
27

20
18
16
10
8
6
4
2
0
2DR
kg/cm depth: CompB=18.2 H20=28.6; Standoff=2.50 m I I I I I I I I I
J I -I
0 4 8 12 16 20
Block 1 x 0-d
q C-Bbooster
g C-B stack
cl barricade
n acceptor
0 air
cl VOID
.
980826 RECT H20 BARR, 2.50 M STANDOFF HZKBHA 08/27/98 06:05:24 CTH 3469 Time=5.00177x10⁻³
” I
Figure 20. Flow Field at Time = 5.0 ms for Computation 980826, 2.50-m Standoff, Thin Rectangular Barricade.
28

kn/cm depth: ComDB=18.2 H20=28.6; Standoff=2.50 m 20
18
16
14
12
s 10 >
8
6
4
2
0
“3/ -“. --I-
I I I I I I I I I
I
q C-Bbooster
n C-B stack
cl barricade
w acceptor
0 air
cl VOID
0 4 8 12 16 20
2DR Block 1 x cm> 980826 RECT H20 BARR, 2.50 M STANDOFF HOPFGU 08127198 22:05:49 CTH 6065 Time=1.00011x10⁻²
Figure 21. Flow Field at Time = 10.0 ms for Computation 980826, 2.50-m Standoff, Thin R.ectangular Barrica.de.
29
20
18
16
14
0
ka/cm death: ComDB=18.2 H20~28.6; Standoff=2.50 m
88 C-Bbooster
q C-B stack
cl barricade
n acceptor
/J air
cl VOID
0 4 8 12 16 20
2DR Block 1 x cm> 980826 RECT H20 BARR, 2.50 M STANDOFF HOPFGU 08/28/98 10:57:46 CTH 8210 Time=1.50008x10⁻²
Figure 22. Flow Field at, Time = 15.0 ms for Computation 980826; 2.50-m Standoff, Thin Rectangular Barricade.
30
.
20
18
16
14
12
x 10 >-
8
6
4
2
0
kg/cm depth: CompB=18.2 H20=28.6; Standoff=ZSO m I I I I I I I I I q C-Bbooster
_ n C-B stack
cl barricade
n acceptor -
I
L-l cl
-L
0 4 8 12 16 20
2DR Block 1 x cm> 980826 RECT HZ0 BARR, 2.50 M STANDOFF HOPFGU 08/28/98 20:29:29 CTH 9845 Time=2.00001x10⁻²
air
VOID
Figure 23. Flow Field at Time = 20.0 ms for Computation 980826, 2.50-m Standoff, Thin R.ectangu1a.r Bxricade.
31
20
18
16
14
12
3 10 >
8
6
4
2
0
2DR
kg/cm depth: CompB=18.2 H20=28.6; Standoff=Z.SO m
1 _
0
Block 1
8 12
x cm>
16 20
980826 RECT HZ0 BARR, 2.50 M STANDOFF HOPFGU 08/29/98 15:09:15 CTH 12934 Time=3.00027x10⁻²
•BI C-Bbooster
q C-B stack
q barricade
H acceptor
q air
0 VOID
Figure 24. Flow Field at Time = 30.0 ms for Computation 980826, 2.50-m Standoff, Thin R.ectangular Barricade.
32
20
18
16
14
12
x 10 >-
8
6
4
2
0
2DR
ka/cm depth: CompB=18.2 H20~28.6; Standoff=ZSO m .#J
I I I I I I I I I
0 4 8 12
Block 1 x cm>
16 20
980826 RECT HZ0 BARR, 2.50 M STANDOFF HOPFGU 08/30/98 07:lO:Zl CTH 15534 Time=4.00018x10⁻²
.
q C-Bbooster
4 C-B stack
cl barricade
n acceptor
q air
cl VOID
. Figure 25. Flow Field at Time = 40.0 ms for Computation 980826, 2.50-m Sta.ndoff, Thin R.ectanguIar Barricade.
33
field at time = 5.0 ms, 10.0 ms, 15.0 ms, 20.0 ms, 30.0 ms, and 40.0 ms, respectively, for Computation 980827. Collectively, the figures show the same qualitative behavior as those for Computations 980825 and 980826, with events happening at a faster rate with respect to time.
3.2. Barricade Dynamics
Figure 33 shows the bulk momentum per centimeter depth of the water barricade in the X direction. Positive momentum is in the direction of increasing values of X. Figure 33 includes the X-direction momentum for each of the three fully coupled computations in this series for the thin rectangular barricade, plus that for Computation 9805052 for the massive trapezoidal barricade at a 3.05-m standoff. Hereinafter, any use of the term “momentum” or the other variables (e.g., velocity, acceleration, and displacement) derived from it should be construed as referring to the bulk value in the X direction per centimeter depth, unless specifically stated otherwise. The term “bulk” is implied but used only sparingly in order to avoid repetition. The momentum shown here is the combined momentum for all of the water in the flow field at each computational time step. Values for the mass and momentum for the water (and all other materials) are saved after each time step. During any given time step later in the computations, some water flows out of the flow field through either or both of the top and right transmissive boundaries. Each of the three curves for the thin rectangular barricade shows a very rapid, monotonic initial increase in momentum with decreasing standoff. The curve for Computation 980827 (2.00-m standoff) shows the first, very abrupt decrease in momentum after its ,peak at 4.5 rns, -followed by 980826 (2.50-m standoff) after its peak at 5.4 ms, and then 980825 (3.05-m standoff) after its peak at 6.6 ms. This very rapid drop in each curve for the thin rectangulax barricade is because of the nearly simultaneous bottom-to-top strike of the barricade on the left face of the acc.eptor stack. As may be seen in Figure 33, the thin recta.ngular barrica.de delivers most of its momentum to the acceptor stack over a very short period of time. The fourth curve shown in Figure 33, labeled “980505 Trap, Standoff 3.05 m,” is for the momentum of the massive trapezoidal water barricade at a 3.05-m standoff.2 It shows a. more gradual increase to a considerably lower peak momentum with a two-stage, much smaller total decrease in momentum. It is interesting to point out here that, while there is not much difference in both the pea.k momenta. and the values to which the momenta for the rectangular barricade decrease by 10 ms as a function of staadoff distance, there is a great difference in both peak momentum and change in momentum that can be seen when comparing the thin rectangular barricade with the massive trapezoidal barricade at the same 3.05-m standoff distance. Table 1 contains a. summary of several X-direction parameters that describe some of the bulk motion of the barricade for the va.rious computations. First among those parameters, after the computation numbers and standoff distances, are the peak X-direction bulk-momentum values for the barrica.de, along with their respective times of occurrence, listed with more significant figures than were typically used in the text for completeness. In order to facilitate comparisons,
34
I l
20
18
16
14
12
s 10
6
kg/cm depth: CompB=18.2 H20~28.6; Standoff=2.00 m I I I I I I I I I n C-Bbooster
n C-B stack
III barricade
n acceptor
0 air
cl VOID
12
2DR Block 1 X cm> 980827 RECT H20 BARR, 2.00 M STANDOFF HZMCVG G 08/26/98 12:31:44 CTHGEN 0 Time=O,
Figure 26. Flow Field at Time = 0.0 for Computation 980827, 2.00-m Standoff, Thin R.ect- angular Ba.rricade.
35
ka/crn death: ComDB=18.2 H20=28.6; Standoff=2.00 m
E >-
20
18
16
12
10
8
6
4
2
0
2DR
-3,
-
0 4 8 12
Block 1 X cm>
J I I
16 20 d
q C-Bbooster
6 C-B stack
q barricade
n acceptor
c] air
cl VOID
980827 RECT H20 BARR, 2.00 M STANDOFF HZMDXV 08127198 06:45:23 CTH 3271 Time=5.00226x10⁻³
. I
Figure 27. Flow Field at Time = 5.0 ms for Computation Rectangular Barricade.
980827, 2.00-m Standoff, Thin
36
.
20
18
kg/cm death: CompB=18.2 H20=28.6; Standoff=2.00 m _. I I I I I I I I I
16
14
12
x 10 t-
8
6
4
2
0 0 4 8 1
2DR Block 1 x cm> 980827 RECT H20 BARR, 2.00 M STANDOFF HOQCIS 08/27/98 23~48~12 CTH 6074
2 16 20
C-Bbooster
n C-B stack
cl barricade
n acceptor
0 air
cl VOID
Figure 28. Flow Field at Time = 10.0 ms for Computation 950827, 2.00-m Standoff, Thin Rectangular Barrica.de.
37
20
18
16
14
12
10
8
6
4
2
0
2DR
/cm depth: CompB=18.2 H20=28.6; Standoff=Z.OO m I 1 I I I I I I I
0 4 8 12 16 20
Block 1 x cm>
C-Bbooster
81 C-B stack
cl barricade
m acceptor
c] air
cl VOID
980827 RECT HZ0 BARR, 2.00 M STANDOFF HOCUS 08/27/98 23:48:12 CTH 6074 Time=1.00024x10-a
Figure 29. Flow Field at Time = 15.0 ms for Computation 980827, 2.00-m Standoff, Thin R.ectangular Baxricade.
38
16
2DR
kq/cm depth: CompB=18.2 H20~28.6; Standoff=2.00 m
0 4 8 12
Block 1 x cm>
16 20
980827 RECT H20 BARR, 2.00 M STANDOFF HOQCIS 08/29/98 01:14:57 CTH 10192 Time=2.00022x10'2
Figure 30. Flow Field ak Rectangular Baxricade.
n C-Bbooster
n C-B stack
cl barricade
m acceptor
f-J air
cl VOID
Time = 20.0 ms for Computation 980827, 2.00-m Standoff, Thin
39
20
18
16
12
x 10 t-
8
6
kg/cm depth: CompB=18.2 H20=28.6; Standoff=2.00 m I I I I I I I I I q C-Bbooster
q C-B stack
•J barricade
n acceptor
a air
cl VOID
0 4 8 12 16 20
2DR Block 1 x cm> 980827 RECT H20 BARR, 2.00 M STANDOFF HOQCIS 08/29/98 21:19:22 CTH 13424 Time=3.00028xlO-*
Figure 31. Flow Field at Time = 30.0 ms for Computation 980827, 2.00-m Standoff, Thin R.ectangu1a.r Ba.rricade.
40

.
20
18
16
14
12
3 10 >
8
6
4
2DR
ka/cm denth: CompB=18.2 H20=28.6; Standoff=2.00 m
0
Block 1
8 12
x (m)
16 20
C-Bbooster
C-B stack
q barricade
l acceptor
L 1 air
c1 VOID
980827 RECT H20 BARR, 2.00 M STANDOFF HOQCIS 08/30/98 15:35:08 CTH 16200 Time=4.00011x10-*
Figure 32. Flow Field at ‘Time = 40.0 Ins for Computat~ion 9SOS277 2.00-m Standoff, Thin K.cct angular Barricade.
41

the first column of numbers is for the massive trapezoidal barricade at a 3.05-m standoff, followed by data for the thin rectangular barricade. The rest of the parameters in the table are discussed in the following paragraphs.
I I I
- 980825 Rect, Standoff 3.05 m - 980826 Rect, Standoff 2.50 m - 980827 Rect, Standoff 2.00 m -- 980.505 Trap, Standoff 3.05 m
-5.0 - 0.0 10.0 20.0 30.0 40.0
Time (ms)
Figure 33. Waker Barricade X-DirectSion Momentum Toward Acceptor Stack, Computations 98OS25 Through 98082’7 (Recta,ngular), Plus 980505 (Trapezoidal).
Alter each computakiona.1 time step, botch the t0ta.l momentum and mass of the water in the ,flow field axe known. The X-direction bulk velocit,y (hereina.fter referred to a,s “X- direction velocit;y”) of the barricade ma;y be computed Ior ea.& titme step by cliv.icling the inst,a.nt,aneous i-uomei~tum by t,he corresponding ma.ss. The X-direction velocity of the wa.ter ba.rrica.de toward the acc.eptor sta,ck for ea,ch standoff for the thin rectangular ba.rrica,cle, plus the velocit,y for the trapezoidal barrica.cle a.t 3.05-m standoff, is shown in Figure 34. These curves are essent.ia.1l.y scaled variants of the momentum curves shown in Figure $3 and t,herefore show t,he same relative beha.vior described for the momenta.. The peak X-direction velocity for the thin rectangular barricade a,t each standoff distance is 476.6 m/s a.t 6.56 ms (3.05-m standoff); 486.9 m/s at 5.39 ms (2.50-m sta.ndoff), and 503.2 m/s a.t 4.50 ms (2.00-m st.a.ncloff). For comparison, the curve for the t*ra.pezoiclaJ basrica.cle, labelled “980505 Trap? Sta.ncloff 3.05 m” is included in Figure 34. It has a, peak velocity of 178.2 m/s a,t 10.9 ms, much lower t,han the 476.6 m/s peak for t’he thin rectangu1a.r ba.rrica.de at, the same defined standoff. The X-direction velocities become less meaningful ak late time a,s far a.s the a.ccept,or sta.cli is concernecl because of the increasing proportion of writer thak is in the a.ir above the pla.ne of the top fa.ce of the acceptor sta,ck.
42

Table 1. Barricade Peak X-Direction Bulk-Motion Parameters. -
Computation Number
Standoff (m) Peak Momentum
(Mg-m/s) Time (ms)
Peak Velocity
(m/s) Time (ms)
Peak Acceleration (km/s/s)
Time (ms) Peak Left-Surface
Impulse (MN-s/m)
Time (ms) Distance Traveled
(rn) Time (ms)
Trapezoidal Rectangular Rect anguIar Rectangular 980505 980825 980826 980827 3.048 3.048 2.50 2.00
10.46 10.07
178.2 10.93
143.4 10.04
0.9016 34.48
5.979 39.99
13.64 13.93 14.40 6.560 5.388 4.500
476.6 486.9 503.2 6.560 5.385 4.500
631.5 65S.0 679.7 0.8141 0.6947 0.5947
l.lS5 35.29
(Rebounded) 4.853 32.46
1.253 1.360 38.54 38.85
5.669 5.373 39.99 39.99
600.0 I I I I I - 980825 Rect, Standoff 3.05 m - 980826 Rect, Standoff 2.50 m - 980827 Rect, Standoff 2.00 m -- 980505 Trap, Standoff 3.05 m
1 20.0
Time (ms)
Figure 34. Water B arricade X-Direction Velocity Toward the Acceptor Sta.clq Compuhtions 9SOS2.5 Through 980527 (Rectangula,r), Plus 980505 (Trapezoidal).
43
The momentum curves in Figure 33, and hence the velocity curves in Figure 34, a.re relatively smooth functions with respect to time. The velocities were piecewise clifferentSi- ated with respect to time, using the difference values of velocity and time in the data, file. to pr0duc.e t,he curves of bulk X-direction acceleration for each standoff as shown in Figure 35. The peak positive accelerations for the thin rectangular barricade are 631.5 km/s2 at 0.81 ms (3.0.5-m standoff), 658.0 km/ s2 at 0.69 ms (2.50-m standoff), and 679.7 km/s” at 0.59 ms (2.00-m standoff). The peak negative accelerations for the thin rectangular barricade are minus 808.7 km/s2 at 7.09 ms (3.05-m standoff), minus 586.9 km/s2 at0 5.88 ms (2.50-m standoff), and minus 583.8 km/s” at 5.05 ms (2.00-m standoff). These compare with the peak positive acceleration of 143.4 km/ s2 at 1.0 ms and a peak negative acceleration of minus 19.2 km/s2 at 32.80 ms for the massive trapezoidal barricade at a 3.05-m standoff. Because t,he full simulation time is displayed on the abscissa, the initial accelerations of the ba,rricxle for each standoff for the rectangular barricade appear to nearly overlay one another. Fig- ure 36 shows a temporally expanded plot of the first 10.0 ms of the X-direction accelera.tion of the barricade for each computation. The initial accelerations for the rectangular barricade occur in a direct sequence based on standoff distance, with the initial acceleration for the trapezoic1a.l barricade at a. 3.05-m standoff beginning at about the same time as that for tShe rectangular barricacle at that same standoff. The deceleration sequence for the rec.ta,ngu- lax ba,rrica.cle also occtlrs in direct correspondence to the standoff c1istanc.e. No meaningFu1 deceleration of the trapezoidal barricade occurs during t,he .first 10.0 111s.
1000.0
500.0
“e E s 6 .- 0.0 H a, $ 2
-500.0
-1000.0 t
I
- 980825 Rect, Standoff 3.05 m - 980828 Rect, Standoff 2.50 m - 980827 Rect, Standoff 2.00 m -- 980505 Trap, Standoff 3.05 m
I 20.0
Time (ms)
1 30.0 40.0
Figure 3.5. Wa.ter Ba.rricacle X-Direction Acc.elera.tion Toward the Acceptor Stack, Complu- tations 98082.5 Through 980827 (R.ecta.ngular), Plus 980505 (Tra.pezoicla,l).
44

1000.0
500.0
z E Y
g ‘Z 0.0 E cu 8 2
-500.0
-1000.0 - 0.0
I I I
- 980825 Rect, Standoff 3.05 m - 980826 Rect, Standoff 2.50 m - 980827 Rect, Standoff 2.00 m - 980505 Trap, Standoff 3.05 m
2.0 4.0 6.0 Time (ms)
8.0 10.0
Figure 136. Water Barricade Initial X-Direction Acceleration Toward the Acceptor Stack1 Computa.tions 980825 Through 98082’7 (R.ecta.ngula.r), Plus 980505 (Trapezoidal).
Figure 37 shows the total X-direc.tion impulse per meter depth on the left sur-lace of the ha.rricade. This wa.s computed by integrating the overpressure over s,pa.ce and time using 30 tracer pzwticles that were placed aalong the Jeft surface 0 the ba.rrica.cle a.t time zero; t;he grid genera.tion time. The overpressure is the absol,ut,e :pressure minus the ambient a.I:mospheric press11 re. The tracer pasticles were a.l.lowed to .move :freely with the flow in ~;hc grid. As the simulakecl time in the computakions progressed, the left surlkce of t.he l>a.rrica.de hecame increa.singly distorted to the point that, it was no longer clea,rly clefinahle as a, simple surface. Correspondingly, the impulse integra.1 itself probably lost mea.ning afer al)out, 10 ms. Essentially all of the .impulse from tlhe cletona.tiou o-f the donor stack is delivered to the ba.rtica.cle in the first few .milliseconcls. There is a moderate inverse -functiona,l reMon in impulse delivered to the recta.ngu1a.r ba.rricacle with respect. to standoff distance; nncl a. significa,nt difference in the impulse delivered to the left, surface of the tra,pezoidal barrica.cle versus the rectangular brricacle nt a 3.05-m st,a.ndoff distance. The peak values for the rectangu1a.r lxrricade are 1.185 MN-s/ m at 3S.3 ms (3.05-m sta.nclo-ff), 1.2S3 MN-s/m a.t :3S..5 ms (2.50-m standoff), ad 1.360 MN-s/ m at 35.8 ms (LOO-.m standoff). Because o-f the surfa.ce clidortion just disc.ussecl, the times of these peaks are not particulaxly importa.nt a.ncl are induclecl only for completeness. This equa.tes to a direct ratio ol peak impulse of 1.148 for a.n inverse ratio in relakive standoff distance of 1.524 for the standoff range of 3.05 m t,o 2.00 111: somewhat greater than the impulse ra,tio of 11.068 reported earlier2 for the trapezoidal l)a.rrica,cle. The pea,lc for the trapezoidal barricacle at the 3.05-m standoff is 0.9016 MN-s/m
45

at 34.5 ms, which is 23.9 percent below that for the rectangular barricade at the same
st~a.ncloff.
- - - 980825 980826 980827 Rect, Rect, Rect, Standoff Standoff Standoff 2.50 2.00 3.05 m m m
- 980505 Trap, Standoff 3.05 m
10.0 20.0 Time (ms)
30.0 .O
Figure 37. Water Rarricade :Left Surface Total X-Direction Imprdse per Meter Depth? C)om- putations 980825 Through 930827 (Rectangular), Plus 980505 (Trapezoicla.1).
The velocity clata are usecl to com,pute the bulk translation of the ixrticacle versus time, which is shown in Figure 38. The c.urves -for the rectangular barricade a.re most mea,ning~ul U~rough about 6 ms. At about this time the barricxle impacts the acceptor st,a.clc. The peak dista.nce of 4.853 m for 980825 occ.urs at what seems to be an early t,ime 0C 32.46 Ins Iwca.use o-f a. pronouncecl net rebound of a part, of the barricade from the xceptor stack 1efL surfa.ce. The curve for the clisplacement of the barricade in C:omputation 9SO50.5 shows less
displacement through about 30 ms.
Figure 39 shows the funct,ional relakions of the peak values (a.t different times) of the sel-era1 paxameters just described for the barricade in the preceding figures. The abscissa. shops t.he dimensional standoff distance. The ordinate shows the norma.lizecl clirect. ra.tio of paramet.ers, the value of a, given parameter at a given standoff cliviclecl by the corresponding value for t,he 3.048-m standoff. The curves for the peak momentum a.nc1 the peak velocity over1a.j: one another beca.ase of t,he clirect sca,ling b.y mass bet#ween them. Therefore: the red curve for the peak velocity is plotted as a, clashed line overwritten upon the solid black line for the peak momentum. This gives the appeara,nce af a claahecl bla.ck line in t#he plot itself for what is actually a. solid bla,ck line. Figure 40 shows the same da,ta as in Figure 39,
but with t,he abscissa showing the normalized inverse standoff ratio, computed as 3.048 m divided bp each successive st.ancloff ratio. Thus, the va.lue for t,he 3.04S-m standoff itself is
46
.
6.0
4.0
E $ 5 z .- n
2.0
0.0 I
- 980825 Rect, Standoff 3.05 m - 980826 Rect, Standoff 2.50 m - 980827 Rect, Standoff 2.00 m - 980505 Trap, Standoff 3.05 m
10.0 20.0 30.0 4 0 Time (ms)
Figure 38. Water Barricade X-Direction Distance I~lovecl TowaJrcl the Acceptor Sta.ck: Com- l>uta.f,ioIls 9SOS25 Through 980827 (Rectangular), Plus 980505 (Trapezoidal).
1.0. and the value for the 2.00-m standoff is 1.524. The orclinale is the sa.me a.s :for 1Figure 39 escept. for its sdiug. The a.bscissa and orcl.ina,te scales ase forcecl to be equal so that all)’ A_$-/AY = f1.0 relationship would show as a rf45-degree straight0 line. The .figures S?:IOM a, wea.1~ f~~~~ctiona,l reldion of all o-f these norma.lizecl pa.rameters with I~oth d.imensi0na.l ancl ~jorn_la.Iizec[ sf;ancloff. This shows that, as far aa t beae pa.ra.meters for this sim:pIifiecl baxricade are c~nc~rnecl, there is only a, minor penalty in ba.rrica,cle whole-body dynamics incurred lly moving the l)a.rrica.c-le closer to the donor stac.1; to a nomi na.1 I 3-m .from a. nominal :3-m sta.ncloR. Figure 41 shows the same data. as in Figure 40, but with the a.bscissa. and orclina.te .forcecl to a scaling tlla.t, will facilitate comparison with similar cla.tn for the acceptor stJack shown la.ter in the next section. While this forced scaling produces w.ha.t appea,rs to be a,n excess a.moLmt of “white spa,ce” in the plot, its value for the la,ter comparison esceecls the a.pparent la.ck of esthetics.
I * 3.3. Acceptor Stack Dynalnics
. Figure 42 shows the bulk momentum per centimeter of depth of the acceptor stack in the X direction for the three computations with the thin rect,angular barricade. I~~l~~clecl in t.hat figure is the hulk momentum per centimeter depth of the xceptor stack from the 13.0%117 sta,ndoff computa.tion, 9SOV505, with the massive trapezoidal wa,ter barricacle.2 Pos- itive momentum is defined in the positive X direction as before. There is only a minimal
47

1.25
1 1.20 zi iii E $ 1.15
B ?? ._ 9 ‘D 1.10 w .r g
E 1.05
1 .oo 2
- Peak Momentum - - - - Peak Velocity - Peak Acceleration - Peak Impulse -- Peak Distance
2.5 3.0 Standoff(m)
Figure 39. Normaked (Direct R.a.tio) &m%xde Parameters Versus Sta.ncloff Dista.nce? Com-
putations 980825 Through 980827.
1.60 I I. I., . , .
- Peak Momentum - - - - Peak Velocity - Peak Acceleration - Peak Impulse .- Peak Distance
F 1.30 - .- 9 m fi .r 1.20 - F z
--..-___
=
1.10
( -‘---- :
1.00 ’ 1.00 1.10 1.20 1.30 1.40 1.50 1.60
Normalized (Inverse) Standoff (-)
Figure 40. Xormdized (Direct Ratio) Ra.rtica8cle Parameters Versus Normdizecl (Indirect Ratio) St.&off Distance, Computations 9SOS25 Through 98OS2’7.
48

‘J3O “‘ 1.50 -
$ 1.40 -
5 E 1.30 - E
5 1.20 -
5 g 1.10 -
B g 1.00 -
.E 2 0.90 -
- PeakMomentum ---- Peak Velocity - Peak Acceleration - Peaklmpulse - Peak Distance
0.80 -
0.701.'~'*'. a .““‘.I.’ 0.70 0.80 0.90 1.00 1.10 1.20 1.30 1.40 1.50 1.60
Normalized (Inverse) Standoff(-)
Figure 41. Norma.lizecl (Direct Ratio) Barricade Parameters Versus Normalized (Indirect R.a.tio) Standoff Distance (R.escalecl), Computations 9SOS25 Through 9SOS27.
increa.se in t-he momentum of the acceptor stack ca.used by the air shock for tl1e three thin rect.a.ngular barricade computatious. After about 5 ms, all three computa.tions show a. Vera ra.picl increase in momentum caused by the impct of the waker barricade. The a.ccept,ot stack momentum from the 3.0,5-111 standoR computakion for the massive trapezoicla.1 wa.tel l>a.rrica,cle shows the three-stage sequent iaJ increase i t1 momentum described ,pteviously2 t l1a.t is caused by the air shock; the impct of the waker wa.ve on the top-left surface 0-T the acceptor slack. aad then the impact of the lower sections of the barricade on the a,cceptot stack. The momenlum of the acceptor stack a,l; 40.0 ms for Computa~tion 9SOS2.5 (rectangular 13a.rricacle, :3.0.5-m stauclo-ff, 28.61 kg/cm of depth) is 11.90 Mg-m/s, which is 3.00 times the corresponcl- ing va,lue of 3.962 Mg-m/s for Computakion 980505 (trapezoidal barrica.cle, 3.05-m sta.ncloff, 58.71 l;g/c.m of depth). The fina. momentun1 va,lues a.t 40.0 ms are 12.011 Mg-m/s for the 2.50-m st,andoff a.ncl 12.9.5 ililg-m/s for the 2.00-m standoff. TabIe 2 contains a. summa.r>
of severa.l X-clirec.tion para,meters thnt describe some of the bulk motion of t,he acceptor stack for the various computations. First among those parameters, after tl1e compnta.tion
numbers a,ncl standoff distances, are the peak X-direction bulk-momentum values for the acceptor stack, along with their respec6ive times of occurrence; listed wit11 more significant figures than were typica.1l.y used in the text for complet,eness. In order to facilitat,e conipa~r-
isons, the first, column of numbers is for the a,cceptor sta,ck in Computa.tion 980505 with the massive trapezoidal ba.rrica.cle at a 3.05-m standoff, followed 13y columns of data, for the t,hin
rectangular barricade computa.t,ions. ‘The rest of the pa.ra,meters in the table are discussed
in t,he following para.graphs.
49

15.0 I I I
T 10.0 - - 980825 Rect, Standoff 3.05 m I
$ - - 980826 980827 Rect, Rect, Standoff Standoff 2.50 2.00 m m
5 - 980505 Trap, Standoff 3.05 m
$
g 5.0 - -
//. 0.0 ---J A i ./-y---y ,
0.0 10.0 20.0 30.0 40.0 Time (ms)
Figure 42. Acceptor Stack X-Direction Momentum for Computations 9SOS2.5 Througl-1 950827 (Hec.tangular), Plus 980505 (Trapezoidal).
Ta.ble 2. Acceptor Stack Peak X-Direction Bulk-Motion Parameters.
Computat~iou Tra,pezoicla.l H.ecta,ngxla~r .R.ecta.ngula.r Nrlmber 980505 9sos2.5 9SOS26
StanclofF (117) 3.048 3.04s 2.50 Peak h3omentum
(Mg-Ill/S) 3.962 l’l.90 12.01 Time (ms) 40.00 39.87 39.ss
Peak Veloci try (Ill/S) 33.40 100.3 lO1.2
Time (ms) 40.00 39.87 39.ss Peak Ac.celera,tion
(h/S/S) 9.277 197.5 144.S Time (ms)
Peak Left-Surface 32.so 7.093 5.965
Impulse (MN-s/m) Time (111s)
Distance Traveled (m)
Time (ms)
0.3725 1.13s 39.99 39.99
0.4065 3.23’7 39.99 39.99
1.154 39.99
3.360 3.71s 39.99 39.99
R.ecta..ngular 9sosYi
2.00
l2.95 38.99
109.2 38.99
142.S 5.024
1.24s 39.99
50
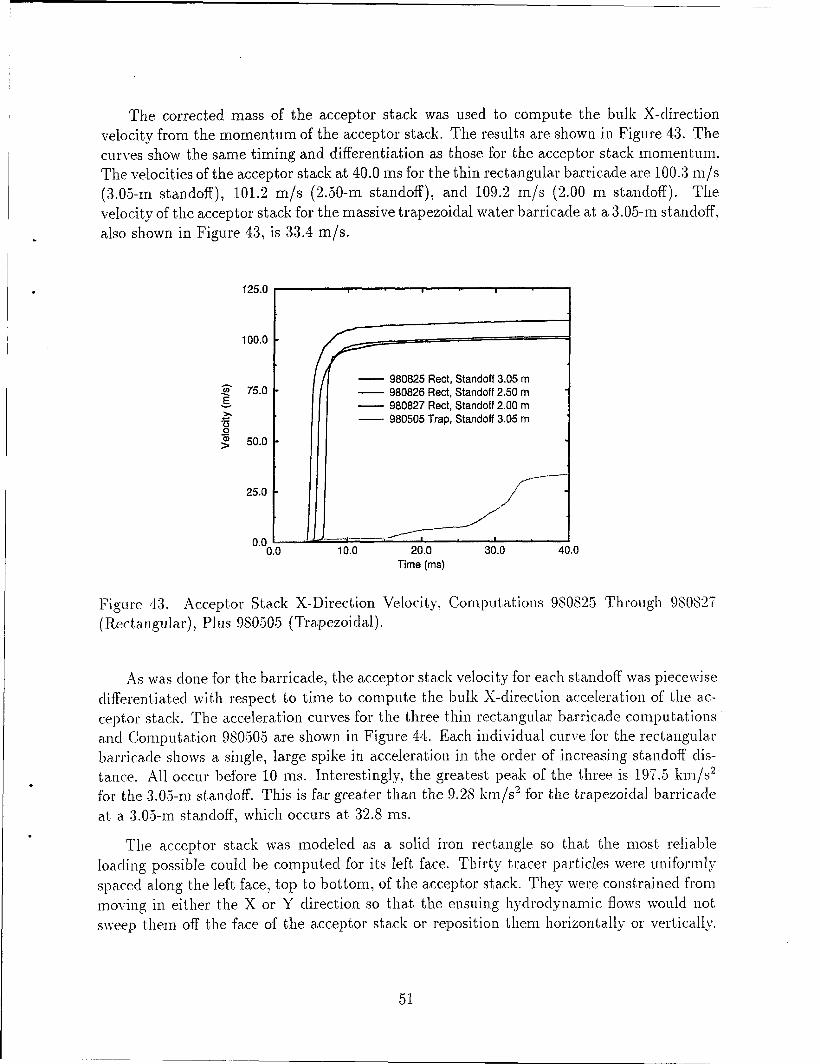
The corrected mass of the acceptor stack was used to compute the bulk X-direction velocity from the momentum of the acceptor stack. The results are shown in Figure 43. The curves show the same timing and differentiation as those for the acceptor stack momentum. The velocities of the acceptor stack at 40.0 ms for the thin rectangular barricade are 100.3 m/s (3.05-m standoff), 101.2 m/s (2.50-m standoff), and 109.2 m/s (2.00 m standoff). The velocity of the acceptor stack for the massive trapezoidal water basricade at a 3.05-m standoff, also shown in Figure 43, is 33.4 m/s.
125.0
100.0
3 E 75.0
>r .Fi 0 2 50.0
25.0
0.0 (
r
- 980825 Rect, Standoff 3.05 m - 980828 Rect, Standoff 2.50 m - 980827 Rect, Standoff 2.00 m - 980505 Trap, Standoff 3.05 m
Time (ms)
Figure 4.3. Acceptsor S&l< X-Direction VelociLy: Computa.Liotls 9SOS25 ~~l~~ough gsos2.:
(R.ectangular), Plus 9SO505 (Tra.pezoidnl).
As was clone for the lxrricacle, the a,cceptor sta,ck velocity for each standoff wa.s piecewise difierent.ia.ted with respect to time to c.omput,e the bulk X-direction accelera.tion of the ac- cept,or stack. Tl le accelera.tion curves for the three thin rectangulas l>axrica.cle computakions a.nd C)omputa.tion 980505 are shown in Figure 44. Eash inclividua.1 curve for the rectaagu1a.r ]~arrica.de shows a. single, la.rge spike in accelera.tion in the order of increa.sing standoff clis- ta.uce. All occur before 10 ms. Interestingly, the greakest peak of the three is 1.9’7.5 km/s’ for the :3.0.5-m standoff. This is far grenter than the 9.28 km/s2 for the tra.pezoic1a.l krricade at, a :3.05-m standoff, which occurs at 32.S ms.
The acceptor stack was modeled as a solid iron rectangle so t,hak the most reliable loading possible could be computed for its left face. Thirty tra.cer pa,rticles were uniformly spaced along t,he left fa,ce, top to bottom: of the a,cceptor stack. They were const*ra.ined from moving in either the X or Y direction so tl1a.t the ensuing hyclroclynamic flows woulcl not siveep them off the face of the a.cceptor stack or reposition them horizoiita~ly or vertica.lly.
51
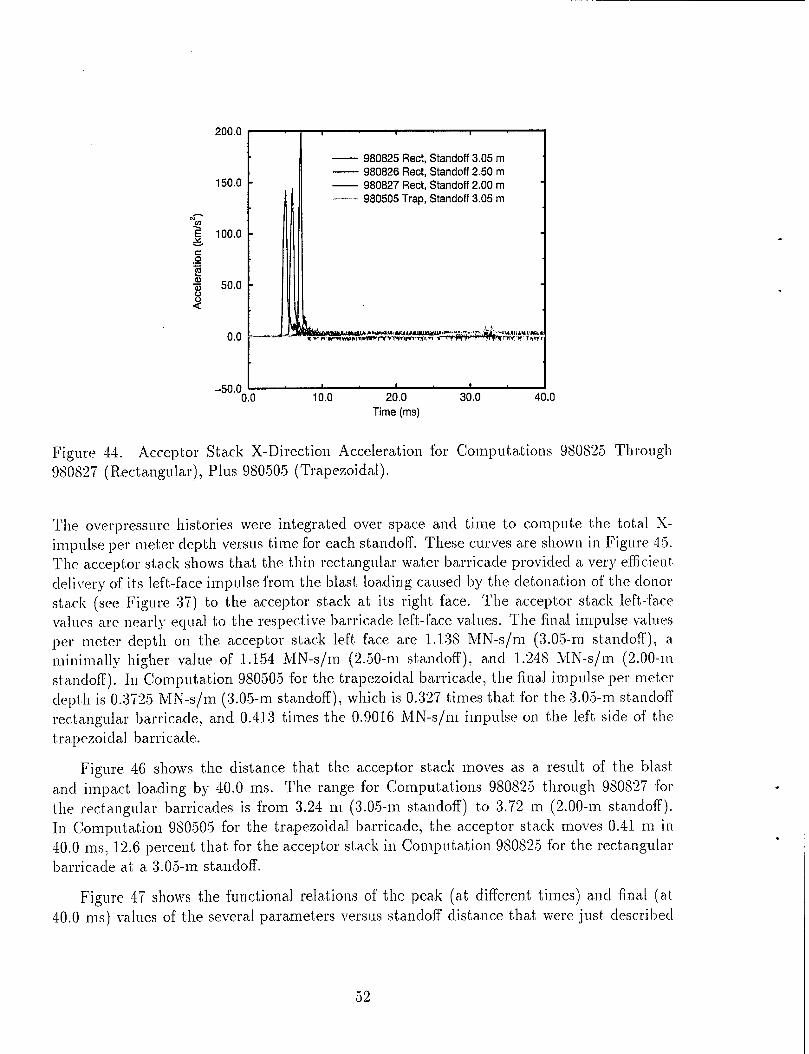
200.0
s .- Ei ii 3 50.0 8 a
-50.0 (
I - 980825 Rect, Standoff 3.05 m - 980826 Rect, Standoff 2.50 m -
II --.--. 980827 980505 Trap, Rect, Standoff Standoff 2.00 3.05 m m I
0 10.0 20.0 Time (ms)
30.0 40.0
Figure 14. Acceptor Stack X-Direction Acceleration t’or Computations 980825 Through 9SOSYi (R.ectangula.r), Plus 980505 (Trapezoidal).
The overpressure histories were integrated over space ad time to compute the total X- imp&e per meter depth versus time for each standolT. These curves axe sl~ocvn in Figure 45.
The xceptor stack shows that the thin rectangu1a.r waker barricade provided a very effic.ienl: delivery of its left-face impulse from the blast loading caused by t,hc clel;onation of the clonol st,a.ck (see Figure 37) t,o the accepl;or stack a.tr its right face. The acceptor stc?,ck left-face values are nearly equal to the respective ba.rrica.cle I&-Ca.ce values. The final ini pulse values per met:er depth on the xceptor stack left Face a,re 1.138 MN-s/m (3.05-m stanclo-fl’): a minimally lliglwr value of 1.154 M.N-s/m (2.*50-m ~tancloff)~ and 1.248 MN-s/m (2.00-m sta.ncloff). In Computa,tion 980505 .fo’or the trapezoidal baxricacle, the finaJ impulse per mete1 clept,h is’OJ’j25 MN-s/m (3.05-m standoff), which. is 0.327 times that for the 3.05-m standoff recta.ngu1a.r 1~a.rricacle7 and 0.413 times the 0.901.6 MN-</ $ m impulse on the left side of the trapezoida, barricade.
Figure 46 shows the distance tha,t the acceptor sta.ck moves as a. result of the blast,
a.ncl impact loa.cling by 40.0 ms. The range for Computations 9SOS2.5 through 980827 -for the rectangular lxrricacles is from 3.24 m (3.05-m stad0ffj to 3.72 m (2.00-m staucldf). In C!omp~~t,a,t,ion 98030.5 for the trspezoida.1 krricade, the a.cceptor stack moves 0.41 m in -I-O.0 ms, 12.6 percent, tl1a.t for the acceptor st~ncl~ in Computation 9SOS25 for the rectangular barricade at. a 3.05-m sta.idoff.
Figure 4.7 shows the functional rela,tions of the peak (a.t different times) a.ncl final (at 40.0 ms) values of the several parameters versus sta.ucloff clistance that were just, clescril>ecl
52

*
I I l
- 980825 Rect, Standoff 3.05 m - 980826 Rect, Standoff 2.50 m - 980827 Rect, Standoff 2.00 m - 980505 Trap, Standoff 3.05 m
11--/i’- 10.0 20.0
Time (ms) 30.0 40.0
Figure 45. Acceptor Stack X-Ditxtion Total Impulse per Meter Depth, Comguhhions
95082.5 Through 980827 (Rectangular), Plus 950505 (Trapezoidal).
4.0 I I I - 980825 Rect, Standoff 3.05 m
. - 980826 Rect, Standoff 2.50 m - 980827 Rect, Standoff 2.00 m - 3.0 - 980505 Trap, Standoff 3.05 m
1.0 -
Time (ms)
Figure 46. Acceptor Stxk X-Direction Distance Moved, Computations 9SOS23 Through 9SOS2’i (Rectangular), Plus 980.505 (Trapezoidal).
53
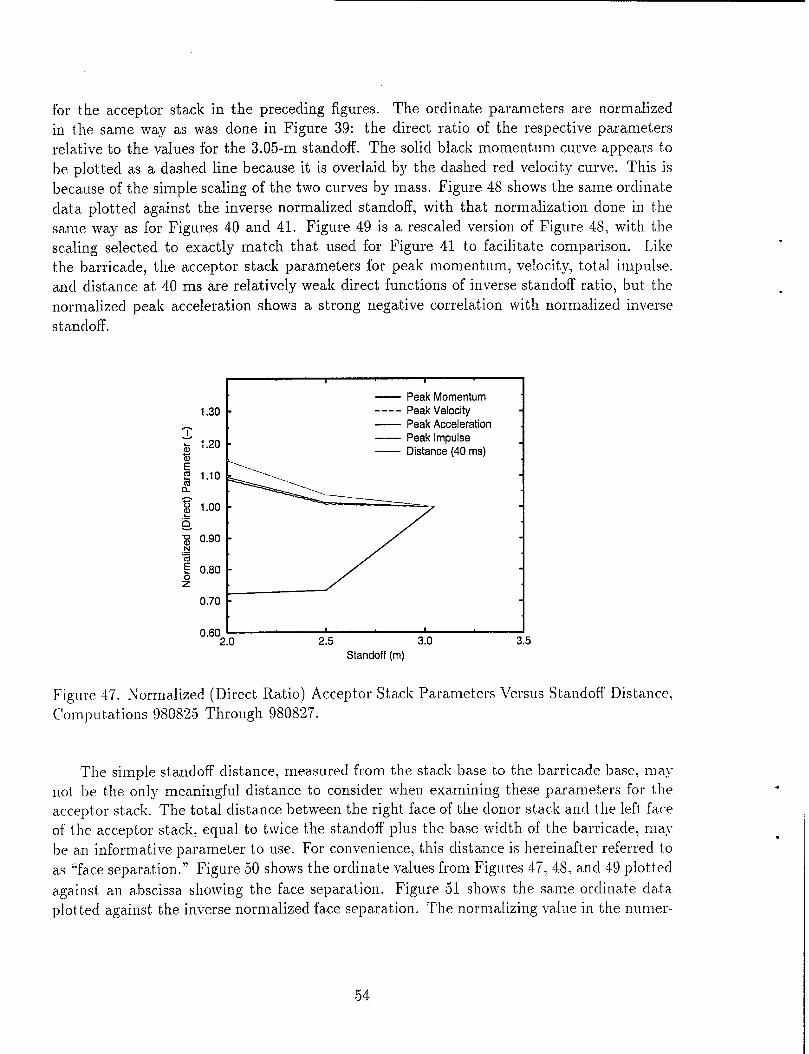
for the acceptor stack in the preceding figures. The ordinate parameters are normalized in the same way as was done in Figure 39: the direct ratio of the respec.tive parameters rela,tive to the values for the 3.05-m standoff. The solid black momentum curve appears to be plotted as a dashed line because it is overlaid by the dashed red velocity curve. This is because of the simple scaling of the two curves by mass. Figure 48 shows the same orclinake clat,a plotted against the inverse normalized standoff, with that normalization done in the same way as for Figures 40 and 41. Figure 49 is a. resealed version of Figure 48, with the scaling selected to exactly match that used for Figure 41 to fa,c.ilitate compaxison. Like the barricade, the acceptor stack parameters for peak momentum? velocity, total impulse. and distance a.t 40 ms are relatively weak direct functions of inverse standoff ratio, but, t,he normalized peak acceleration shows a strong negative correlat,ion with normalized inverse skncloff.
1.30
1 2 1.20 iii
5 1.10 a
E 1.00 ii 3 0.90 2
z! z 0.60 z
0.70
- Peak Momentum - - - - Peak Velocity - Peak Acceleration - Peak Impulse - Distance (40 ms)
0.60 2.0 2.5 9.u
Standoff (m)
Figure 47. Normalized (Direc.t R.atio) Acceptor Stack Paxa,meters Versus Standoff Dista.nce, C!omput,a.t,ions 980825 Through 980827.
The simple standoff distance, measured from the st*a.ck base to the ba.rrica.de base, may not be the only meaningful distance to consider when esamining these pa.ra.metcrs for the acceptor stxk. The total distance between the right face of the donor sta.ck and the left, face of the acceptor stack: equal to twice the standoff plus the ba.se width of the ba.rric.acle? ma; be an informative pa,ra,meter to use. For conveniencei this clistance is hereinafter referred to a.s “face sepa.ration.” Figure 50 shows the orclinake values from Figures 4’i, 48, a.ncl 49 plotted a.gainst an a,bsc.issa. showing the face sepa.ra,tion. Figure 51 shows the same or&lake da.ta. plot t.ecl a,gainst, the inverse normalized face sepaxa.tion. ‘The normaking value in the numer-
.
l I
.
54
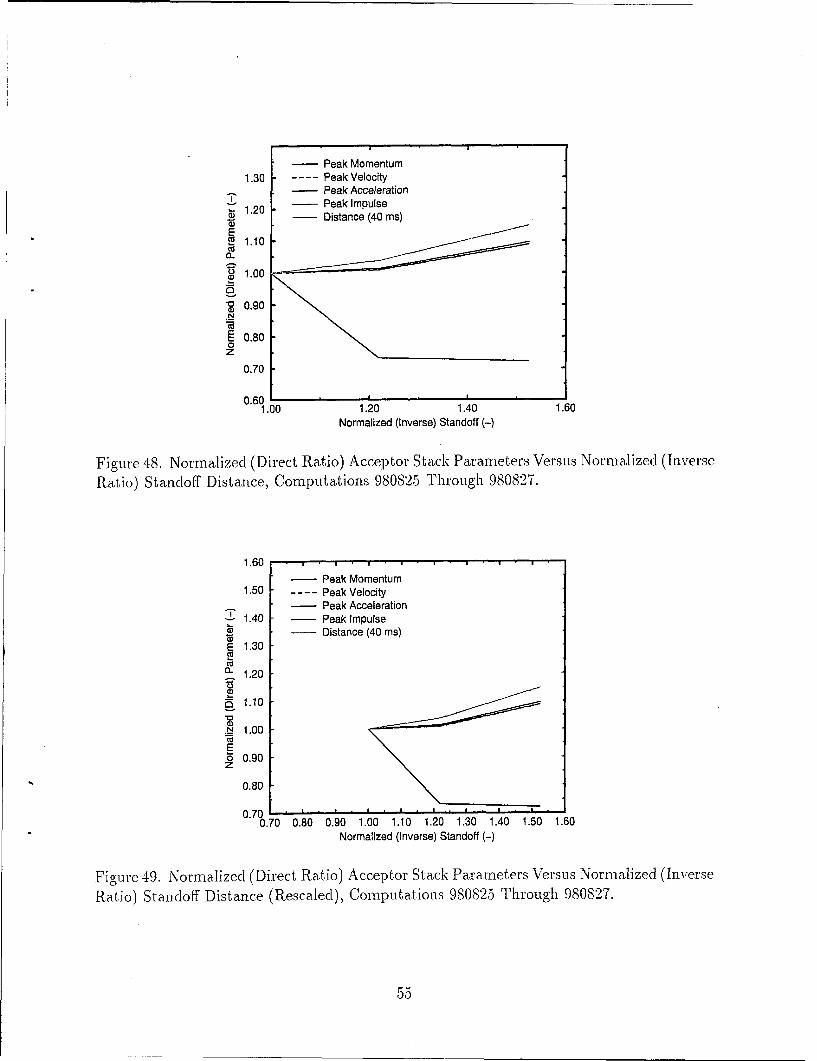
I -
0.60 - 1.00
I
- Peak Momentum ---- PeakVelocity - Peak Acceleration - Peak Impulse - Distance (40 ms)
1.20 1.40 Normalized (Inverse) Standoff (-)
Figure 4s. Norma.lizecl (Direct R.atio) Acceptor S tac.1~ Parameters Versus Normalized (Inverse Ra.tio) Standoff Distance, Computations 980825 Through 98OS’s’i.
1.60 m . I ’ I I . I . I . I . 1 ’ ’ - Peak Momentum
1.50 - ---- Peak Velocity . - Peak Acceleration
$ 1.40 - - Peak Impulse . xi - Distance (40 ms)
; 1.30 -
iif 1.20 - H b’ 1.10 -
$ g 1.00 -
E p 0.90 -
0.80 -
0.701. ’ . ’ ’ ’ . ’ . ’ . ’ ’ . 0.70 0.80 0.90 1.00 1.10 1.20 1.30 1.40 1.50 1.60
Normalized (Inverse) Standoff (-)
Figure 49. Normalized (Direct Ra.tio) Acceptor Sta.ck Pammeters Versus Norrdizecl (Inverse Rat,io) StandofF Dista.nce (R.esca.lecl), Computations 980825 Through 9SOWi.
55

ator was the face separation for the 3.05 m standoff. One-to-one scaling for the normalized abscissa and ordinate was forc.ed in this figure. The normalized peak momentum, veloc.ity, impulse, and distance show a weak correlation with the inverse normalized face separa,tion. The pea.k ac.celeration shows a relatively strong negative correlation with inverse normalized fa.ce separation.
- Peak Momentum 1.30 - ---- PeakVelocity
- 1
Peak Acceleration - $ 1.20 - Peak Impulse - Distance (40 ms)
Figure 50. Normalized (Direct; R.atio) Acceptor Sl;a.ck Paxan-lel;ers Versus l%ce Sepadion.
Clom~~~~t,a.t,ions 980825 Through 98082’7.
Face Separation (m)
3.4. Acceptor Stack Left Surface Pressures
The pressures on the surfa,ce of the acceptor stack during this type of event. axe of grea.t interest. Da.ta. from the 30 tra.cers that were pla.ced uniformly along the left surfa,ce of t,he a.c- celltor sta.ck were processed to present, a, comprehensive summary of the overpressure hist,ory on t.ljat surfa.ce for ea.& computation. An a.rea.-weighted a.vera.ge overpressure was computed using all of the 30 indiviclua.1 tracer pressures a.t, ea.& point, in time. The ma.ximum overpres- sure for a.n_ of the tracers at a given time was identified, as was the minimum. The results from the three coixputations for the thin recta.ngu1a.r ba.rrica.cle a.re presented here a.long wit.11 results from previous computations 2 for the ma,ssive trapezoida, wa.t.er barrica.cle a.t, ma.tching st.a.ndoff distances: 980505 (3.05-m standoff), 980521 (2.50-m sta.ncloff), ad 9SOGlO (2.00-m standoff). Figure 52 shows the average, maximum, and minimum overpressures verslIs time 011 the left, surface of the acceptor st*ack for a. standoff of 3.05 m for Computa,tion 9SOS2.51 \rhich has the thin rectangular barrica,de, a.ncl the a.vera.ge and ma.ximum overpressures for
.
56
1.50 1 I. I. I. I I * I . - Peak Momentum
1.40 - ---- PeakVelocity - 2 . Peak Acceleration
$ ,.a0 _ - Peak Impulse 33 - Distance (40 ms)
g 1.20 - 0
g 1.10 - .5 CL 3 1.00 - 2
k! $ 0.90 - Z
0.80 -
0.70 I . I. I. I. I. I 1. 0.70 0.80 0.90 1.00 1.10 1.20 1.30 1.40 1.50
Normalized (Inverse) Face Separation (-)
.
Figure 51. Normalized (Direct Ratio) Acceptor Stack .Parameters Versus Normalizecl (Inverse Ratio) Face Separation, Computations 980825 Through 9SOS27.
Comput,a.tion 980505. The overpressure history for Computation 9SOS25 is dominated by a, single, la.rge spike centered around 7 ms, with compasatively minor pressure activity adter that. The early air shock ak &out 3 ms is negligible by compa.rison. The average and mas- imum overpressures .for 980505 cl0 not show as being significant on t,his plot tj ng scale until about, 1.5 11x5, a,ncl a.re quite small compared with those for 980825. The average overpressure plot; for SSOS25 in Figure 52 is particula.rly useful in helping I;0 better unclersta.ncl the sharp rise of the impulse curve a,t early time to a near-maximum va.lue for the 3.05-m stancloff shown in Figure 45.
Figure 53 shows the plots of average, maximum, a..nd minimum overpressure for 980826 along with corresponding plots of a,verage and ma.simum overpressure for I;he trapezoidal barricade Computdion 9SO521 a.t a. 2.50-:m standoff. Simila,rly, Figure 54 shows the same sets of plots for Computations 9SOS27 (rec.tangu1a.r ba.rric.a.cle) and 980610 (tra,pezoidaJ barri- cade). The overpressure va.lues in these two plots show qualitatively simi1a.r beha.vior to tha.t shown in Figure .s-. -3 All show an essentia,lly negligible loading from the air shocl~ a.t early time. Subsequent.ly, the overpressure histories ,for the left face of the acceptor stack in the computa.tions for the thin rectangular barricade a.re dominated by a. single, la.rge ma.in pulse becalrse of a broad-a.rea impact of the barrica,cle. Those .for the tra,pezoiclal barricade have a compara.tively small two-sta,ge overpressure loading because of a two-stage impa.ct of the barricade on the a.cceptor stack, first on the top of the left face, and then an impact spreading upwa.rd from the bottom of the left face. All three computakions for the thin rect,angula.r
57
2.0
1.5
z 1.0 Sz. !J 2 I & 0.5
0.0
-0.5
- 980825 Red, Average - 980825 Red, Maximum - 980825 Red, Minimum - 980505 Trap, Average - 980505 Trap, Maximum
0.0 10.0 20.0 Time (ms)
30.0 40.0
Figure 52. Acceptor Stack Left Surface Overpressure! 3.05-m Stando-f?, C!omputa.tions 980825 (R._.t gl ) ec an u ar and 980505 (Trapezoidal).
wa.t,er hrricacle show peak values of overpressure on the left surlxe ol the a.ccept.or slack in the range of 2 GPa (20 khar). These are high enough pressures to represent a threa.t, of inducing a. chemic.a.1 reaction in the acceptor stack if they are efficiently transmitted through pa.cka.ging a.ncl/or c.asings t,o the energetic loads of the munitions. The report by Liclclinxd and Forl~es~LS staked, for example? that the unclerwa,ter sensitivity test (UST) showed tl1a.t “...compression by a 3 or 4 1cba.r shock is? of itself, a, sufFicient external stimulus to start cl~en1ica.l reaction in a. heterogeneous solid explosive such as pentolite...” ancl “...UST burn- ing occurs a.t peak stresses of 4 to 12 klxkr in the explosives...” These I3last. pressures on
t,lle sinlula.tecl~ fla.t iron surfa.ce of the acceptor stack a.re prokbly higher tha.n they would I)e on a. more realistically simulat,ecl surface of incliviclua.1 munitions with curved surfaces or individual hoses. Those lower surface pressures would transmit a. further-reclucecl shock though the pa&a,ging and ca.sing materials into the energetic loa,cl of the munitions in a, real a.cceptor stack because of the proba.ble impedance mismatches at the va.rious inlerfaces. However, secondary impacts of accelera.ted munitions into other munitions could serve to generate increa.secl pressures being generated at the impact interfaces. The addition of an\- impacts by fra.gments from the donor stack, not c.onsiclerecl here; would introduce a. new set of dynamics int.o the loading of the munitions in the acceptor sta.ck.
C
58
I .
2.0
1.5
1 .o
0.5
0.0 -
1 8
- 980826 Rect, Average - 980826 Rect, Maximum - 980826 Rect, Minimum - 980521 Trap, Average - 980521 Trap, Maximum
-0.5 I 0.0 10.0 20.0 30.0 4
Time (ms) 0
Figure 53. Ac.ceptor Stxk Left Surface Overpressure, 2.50-m Standoff, Cor-rlputations 9SOS26 (R.. t g 1, ) ec an u w and 930521 (Trapezoicla~l).
2.5
LO
- 980827 Rect, Average - 980827 Rect, Maximum - 980827 Rect, Minimum - 980610 Trap, Average - 980610 Trap, Maximum
, I I -- _ -_ -
10.0 20.0 Time (ms)
Figure 51. Accept,or St& Left Surface Overpressure, 2.00-:m Standoff, Cornputakions 9SOS2i (R.ecta.ngular) and 980610 (Tral>ezoidal).
59
4. CONCLUSION
The coupled computations discussed herein modeled a simplified, uncased, rectangular explosive charge representing a nominal munitions stack containing 4,000 kg of Camp-B undergoing a complete, high-order detonation with the initiation point at its center. No munitions casings or packing materials (and their resulting fragments) were included. The only barricade design that was used was a solid, water-only 1.17-m-thick rectangle. A geo- metrically simplified 2-D Cartesian coordinates system with the same finite-difference grid was used throughout the computations. This eliminated 3-D divergence effects that could reduce loadings considerably. The only parameter that was varied was the standoff distance.
These computations demonstrate a relatively weak inverse functional relationship be- tween normalized values of the standoff distance and the loading on and whole-body re- sponse of the barricade. Similar results for both standoff and face separation were found for the loading on and whole-body response of the acceptor stack, escept for a stronger functional relation of acceleration. The impact loading on the acceptor stack by the thin rec.tangular water barricade is much more severe than that reported earlier2 for the mas- sive trapezoidal water barricade. Peak pressures on the acceptor stack are high enough, approximat~ely 2 GPa, to represent a threat of initiating a chemic.al reaction in munitions wit,hin the acceptor stack. Also, the rectangular barricacle was not effective in keeping esplo- sive products from the donor stac.k away from the acceptor stack. Because the donor stack was represented by a simple, bare explosive charge, the synergistic effec.ts of the impact. of laxge numbers of high-speed -fra,gments along with the barricade i rnpa,ct loa.ding were not addressed. Another series of compl~ta.tions for a, l.‘iO-m-thick rectangu1a.r waker ba.rricnde ha.s hen completed and will be reported protnpt.ly i.n a. sepamte publication, and the results of a.ll of the wa.ter barricacle computakions reportecl to cla,te will be tied together. Additional compl.l~a.tiona.1 studies of sa.ncl-filled hricacles aae in progress, as a,re studies of the impact
ol’ wa.t,er a.nd sand on simulakecl miunitiorx3.
.
60
1.
2.
3.
4.
5.
6.
7.
8.
9 c .
10.
-11.
12.
1:3.
REFERENCES
R.E. Lottero, “Responses of a Water Barricade and an Acceptor Stack to the Detonation of a Donor Munitions Stack,” ARL-TR-1600, U.S. Army Research Laboratory, Aberdeen Proving Ground, MD, March 1998.
R..E. Lottero, “Standoff Variation Study I: Detonation of a Donor Munitions Stack and Responses of a Trapezoidal Water Barricade and an Acceptor Stack,” ARL-TR-1913, 1J.S. Army R.esearch Laboratory, Aberdeen Proving Ground, MD, May 1999.
J.M. McGlaun, S.L. Thompson, L.N. Kmetck, and M.G. Elrick, “A Brief Description of the Three-Dimensional Shock Wave Physics Code CTH,” SAND 89-0607, Sandia National Laboratories, Albuquerque, NM, July 1990.
R.L. Bell, M.R. Baer, R.M. Brannon, M.G. Elrick, E.S. Hertel Jr., S.A. Silling, and P.A. Tayvlor, “CTHGEN User’s Manual and Input Instructions, Version 4.00,” CTH Development Project, Sandia National Laboratories, Albuquerque, NM, 10 March 1998.
R..L. Bell, M.R. Baer, R.M. Brannon, M.G. Elrick, E.S. Hertel Jr., S.A. Silling, and P._4. Taylor, “CTH U ser’s Manual and Input Instructions, Version 4.00,” CTH Development Project, Sandia. National Laboratories, Albuquerque, NM, 13 March 1998.
J. Starkenberg, K.J. Benjamin, and R.B. Frey, “Predicting Fragmenta,tion Propagation Proba,bilities for Ammunition Stacks,” ARL-TR-949, U.S. Army Research Labora,tory, Aberdeen Proving Ground, MD, January 1996.
Hea.dqua.rters, Department of the Army, “Technical Manual. Army Ammunition Data Sheet,s. Artillery Ammunition. Guns, Howitzers, Mortars, Recoilless Rifles, Grena.de La.unchers, and Artillery Fuzes.” TM-43-0001-28, April 1977.
Depa.rt,ment of the Army, “Ammunition a.nd Explosives Safety Standards,” AR 385-63, 22 M.ay 1987.
G.I. Iierley and T.L.C. Frea,r, “Composition B-3 Detonation Products,” SAND93-2131? Sandia National Laboratories, Albuquerque, NM, 1993.
G.I. Iierley, “CTH R e erence Manual: The Equation of State Package,” SAND91-0344: f Sandia Na,t.ional Laboratories, Albuquerque, NM, 24 May 1991.
B.M. Dobratz a.nd P.C. Crawford, “LLNL Explosives Handbook, Properties of Chemical Explosives and Explosive Simulants,” UCRL-52997, Change 2, La.wrenc.e Livermore Nat,ional La.bora.tory, Livermore, CA, 31 January 1985.
Hesco Ba,stion Limited, Unit 37, Knowsthorpe Gate, Cross Green Industrial Estate, Leeds LS9 ONP, West Yorkshire, England.
J. Starkenberg: Private communication, U.S. Army R.esearch Laboratory, Aberdeen
Proving Ground, MD, July 1998.
61
14. R..D. Cregar, Private communication, U.S. Army Resea,rch Laboratory, Aberdeen Prov- ing Ground, MD, July 1998.
1.5. F.H. Ree, “Equation of State for Water,” UCRL-52190, Lawrence Livermore National Laboratory, Livermore, CA, December 1976.
16. G.I. Kerley, “Multiphase Equation of Sta.te for Iron,” SAND93-0227, Sandia National Labora.tories, Albuquerque, NM, 1993.
17. H.C. Gra.boske, Data for dry air, UCID-16901, December 1981 (modified March 1992).
18. T.P. Liddiard and J.W. Forbes; “A Summary Report of the Modified Gap Test and the Underwater Sensitivity Test,” NSWC TR 86-350, Naval Surfa.ce Warfare Center, Silver Spring, MD, 12 March 1987.
62
NO. OF COPIES
2
1
1
1
1
1
1
1
ORGANIZATION NO. OF COPIES ORGANIZATION
DEFENSE TECHNICAL 1 DIRECTOR INFORMATION CENTER US ARMY RESEARCH LAB DTIC DDA AMSRL DD 8725 JOHN J KINGMAN RD J J ROCCHIO STE 0944 2800 POWDER MJLL RD FT BELVOIR VA 22060-6218 ADELPHI MD 20783- 1145
HQDA DAMOFDQ D SCHMIDT 400 ARMY PENTAGON WASHINGTON DC 203 lo-0460
1 DIRECTOR US ARMY RESEARCH LAB AMSRL CS AS (RECORDS MGMT) 2800 POWDER MILL RD ADELPHJ MD 20783-l 145
OSD OUSD(AdzT)/ODDDR&E(R) RJTREW THE PENTAGON WASHINGTON DC 20301-7100
3 DIRECTOR US ARMY RESEARCH LAB AMSRL CI LL 2800 POWDER MILL RD ADELPHI MD 20783-l 145
DPTY CG FOR RDE HQ usARMYMATERJELcMD AMCRD MG CALDWELL 4 5001 EISENHOWER AVE ALEXANDRIA VA 22333-0001
ABERDEEN PROVING GROUND
DIR USARL AMSRL CI LP (305)
INST FOR ADVNCD TCHNLGY THE UNIV OF TEXAS AT AUSTIN PO BOX 202797 AUSTIN TX 78720-2797
DARPA B KASPAR 3701 N FAIRFAX DR ARLINGTON VA 22203-1714
NAVAL SURFACE WARFARE CTR CODE B07 J PENNELLA 17320 DAHLGREN RD BLDG 1470 RM 1101 DAHLGREN VA 22448-5100
US MILITARY ACADEMY MATH SC1 CTR OF EXCELLENCE DEFT OF MATHEMATICAL SC1 MAJMDPHJLLJJ’S THAYER HALL WEST POINT NY 10996-1786
63

NO. OF COPIES
1
ORGANIZATION
DIRECTOR DEFENSE RSCH AND ENGNRNG DDTWF WASHINGTON DC 20301
COMMANDER FIELD COMMAND DSWA FCTTS E MARTINEZ KIRTLAND AFB NM 87115
DIRECTOR ADV RSCH PROJECTS AGNCY TECH LIB 3701 N FAIRFAX DR ARLINGTON VA 22203- 17 14
COMMANDER USA ARDEC AMSTA FSM W BARBER BLDG 94 PICATINNY ARSENAL NJ 07806~So00
COMMANDER USA ENGINEER DMSION HNDED FD PO BOX 1500 HUNTSVILLE AL 35807
COMMANDER USA CORPS OF ENGNRS FT WORTH DSTRCT CESWF PM J , PO BOX 17300 FT WORTH TX 76 102-0300
COMMANDER USA RSCH OFFICE SLCRO D PO BOX 12211 RESEARCH TRIANGLE PARK NC 27709-2211
COMMANDER DAVID TAYLOR RSCH CTR TECH INFO CTR CODE 522 BETHESDA MD 20084-5000
NO. OF COPIES ORGANIZATION
1
1
1
OFFICER IN CHARGE CML ENGNRNG LAB NAVAL CONST BATTALION CTR TECH LIB CODE L31 PORT HUENEME CA 93041
COMMANDER NAVAL WEAPONS CTR TECH LIB CODE 533 CHINA LAKE CA 93555-6001
COMh&ANDER ’ NSWC DAHLGREN DMSION LIB CODE E23 DAHLGREN VA 22448-5000
COMMANDER NAVAL RSCH LAB TECH LIB CODE 2027 WASHINGTON DC 20375
COMMANDER NAVAL WEAPOONS EVAL FAC DOCUMENT CONTROL KIRTLAND AFB NM 87117
AIR FORCE ARMAMENTLAB AFATL DOIL AFATL DLYV EGLIN AFB FL 32542-5000
DIRECTOR LAWRENENC LIVERMORE NATL LAB TECH INFO DEPT L 3 PO BOX 808 LIVERMORE CA 94550
NAIC DXLA TECH LIB 4180 WATSON WAY WRIGHT PATTERSON AFB OH 45433-5648
KAMAN SCIENCES CORPORATION LIBRARY PO BOX 7463 COLORADO SPRINGS CO 80933-7463
64

NO. OF NO. OF ORGANIZATION COPIES ORGANIZATION COPJES
1
2
2
DIRECTOR SANDJA NATL LAB DOC CONTROL 3141 PO BOX 5800 ALBUQUERQUE NM 87185-5800
LOS ALAMOS NATLLAB RPT COLCTN CIC 14 MS P364 CID 14 MS P364 PO BOX 1663 LOS ALAMOS NM 87545
REPORT COLLECTION AGENCY RSCH LAB MS P362 PO BOX7113 LOS ALAMOS NM 875447113
DIRECTOR SANDIP; NATL LAB LIVERMORELAB DOC CONTROL FOR THE LIB PO BOX 969 LIVERMORE CA 94550
DIRECTOR NASA LANGLEY RSCH CTR TECH LIB HAMPTON VA 23665
3
1
SUNBURST RECOVERY INC C YOUNG PO BOX 2129 STEAMBOAT SPRINGS CO 80477
1 SRI INTERNATIONAL JGRAN B HOLMES 333 RAVEWOOD AVE MENLO PARK CA 94025
1 DENVER RSCH INSTITUTE J WISOTSKI TECH LIB PO BOX 10758 DENVER CO 80210
65
SOUTHWEST RSCH INSTITUTE C ANDERSON SMULLIN ABWENZEL PO DRAWER 28255 SAN ANTONIO TX 78228-0255
UNIVERSITY OF TEXAS ARL ELCTROMAG GROUP A TUCKER CAMPUS MAIL CODE FO250 AUSTIN TX 787 12
UNIVOFMARYLAND R DICK RM 2168 ENGRG CLASSROOM BLDG COLLEGE PARK MD 20742-5 121
US NAVAL ACADEMY TECHLJB ‘572 HOLLOWAY RD ANNAPOLIS MD 21402-5002
OLIN ORDNANCE RECH LIB J KIBIGER PRODUCT MATERIAL CONTROL 101019TH ST N ST PETERSBURG FL 33716
COMMANDER INDIAN HEAD DIV NSWC CODE 950T M SWISDAK 101 STRAUSS AVE INDIAN HEAD MD 20640-5035
COMMANDING OFFICER NFESC J TANCRETO ESC62 110023RDAVEBLDG1100 PORT HUENEME CA 93043-4370
DOD EXFOSIVES SAFETY BOARD JWARD HOFFMAN BLDG 1 ROOM 856C 2461 EISENHOWER AVE ALEXANDRIA VA 2233 l-0600

NO. OF COPIES
1
ORGANIZATION
DEFENSE AMMOLOG ACTIVITY AMSTA AR AL D SCARBOROUGH PICATINNY ARSENAL NJ 07806-5000
US ARMY SOLDIER SYSTEMS CMD 1 COMMANDER SSCNS WSO D LEMOINE USATC KANSAS ST STEC LI NATICK MA 01760-5018
USAE WATERWAYS EXP STN CEWES SD R P KINNEBREW B CARNES CEWES TL TECH LIB CEWES SD K DAVIS CEWES SS J WEATHERSBY 3909 HALLS FERRY RD VICKSBURG MS 39180-6199
DIR SNL ES HERTEL JR MS 0819 PO BOX 5800 ALBUQUERQUE NM 87 185-0307
KERLEY PUB sue G I KERLEY PO BOX 13835 ALBUQUERQUE NM 87192-3835
NO. OF COPIES ORGANIZATION
ABERDEEN PROVING GROUND
1 COMMANDER US ARMY TECOM AMSTE TE F L TELETSKI
29 DIR USARL AMSRLWMMA ’
WCHIN TMULKERN C PERGANTIS
AMSRL WM PB B GUIDOS H EDGE P PLosTJNs P WEINACHT
AMSRLWMT A M DIETRICH
AMSRLWMTB V BOYLE P BAKER T DORSEY RFREY W HILLSTROM W LAWRENCE R LOTTERO (SCPS) E MCDOUGAL J STARKENBERG J WATSON
AMSRL WM TC K KIMSEY D SCHEFFLER s SCHRAML
AMSRLWMTD P KINGMAN M RAFIENBERG S SCHOENFELD P SIMMERS
66
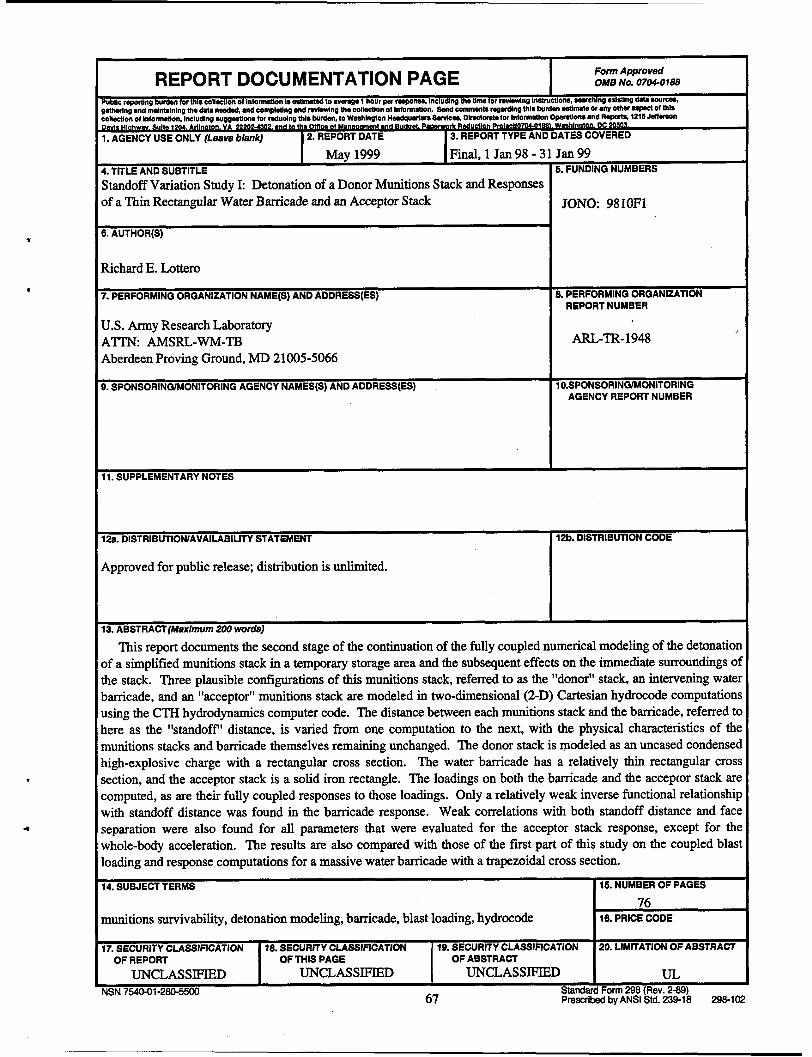
Standoff Variatron JONO: 98 IOFl
Richard E. Lottero
REPORT NUMBER
U.S. Army Research Laboratory A’I-IX AMSRL-WM-TB
I ARLrTR- 1948
Aberdeen Proving Ground,
11. SUPPLEMENTARY NOTES
12a. DISTRIBUTION/AVAILABILITY STATEMENT 12b. DISTRIBUTION CODE
Approved for public release; distribution is unlimited.
13. ABSTRACT(Maximum 200 words)
This report documents the second stage of the continuation of the fully coupled numerical modeling of the detonation of a simplified munitions stack in a temporary storage area and the subsequent effects on the immediate surroundings ol the stack. Three plausible configurations of this munitions stack, referred to as the “donor” stack, an intervening water barricade, and an “acceptor” munitions stack are modeled in two-dimensional (2-D) Cartesian hydrocode computations using the CTH hydrodynamics computer code. The distance between each munitions stack and the barricade, referred tc here as the “standoff’ distance, is varied from one computation to the next, with the physical characteristics of the munitions stacks and barricade themselves remaining unchanged. The donor stack is modeled as an uncased condensed high-explosive charge with a rectangular cross section. The water barricade has a relatively thin rectangular cross section, and the acceptor stack is a solid iron rectangle. The loadings on both the barricade and the acceptor stack are computed, as are their fully coupled responses to those loadings. Only a relatively weak inverse functional relationship with standoff distance was found in the barricade response. Weak correlations with both standoff distance and face separation were also found for all parameters that were evaluated for the acceptor stack response, except for the whole-body acceleration. The results are also compared with those of the first part of this study on the coupled blasl loading and response computations for a massive water barricade with a trapezoidal cross section.
14. SUBJECT TERMS 15. NUMBER OF PAGES
76 munitions survivability, detonation modeling, barricade, blast loading, hydrocode 16. PRICE CODE
17. SECURITY CLASSIRCATION 18. SECURlTY CLASSIRCATION 19. SECURITY CLASSIACATION 20. LIMITATION OF ABSTRACT OF REPORT OF THIS PAGE OF ABSTRACT
UNCLASSIFIED UNCLASSIFIED UNCLASSIFIED UL NSN 7540-01-280-5~00
67 Standard Form 298 (Rev. 2-89) Prescribed by ANSI Std. 23418 298-l 02

.
INTENTIONALLY LEFT BLANK.
68

USER EVALUATION SHEET/CHANGE OF ADDRESS
.
This Laboratory undertakes a continuing effort to improve the quality of the reports it publishes. Your comments/answers to the items/questions below will aid us in our efforts.
1. ARL Report Number/Author ARL-TR-1948 Kottero) Date of Report Mav 1999
2. Date Report Received
3. Does this report satisfy a need? (Comment on purpose, related project, or other area of interest for which the report will be used.)
4. Specifically, how is the report being used? (Information source, design data, procedure, source of ideas, etc.)
5. Has the information in this report led to any quantitative savings as far as man-hours or dollars saved, operating costs avoided, or efficiencies achieved, etc? If so, please elaborate.
6. General Comments. What do you think should be changed to improve future reports? (Indicate changes to organization, technical content, format, etc.)
Organization
CURRENT ADDRESS
Street or P.O. Box No.
E-mail Name
City, State, Zip Code
7. If indicating a Change of Address or Address Correction, please provide the Current or Correct address above and the Old or Incorrect address below.
OLD ADDRESS
Organization
Name .
Street or P.O. Box No.
City, State, Zip Code
(Remove this sheet, fold as indicated, tape closed, and mail.) (DO NOT STAPLE)