i isiolo county integrated smart survey, … survey reports...isiolo county integrated smart survey,...
TRANSCRIPT

i ISIOLO COUNTY INTEGRATED SMART SURVEY, JANUARY 2017
ii ISIOLO COUNTY INTEGRATED SMART SURVEY, JANUARY 2017
ACKNOWLEDGEMENT Action Against Hunger | ACF-USA (ACF) and the Ministry of Health (MOH) are indebted to all the parties for their contribution and profound support during the survey exercise. Given the size and the geographic distribution of the population of Isiolo County, the survey wouldn’t have been possible without the active participation of the actors who included and were not limited to:;
Government ministries to include; Ministry of Health (MOH) led by the County Nutrition Officer, the ministry of agriculture and National Drought Management Authority (NDMA) for taking lead in the entire exercise and their active role in data collection supervision.
World Vision, Anglican Development Services, Action AID and ILRI, for their logistical support
The survey enumerators for their effortless commitment and hard work in undertaking quality data collection.
The entire Isiolo County community (leaders and household respondents) for collaboration in making the survey exercise a success by giving consent, information required and allowing their children’s anthropometric measurements to be taken
UNICEF Kenya Country Office for financial support.
ACF Kenya mission staffs for their technical, administrative and logistical support in planning, coordination, and management of data collection throughout the survey process.
iii ISIOLO COUNTY INTEGRATED SMART SURVEY, JANUARY 2017
ABBREVIATIONS
ACF Action against Hunger BCC Behavior Change Communication BCG Bacillus Calmette–Guérin CI Confidence Interval CLTS Community Led Total Sanitation CNO County Nutrition Officer CNTF County Nutrition Technical Forum CSG County Steering Group FFA Food for Assets GAM Global Acute Malnutrition GFD General Food Distribution HFA Height-for-Age HHs Households HINI High Impact Nutrition Interventions ILRI International Livestock Research Institute IMAM Integrated Management of Acute Malnutrition IPs Implementing partners LVIA Lay Volunteers International Program MNP Micronutrient Powders MOA Ministry of Agriculture MOH Ministry of Health MOW Ministry of Water MUAC Mid Upper Arm Circumference NDMA National Drought Management Authority NIWG Nutrition Information working group ODF Open Defecation Free OPV Oral Polio Vaccine PPS Probability Proportional to Population Size SAM Severe Acute Malnutrition SFP Supplementary Feeding Program UNICEF United Nations Children’s Fund WFA Weight for Age WFH Weight-for-Height WFP World Food Program WHO World Health Organizations Vs Versus

iv ISIOLO COUNTY INTEGRATED SMART SURVEY, JANUARY 2017
EXECUTIVE SUMMARY Isiolo County is located in the pastoral North East cluster covering an estimated area of 25,000 square kilometers. The County has three major livelihood zones; pastoral all species (67%), Agro-pastoral (26%) and firewood/charcoal (7%) respectively.1 The integrated nutrition survey, implemented by MOH with support from NDMA and partners was conducted between 17th and 26th January 2017. The Standardized Monitoring and Assessment in Relief and Transitions (SMART) methodology was employed during the anthropometric survey in planning, training, data collection and analysis. Other data sets including data on nutrition, health, Water, Sanitation and Hygiene (WaSH), and food security were also collected during the survey. The survey covered the three sub counties namely Isiolo, Merti and Garbatulla.
OBJECTIVES
The overall objective of the survey was to estimate the prevalence of acute malnutrition
amongst children aged 6-59 months. The specific objectives were:
To determine the prevalence of under nutrition in children aged 6-59 months To determine the coverage for measles and Oral Polio Vaccines (OPV type 1 and 3),
Vitamin A supplementation in children aged 6-59 months and Micro-nutrient Supplementation in children aged 6-23 months
To determine maternal nutritional status based on MUAC measurements To estimate coverage of iron / folic acid supplementation during pregnancy in
women of reproductive age; To collect contextual information on the possible underlying causes of malnutrition
such as household food security, water, sanitation, and hygiene practices To build the capacity of the Ministry of Health staff and National Drought
Management Authority field monitors
METHODOLOGY
The survey was implemented in the entire Isiolo County using the Standardized Monitoring and Assessment in Relief and Transitions (SMART) methodology planning, implementation and reporting. An updated standard national SMART survey questionnaire was created on phone tablets, then data was collected using open data kit (ODK) technology and stored in Kobo Toolbox server. Emergency nutrition assessment (ENA) software version 2011 updated on July 9th 2015 was used to calculate the sample size based on various parameters producing a sample size of 504 households and 486 children. Two stages cluster sampling was used with the first stage involving selection of 36 villages/clusters using probability proportionate to size (PPS) while the second stage involved selection of 14 households using simple random sampling. Four villages in Kipsing, Gafarsa, Bisan Biliqo and Gafarsa locations (one from each location) were removed from the sampling frame due to mass migration of the population to other villages and security issues.
SUMMARY OF KEY FINDINGS During the exercise a total of 504 households and 519 children aged between 6-59 months were assessed. The overall data quality for anthropometric measurement was 4% indicating excellent. 2 children were excluded from analysis of acute malnutrition having weight for height z-scores out of range. The survey established a GAM prevalence of 18.2% (14.6-22.5 95% CI) and SAM prevalence of 3.3% (2.1- 5.3 95% CI), an increase compared to 2016 GAM prevalence of 12.3% and SAM prevalence of 1.2% with a significant difference of P=0.000 and P=0.035 GAM and SAM respectively. The current GAM rates indicate a critical
1 NDMA livelihood classification for Isiolo County

v ISIOLO COUNTY INTEGRATED SMART SURVEY, JANUARY 2017
situation. Stunting prevalence was at 17.3% (12.9-22.8 95% CI) while underweight prevalence was at 20.9% (16.4-26.3 95% CI)
. From the sample size 40.7% of the children aged 6-23 months were reported to be ill 2 weeks prior to the survey. The main illnesses were acute respiratory infections (47%), Malaria/fever (19%) and watery diarrhea (19%). Majority of the caregivers (86.7%) sought health assistance when their children were sick with public health services being the most sought (67.8%). Vitamin A supplementation relatively reduced compared to the previous year attributed early closure of ECDE centers before the Malezi bora campaigns in November 2016. Immunization of measles for the second dose at 18 months improved from 55% in 2016 to 66.8% in 2017 while the first dose remained the same.
The rate of open defecation slightly declined from 32.1% in 2016 to 29.0% in 2017. However, latrine coverage is still low at 71.0%. The food consumption score slightly declined compared to 2016 attributed to poor performance of October-December short rains. 87.3% of households were classified as having good food consumption while 3.4% were classified as having poor food consumption. The coping strategies also showed that the household were taking more coping strategies compared to 2016 with a slight increase in total weighted coping strategies index from 16.85 in 2016 to 17.4% in 2017. Table 1 highlights the summary of key results from the survey.
Table 1: Summary of Results, Isiolo County; February 2015 to January 20172 Integrated nutrition survey3
INDEX INDICATOR February 2015 (SMART)
February 2016 (SMART)
January 2017 (SMART)
WHZ4-scores Global Acute Malnutrition Weight for height <-2 z and/or oedema
13.2% (10.8-16.0)
12.3% (9.6-15.8)
18.2% (14.6-22.5)
Severe Acute Malnutrition Weight for height <-3 z and/or oedema
1.7% (1.0- 3.0)
1.2% (0.4- 3.4)
3.3% (2.1- 5.3)
HAZ5-scores Stunting (<-2 z-score)
18.1% (14.3-22.6)
21.6% (18.0-25.6)
17.3% (12.9-
22.8)
Severe stunting (<-3 z-score)
4.5% ( 2.8- 7.3)
5.0% (3.3- 7.4)
2.8% ( 1.7-
4.6
WAZ6-scores Underweight (<-2 z-score)
16.3% (13.1-20.1)
19.5% (15.2-24.7)
20.9% (16.4-
26.3)
Severe underweight (<-3 z-score)
1.7% ( 0.9- 3.2)
3.0% (1.8- 5.1)
4.5% ( 2.7-
7.4)
MUAC7 Global Acute Malnutrition MUAC <125 mm and/or oedema
3.5% (2.2- 5.4)
3.8% (2.3- 6.4)
7.7% ( 5.6-
10.6)
2Statistics for anthropometry are as per WHO 2006 Index 3Results presented in brackets are expressed with 95.0% confidence interval (CI) 4 Weight for height Z scores 5 Height for age Z scores 6 Weight for age Z scores 7Mid upper arm circumference

vi ISIOLO COUNTY INTEGRATED SMART SURVEY, JANUARY 2017
Severe Acute Malnutrition MUAC <115 mm and/or oedema
0.3% (0.1- 1.4)
0.4% (0.1- 1.6)
1.3% ( 0.6-
3.0)
Measles immunization coverage
9 Months by card 63.5% 69.0% 66.5%
18 Months by card 32% 55% 66.8%
Vitamin A coverage
6-11 months ; Once 77.1%
6-59 months; At least once 70.4%
6- 59 months; more than once 63.9%
Deworming 12-59 months; once 17.4%
12-59 months; At least once 91.5%
12-59 months; more than once 59.4%
Micronutrient powders (MNPs) for children 6-23 months
Coverage of MNP 43.2% 51.8% 13.02%
Consumption of MNPs 50.9% 66% 46.2%
Main barriers Awareness (51.8%)
Awareness (75%)
Awareness (57.6%)
Morbidity Patterns for 6-59 months
Ill in the last 2 weeks 34.7% 44.9% 40.7%
Type of illness Fever/Malaria 25% 42.9% 19.0%
ARI/Cough 58% 64.7% 47.0%
Watery Diarrhea 16.3% 25% 19.0%
Maternal Nutritional status by MUAC
Pregnant and Lactating women<210MM 7% 6.3% 7.1%
All women (15-49)years <210MM
IFAS intake Over 90 days during pregnancy 3.1% 1.3% 0.0%
WaSH Main Water sources
Piped water system 73.3% 62.7%
Distance to main source
≤500m 67.3% 73.31% 73.40%
>500m-≤2km 18.8% 17.53% 4.80%
>2k 13.9% 7.77% 22.00%
Hand Washing Behaviors
At least 3 critical times
51.7% 12.5% 47.2%
Latrine coverage Own pit latrine 35.8% 33.27% 49.0%
Food Security and Livelihood
Food Consumption Score (FCS)
Poor 2% 1.4% 3.37%
Borderline 7.8% 3.8% 9.33%
Good 90.2% 94.8% 87.3%
Coping strategy index (CSI)
Borrowing food 5.1 4.08 3.94
Restrict consumption by adults
7.59 5.55 5.64
Weighted CS Score 20.28 16.85 17.4
SUMMARY RECOMMENDATIONS Nutrition situation in Isiolo County is at critical level. A number of interrelated factors that need intervention are attributable to this increase. Therefore, based on the findings, recommendations were put forward by the county nutrition technical forum (CNTF) and county steering group (CSG) involving government ministries and development partners. The recommendations were made after reviewing the previous survey recommendations implementation status, gaps and opportunities (table 2)
Table 2: Summary of possible recommendations from survey findings
Findings Short term Recommendations Long term Recommendations Responsible
Health and Nutrition
Intensified active case finding across the identified hot spots
Strengthening of community health strategy to ensure timely screening
MOH, ACF, UNICEF, WFP

vii ISIOLO COUNTY INTEGRATED SMART SURVEY, JANUARY 2017
GAM-18.2% and SAM-3.3%
Poor VAS coverage;
Low MNP coverage (13.02%)
Poor maternal nutrition status among PLWs MUAC <21.0cm-7.1%
Low IFAS uptake;
Mass MUAC screening across the hot spots
Integrated outreaches to reach population not covered by health facilities
Health education on the importance of micronutrient supplementation (VAS, MNP, IFAS) because findings fall below the stipulated national targets
Continued awareness creation on importance of MNPs
and referral of malnourished cases at the community level (incentives, trainings).
Strong coordination of Health and Nutrition activities among the stakeholders
Improve VAS and MNP documentation and supplementation through continued Mentorship and OJT to health workers on routine Vit A and MNP supplementation at the health facility level
SBCC messages on maternal nutrition during community level activities
Food Security and Livelihood
High Coping Strategy Index (17.4)
Majority purchasing food (>90%);
Poor dietary diversity with high consumption of low nutrient dense foods
Promote mass livestock offtake to avoid mass loss of livestock and use the money to buy food for consumption at household level
Promotion of kitchen garden(hanging gardens and bucket irrigation with shade nets) re-using water and kitchen waste
Provision of GFD to community members in hot spots
Health education to community members on dietary diversification and support to mothers on preparation of quality diets through recipe modification and cooking demonstrations
Isiolo County has 67% of its population being pastoral all species. There is need for selective restocking of goats and camels for pastoralists as the breeds are browsers and hardy hence better suited to cope with the impact of drought
Fodder Production to protect the core breeding stock of the communities, fodder production along riverine and other potential areas would complement this activity and reduce the impact of the recurrent drought on the core breeding stock
Improve Own production which currently accounts for less than 1% of food sources
Strengthen linkage of Nutrition sensitive interventions-linking Agriculture to Nutrition; Agriculture and Livestock sectors. Inter-sectoral planning of activities amongst sectors i.e. Nutrition, Water and Agriculture
County Govt, MOA, MOH, ACF, UNICEF MOH MOA, MOLP, NDMA & Partners
Water, Sanitation and Hygiene o Increase in
distance to water points (trekking more than 2 km from 7.8% to 22%)
Poor water treatment (only 38.0%)
Open
Water trucking for both domestic and livestock use
Provision of fast moving spare parts and stand by generators within the boreholes to address break ups
Under take appropriate Continued health education to community members on hygiene and sanitation including water treatment and proper waste disposal at different fora; MtMSGs, Dialogues
Provision of water treatment chemicals at the household level
Establishment of new and rehabilitation of existing water sources to increase per capita water consumption and reduce distances to water sources while at the same time maintain access to safe water
Establishment and strengthening of existing water user committees to be able to handle conflicts arising at various water points.
County Govt, NDMA, Partners, MOW, MOH
viii ISIOLO COUNTY INTEGRATED SMART SURVEY, JANUARY 2017
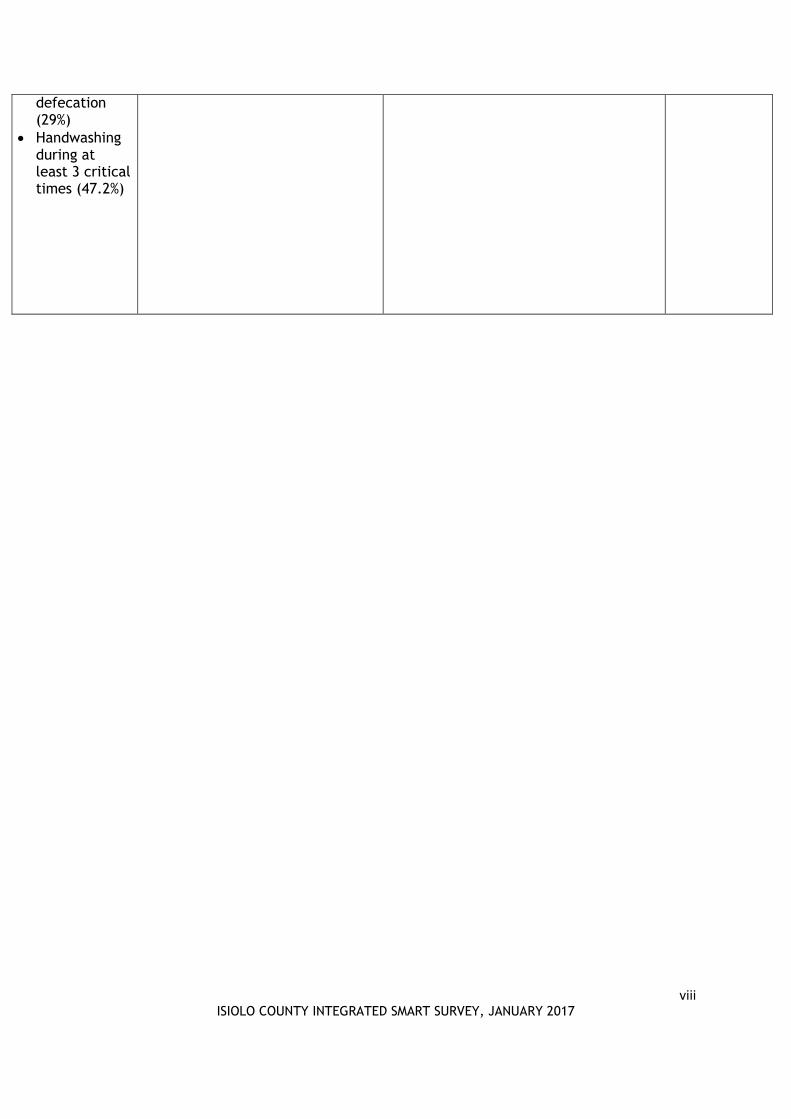
defecation (29%)
Handwashing during at least 3 critical times (47.2%)

1 ISIOLO COUNTY INTEGRATED SMART SURVEY, JANUARY 2017
1.0 INTRODUCTION
1.1 Background Information Isiolo County, located in the Pastoral North East cluster, is classified as arid and semi-arid lands of Kenya covering a surface area of 25, 336 square Kilometers (km2) with an estimated population of 181,7818. Consisting of three Sub-counties, Isiolo, Garbatulla and Merti, the county is characterized by recurrent droughts, hot and dry climate with low and erratic rainfall patterns. There are four main livelihood zones in the county namely Casual and Waged Labor, Pastoral (all Species), Pastoral Cattle and Goats, and Agro Pastoral livelihood zones comprising 32, 15, 35 and 15 percent of the population respectively as shown in Figure 19. Pastoralism, all species and cattle, goats and sheep, is the main source of livelihood in the county with little agro-pastoralism being practiced along Ewaso-Nyiro River whereas firewood selling, casual waged labor and some formal employment in big towns is the least of the livelihood zones. Isiolo has two rainfall seasons namely long (Mid-March to May) and short rain (October-
December) season. The communities depend much on the short rains than the long rains.
The seasonal calendar also characterizes dry season into short (January-Mid March) and
long (June to mid-October) dry season as seen in figure 2.
Figure 2: Isiolo County Seasonal calendar
An integrated SMART survey conducted in February 2016 unveiled a serious Global
Acute Malnutrition (GAM) prevalence of 12.3% (9.6-15.8 95% CI) and Severe Acute
Malnutrition (SAM) prevalence of 1.2% (0.4- 3.4 95% CI). The October-December Short
Rains onset in 2016 was late across the county with the Rainfall starting in the 2nd
Dekad of November. It was characterized with poor progression and distribution in all
livelihood zones. Sericho, Merti, Cherab and Oldonyiro divisions did not receive
rainfall. December 2016 Vegetation Cover Index (VCI) indicated negative trends with
poor rainfall performance across all livelihood zones. The critical situation is
aggravated by emerging intercommunity conflicts among pastoralists in Isiolo North.
8 KNBS 2009 Population Census report 9 Isiolo County Long rain Assessment report, August 2016
Figure 1: A map of Isiolo County livelihood zones

2 ISIOLO COUNTY INTEGRATED SMART SURVEY, JANUARY 2017
This has affected Food security situation in Isiolo County which has resulted to unusual
out migration of livestock, low livestock productivity and resource based conflicts in
parts of the county. Further, the indicators showed the current county drought status
as Alarm and worsening10. The January 2017 integrated nutrition SMART survey, the
fourth in the county, was conducted by MOH in close collaboration with other
stakeholders to further monitor the food security and nutrition situation.
1.2 Objectives of the Survey
The main objective of the survey was to estimate the prevalence of acute malnutrition amongst children aged (6-59) months in Isiolo County. The specific objectives were:
1. To determine the prevalence of acute and chronic malnutrition in children aged 6-59 months;
2. To determine the immunization coverage for Measles, Oral Polio Vaccines (OPV 1 and 3), and vitamin A supplementation in children aged 6-59 months;
3. To assess coverage and consumption of micronutrients powder in children aged 6-23 months
4. To establish coverage of iron / folic acid supplementation during pregnancy among pregnant and lactating women
5. To determine the nutritional status of women of reproductive age (15-49 years) 6. To collect contextual information on possible causes of malnutrition such as
household food security, water, sanitation, and hygiene (WASH) practices; Morbidity
7. To build the capacity of the county ministries, development partners in survey methodology and mobile phone based data collection techniques.
2.0 SURVEY METHODOLOGY
2.1 Type of Survey
The integrated health and nutrition survey was a cross sectional survey undertaken in Isiolo County in January, 2017 using the SMART methodology. Secondary information review of various existing surveillance data to include; NDMA monthly bulletins, Health Information System (DHIS) and previous assessments was undertaken prior to the survey. The SMART methodology was employed during the anthropometric survey in planning, training, data collection and analysis. Other information that relates to malnutrition such as immunization, deworming, supplementation, morbidity, water sanitation and hygiene practices and food security were also collected.
2.2 Sampling Procedures
A sample size of 36 clusters by 14 households was used based on various parameters as indicated in tables 3 and 4. A two stage sampling methodology was employed. In the first stage 36 clusters were sampled using probability proportional to population size (PPS). Population data was obtained from Kenya Bureau of Statistics (Census 2009) then triangulated with population data from the administrative leaders.
The second stage involved obtaining an updated and complete list of households from village elder at the cluster/village level. 14 households were then selected using simple random sampling. All the households sampled were interviewed using the household questionnaire and anthropometric measurements taken on all children aged 6-59 months.
10
Isiolo County Drought Early Warning Bulletin for December 2016

3 ISIOLO COUNTY INTEGRATED SMART SURVEY, JANUARY 2017
Four villages in Kipsing, Gafarsa, Bisan Biliqo and Gafarsa locations (one from each location) were removed from the sampling frame due to mass migration of the population to other villages and security issues.
Table 3: Sampling Methodology for Anthropometric Survey
Data entered in ENA for SMART
Anthropometric survey
Rationale
Estimated prevalence
15.8% From contextual data (DHIS, NDMA EWS) it’s showing a worsening trend
+Desired precision 3.5% The higher the malnutrition rates the lower the precision;
In order to meet the set objectives
Design effect 1.07 Obtained from nutrition SMART survey 2016 results; to cater for heterogeneity within the County
Average household size
6 From previous survey
Proportion of under-fives
18.4% From previous survey, DHIS
Non-response rate 3.0% Based on previous assessments ongoing community mobilization is expected to create awareness of upcoming assessment. In addition, there is likely low migration of populations
Households 504
Children 486
2.3 Training Framework The teams training took place in Isiolo town at Catholic Diocese of Isiolo from 17th to 26th
January 2017 with standardization test and pilot test being part of the training package.
The training package included an intense exercise of four days focusing on survey
objectives, sampling, and data collection tools (Open data Kit), anthropometric
measurements, interviewing techniques, field procedures and questionnaire
administration and data quality assurance. A total of 27 persons were trained. A
standardization test was also done on 10 children with aim of testing the participants’
precision and accuracy in taking anthropometric measurements. A pilot test of 2
households per team in nearby villages (not sampled, but similar and convenient to the
training location) was also conducted on the final day of the training. This exercise helped
the teams a lot because at the end of the pilot test, the enumerators, team leaders, and
survey supervisors were confident that each team could use the Open Data Kit (ODK),
undertake the survey accurately. In addition, they were able to estimate how long it
would take to complete a survey of each household. The experiences and arising
challenges were shared and addressed.

4 ISIOLO COUNTY INTEGRATED SMART SURVEY, JANUARY 2017
2.4 Survey Teams and Supervision The survey team was composed of 6 team leaders and 18 enumerators eventually forming 6 teams. The team leaders were obtained from relevant county government ministries. 5 NDMA field monitors and 13 community members with experience in surveys were considered for enumerators positions. The coordination and supervision of the entire process was led by the County Nutrition Coordinator under technical support from development partners’ staff. Data quality assurance process was maintained by observing the following steps:
Validation of the survey planning and methodology at the Nutrition information working group
Survey team training in adherence to SMART standards to including undertaking of both standardization and pilot test
Daily support and supervision of teams at the cluster level Daily feedback session through plausibility and questionnaire checks Continuous daily data monitoring and primary analysis of all datasets on the servers
2.5 Case Definitions and Inclusion Criteria Primary data was gathered from the sampled villages to make inferences with regard to the survey objectives for a period of 6 days. Anthropometric data was collected from all eligible children aged 6-59 months. The children were targeted with the following information Age: The child’s immunization card, birth certificate or birth notification were the
primary source for this information. In the absence of these documents, a local calendar of events developed from discussions with community members, enumerators and key informants. Age calculation chart was used for ease of identifying age in months (see Annex).
Child’s Sex: This was recorded as either ‘m’ for male or ‘f’ for female. Weight: A seca11digital weighing scale was used to measure the children’s weight. The
electronic scales were calibrated on daily basis using a standard weight to confirm measurements and any faulty scales were replaced. In order to enhance accuracy and hence quality, of emphasis was placement of weight scale to a hard flat surface, minimal or no movement of the child and accurate recording of measurements to the nearest 0.1kg
Height: Recumbent length was taken for children less than 2 years of age while those children above 2 years of age were measured standing up. A height board was used to measure length/height. Of emphasis was ideal placement of cursor as per instructions on height measurements (SMART/IMAM12 guidelines) ensuring minimal or no movement of the child and maintaining height readings at eye level to the nearest 0.1cm.
MUAC: Mid Upper Arm Circumference was measured on the left arm, at the middle point between the tip of the elbow and the tip shoulder bone while the arm is at right-angle, then followed MUAC measurements of the arm while it is relaxed and hanging by the body’s side. MUAC was measured to the nearest mm. In the event of a disability on the left arm or a left-handed child, the right arm was used. Of emphasis during the exercise was correct identification of mid-point and correct tension upon placement of MUAC tape on arm. Maternal MUAC tapes were used to measure MUAC in women of reproductive age.
Bilateral Oedema: This was assessed by the application of moderate thumb pressure for at least 3 seconds on both feet. If a depression formed on both feet upon pressure application, then presence of bilateral oedema was confirmed.
11Electronic SECA scale manufactured by Secagmbh& co.kg. Hammer Steindamm 9-25.22089 Hamburg. Germany. 12 Integrated Management of Acute Malnutrition

5 ISIOLO COUNTY INTEGRATED SMART SURVEY, JANUARY 2017
Measles vaccination: The child’s vaccination card was used as a source of verification. In circumstances where this was not available, the caregiver was probed to determine whether the child had been immunized against measles or not (done subcutaneously on the right upper arm). All children with confirmed immunization (by date) on the vaccination card, the status were recorded as “1” (Card) otherwise as “3” (Not immunized). Oral confirmation from the caregiver without proof of card was recorded as “2” (Recall). Children between 9 to 18 months or greater were used to determine coverage of this in the final analysis.
Oral Polio Vaccine (OPV) 1 (1st dose at 6 weeks) and OPV3 (3rd dose at 14 weeks) was calculated for all children aged 6-59 months.
Other relevant information about the eligible child was also gathered as follows:
De-worming: Determined by whether the child had received drugs for intestinal worms in the past one year. This was recorded as “0” for No, “1” for Yes by card, ‘’2’’ for Yes by recall and ‘’3’’ for Do not know.
Vitamin A coverage: This was determined by the number of times the eligible child had received vitamin A in the past year. The response received (number of times) was probed (to determine where health-facility/outreach sites or elsewhere and the number of times recorded in the card) and eventually recorded on the anthropometric questionnaire.
Micronutrient powders: The eligible children for this information were 6-23 months. The respondent was asked whether the child was enrolled in the program; recorded in the questionnaire as “0” for No and “1” for Yes. Those who said no were probed for reasons as to why not enrolled. Those enrolled were probed on adherence
Morbidity: This was gathered over a two week recall period by interviewing/probing the mothers/caretakers of the target child and eventually determined based on the respondent’s recall. This information was however not verified by a clinician.
Other data sets: the Household questionnaire was used to gather data on other variables related to HINI indicators, WaSH (Water Sanitation and Hygiene) and FSL (Food Security and Livelihood).
Other data sets: The household questionnaire was used to gather data on health related variables, HINI13 Indicators, water availability and accessibility, sanitation and hygiene practices, food sources, dietary diversity and coping strategies.
2.6 Data Entry and Analysis Mobile technology in data collection and submission continued to be used after its pilot and approval as the most reliable, efficient and fastest data collection tool compared to papers during the 2016 integrated SMART survey. The standard SMART questionnaire form was developed on ODK build and downloaded on ODK collect for Android operating system application software on phone tablets. The teams could send data to the configured servers where it could be retrieved and analyzed. Anthropometric data was analyzed using ENA for SMART software version 2011 (9th July 2015) while all other data sets were entered and analyzed using Microsoft Excel.
2.7 Indicators, Guidelines and Formulas Used In Acute Malnutrition
Weight for height (WFH) index This was estimated from a combination of the weight for height (WFH) index values (and/or oedema) and by sex based on WHO standards 2006. This index was expressed in WFH indices in Z-scores, according to WHO 2006 reference standards.
13
High Impact Nutrition Interventions

6 ISIOLO COUNTY INTEGRATED SMART SURVEY, JANUARY 2017
Z-Score:
• Severe acute malnutrition is defined by WFH < -3 SD and/or existing bilateral oedema, • Moderate acute malnutrition is defined by WFH < -2 SD and >-3 SD and no oedema, • Global acute malnutrition is defined by WFH < -2 SD and/or existing bilateral oedema.
Mid upper arm circumference (MUAC) MUAC analysis was also undertaken to determine the nutrition status of sampled children and women of reproductive age (15-49 years). The following MUAC criteria were applied.
Table 4: MUAC guidelines
MUAC Guideline Interpretation
Children 6-59 months
MUAC <115mm and/or bilateral Oedema Severe acute malnutrition
MUAC >=115mm and <125mm (no bilateral oedema) Moderate acute malnutrition
MUAC >=125mm and <135mm (no bilateral Oedema) Risk of malnutrition
MUAC > 135mm (no bilateral Oedema) Adequate nutritional status
Women of Reproductive Age (15-49 years)
MUAC <21-23cm At Risk of malnutrition
MUAC <21cm Moderate Acute Malnutrition
2.8 Referrals During the survey, all severe and moderately malnourished children as per MUAC and Weight-for-Height cut offs were referred to the nearby health facilities. Pregnant and lactating women with MUAC <21cm were also referred.
3.0 SURVEY FINDINGS
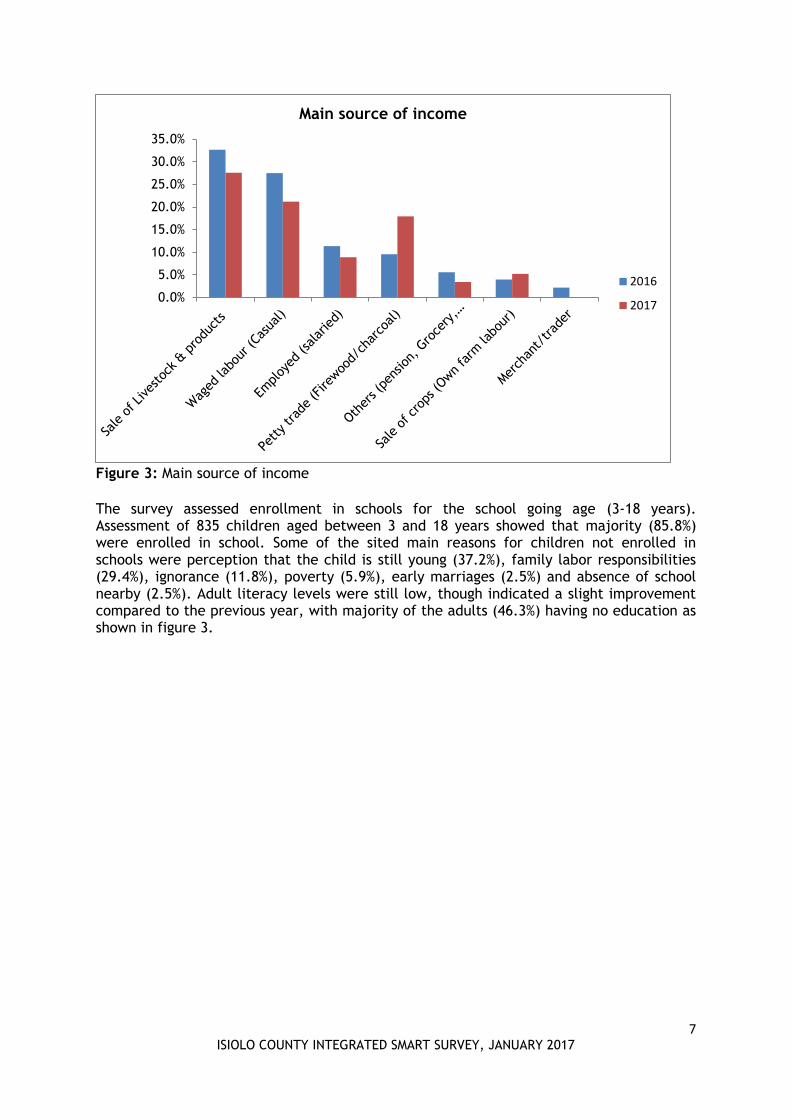
3.1 General Characteristics of Study Population and Households During the survey a total of 504 randomly selected households were assessed. The survey involved 2,119 persons with an average population of 4.2 persons per household. The average number of children below 5 years of age in a household was 1.2. Mosquito net ownership was 71.8% of all the surveyed households. Sale of livestock and livestock products, and casual labor remained the main income source although they showed a slight decrease compared to the previous year with an observed increase in petty trade as shown in figure 3. The increase in petty trade (firewood and charcoal sale) is attributed to households seeking alternate source of income as a coping mechanism.
7 ISIOLO COUNTY INTEGRATED SMART SURVEY, JANUARY 2017
Figure 3: Main source of income
The survey assessed enrollment in schools for the school going age (3-18 years). Assessment of 835 children aged between 3 and 18 years showed that majority (85.8%) were enrolled in school. Some of the sited main reasons for children not enrolled in schools were perception that the child is still young (37.2%), family labor responsibilities (29.4%), ignorance (11.8%), poverty (5.9%), early marriages (2.5%) and absence of school nearby (2.5%). Adult literacy levels were still low, though indicated a slight improvement compared to the previous year, with majority of the adults (46.3%) having no education as shown in figure 3.
0.0%
5.0%
10.0%
15.0%
20.0%
25.0%
30.0%
35.0%
Main source of income
2016
2017

8 ISIOLO COUNTY INTEGRATED SMART SURVEY, JANUARY 2017
3.2 ANTROPOMENTRY
3.2.1 Distribution by Age and Sex The survey assessed nutritional status of 519 children aged between 6-59 months. 264 boys
and 255 girls were assessed with boys to girl ratio of 1:1 as shown in table 5. The sex ratio
was 1.0 which is within the estimated range of 0.8-1.2 with a p-value of 0.693. Overall age
distribution indicated a significant difference (p=0.004) attributed to older children being
not at home during the survey; owing to migration/movement of children together with
their migrating families and some moving in with other relatives.
Table 5: Distribution of Sample Size by age and sex
Boys Girls Total Ratio
Age (months) no. % no. % no. % Boy: girl
6-17 74 57.8 54 42.2 128 24.7 1.4
18-29 66 46.2 77 53.8 143 27.6 0.9
30-41 57 49.1 59 50.9 116 22.4 1.0
42-53 48 46.6 55 53.4 103 19.8 0.9
54-59 19 65.5 10 34.5 29 5.6 1.9
Total 264 50.9 255 49.1 519 100.0 1.0
3.2.2 Nutritional Status of Children 6-59 Months
3.2.2.1 Prevalence of global acute malnutrition based on Weight-for -Height Z score The anthropometric survey involved 519 children, with 510 being included in the final
analysis of acute malnutrition based on weight for height. 9 children were excluded as
their z score were out of range. The survey established a global acute malnutrition (GAM)
prevalence of 18.2 % (14.6 - 22.5 95% CI) and a severe acute malnutrition (SAM) prevalence
of 3.3 % (2.1 - 5.3 95% CI) as shown in table 6.
0.00%
10.00%
20.00%
30.00%
40.00%
50.00%
60.00%
None Primary Secondary Tertiary Others (pre-pri.)
Pro
port
ion o
f A
dult
s
Level of Education
Highest level of education completed
2016 2017
Figure 4: Level of education among adults

9 ISIOLO COUNTY INTEGRATED SMART SURVEY, JANUARY 2017
Table 6: Prevalence of global acute malnutrition based on Weight-for -Height Z score
(and/or oedema) and by sex (at 95% Confidence Interval)
All
n = 510
Boys
n = 258
Girls
n = 252
P value
(Boys vs
Girls)
Prevalence of global
malnutrition
(<-2 z-score and/or oedema)
(93) 18.2 %
(14.6 - 22.5)
(49) 19.0 %
(13.5 - 26.1)
(44) 17.5 %
(13.4 - 22.4)
0.696
Prevalence of moderate
malnutrition
(<-2 z-score and >=-3 z-score,
no oedema)
(76) 14.9 %
(11.5 - 19.0)
(39) 15.1 %
(10.0 - 22.3)
(37) 14.7 %
(11.2 - 19.0)
0.910
Prevalence of severe
malnutrition
(<-3 z-score and/or oedema)
(17) 3.3 %
(2.1 - 5.3)
(10) 3.9 %
(2.0 - 7.4)
(7) 2.8 %
(1.3 - 5.9)
0.506
The Current GAM rates indicate a critical situation compared to previous year same
period, with a significant difference (GAM P=0.000 and SAM P=0.035). The increase was
attributed compromised household food security with households embracing more than
one coping mechanisms and poor state of dietary diversity as result of limitation to food
access and availability, increased food prices and seasonal variations (poor performances
of both long and short rain seasons)14. In addition, it was attributed to disease incidences,
inadequate case finding at household level, stock outs reported for the Supplementary
Feeding Program in all health facilities and health workers strike leading to defaulting due
to lack of follow up.
Gaussian curve (Figure 4) indicates
that the sample curve has
deviated to the left of the
reference population with a mean
and standard deviation based on
WHZ at -1.05 and ±1.05
respectively.
Figure 5: Frequency of distribution of WFH
14
Isiolo County Drought Early Warning Bulletin for December 2016

10 ISIOLO COUNTY INTEGRATED SMART SURVEY, JANUARY 2017
The overall malnutrition levels for severe and moderate malnutrition was at 3.3% and 14.9% respectively. Malnutrition levels by age groups as shown in table 7 reflects higher malnutrition rates by WHZ <-3SD in children aged 30-41 months (n=5 out of 115) and 54-59 months (n=3 out of 29) and higher malnutrition rates by WHZ <-2SD in children aged 30-41 months (n=24 out of 115) and 54-59 months (n=5 out of 29) though not significant.
Table 7: Prevalence of acute malnutrition by age, based on weight-for-height z-scores
and/or oedema
Severe
wasting
(<-3 z-score)
Moderate wasting
(>= -3 and <-2 z-
score )
Normal
(> = -2 z score)
Oedema
Age
(months)
Total
no.
No. % No. % No. % No. %
6-17 125 3 2.4 10 8.0 112 89.6 0 0.0
18-29 140 4 2.9 24 17.1 112 80.0 0 0.0
30-41 115 5 4.3 24 20.9 86 74.8 0 0.0
42-53 101 2 2.0 13 12.9 86 85.1 0 0.0
54-59 29 3 10.3 5 17.2 21 72.4 0 0.0
Total 510 17 3.3 76 14.9 417 81.8 0 0.0
3.2.2.2 Distribution of acute malnutrition and Oedema based on weight-for-height z-scores
During the assessment there was no Oedema cases identified. However, 21 children were
classified as marasmic from Olla Odha, Demo B, Tuluroba, Guyo Sekena, Sericho North,
Guba Dida, Shambani, Kura, Matundai villages (one child from each), and Kawalash,
Lowangila, Acacia, Maili Tano, Zebra and Game villages (2 children from each) as shown in
table 8.
Table 8: Distribution of acute malnutrition and oedema based on weight-for-height z-scores
<-3 z-score >=-3 z-score
Oedema present Marasmic kwashiorkor
No. 0
(0.0 %)
Kwashiorkor
No. 0
(0.0 %)
Oedema absent Marasmic
No. 21
(4.0 %)
Not severely malnourished
No. 498
(96.0 %)
3.2.2.3 Prevalence of Acute Malnutrition by MUAC
Middle upper arm circumference (MUAC) is used as a good indicator to identify malnourished children with a high risk of death in need of treatment. MUAC is used for rapid detection and referral of children with acute malnutrition15. Based on MUAC measurements, in Isiolo County the survey unveiled GAM prevalence of 7.7% (5.6-10.6, 95% C.I.) and SAM prevalence of 1.3% (0.6-3.0, 95% C.I.), with a significant difference (GAM p=0.012) from GAM prevalence of 3.8% (2.3- 6.4 95% CI) and SAM prevalence of 0.4% (0.1-
15
WHO MUAC Definition
11 ISIOLO COUNTY INTEGRATED SMART SURVEY, JANUARY 2017
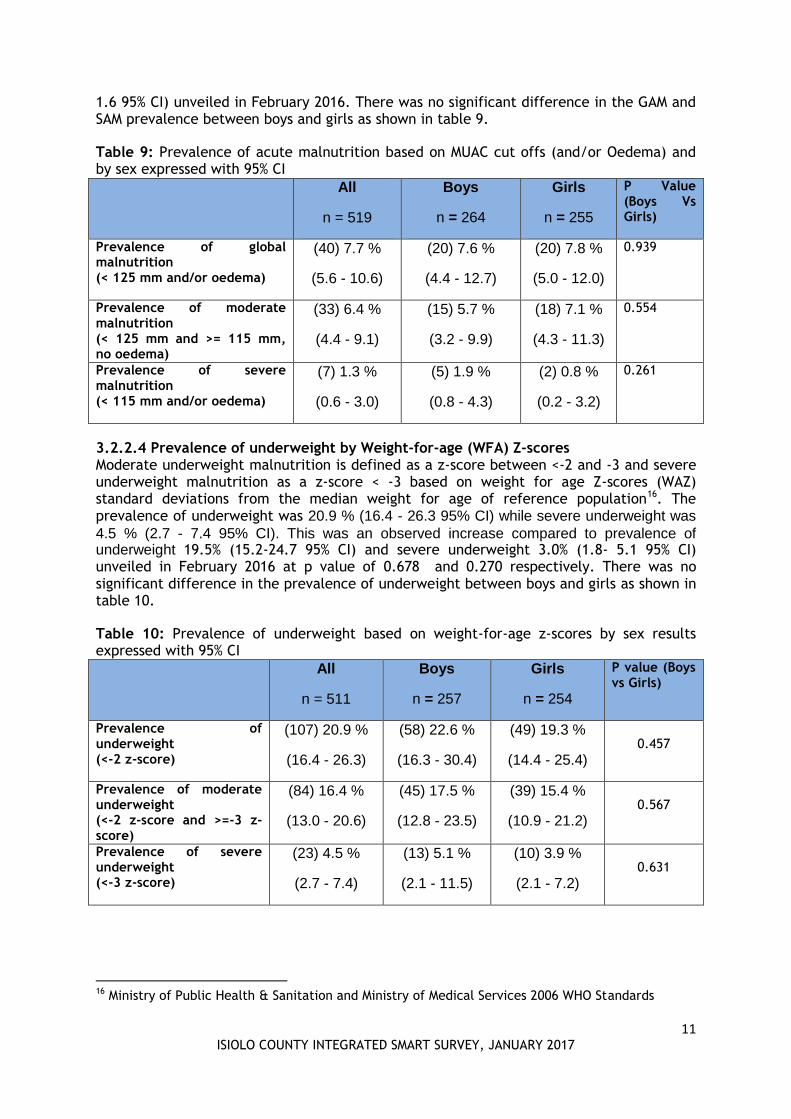
1.6 95% CI) unveiled in February 2016. There was no significant difference in the GAM and SAM prevalence between boys and girls as shown in table 9.
Table 9: Prevalence of acute malnutrition based on MUAC cut offs (and/or Oedema) and by sex expressed with 95% CI All
n = 519
Boys
n = 264
Girls
n = 255
P Value (Boys Vs Girls)
Prevalence of global malnutrition (< 125 mm and/or oedema)
(40) 7.7 %
(5.6 - 10.6)
(20) 7.6 %
(4.4 - 12.7)
(20) 7.8 %
(5.0 - 12.0)
0.939
Prevalence of moderate malnutrition (< 125 mm and >= 115 mm, no oedema)
(33) 6.4 %
(4.4 - 9.1)
(15) 5.7 %
(3.2 - 9.9)
(18) 7.1 %
(4.3 - 11.3)
0.554
Prevalence of severe malnutrition (< 115 mm and/or oedema)
(7) 1.3 %
(0.6 - 3.0)
(5) 1.9 %
(0.8 - 4.3)
(2) 0.8 %
(0.2 - 3.2)
0.261
3.2.2.4 Prevalence of underweight by Weight-for-age (WFA) Z-scores Moderate underweight malnutrition is defined as a z-score between <-2 and -3 and severe underweight malnutrition as a z-score < -3 based on weight for age Z-scores (WAZ) standard deviations from the median weight for age of reference population16. The prevalence of underweight was 20.9 % (16.4 - 26.3 95% CI) while severe underweight was
4.5 % (2.7 - 7.4 95% CI). This was an observed increase compared to prevalence of underweight 19.5% (15.2-24.7 95% CI) and severe underweight 3.0% (1.8- 5.1 95% CI) unveiled in February 2016 at p value of 0.678 and 0.270 respectively. There was no significant difference in the prevalence of underweight between boys and girls as shown in table 10.
Table 10: Prevalence of underweight based on weight-for-age z-scores by sex results expressed with 95% CI All
n = 511
Boys
n = 257
Girls
n = 254
P value (Boys vs Girls)
Prevalence of underweight (<-2 z-score)
(107) 20.9 %
(16.4 - 26.3)
(58) 22.6 %
(16.3 - 30.4)
(49) 19.3 %
(14.4 - 25.4)
0.457
Prevalence of moderate underweight (<-2 z-score and >=-3 z-score)
(84) 16.4 %
(13.0 - 20.6)
(45) 17.5 %
(12.8 - 23.5)
(39) 15.4 %
(10.9 - 21.2)
0.567
Prevalence of severe underweight (<-3 z-score)
(23) 4.5 %
(2.7 - 7.4)
(13) 5.1 %
(2.1 - 11.5)
(10) 3.9 %
(2.1 - 7.2)
0.631
16 Ministry of Public Health & Sanitation and Ministry of Medical Services 2006 WHO Standards

12 ISIOLO COUNTY INTEGRATED SMART SURVEY, JANUARY 2017
3.2.2.5 Prevalence of stunting based on height-for-age z-scores Stunting is defined as lower than average height for a child’s age. It’s an indicator used to
access chronic malnutrition by comparing child’s height to standard height of children in
the same age17. Moderate stunting is defined as a z-score between <-2 and -3 and severe
stunting malnutrition as a z-score < -3 based on height for age Z-scores (HAZ) standard
deviations from the median height for age of reference population. The survey results
indicated a stunting prevalence of 17.3% (12.9-22.8 95% CI) and severe stunting prevalence
of 2.8% (1.7-4.6 95% CI). This was an observed decline compared 2016 with stunting
prevalence of 21.6% (18.0-25.6 95% CI) and severe stunting at 5.0% (3.3- 7.4 95% CI)
though not significantly different with a p value of 0.168. There was no significant
difference in the prevalence of stunting between boys and girls as shown in table 11.
Table 11: Prevalence of stunting, height-for-age z-scores and by sex results expressed with 95% CI All
n = 496
Boys
n = 250
Girls
n = 246
P-values (Boys Vs Girls)
Prevalence of stunting (<-2 z-score)
(86) 17.3 %
(12.9 - 22.8)
(49) 19.6 %
(14.0 - 26.8)
(37) 15.0 %
(10.3 - 21.4 )
0.270
Prevalence of moderate stunting (<-2 z-score and >=-3 z-score)
(72) 14.5 %
(10.5 - 19.7)
(42) 16.8 %
(11.4 - 24.0)
(30) 12.2 %
(8.1 - 18.0)
0.245
Prevalence of severe stunting (<-3 z-score)
(14) 2.8 %
(1.7 - 4.6)
(7) 2.8 %
(1.3 - 5.7)
(7) 2.8 %
(1.4 - 5.7)
1.000
Further analysis was done on stunting per age category as shown in table 12. The analysis shows that children aged between 18 and 29 months and 30-41 months were the most stunted (severe stunting). The poor state of stunting can be attributed to deterioration of child health and nutrition status over time related to underlying causes of malnutrition including sub-optimal complementary feeding, poor hygiene practices and poor childcare practices.
Table 12: Prevalence of stunting by age based on height-for-age z-scores
Severe stunting
(<-3 z-score)
Moderate stunting
(>= -3 and <-2 z-score )
Normal
(> = -2 z score)
Age
(months)
Total
no.
No. % No. % No. %
6-17 113 1 0.9 9 8.0 103 91.2
18-29 141 6 4.3 27 19.1 108 76.6
30-41 112 4 3.6 17 15.2 91 81.3
42-53 101 3 3.0 16 15.8 82 81.2
54-59 29 0 0.0 3 10.3 26 89.7
Total 496 14 2.8 72 14.5 410 82.7
17 Ministry of Public Health & Sanitation and Ministry of Medical Services 2006 WHO Standards

13 ISIOLO COUNTY INTEGRATED SMART SURVEY, JANUARY 2017
3.2.3 Integrated Management of Acute Malnutrition (IMAM) Program Acute malnutrition reduces resistance to disease and impairs a whole range of bodily functions. Children who are malnourished are at a high risk of mortality and morbidity and therefore it is important that identification and appropriate care is timely. At the community level, Community health volunteers may identify children at risk of malnutrition whereas at the health facility level, staff can determine if sick children are at risk of malnutrition. Those identified with acute malnutrition are then admitted and treated at the health facilities or outreach sites. The process of identification through screening, triaging and diagnosis and treatment for acute malnutrition form the integrated management of acute malnutrition (IMAM) program. The basic objectives in the IMAM are to prevent malnutrition by early identification, public health interventions and nutrition education and to treat acute malnutrition to reduce morbidity and mortality. Children 6-59 months of age with moderate and severe acute malnutrition without complications are admitted in Supplementary Feeding Program and Outpatient Therapeutic Program respectively. Those diagnosed with SAM with complications are treated in-patient program in stabilization centers. In Isiolo County IMAM program is implemented in 45 health facilities including 3 health
facilities with stabilization centers for children with severe acute malnutrition with
complications. The integrated SMART survey, for the first time assessed IMAM coverage for
children 6-59 months of age found with acute malnutrition. Only 16% (15 out of 93) of
children with acute malnutrition were found to be enrolled in IMAM program (both OTP
and SFP). Low coverage attributed to inadequate case finding at household level, stock
outs (SFP) and health workers strike leading to defaulting due to inadequate follow up.
Figure 6: IMAM Program Coverage
3.3 Child Immunization, Vitamin A Supplementation and Deworming Vaccines stimulate the body’s own immune system to respond to infections or diseases.
Immunization is designed to protect infants and children early in life, when they are most
vulnerable and before they are exposed to potentially life-threatening diseases. In Kenya,
The Ministry of Health through the Division of Vaccines and Immunization aims to increase
16%
84%
Enrollment in IMAM Program
Yes
No
14 ISIOLO COUNTY INTEGRATED SMART SURVEY, JANUARY 2017
access to immunization services nationwide in order to reduce morbidity and mortality
due to vaccine preventable diseases. The ministry supports scales up of immunization
through supply management, awareness campaigns through mass media and advocacy.
BCG vaccination is done on the left hand birth to prevent against tuberculosis. Oral Polio
vaccination is done orally to prevent against poliomyelitis. Assessment of Oral Polio
vaccine 1(OPV 1) is done to inform immunization coverage while Oral polio vaccine 3 (OPV
3) is done to inform utilization.
In Isiolo County BCG coverage verified by presence of scar in the lower left arm was at
94.2% above the national target which is mostly attributed by health education and
outreach services. OPV 1 and OPV 3 coverage by card was 75.1% and 74.4%, while OPV 1
and OPV 3 coverage by recall was at 24.7% and 23.9% respectively. Measles at 9 months
was at 66.5% and 27.4% by card and recall respectively. The second measles vaccine at 18
months was at 66.8% and 29.4% by card and recall respectively. There was a notable
increase in coverage of measles at 18 months from 55% to 66.8% by card attributed by
increased health education, outreach activities, campaigns and proper documentation.
Vitamin A is a critical micronutrient for the survival and physical health of children
exposed to disease. In Kenya, up to 85 % of children are vitamin A deficient, putting them
at risk of illness and death18. Improving the vitamin A status of these children through
supplementation enhances their resistance to disease and can reduce mortality from all
causes by approximately 23%. Guaranteeing high supplementation coverage is therefore
critical, not only to eliminating vitamin A deficiency as a public-health problem, but also
as a central element of the child survival agenda19. The county vitamin A coverage was
still below the national target coverage of 80%; 6-11 months supplemented once at 77.1%
(an increase compared to 2016 coverage of 69.9%), 6-59 months supplemented at least
once at 70.4% and 6-59 months supplemented more than once at 63.9% as shown in table
13.
The nutritional impairment caused by soil-transmitted helminthes is recognized to have a
significant impact on growth and physical development. To reduce the worm burden, WHO
recommends periodic drug treatment (deworming) of all children living in endemic areas.
WHO also recommends health and hygiene education, and provision of adequate
sanitation20. Deworming in Isiolo County was assessed in children 12-59 months. The
deworming rates for children 12-59 months dewormed once decreased to 17.4% compared
to 41.7% reported in SMART 2016 while the rate of children 6-59 months deworming more
once than increased from 37.9 in % 2016 to 59.4%. This was attributed to stocks
availability, increased sensitization for routine deworming.
The low coverage of vitamin A supplementation among children 6-59 months and
deworming for children 12-59 months is attributed to poor health seeking behaviors,
inadequate follow up after completion of immunization and early closure of schools before
Malezi Bora National Campaign in November 2016.
18 the Micronutrient Initiative 19
Vitamin A Supplementation: A decade of progress © The United Nations Children’s Fund (UNICEF), 2007 20 e-Library of Evidence for Nutrition Actions (eLENA)

15 ISIOLO COUNTY INTEGRATED SMART SURVEY, JANUARY 2017
Table 13: Vitamin A Supplementation and Deworming Coverage
Age Category Coverage
Vitamin A coverage 6-11 months ; Once 77.1%
6-59 months; At least once 70.4%
6- 59 months; more than once 63.9%
Deworming 12-59 months; once 17.4%
12-59 months; At least once 91.5%
12-59 months; more than once 59.4%
3.4 Micronutrient powders (MNP) among children 6-23 months
Multiple micronutrient powders have been developed as alternative way of providing
micronutrients to populations where other interventions are difficult to implement.
Multiple micronutrient powders are single-dose packets of vitamins and minerals in powder
form that can be sprinkled onto any ready to eat semi-solid food consumed at home,
school or any other point of use. The powders are used to increase the micronutrient
content of a child's diet without changing their usual dietary habits. Multiple micronutrient
powders have been shown to reduce the risk of iron deficiency and anaemia in infants and
young children, 6-23 months of age. Home fortification with micronutrient powder (MNP)
has been shown to be a low-cost, feasible, and effective approach to address
micronutrient deficiencies.
3.4.1 Coverage of MNP program Through support from the World Food Program (WFP), The Ministry of Health (MOH)
continued implementing the micronutrient powders supplementation program through
home fortification in Isiolo County. The program had been previously implemented as a
pilot by MOH and ACF until October 2015 when it was handed over to MOH to take lead in
the implementation. At the time of handing over, the stocks had been exhausted. New
stocks were supplied to the health facilities in October 2016. The delivery point for the
MNPs has been the health facility and outreach sites. The survey assessed 192 children
aged 6-23 months where only 13.0% (n=26) were found to have been enrolled in the
program. From those not enrolled into the program (N=165), lack of awareness about the
program was cited as the greatest barrier at 57.6%. The rest cited discouragement,
distance, illness and child being enrolled in a feeding program as contributing to them not
enrolling their children to the program as shown in figure 7.

16 ISIOLO COUNTY INTEGRATED SMART SURVEY, JANUARY 2017
Figure 7: Reasons for not being enrolled in MNP program
3.5 Child morbidity
3.5.1 Incidence of disease among children 6-59 months Assessment of childhood illnesses was based on a two-week recall period prior to the
survey date. During the assessment, 40.7% children were reported to be sick 2 weeks prior
to the survey. The most common illnesses were Acute Respiratory Infections (47.0%), fever
associated to malaria (19.0%) and watery diarrhea (19.0%) The other illnesses reported
were bloody diarrhea (1.0%) and other illnesses at 28.0%. The seasonal calendar for Isiolo
County shows that from the month of October through December there is a general trend
of increased child illnesses namely; malaria and diarrhea attributed to water borne
illnesses as result of water contamination coupled with increased reservoirs for inhabiting
vectors namely, mosquito causing malaria etc. However, there was an observed decrease
in both malaria and watery diarrhea compared to 2016 attributed to the short fall of
October-December 2016 short rains as shown in figure 8.
75.0%
2.1% 6.3% 5.2% 3.1%
8.3%
57.6%
6.1% 12.1%
2.4% 1.8%
18.2%
0.0%
10.0%
20.0%
30.0%
40.0%
50.0%
60.0%
70.0%
80.0%
Don't Knowon MNPs
Discouragedby Others
Child fell ill Far distanceto the
H/Facility
Child is inIMAM Prog
Others
Pro
port
ion o
f C
hildre
n
Reason for not have been enrolled in MNP program
2016 2017

17 ISIOLO COUNTY INTEGRATED SMART SURVEY, JANUARY 2017
Figure 8 : Child Morbidity
3.5.2 Health Seeking Behavior The survey further assessed the health seeking behavior of the caregivers when the
children were sick. The analysis showed that majority of the caregivers (67.8%) took their
children to public clinics while 22.8% of the caregivers took their children to private
clinics. Other areas where the caregivers sought assistance were shops (2.2%) and
community health workers (5.0%), while 2.2% of the sick children were either treated with
herbs at home or visited traditional healers. A significant number of caregivers however
did not seek any form of assistance during illness (13.3%).
3.5.3 Therapeutic Zinc supplementation in treatment of watery Diarrhea Studies have shown that zinc supplementation reduces the duration and severity of
diarrheal episodes and likelihood of subsequent infections for 2–3 months21. In Isiolo
County 90% of the children with watery diarrhea were supplemented with zinc. The
proportion is above the national targets of 80% due to adequate stock availability owing to
contingency planning in anticipation for increased incidences during the short rains.
3.6 Maternal Health and Nutrition Maternal nutrition was assessed for all women of reproductive age (15-49 years) based on
MUAC. A total of 488 women were within the reproductive age, with 7.5% being pregnant,
44.5% lactating and 48.0% being neither pregnant nor lactating.
3.6.1 Iron folate supplementation during pregnancy
Iron folic acid supplementation (IFAS) during pregnancy helps in preventing maternal
anemia and improving the overall birth outcomes. Based on the current pregnancy (for
21
Bhutta ZA et al. Therapeutic effects of oral zinc in acute and persistent diarrhea in children in developing countries: pooled analysis of randomized controlled trials. American Journal of Clinical Nutrition, 2000, 72(6):1516–22.
48.60%
25%
58%
16.30%
0.50% 2%
43%
64%
25%
0% 5%
19%
47%
19%
1%
28%
0.0%
10.0%
20.0%
30.0%
40.0%
50.0%
60.0%
70.0%
Fever withchills likeMalaria
ARI/Cough Waterydiarrhoea
Bloodydiarrhoea
Others
Pro
po
rtio
n o
f U
5 w
ith
rep
ort
ed
sic
knes
s
Morbidity Patterns in Isiolo County
2014 2015 2016 2017

18 ISIOLO COUNTY INTEGRATED SMART SURVEY, JANUARY 2017
women with children less than 2 years) the survey assessed consumption of iron folic acid
supplements during pregnancy. 97.0% of women aged 15-49 years (N=224) consumed IFAS
in their last pregnancy. However, none of them took the supplements for over 90 days.
There was an increase in the proportion that took between 31 and 90 days attributed to
health education, individual counselling to ANC mothers on the importance of IFAS and
stocks availability as shown in figure 9.
Figure 9 : Consumption period of iron folic acid supplementation
3.6.2 Maternal nutrition status based on Mid Upper Arm Circumference (MUAC)
All girls and women aged between 15-49 years were assessed for their nutrition status
based on MUAC. Malnutrition among pregnant and lactating women slightly increased from
6.3% in February 2016 to 7.1% in January 2017, while PLWs at risk of malnutrition
remained the same compared to February 2016. Increased women workload due to water
and pasture shortage and food shortage due to prevailing drought were the attributed
reason for high maternal malnutrition as shown in figure 10.
Figure 10: Malnutrition by MUAC for Pregnant and Lactating Women
7.0%
13.5%
6.3%
14.7%
7.1%
14.2%
0.0%
5.0%
10.0%
15.0%
20.0%
(PLW) Malnourished (<21cm) (PLW) At risk (>21cm-<23cm
Maternal Nutritional Status
2015 2016 2017
57.9%
23.9%
17.0%
1.3%
44.6%
37.1%
18.3%
0.0%
0.0% 10.0% 20.0% 30.0% 40.0% 50.0% 60.0% 70.0%
1--30
31-60
61-90
Over 90
Proportion of Women
No.
of
Days
Consumption period of IFAS for Pregnant women (n=224)
2017
2016
19 ISIOLO COUNTY INTEGRATED SMART SURVEY, JANUARY 2017
3.7 Water Sanitation and Hygiene (WaSH)
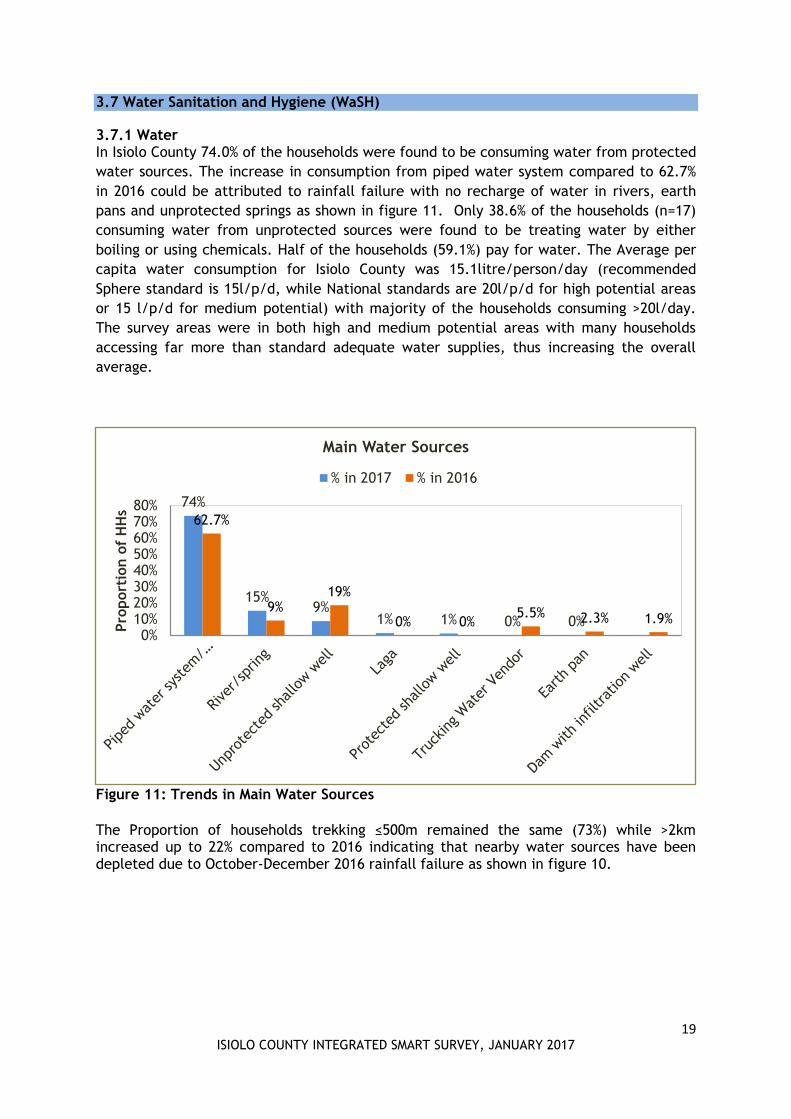
3.7.1 Water In Isiolo County 74.0% of the households were found to be consuming water from protected
water sources. The increase in consumption from piped water system compared to 62.7%
in 2016 could be attributed to rainfall failure with no recharge of water in rivers, earth
pans and unprotected springs as shown in figure 11. Only 38.6% of the households (n=17)
consuming water from unprotected sources were found to be treating water by either
boiling or using chemicals. Half of the households (59.1%) pay for water. The Average per
capita water consumption for Isiolo County was 15.1litre/person/day (recommended
Sphere standard is 15l/p/d, while National standards are 20l/p/d for high potential areas
or 15 l/p/d for medium potential) with majority of the households consuming >20l/day.
The survey areas were in both high and medium potential areas with many households
accessing far more than standard adequate water supplies, thus increasing the overall
average.
Figure 11: Trends in Main Water Sources
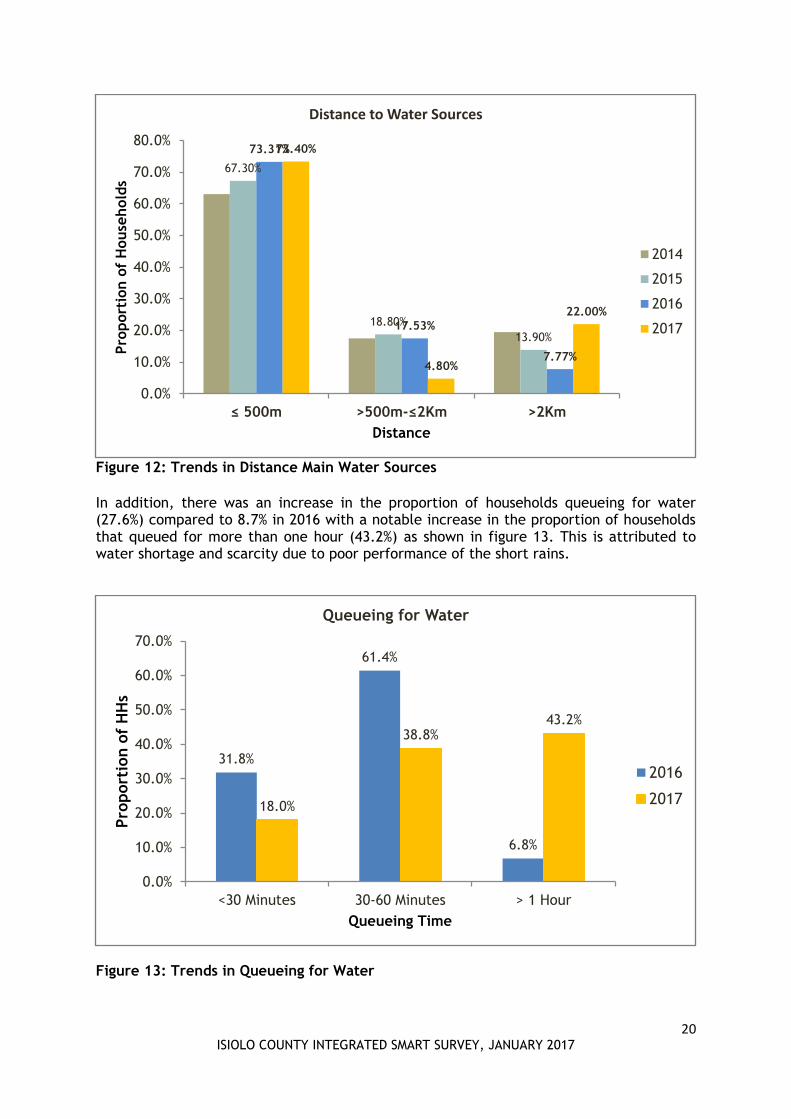
The Proportion of households trekking ≤500m remained the same (73%) while >2km increased up to 22% compared to 2016 indicating that nearby water sources have been depleted due to October-December 2016 rainfall failure as shown in figure 10.
74%
15% 9%
1% 1% 0% 0%
62.7%
9% 19%
0% 0% 5.5% 2.3% 1.9%
0%10%20%30%40%50%60%70%80%
Pro
port
ion o
f H
Hs
Main Water Sources
% in 2017 % in 2016
20 ISIOLO COUNTY INTEGRATED SMART SURVEY, JANUARY 2017
Figure 12: Trends in Distance Main Water Sources
In addition, there was an increase in the proportion of households queueing for water (27.6%) compared to 8.7% in 2016 with a notable increase in the proportion of households that queued for more than one hour (43.2%) as shown in figure 13. This is attributed to water shortage and scarcity due to poor performance of the short rains.
Figure 13: Trends in Queueing for Water
67.30%
18.80%
13.90%
73.31%
17.53%
7.77%
73.40%
4.80%
22.00%
0.0%
10.0%
20.0%
30.0%
40.0%
50.0%
60.0%
70.0%
80.0%
≤ 500m >500m-≤2Km >2Km
Pro
port
ion o
f H
ouse
hold
s
Distance
Distance to Water Sources
2014
2015
2016
2017
31.8%
61.4%
6.8%
18.0%
38.8% 43.2%
0.0%
10.0%
20.0%
30.0%
40.0%
50.0%
60.0%
70.0%
<30 Minutes 30-60 Minutes > 1 Hour
Pro
port
ion o
f H
Hs
Queueing Time
Queueing for Water
2016
2017

21 ISIOLO COUNTY INTEGRATED SMART SURVEY, JANUARY 2017
3.7.3 Hygiene Practices Proper storage of water using closed containers was embraced by only 69.9% of
households. In prevention of the spread of diarrheal diseases, appropriate hand washing at
critical times is very vital. 75.0% of caregivers reported washing hands after toilet, 52.0%
before cooking, 72.0% before eating and 18.7% after taking children to toilet. Generally,
only 47.2% washed their hands at least during three critical times as shown in figure 14.
The reduction in handwashing after visiting the toilet and before eating compared to
February 2016 was attributed to a possibility of little emphasis on the all the critical times
of handwashing and water shortage. Effective hand washing entails the use of clean water
and soap. When asked what they use for handwashing, 65.1 % of the households were
found to use soap and water while 34% used water only.
Figure 14: Trends in Critical Hand washing Times
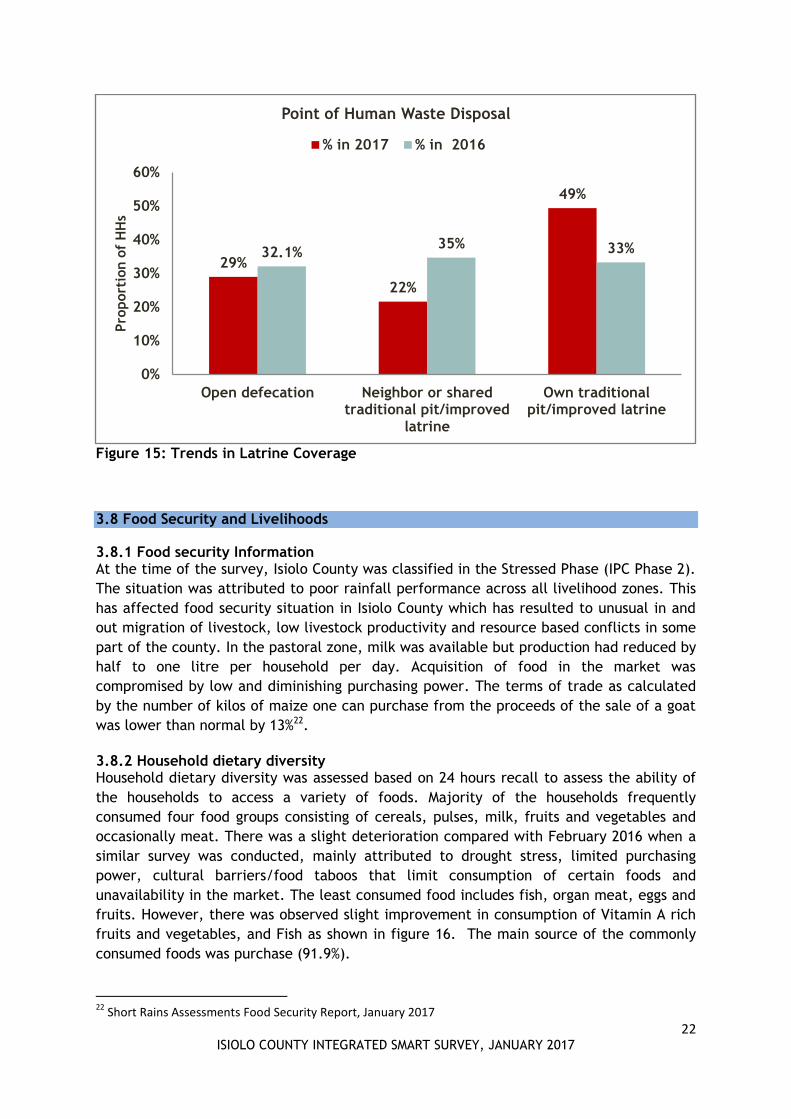
3.7.3 Sanitation Practices Latrine coverage improved in 2017, compared to 2016. Majority of the HHs (49%) had own latrines while there was observed reduction in Open defecation (29%) as shown in figure 15. The decline could be attributed to continued public health promotion by the department of public health in collaboration with a number of partners supporting water, sanitation and hygiene promotion in the county such as CCM, Caritas Isiolo and World Vision Kenya.
75%
52%
72%
1%
81.50%
44.60%
79.30%
6.00%
0%
10%
20%
30%
40%
50%
60%
70%
80%
90%
After toilet Before FoodPreparation
Before eating Others (beforemilking, beforeprayers, after
mudding the house)
Pro
port
ion o
f H
Hs
Handwashing during Critical Times
2017 2016
22 ISIOLO COUNTY INTEGRATED SMART SURVEY, JANUARY 2017
Figure 15: Trends in Latrine Coverage
3.8 Food Security and Livelihoods
3.8.1 Food security Information At the time of the survey, Isiolo County was classified in the Stressed Phase (IPC Phase 2).
The situation was attributed to poor rainfall performance across all livelihood zones. This
has affected food security situation in Isiolo County which has resulted to unusual in and
out migration of livestock, low livestock productivity and resource based conflicts in some
part of the county. In the pastoral zone, milk was available but production had reduced by
half to one litre per household per day. Acquisition of food in the market was
compromised by low and diminishing purchasing power. The terms of trade as calculated
by the number of kilos of maize one can purchase from the proceeds of the sale of a goat
was lower than normal by 13%22.
3.8.2 Household dietary diversity Household dietary diversity was assessed based on 24 hours recall to assess the ability of
the households to access a variety of foods. Majority of the households frequently
consumed four food groups consisting of cereals, pulses, milk, fruits and vegetables and
occasionally meat. There was a slight deterioration compared with February 2016 when a
similar survey was conducted, mainly attributed to drought stress, limited purchasing
power, cultural barriers/food taboos that limit consumption of certain foods and
unavailability in the market. The least consumed food includes fish, organ meat, eggs and
fruits. However, there was observed slight improvement in consumption of Vitamin A rich
fruits and vegetables, and Fish as shown in figure 16. The main source of the commonly
consumed foods was purchase (91.9%).
22
Short Rains Assessments Food Security Report, January 2017
29%
22%
49%
32.1% 35% 33%
0%
10%
20%
30%
40%
50%
60%
Open defecation Neighbor or sharedtraditional pit/improved
latrine
Own traditionalpit/improved latrine
Pro
port
ion o
f H
Hs
Point of Human Waste Disposal
% in 2017 % in 2016

23 ISIOLO COUNTY INTEGRATED SMART SURVEY, JANUARY 2017
Figure 16: Trends in Household dietary diversity based on 24 hours recall
Majority of the households did not meet the acceptable dietary diversity of six food groups
and above based on 24 hours recall. Majority of the households (41.3%) were in medium
dietary diversity tercile as shown in table 14. The generalized poor dietary diversity was
highly attributed to increased food prices23, inaccessibility of variety and the poor
performance of the short rains.
Table 14: Food groups consumed by >50% of households by dietary diversity tercile (24
hour recall)
Lowest dietary diversity (=< 3 food groups) 39.1% (n=197)
Medium dietary diversity (4 and 5 food groups) 41.3% (n=208)
High dietary diversity (=> 6 food groups) 19.3% (n=97)
Cereals Cereals Cereals
Oils/fats Milk Green leafy vegetables
Sweets Fats/oils Other vegetables
Sweets Pulses
Milk
Oils/fats
Sweets
3.8.3 Mean Dietary Diversity-Women
23 Isiolo NDMA Monthly Bulletins-January 2017
0.0%
10.0%
20.0%
30.0%
40.0%
50.0%
60.0%
70.0%
80.0%
90.0%
100.0%
% o
f H
ouse
hold
s
HDDS based on 24 hour recall
2016 2017
24 ISIOLO COUNTY INTEGRATED SMART SURVEY, JANUARY 2017
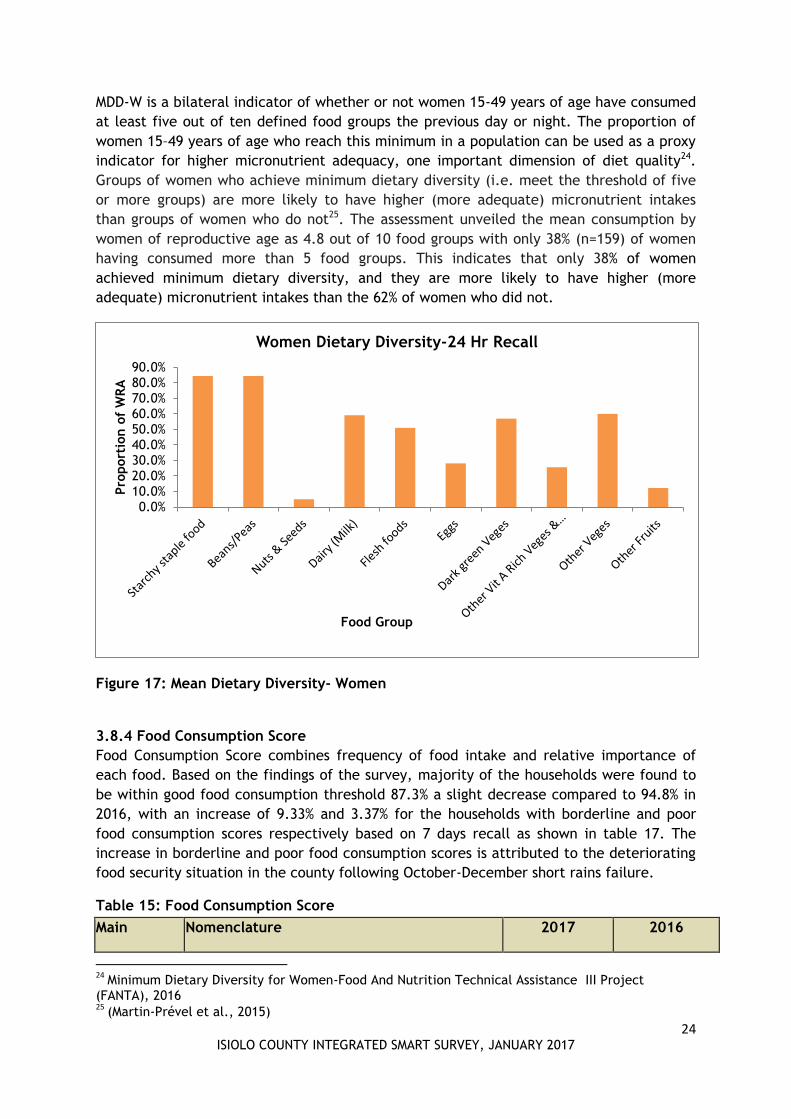
MDD-W is a bilateral indicator of whether or not women 15-49 years of age have consumed
at least five out of ten defined food groups the previous day or night. The proportion of
women 15–49 years of age who reach this minimum in a population can be used as a proxy
indicator for higher micronutrient adequacy, one important dimension of diet quality24.
Groups of women who achieve minimum dietary diversity (i.e. meet the threshold of five
or more groups) are more likely to have higher (more adequate) micronutrient intakes
than groups of women who do not25. The assessment unveiled the mean consumption by
women of reproductive age as 4.8 out of 10 food groups with only 38% (n=159) of women
having consumed more than 5 food groups. This indicates that only 38% of women
achieved minimum dietary diversity, and they are more likely to have higher (more
adequate) micronutrient intakes than the 62% of women who did not.
Figure 17: Mean Dietary Diversity- Women
3.8.4 Food Consumption Score
Food Consumption Score combines frequency of food intake and relative importance of
each food. Based on the findings of the survey, majority of the households were found to
be within good food consumption threshold 87.3% a slight decrease compared to 94.8% in
2016, with an increase of 9.33% and 3.37% for the households with borderline and poor
food consumption scores respectively based on 7 days recall as shown in table 17. The
increase in borderline and poor food consumption scores is attributed to the deteriorating
food security situation in the county following October-December short rains failure.
Table 15: Food Consumption Score
Main Nomenclature 2017 2016
24
Minimum Dietary Diversity for Women-Food And Nutrition Technical Assistance III Project (FANTA), 2016 25
(Martin-Prével et al., 2015)
0.0%10.0%20.0%30.0%40.0%50.0%60.0%70.0%80.0%90.0%
Pro
port
ion o
f W
RA
Food Group
Women Dietary Diversity-24 Hr Recall
25 ISIOLO COUNTY INTEGRATED SMART SURVEY, JANUARY 2017
Threshold Findings Findings
0-21 Poor food consumption…mainly cereal 3.37% 1.4%
21.5-35 Borderline food consumption Cereal, protein or milk (3-4/week), oil, sugar
9.33% 3.8%
>35.5 Good food consumption Cereal, protein and milk (>5/week), or fruit or vegetable, oil, sugar
87.3% 94.8%
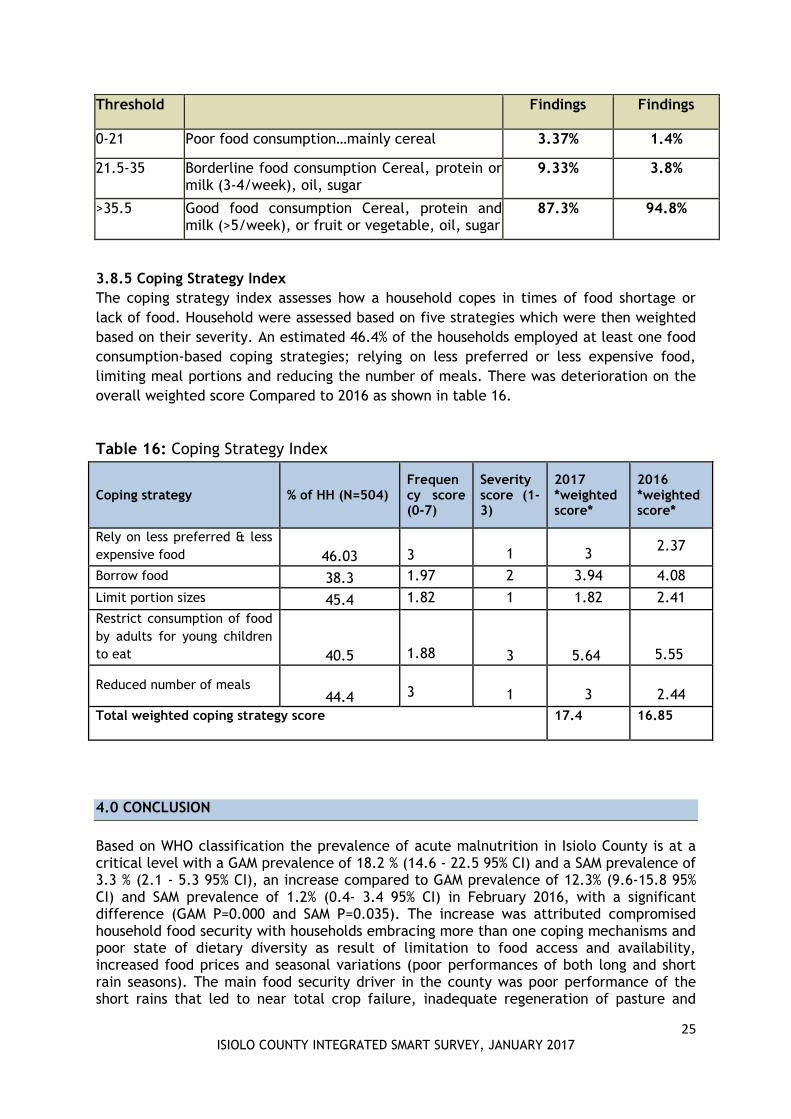
3.8.5 Coping Strategy Index
The coping strategy index assesses how a household copes in times of food shortage or
lack of food. Household were assessed based on five strategies which were then weighted
based on their severity. An estimated 46.4% of the households employed at least one food
consumption-based coping strategies; relying on less preferred or less expensive food,
limiting meal portions and reducing the number of meals. There was deterioration on the
overall weighted score Compared to 2016 as shown in table 16.
Table 16: Coping Strategy Index
Coping strategy % of HH (N=504) Frequency score (0-7)
Severity score (1-3)
2017 *weighted score*
2016 *weighted score*
Rely on less preferred & less
expensive food 46.03
3 1 3
2.37
Borrow food 38.3 1.97 2 3.94 4.08
Limit portion sizes 45.4 1.82 1 1.82 2.41
Restrict consumption of food
by adults for young children
to eat 40.5
1.88 3 5.64
5.55
Reduced number of meals 44.4
3 1 3
2.44
Total weighted coping strategy score 17.4 16.85
4.0 CONCLUSION
Based on WHO classification the prevalence of acute malnutrition in Isiolo County is at a critical level with a GAM prevalence of 18.2 % (14.6 - 22.5 95% CI) and a SAM prevalence of 3.3 % (2.1 - 5.3 95% CI), an increase compared to GAM prevalence of 12.3% (9.6-15.8 95% CI) and SAM prevalence of 1.2% (0.4- 3.4 95% CI) in February 2016, with a significant difference (GAM P=0.000 and SAM P=0.035). The increase was attributed compromised household food security with households embracing more than one coping mechanisms and poor state of dietary diversity as result of limitation to food access and availability, increased food prices and seasonal variations (poor performances of both long and short rain seasons). The main food security driver in the county was poor performance of the short rains that led to near total crop failure, inadequate regeneration of pasture and

26 ISIOLO COUNTY INTEGRATED SMART SURVEY, JANUARY 2017
browse and below–normal recharge of water facilities. In addition, earlier–than–normal and high numbers of migrating livestock to the reserve grazing areas had increased competition for rangeland resources leading to conflicts and occasioning disruption of access to forage and water26. In addition, the high malnutrition levels were attributed to disease incidences, inadequate case finding at household level, stock outs reported for the Supplementary Feeding Program in all health facilities and health workers strike leading to defaulting due to lack of follow up.
26
Isiolo County Short Rains Assessments Report, Jan 2017
27 ISIOLO COUNTY INTEGRATED SMART SURVEY, JANUARY 2017
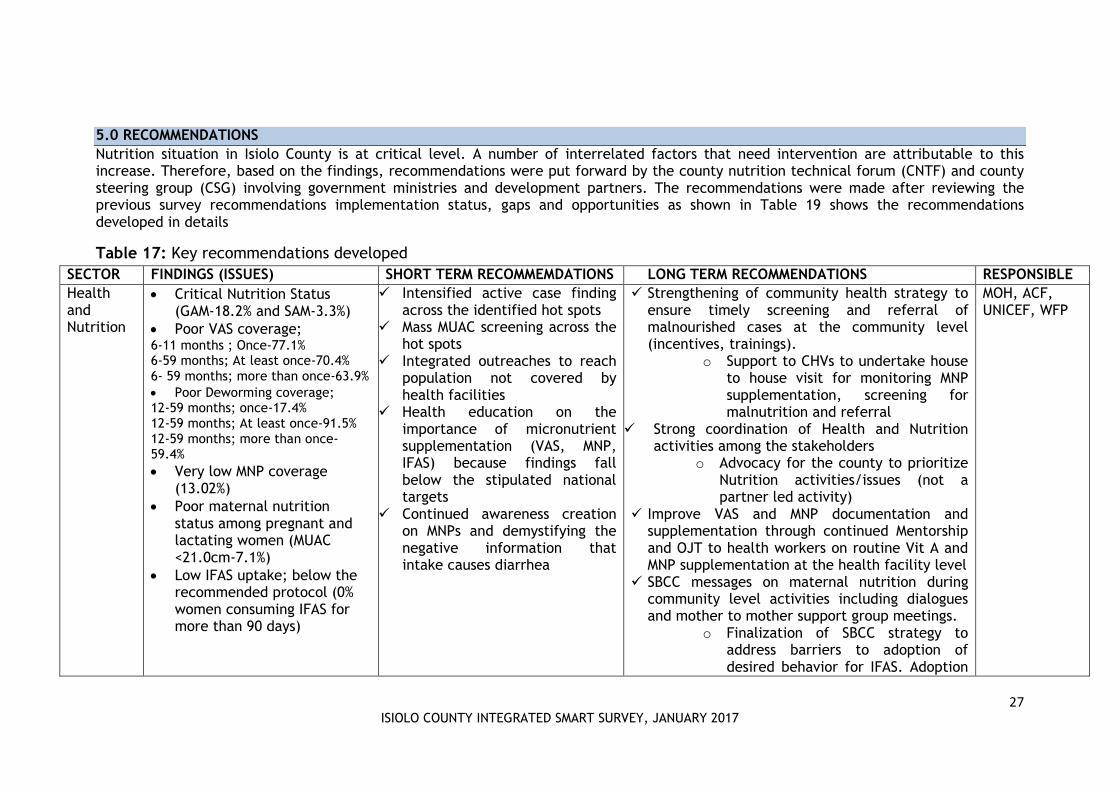
5.0 RECOMMENDATIONS
Nutrition situation in Isiolo County is at critical level. A number of interrelated factors that need intervention are attributable to this increase. Therefore, based on the findings, recommendations were put forward by the county nutrition technical forum (CNTF) and county steering group (CSG) involving government ministries and development partners. The recommendations were made after reviewing the previous survey recommendations implementation status, gaps and opportunities as shown in Table 19 shows the recommendations developed in details
Table 17: Key recommendations developed
SECTOR FINDINGS (ISSUES) SHORT TERM RECOMMEMDATIONS LONG TERM RECOMMENDATIONS RESPONSIBLE
Health and Nutrition
Critical Nutrition Status (GAM-18.2% and SAM-3.3%)
Poor VAS coverage; 6-11 months ; Once-77.1% 6-59 months; At least once-70.4% 6- 59 months; more than once-63.9%
Poor Deworming coverage; 12-59 months; once-17.4% 12-59 months; At least once-91.5% 12-59 months; more than once-59.4%
Very low MNP coverage (13.02%)
Poor maternal nutrition status among pregnant and lactating women (MUAC <21.0cm-7.1%)
Low IFAS uptake; below the recommended protocol (0% women consuming IFAS for more than 90 days)
Intensified active case finding across the identified hot spots
Mass MUAC screening across the hot spots
Integrated outreaches to reach population not covered by health facilities
Health education on the importance of micronutrient supplementation (VAS, MNP, IFAS) because findings fall below the stipulated national targets
Continued awareness creation on MNPs and demystifying the negative information that intake causes diarrhea
Strengthening of community health strategy to ensure timely screening and referral of malnourished cases at the community level (incentives, trainings).
o Support to CHVs to undertake house to house visit for monitoring MNP supplementation, screening for malnutrition and referral
Strong coordination of Health and Nutrition activities among the stakeholders
o Advocacy for the county to prioritize Nutrition activities/issues (not a partner led activity)
Improve VAS and MNP documentation and supplementation through continued Mentorship and OJT to health workers on routine Vit A and MNP supplementation at the health facility level
SBCC messages on maternal nutrition during community level activities including dialogues and mother to mother support group meetings.
o Finalization of SBCC strategy to address barriers to adoption of desired behavior for IFAS. Adoption
MOH, ACF, UNICEF, WFP

28 ISIOLO COUNTY INTEGRATED SMART SURVEY, JANUARY 2017
of the Social Behavior Change Communication (C4D) Strategy to promote behavior change on IFAS uptake by pregnant women
Food Security and Livelihood
High Coping Strategy Index (17.4)
Majority of the households purchasing food (>90%); low or lack of household food production (<1.0%)
Poor dietary diversity with high consumption of low nutrient dense foods (high Consumption of Oils, Sweets, Cereals and tubers)
Promote mass livestock offtake to avoid mass loss of livestock and use the money to buy food for consumption at household level
Promotion of kitchen garden(hanging gardens and bucket irrigation with shade nets) re-using water and kitchen waste
Provision of GFD to community members in hot spots
Health education to community members on dietary diversification and support to mothers on preparation of quality diets through recipe modification and cooking demonstrations
Isiolo County has 67% of its population being pastoral all species. There is need for selective restocking of goats and camels for pastoralists as the breeds are browsers and hardy hence better suited to cope with the impact of drought
Fodder Production to protect the core breeding stock of the communities, fodder production along riverine and other potential areas would complement this activity and reduce the impact of the recurrent drought on the core breeding stock
Improve Own production which currently accounts for less than 1% of food sources
Support community to produce foods through provision of seed subsidy and extension services in areas around Ewaso Nyiro with potential for farming
Promote kitchen garden at household level to provide nutrient (including bucket drip irrigation)
Improve food security and reduce poverty through promotion of utilization of indigenous food (sorghum), provision of farmers with certified seeds, promote planting drought tolerant crops, train on food processing and Preservation e.g. nyir nyir through drying of vegetables
Mainstreaming gender in the activities to empower the most vulnerable. Address issues around ownership and control of
County Govt, MOA, MOH, ACF, UNICEF MOH MOA, MOLP, NDMA & Partners

29 ISIOLO COUNTY INTEGRATED SMART SURVEY, JANUARY 2017
household resources Promoting IGAS; gives the woman power and control
Strengthen linkage of Nutrition sensitive interventions-linking Agriculture to Nutrition; Agriculture and Livestock sectors. Inter-sectoral planning of activities amongst sectors i.e. Nutrition, Water and Agriculture
Water, Sanitation and Hygiene
Acute water shortage in some areas; o Increase in utilization of
open water shallow well (Cherab, Modogashe).
o Observed Sharing of the same water point with livestock
o Observed incomplete water project and shallow wells breakdown in Kinna location
o Increase in distance to water points (trekking more than 2 km from 7.8% to 22%)
Poor water treatment (only 38.0%)
Open defecation (29%)
Handwashing during at least 3 critical times (47.2%)
Water trucking for both domestic and livestock use
Provision of fast moving spare parts and stand by generators within the boreholes to address break ups
Under take appropriate Continued health education to community members on hygiene and sanitation including water treatment and proper waste disposal at different fora; MtMSGs, Dialogues
Provision of water treatment
chemicals at the household level. Identify and Issue the most preferred chemicals to ensure utilization
Undertake an appropriate
health and hygiene promotion activities based on the proportion of households practicing handwashing during at least 3 critical times and open defecation
Establishment of new and rehabilitation of existing water sources to increase per capita water consumption and reduce distances to water sources while at the same time maintain access to safe water
o Support to rain water harvesting in schools and health facilities
o Construction of water troughs within the water pans to separate sharing of water for domestic and livestock
o Construction of additional water pans and de-silting of shallow pans
Establishment and strengthening of existing water user committees to be able to handle conflicts arising at various water points.
o At a higher level, there is need to capacity build the water user committees to mobilize resources such as funds in future to improve water access and hygiene challenges
o Advocacy to the water departments on issues around billing policies hindering kitchen gardening and WaSH practices
County Govt, NDMA, Partners, MOW, MOH
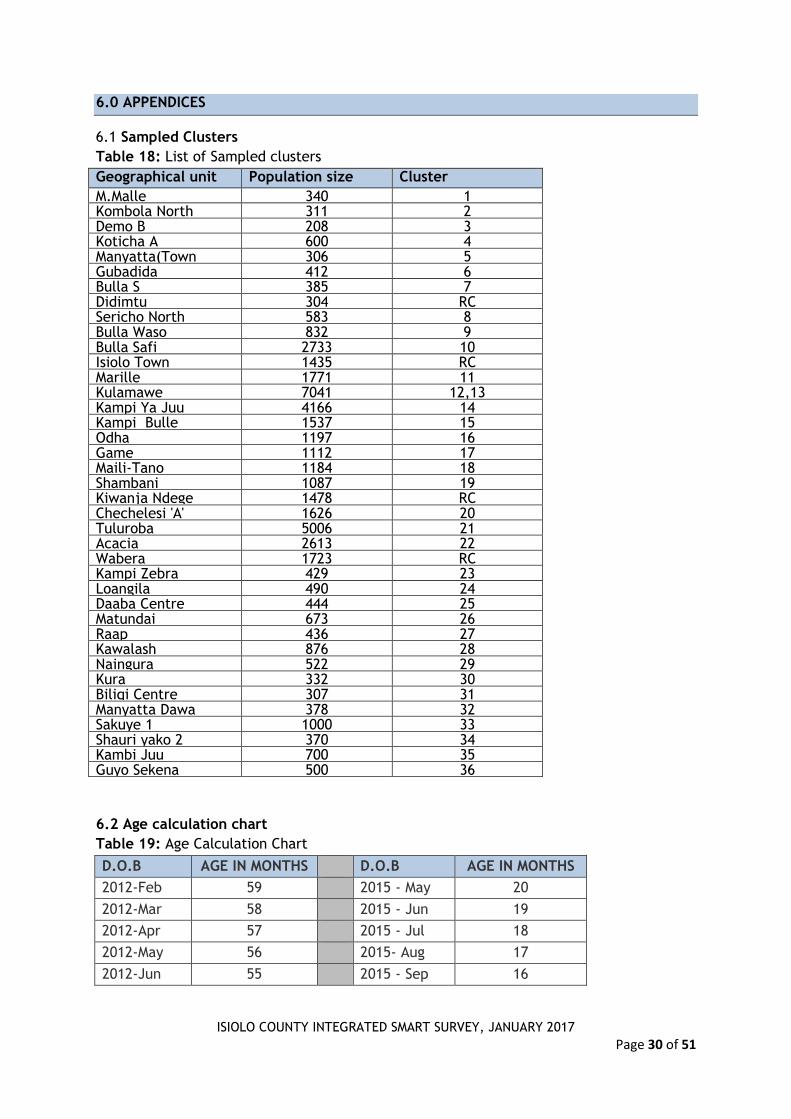
ISIOLO COUNTY INTEGRATED SMART SURVEY, JANUARY 2017
Page 30 of 51
6.0 APPENDICES
6.1 Sampled Clusters
Table 18: List of Sampled clusters
Geographical unit
Population size Cluster
M.Malle 340 1 Kombola North 311 2 Demo B 208 3 Koticha A 600 4 Manyatta(Town
Centre)
306 5 Gubadida 412 6 Bulla S 385 7 Didimtu 304 RC Sericho North 583 8 Bulla Waso 832 9 Bulla Safi 2733 10 Isiolo Town 1435 RC Marille 1771 11 Kulamawe 7041 12,13 Kampi Ya Juu 4166 14 Kampi Bulle 1537 15 Odha 1197 16 Game 1112 17 Maili-Tano 1184 18 Shambani 1087 19 Kiwanja Ndege 1478 RC Chechelesi 'A' 1626 20 Tuluroba 5006 21 Acacia 2613 22 Wabera 1723 RC Kampi Zebra 429 23 Loangila 490 24 Daaba Centre 444 25 Matundai 673 26 Raap 436 27 Kawalash 876 28 Naingura 522 29 Kura 332 30 Biliqi Centre 307 31 Manyatta Dawa 378 32 Sakuye 1 1000 33 Shauri yako 2 370 34 Kambi Juu 700 35 Guyo Sekena 500 36
6.2 Age calculation chart
Table 19: Age Calculation Chart
D.O.B AGE IN MONTHS D.O.B AGE IN MONTHS
2012-Feb 59 2015 - May 20
2012-Mar 58 2015 - Jun 19
2012-Apr 57 2015 - Jul 18
2012-May 56 2015- Aug 17
2012-Jun 55 2015 - Sep 16
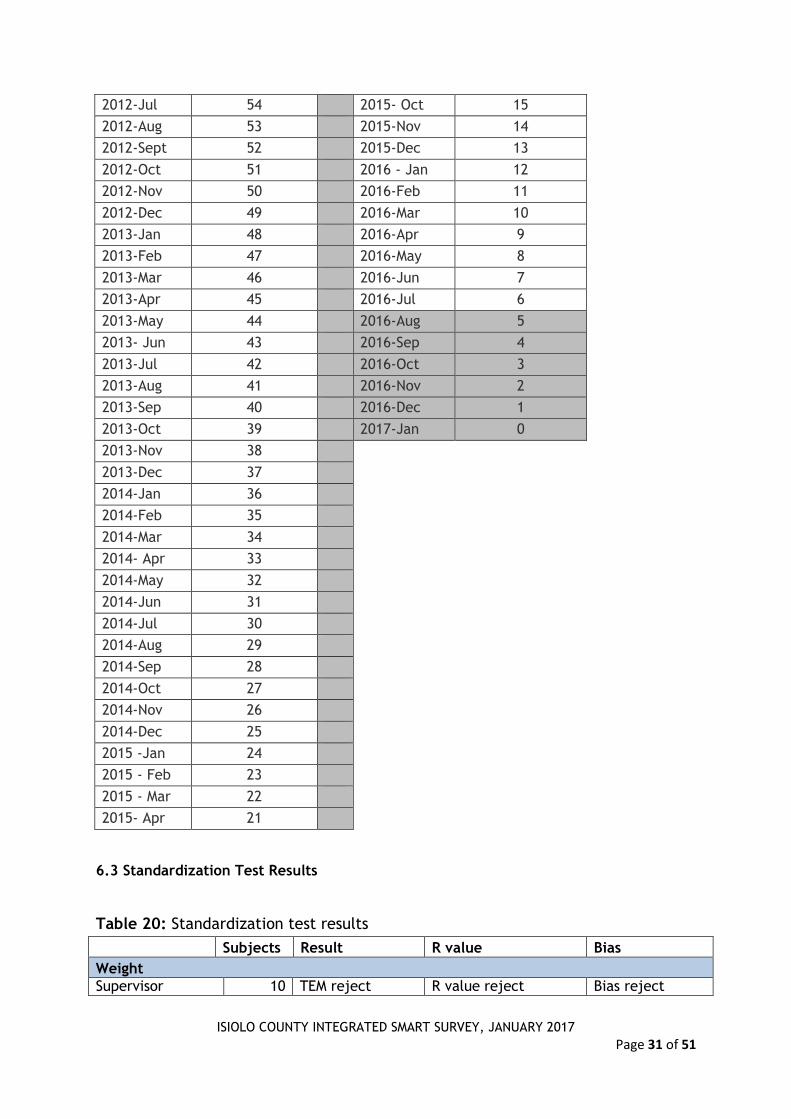
ISIOLO COUNTY INTEGRATED SMART SURVEY, JANUARY 2017
Page 31 of 51
2012-Jul 54 2015- Oct 15
2012-Aug 53 2015-Nov 14
2012-Sept 52 2015-Dec 13
2012-Oct 51 2016 - Jan 12
2012-Nov 50 2016-Feb 11
2012-Dec 49 2016-Mar 10
2013-Jan 48 2016-Apr 9
2013-Feb 47 2016-May 8
2013-Mar 46 2016-Jun 7
2013-Apr 45 2016-Jul 6
2013-May 44 2016-Aug 5
2013- Jun 43 2016-Sep 4
2013-Jul 42 2016-Oct 3
2013-Aug 41 2016-Nov 2
2013-Sep 40 2016-Dec 1
2013-Oct 39 2017-Jan 0
2013-Nov 38
2013-Dec 37
2014-Jan 36
2014-Feb 35
2014-Mar 34
2014- Apr 33
2014-May 32
2014-Jun 31
2014-Jul 30
2014-Aug 29
2014-Sep 28
2014-Oct 27
2014-Nov 26
2014-Dec 25
2015 -Jan 24
2015 - Feb 23
2015 - Mar 22
2015- Apr 21
6.3 Standardization Test Results
Table 20: Standardization test results
Subjects Result R value Bias
Weight
Supervisor 10 TEM reject R value reject Bias reject
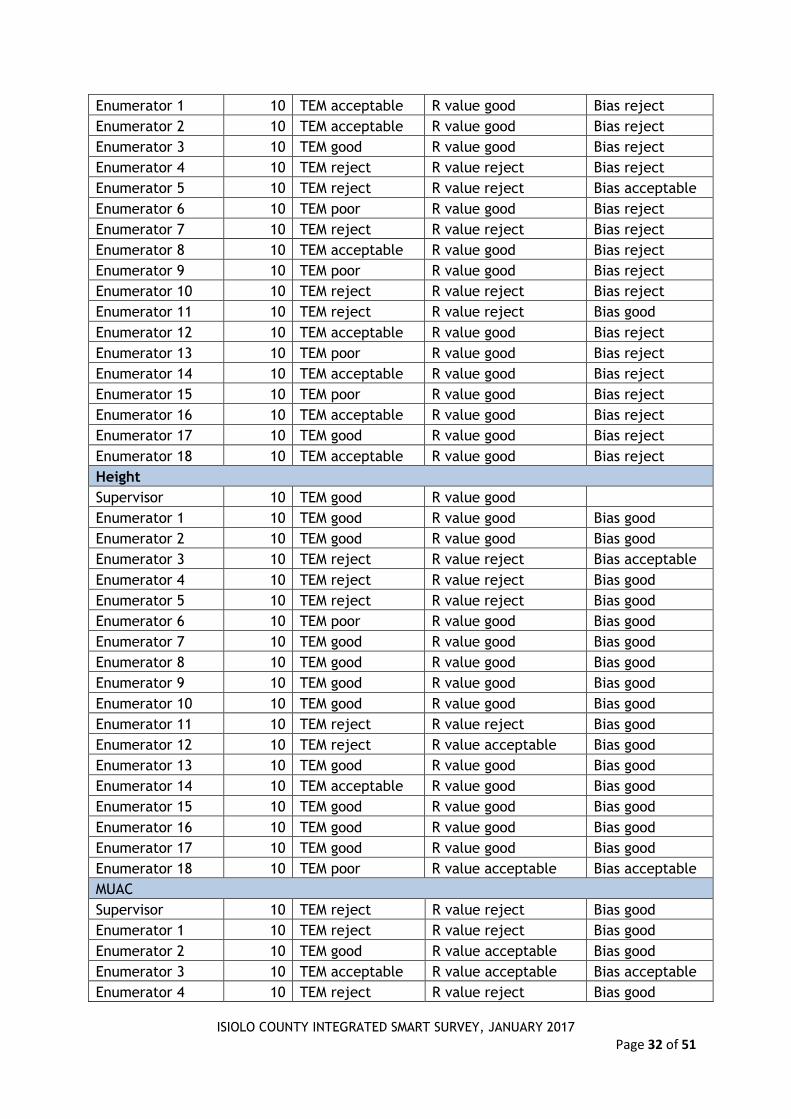
ISIOLO COUNTY INTEGRATED SMART SURVEY, JANUARY 2017
Page 32 of 51
Enumerator 1 10 TEM acceptable R value good Bias reject
Enumerator 2 10 TEM acceptable R value good Bias reject
Enumerator 3 10 TEM good R value good Bias reject
Enumerator 4 10 TEM reject R value reject Bias reject
Enumerator 5 10 TEM reject R value reject Bias acceptable
Enumerator 6 10 TEM poor R value good Bias reject
Enumerator 7 10 TEM reject R value reject Bias reject
Enumerator 8 10 TEM acceptable R value good Bias reject
Enumerator 9 10 TEM poor R value good Bias reject
Enumerator 10 10 TEM reject R value reject Bias reject
Enumerator 11 10 TEM reject R value reject Bias good
Enumerator 12 10 TEM acceptable R value good Bias reject
Enumerator 13 10 TEM poor R value good Bias reject
Enumerator 14 10 TEM acceptable R value good Bias reject
Enumerator 15 10 TEM poor R value good Bias reject
Enumerator 16 10 TEM acceptable R value good Bias reject
Enumerator 17 10 TEM good R value good Bias reject
Enumerator 18 10 TEM acceptable R value good Bias reject
Height
Supervisor 10 TEM good R value good Enumerator 1 10 TEM good R value good Bias good
Enumerator 2 10 TEM good R value good Bias good
Enumerator 3 10 TEM reject R value reject Bias acceptable
Enumerator 4 10 TEM reject R value reject Bias good
Enumerator 5 10 TEM reject R value reject Bias good
Enumerator 6 10 TEM poor R value good Bias good
Enumerator 7 10 TEM good R value good Bias good
Enumerator 8 10 TEM good R value good Bias good
Enumerator 9 10 TEM good R value good Bias good
Enumerator 10 10 TEM good R value good Bias good
Enumerator 11 10 TEM reject R value reject Bias good
Enumerator 12 10 TEM reject R value acceptable Bias good
Enumerator 13 10 TEM good R value good Bias good
Enumerator 14 10 TEM acceptable R value good Bias good
Enumerator 15 10 TEM good R value good Bias good
Enumerator 16 10 TEM good R value good Bias good
Enumerator 17 10 TEM good R value good Bias good
Enumerator 18 10 TEM poor R value acceptable Bias acceptable
MUAC
Supervisor 10 TEM reject R value reject Bias good
Enumerator 1 10 TEM reject R value reject Bias good
Enumerator 2 10 TEM good R value acceptable Bias good
Enumerator 3 10 TEM acceptable R value acceptable Bias acceptable
Enumerator 4 10 TEM reject R value reject Bias good
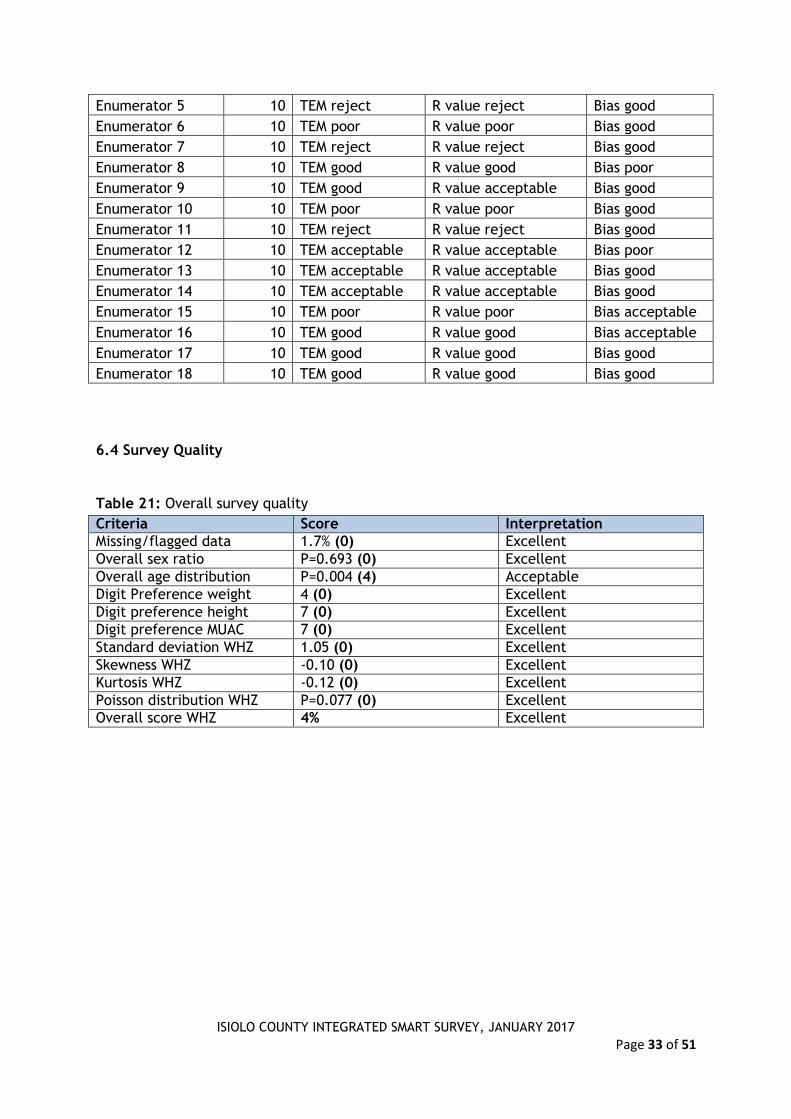
ISIOLO COUNTY INTEGRATED SMART SURVEY, JANUARY 2017
Page 33 of 51
Enumerator 5 10 TEM reject R value reject Bias good
Enumerator 6 10 TEM poor R value poor Bias good
Enumerator 7 10 TEM reject R value reject Bias good
Enumerator 8 10 TEM good R value good Bias poor
Enumerator 9 10 TEM good R value acceptable Bias good
Enumerator 10 10 TEM poor R value poor Bias good
Enumerator 11 10 TEM reject R value reject Bias good
Enumerator 12 10 TEM acceptable R value acceptable Bias poor
Enumerator 13 10 TEM acceptable R value acceptable Bias good
Enumerator 14 10 TEM acceptable R value acceptable Bias good
Enumerator 15 10 TEM poor R value poor Bias acceptable
Enumerator 16 10 TEM good R value good Bias acceptable
Enumerator 17 10 TEM good R value good Bias good
Enumerator 18 10 TEM good R value good Bias good
6.4 Survey Quality
Table 21: Overall survey quality
Criteria Score Interpretation
Missing/flagged data 1.7% (0) Excellent
Overall sex ratio P=0.693 (0) Excellent
Overall age distribution P=0.004 (4) Acceptable
Digit Preference weight 4 (0) Excellent
Digit preference height 7 (0) Excellent
Digit preference MUAC 7 (0) Excellent
Standard deviation WHZ 1.05 (0) Excellent
Skewness WHZ -0.10 (0) Excellent
Kurtosis WHZ -0.12 (0) Excellent
Poisson distribution WHZ P=0.077 (0) Excellent
Overall score WHZ 4% Excellent

ISIOLO COUNTY INTEGRATED SMART SURVEY, JANUARY 2017
Page 34 of 51
6.5 Smart Survey Questionnaire
1.IDENTIFICATION 1.1 Data Collector___________________ 1.2 Team Leader_______________ 1.3 Survey date (dd/mm/yy)--------------------------
1.4 County 1.5 Sub County 1.6 Division 1.7 Location 1.8 Sub-Location 1.9 Village 1.10 Cluster No 1.11 HH No 1.12 Team No.
2. Household Demographics
2.1 2.2 2.3 2.4 2.5 2.6 2.7 2.8 2.9
Age Group
Please give me the names of the persons who usually live in your household.
Age (Record age in MONTHS for children <5yrs and YEARS for those ≥
5 years’s)
Childs age verified by
1=Health card
2=Birth certificate/
notification
3=Baptism card
4=Recall
Sex 1= Male 2= Female
If 3 yrs and under 18 years, Is the child enrolled in school? 1 = Yes 2 = No
(If yes go to 2.8; If no go to 2.7)
Main Reason for not attending School (Enter one code from list) 1=chronic Sickness 2=Weather (rain, floods, storms) 3=Family labour responsibilities 4=Working outside home 5=Teacher absenteeism 6=Too poor to buy school items e.t.c 7=Household doesn’t see value of schooling 8 =No food in the schools 9 = Migrated/ moved from school area 10=Insecurity 11-No school Near by 12=Married 13=others (specify)…………………..
What is the highest level of education attained?(level completed) From 5 yrs and above 1 = pre primary 2= Primary 3=Secondary 4=Tertiary
5= None 6=others(specify)
If the household owns mosquito net/s, who slept under the mosquito net last night? (Probe-enter all responses mentioned (Use 1 if “Yes” 2 if “No and 3 if not applicable)
YRS MTH
< 5 YRS 1 2 3 4
>5 TO <18
YRS
5 6 7 8 9 10 11 12
ADULT (18
years and
above)
13(HH) 14) 15 16
2.10 How many mosquito nets does this household have? ____________________ (Indicate no.)
2.11 Main Occupation of the Household Head – HH.
(enter code from list) 1=Livestock herding 2=Own farm labour 3=Employed (salaried) 4=Waged labour (Casual)
2.12. What is your main current source of income
1. =No income
2. = Sale of livestock
3. = Sale of livestock products
4. = Sale of crops
5. = Petty trading e.g. sale of firewood
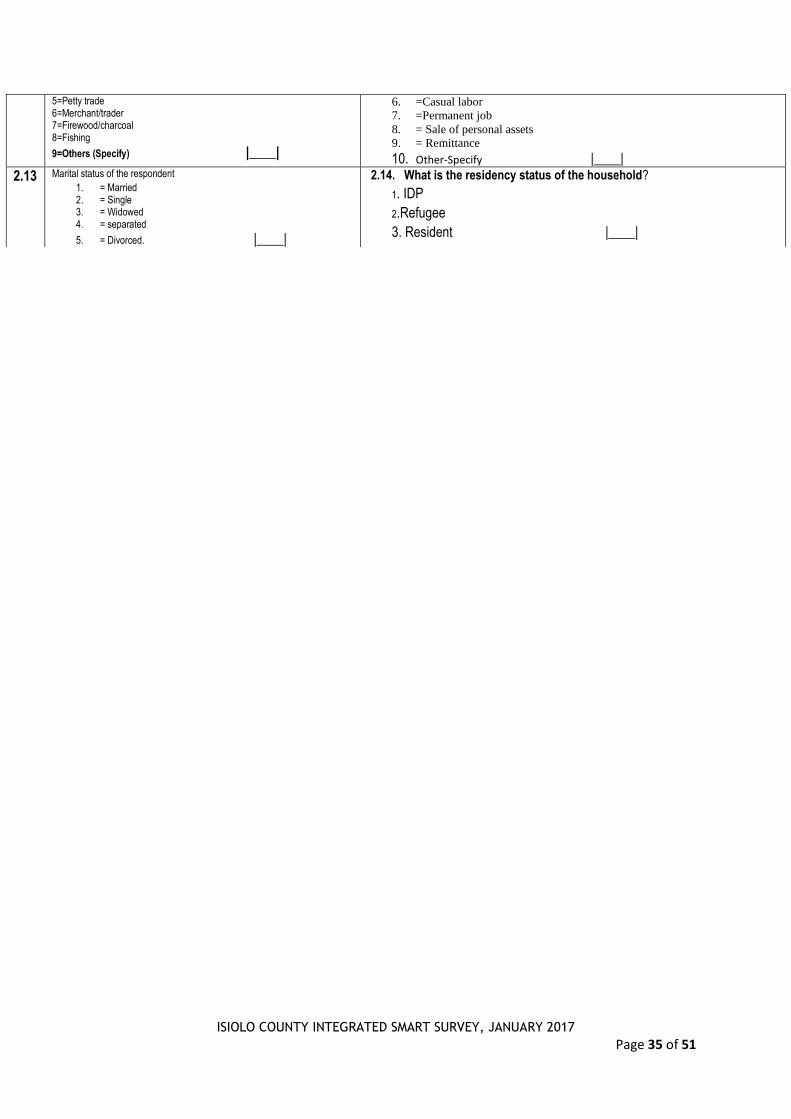
ISIOLO COUNTY INTEGRATED SMART SURVEY, JANUARY 2017
Page 35 of 51
5=Petty trade 6=Merchant/trader 7=Firewood/charcoal 8=Fishing
9=Others (Specify) |____|
6. =Casual labor
7. =Permanent job
8. = Sale of personal assets
9. = Remittance
10. Other-Specify |____|
2.13 Marital status of the respondent
1. = Married 2. = Single 3. = Widowed 4. = separated
5. = Divorced. |____|
2.14. What is the residency status of the household?
1. IDP
2.Refugee
3. Resident |____|
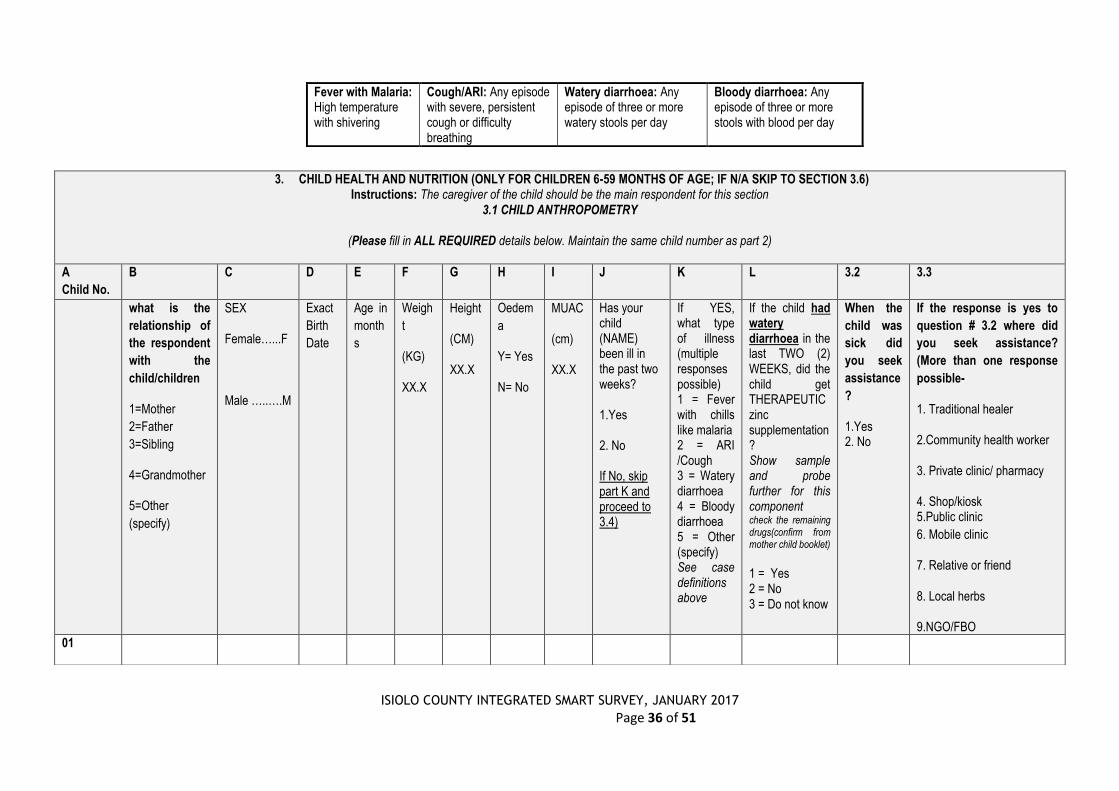
ISIOLO COUNTY INTEGRATED SMART SURVEY, JANUARY 2017
Page 36 of 51
Fever with Malaria: High temperature with shivering
Cough/ARI: Any episode with severe, persistent cough or difficulty breathing
Watery diarrhoea: Any episode of three or more watery stools per day
Bloody diarrhoea: Any episode of three or more stools with blood per day
3. CHILD HEALTH AND NUTRITION (ONLY FOR CHILDREN 6-59 MONTHS OF AGE; IF N/A SKIP TO SECTION 3.6) Instructions: The caregiver of the child should be the main respondent for this section
3.1 CHILD ANTHROPOMETRY
(Please fill in ALL REQUIRED details below. Maintain the same child number as part 2)
A
Child No.
B C D E F G H I J K L 3.2 3.3
what is the
relationship of
the respondent
with the
child/children
1=Mother
2=Father
3=Sibling
4=Grandmother
5=Other
(specify)
SEX
Female…...F
Male …..….M
Exact
Birth
Date
Age in
month
s
Weigh
t
(KG)
XX.X
Height
(CM)
XX.X
Oedem
a
Y= Yes
N= No
MUAC
(cm)
XX.X
Has your child (NAME) been ill in the past two weeks? 1.Yes
2. No If No, skip part K and proceed to 3.4)
If YES, what type of illness (multiple responses possible) 1 = Fever with chills like malaria 2 = ARI /Cough 3 = Watery diarrhoea 4 = Bloody diarrhoea 5 = Other (specify) See case definitions above
If the child had watery diarrhoea in the last TWO (2) WEEKS, did the child get THERAPEUTIC zinc supplementation? Show sample and probe further for this component check the remaining drugs(confirm from mother child booklet)
1 = Yes 2 = No 3 = Do not know
When the
child was
sick did
you seek
assistance
?
1.Yes 2. No
If the response is yes to
question # 3.2 where did
you seek assistance?
(More than one response
possible-
1. Traditional healer
2.Community health worker
3. Private clinic/ pharmacy
4. Shop/kiosk 5.Public clinic
6. Mobile clinic
7. Relative or friend
8. Local herbs
9.NGO/FBO
01

ISIOLO COUNTY INTEGRATED SMART SURVEY, JANUARY 2017
Page 37 of 51
3.4 Maintain the same child number as part 2 and 3.1 above
A1 A2 B C D E F G H I
Child No.
How many
times has
child
received
Vitamin A
in the past
year?
(show
sample)
Has the child received vitamin A supplement in the past 6 months?
How many times did you receive vitamin A capsules from the facility or out reach
If Vitamin A
received
how many
times
verified by
Card?
FOR
CHILDREN
12-59
MONTHS
How many
times has
child
received
drugs for
worms
in the past
year?
(show Sample)
Has the child received BCG vaccination? 1 = scar 2=No scar
Has child received OPV1 vaccination 1=Yes, Card 2=Yes, Recall 3 = No 4 = Do not know
Has child received OPV3 vaccination? 1=Yes, Card 2=Yes, Recall 3 = No 4 = Do not know
Has child received measles vaccination at 9 months (On the upper right shoulder)? 1=Yes, Card 2=Yes, Recall 3 = No 4 = Do not know
Has child received the second measles vaccination (18 to 59 months ) (On the upper right shoulder)? 1=Yes, Card 2=Yes, Recall 3 = No 4 = Do not know
01
02
03
04
02
03
04

ISIOLO COUNTY INTEGRATED SMART SURVEY, JANUARY 2017
Page 38 of 51
3.5 MNP Programme Coverage. Maintain the same child number as part 2 and 3.1 above. Ask all the relevant questions (3.5.1 to 3.6.4) before moving on to f ill
responses for the next child.
3.5 Enrolment in an MNP program 3.6 Consumption of MNPs
3.5.1.
Is the child enrolled in the MNP
program?(show the example of
the MNP sachet)
(record the code in the
respective child’s number)
Yes =1
No=0
If no go to 3.5.2,
If yes go to section 3.6.1
3.5.2
If the child, 6-23months, is not enrolled for
MNP, give reason. (Multiple answers
possible. Record the code/codes in the
respective child’s number. DO NOT
READ the answers)
Do not know about MNPs ….......………1
Discouraged from what I heard from
others ……..............................................2
The child has not fallen ill, so have not
gone to the health facility …. ….....…..3
Health facility or outreach is far ….....…4
Ch ild receiving therapeutic or
supplementary foods ..............................5
Other reason, specify ...…….....……….6
Skip to 3.7
3.6.1
Has the child
consumed MNPs
in the last 7
days?(shows the
MNP sachet)
(record the
code in the
respective
child’s number)
YES = 1
N0= 0
If no skip to
3.6.3
3.6.2
If yes, how frequent do you give
MNP to your child? (record the
code in the respective child’s
number)
Every day ……..........……….1 Every other day ........….……..2 Every third day ……......……..3 2 days per week at any day ....4 Any day when I remember..…5
3.6.3
If no, since when did you
stop feeding MNPs to your
child? (record the code in
the respective child’s
number)
1 week to 2 weeks ago ....1
2 week to 1 month ago ....2
More than 1 month ..........3
3.6.4
What are the reasons to stop
feeding your child with MNPs?
(Multiple answers possible.
Record the code/codes in the
respective child’s number. DO
NOT READ the answers)
Finished all of the sachets .............1
Child did not like it .......................2
Husband did not agree to give to
the child ..................3
Sachet got damaged ………….4
Child had diarrhea after being given
vitamin and mineral powder ……..5
Child fell sick.......................6
Forgot …………………….…..7
Child enrolled in IMAM program …8
Other (Specify)______________ ..9
Child 1
Child 2
Child 3
Child 4

ISIOLO COUNTY INTEGRATED SMART SURVEY, JANUARY 2017
Page 39 of 51
MATERNAL NUTRITION FOR MOTHERS OF REPRODUCTIVE AGE (15-49 YEARS)(Please insert appropriate number in the box) 3.7 3.8 3.9 3.10 3.11
Woman ID. (all women in the HH aged 15-49 years from the household demographics – section 2 )
What is the mother’s /
caretaker’s physiological
status
1. Pregnant 2. Lactating 3. not pregnant and
not lactating
Mother/ caretaker’s
MUAC reading:
____.__cm
During the pregnancy of the
(name of the youngest biological
child below 24 months) did you
take iron pills, sprinkles with
iron, iron syrup or iron-folate
tablets?
1. Yes 2. No 3. Don’t know 4. N/A
If Yes, for how many
days did you take iron
pills, sprinkles with
iron, iron syrup or iron-
folate tablets?
(probe and
approximate the
number of days)

ISIOLO COUNTY INTEGRATED SMART SURVEY, JANUARY 2017
Page 40 of 51
4.0 WATER, SANITATION AND HYGIENE (WASH)/- Please ask the respondent and indicate the appropriate number in the space provided
4.1 What is the MAIN source of drinking water for the
household NOW?
1. Piped water system/ borehole/ protected spring/protected shallow wells
2. Unprotected shallow well 3. River/spring 4. Earth pan/dam 5. Earth pan/dam with infiltration well |____| 6. Water trucking /Water vendor 7. Other (Please specify)
4.2 What is the trekking distance to the current main water
source?
1=less than 500m (Less than 15 minutes) 2=more than 500m to less than 2km (15 to 1 hour) 3=more than 2 km (1 – 2 hrs) 4=Other(specify) |____|
4.2.2a Do you queue for water?
1. Yes 2. No (If No skip to question 4.3) |____|
4.2.2b. If yes how long?
1. Less than 30 minutes 2. 30-60 minutes 3. More than 1 hour
|____|
4.3a Is anything done to your water before drinking
(Use 1 if YES and 2 if NO). if No skip to 4.4
|____|
4.3b If yes what do you do? (MULTIPLE RESPONSES
POSSIBLE) (Use 1 if YES and 2 if NO).
1. Boiling………… ……………………………………. |____| 2. Chemicals (Chlorine,Pur,Waterguard)…………… |____| 3. Traditional herb……………………………………... |____| 4. Pot filters…………………………………………….. |____| 5. Other (specify_________)…………………………. |____|
4.4 Where do you store water for drinking?
1. Open container / Jerrican 2. Closed container / Jerrican |____|
4.5 How much water did your household use YESTERDAY
(excluding for animals)?
(Ask the question in the number of 20 liter Jerrican and convert to
liters & write down the total quantity used in liters)
|____|
4.6 Do you pay for water?
1. Yes 2. No (If No skip to Question 4.7.1)
|____|
4.6.1 If yes, how much per 20 liters
jerrican _________ KSh/20ltrs
4.6.2 If paid per month
how much |____|
4.7.1 Yesterday (within last 24 hours) at what instances did you wash your hands? (MULTIPLE RESPONSE- (Use 1 if
“Yes” and 2 if “No”)
1. After toilet……………………………………………………………………………………………………………… 2. Before cooking………………………………………………………………………………………………………... 3. Before eating…………………………………………………………………………………………………………. 4. After taking children to the toilet……………………………………………………………………………………. 5. Others………………………………………………………………………………………………………………….
|____|
|____|
|____|
|____|
|____|
4.7.2 If the caregiver washes her hands, then probe further; what did you use to wash your hands?
1. Only water 2. Soap and water 3. Soap when I can afford it 4. traditional herb 5. Any other specify |____|
4.8 Where do members of your household Mainly
relieve themselves?
1. In the bushes, open defecation 2. Neighbor or shared traditional pit/improved latrine 3. Own traditional pit/improved latrine 4. Others Specify
|____|
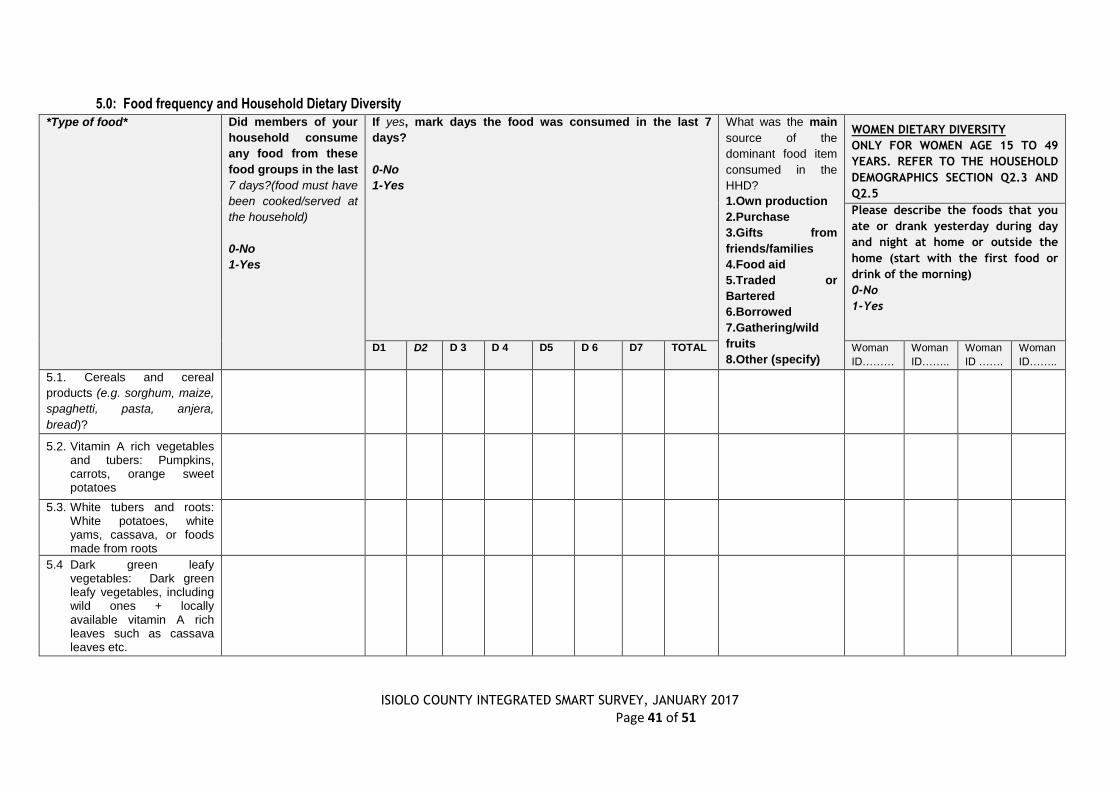
ISIOLO COUNTY INTEGRATED SMART SURVEY, JANUARY 2017
Page 41 of 51
5.0: Food frequency and Household Dietary Diversity
*Type of food* Did members of your
household consume
any food from these
food groups in the last
7 days?(food must have
been cooked/served at
the household)
0-No
1-Yes
If yes, mark days the food was consumed in the last 7
days?
0-No
1-Yes
What was the main
source of the
dominant food item
consumed in the
HHD?
1.Own production
2.Purchase
3.Gifts from
friends/families
4.Food aid
5.Traded or
Bartered
6.Borrowed
7.Gathering/wild
fruits
8.Other (specify)
WOMEN DIETARY DIVERSITY
ONLY FOR WOMEN AGE 15 TO 49
YEARS. REFER TO THE HOUSEHOLD
DEMOGRAPHICS SECTION Q2.3 AND
Q2.5
Please describe the foods that you
ate or drank yesterday during day
and night at home or outside the
home (start with the first food or
drink of the morning)
0-No
1-Yes
D1 D2 D 3 D 4 D5 D 6 D7 TOTAL Woman
ID………
Woman
ID……..
Woman
ID …….
Woman
ID……..
5.1. Cereals and cereal
products (e.g. sorghum, maize,
spaghetti, pasta, anjera,
bread)?
5.2. Vitamin A rich vegetables and tubers: Pumpkins, carrots, orange sweet potatoes
5.3. White tubers and roots: White potatoes, white yams, cassava, or foods made from roots
5.4 Dark green leafy vegetables: Dark green leafy vegetables, including wild ones + locally available vitamin A rich leaves such as cassava leaves etc.

ISIOLO COUNTY INTEGRATED SMART SURVEY, JANUARY 2017
Page 42 of 51
5.5 Other vegetables (e.g., tomatoes, eggplant, onions)?
5.6. Vitamin A rich fruits: + other locally available vitamin A rich fruits
5.7 Other fruits
5.8 Organ meat (iron rich): Liver, kidney, heart or other organ meats or blood based foods
5.9. Flesh meats and offals: Meat, poultry, offal (e.g. goat/camel meat, beef; chicken/poultry)?
5.10 Eggs?
5.11 Fish: Fresh or dries fish or shellfish
5.12 Pulses/legumes, nuts (e.g. beans, lentils, green grams, cowpeas)?
5.13 Milk and milk products (e.g. goat/camel/ fermented milk, milk powder)?
5.14 Oils/fats (e.g. cooking fat or oil, butter, ghee, margarine)?
5.15 Sweets: Sugar, honey, sweetened soda or sugary foods such as chocolates, sweets or candies
5.16 Condiments, spices and beverages:

ISIOLO COUNTY INTEGRATED SMART SURVEY, JANUARY 2017
6. COPING STRATEGIES INDEX
Frequency score:
Number of days out of the
past seven (0 -7).
In the past 7 DAYS, have there been times when you did not have enough food or money to buy food?
If No; END THE INTERVIEW AND THANK THE RESPONDENT
If YES, how often has your household had to: (INDICATE THE SCORE IN THE SPACE PROVIDED)
1 Rely on less preferred and less expensive foods?
2 Borrow food, or rely on help from a friend or relative?
3 Limit portion size at mealtimes?
4 Restrict consumption by adults in order for small children to eat?
5 Reduce number of meals eaten in a day?
TOTAL HOUSEHOLD SCORE:
END THE INTERVIEW AND THANK THE RESPONDENT