i iiiii 11111ll nil miii - defense technical information...
TRANSCRIPT

AD-A270 361I IIIII 11111ll Nil MIII
Carderock DivisionNaval Surface Warfare CenterBetheseda, MD 20084-5000
SSM-64-93/04 August 1993Survivability, Structures and Materials DirectorateResearch and Development Report
CUCA
M';_ Mechanical Properties and Impact DamageResistance of Composites Fabricated by Low Cost,
0.) "
Vacuum Assisted, Resin Transfer Molding
t byThomas Juska
"*0> J. Steven MayesU U William H. Seemann, m
93-23591 L.,
Approved for public release; distribution unlimited.
¶~3 U 6 1 5

CONTENTS
ABSTRA CT .............................................. 1
ADMINISTRATIVE INFORMATION ............................. 1
INTRODUCTION .......................................... 1
MATERIALS EVALUATED ................................... 2R ESIN S . . . . . . .. . . . .. . . . .. . . .. . . . . .. . . . . . . . . . . . . . . . . 2GLASS FABRIC STYLE ................................. 2FIBER S ............................ ......... ....... 5HYBRID REINFORCEMENT .............................. 6COMPOSITE FABRICATION .............................. 6
EVALUATION PROCEDURE .................................. 7FIBER CONTENT AND PERCENT VOIDS ..................... 7STRENGTH ......................................... 7
Com pression ..................................... 7Tension . .. . .. . . ... . . .. . .. . .. . .. . . . . .. . . . . . . . .. . 7Flexure . . . . . . . . . . . . . . . . . . . . . . . . . . . . . . . . . . . . . . . . 8Short Beam Shear ................................. 8
IM PA CT ............................................ 8
RESULTS AND DISCUSSION .................................. 9FIBER CONTENT AND PERCENT VOIDS ..................... 9EFFECT OF RESIN .................................... 10
Strenfth . ................................. ... ... 10Im pact Resistance .................................. 13Sum m ary ....................................... 13
EFFECT OF GLASS FABRIC STYLE ......................... 14Strength ........................................ 14Im pact Resistance .................................. 17Woven Roving vs. Woven Yarn ......................... 19Fiber/M atrix Adhesion .............................. 22Sum m ary. ....................................... 23
EFFECT OF FIBER .................................... 25Strength .. ...................................... 25Im pact Resistance .................................. 25Fiber/M atrix Adhesion .............................. 29
EFFECT OF HYBRID REINFORCEMENT ..................... 29StrengLh ........................................ 31Im pact Resistance .................................. 34
iii
CONTENTS (Continued)
SUMMARY AND CONCLUSIONS ................................. 35EFFECT OF RESIN .................................... 35EFFECT OF GLASS FABRIC STYLE ........................... 35EFFECT OF FIBER .................................... 35EFFECT OF HYBRID ..................................... 35
APPENDIX A - STRENGTH AND MODULUS DATA ..................... 36
REFERENCES ............................................ 55
FIGURES
1. The glass fabrics shown are (top row, left to right) the 24 oz. wovenroving and Style 7781, and (bottom row) the 10 Twill, 24 Twill, and theChomarat fabric ........................................ 4
2. The weight % glass of the glass fabric reinforced laminates tested in thisstudy . . . . . . . . . . . . . . . . . . . . . . . . . . . . . . . . . . . . . . . . . . . . . . . 9
3. The effect of resin on compression strength (ksi) of laminates reinforcedwith 24 oz. woven roving .. ................................ 11
4. The effect of resin on flexural strength (ksi) of laminates reinforced with24 oz. woven roving ...................................... 11
5. The effect of resin on tensile strength (ksi) of laminates reinforced with 24oz. woven roving ........................................ 12
6. The effect of resin on short beam shear strength (ksi) of laminatesreinforced with 24 oz. woven roving ............................ 12
7. The effect of resin on impact damage area (square inches) of laminatesreinforced with 24 oz. woven roving ............................ 13
8. The effect of glass fabric on compression strength. The resin is Derakane8084 throughout. DF 1400 was tested in the fill direction ............. 15
9. The effect of glass fabric on flexural strength. The resin is Derakane 8084throughout. DF 1400 was tested in the fill direction ................. 15
10. The effect of glass fabric on tensile strength. The resin is Derakane 8084throughout. DF 1400 was tested in the fill direction ................. 16
iv

FIGURES (Continued)
11. The effect of glass fabric on SBS strength. The resin is Derakane 8084throughout. DF 1400 was tested in the fill direction ................. 16
12. The effect of glass fabric on impact damage area. The resin is Derakane8084 throughout ........................................ 18
13. The compression strength of the glass fabrics correlates with the amplitudeof distortion of the rovings caused by the crossover in the weave ......... 18
14. A comparison of tensile strength with compressive strength of wovenroving reinforced laminates .................................. 21
15. A comparison of tensile strength with compressive strength of woven yarnreinforced laminates ...................................... 21
16. The strength of 7781/8084 was a strong function of the finish applied tothe fabric . . .. . .. .. .. .. .. .. .. .. . .. . .. .. . .. . . .. . . . . . . . . 23
17. The impact damage area of 7781 was a strong function of the fabric finish,as shown in the graph above. The data at 1000 in.lbs/in was measuredfrom the panels pictured ................................... 24
18. The effect of fiber on compression strength. The resin was Derakane 8084vinyl ester, except those materials indicated with EP, which had Epon9405 epoxy ............................................ 26
19. The effect of fiber on flexural strength. The resin was Derakane 8084vinyl ester, except those materials indicated with EP, which had Epon9405 epoxy . .......................................... 26
20. The effect of fiber on tensile strength. The resin was Derakane 8084 vinylester, except those materials indicated with EP, which had Epon 9405epoxy .. . . . . . . . .. .. . ..... . .. .. .. .. .. . .. .. . . .. . .. .. . . . . 27
21. The effect of fiber on SBS strength. The resin was Derakane 8084 vinylester, except the material indicated with EP, which had Epon 9405 epoxy... 27
22. The effect of fiber on impact damage area. The resin was Derakane 8084vinyl ester, except the material indicated with EP, which had Epon 9405epoxy .. . . . . . . . .. . .. . .. .. . ... . .. . .. .. . .. .. . . .. . . . . . . . 28
23. Flexural strength degradation after immcrsicn and the appearance of dryfailure surfaces (right) indicate fiber/matrix adhesion problems in thecarbon vinyl ester. Carbon/epoxy (left) appears well bonded ............ 30
V

FIGURES (Continued)
24. The effect of hybrid reinforcement on compression strength. Derakane8084 was used throughout. The properties of an all-glass panel areincluded for comparison .................................... 32
25. The effect of hybrid reinforcement on flexural strength. Derakane 8084was used throughout. The properties of an all-glass panel are included forcom parison . .......................................... 32
26. The effect of hybrid reinforcement on tensile strength. Derakane 8084 wasused throughout. The properties of an all-glass panel are included forcom parison . .......................................... 33
27. The effect of hybrid reinforcement on impact damage area. Derakane8084 was used throughout. Only the hybrids of Kevlar (at 40% and 50%)retained the excellent impact resistance of glass .................... 33
A.1. Shear stress/strain curve for WR/8084. The modulus in Table A.2 wasdetermined by the initial slope ............................... 38
A.2. Woven Roving/8084 stress/strain curves for in-plane compression andshear . . . . . . . . . . . . . . . . . . . . . . . . . . . . . . . . . . . . . . . . . . . . . . . 39
TABLES
1. The resins evaluated in this study. Values of Young's modulus (E) are inksi, and failure strains (e) are % ............................... 3
2. The glass fabrics tested in this study. The "Mils" column is mils/ply in thelam inate .. ........................................... 3
3. The Carbon, Kevlar, and Spectra fabrics evaluated. The "Mils/Ply"values were measured in the laminate ............................ 5
4. The hybrids evaluated in this study. The thickness ratios were calculatedfrom measured panel thickness. Values of % (by volume) glass arenom inal . .. . ... ... .... ........ ..... ...... ... ... .. .. . . 6
5. A comparison of the approximate cost per pound, flexural andcompression strengths (ksi), and inputs used in three gl•.s fabricsevaluated ............................................. 19
6. A comparison of strength (o, in ksi) and modulus (E, in msi) with o/1 andE /6 . . . . . . . . . . . . . . . . . . . . . . . . . . . . . . . . . . . . . . . . . . . . . . . . 3 1
vi

TABLES (Continued)
A.1. The data taken in this study. Strengths are in ksi, Young's moduli in msi . 37
A.2. In-plane shear strength (S) and modulus (Gxy) ..................... 38
A.3. Raw data for ASTM D 695 compression test ........................ 40
A.4. Raw data for ASTM D 638 tension test ........................... 43
A.5. Raw data for ASTM D 638 modulus test ......................... 46
A.6. Raw data for ASTM D 790 flexure test .......................... 49
A.7. Raw data for ASTM D 2344 shear test .......................... 52
vii

ABSTRACT
Fabric-reinforced laminates made by SCRIMP (Seemann CompositesResin Infusion Molding Process) were tested in compression, tension,flexure, short beam shear, and impact. A global study of theproperties of SCRIMP panels was the goal of this program. Fourvinyl esters, one polyester, and two epoxies were tested, as wereseven different styles of E-glass fabric. The properties of E-glassfabrics were compared with those of carbon, Kevlar, and Spectrafabrics, and with the hybrids E-glass:carbon, E-glass:Kevlar, and E-glass:Spectra. Composite properties increased with resin modulus,provided the resin failure strain was above a critical (undetermined)minimum value. Light woven roving and textile fabrics hadsomewhat better properties than coarser woven rovings, and glass wasthe overall best performer based on cost, strength and impactresistance. An E-glass:Kevlar hybrid was identified which hadsignificant weight savings but comparable properties to E-glass.
ADMINISTRATIVE INFORMATION
The work described herein was conducted to support a Balanced Technology Initiative for an
Advanced Seal Delivery Vehicle. The Program Manager was Code 06Z of the Naval Sea System
Command. The Technical Design Agent was Code 2310 of the Coastal Systems Station. This work
was sponsored initially under Carderock Division, Naval Surface Warfare Center (CDNSWC) work
unit 1-1720-221, and was completed as a Ship and Submarine Materials Block Program under
CDNSWC work unit 1-2802-602.
INTRODUCTION
Composite panels were fabricated using SCRIMP' (Seemann Composites Resin Infusion
Molding Process). The results reported herein represent an initial database on SCRIMP. Static
mechanical properties and impact damage resistance were determined for a wide variety of material
systems. The study included the effect of resin, style of E-glass fabric, and reinforcing fiber. Also
tested were hybrids of E-glass with carbon, Kevlar, and Spectra.
1

MATERIALS EVALUATED
The purpose of this study was to determine the range in properties which can be achieved
with SCRIMP. The materials were varied as broadly as possible. The survey was conducted by
first comparing the properties of 6 resins (4 vinyl esters, 1 epoxy, and 1 polyester) reinforced with
the same 24 oz. woven roving. A single resin was then selected, and used to study the effect of
glass fabric style (7 total) and reinforcing fiber (glass, carbon, Kevlar, and Spectra). The best
overall glass fabric was then used to determine the properties of hybrids.
RESINS
The goal here was to determine the effect of the resin on composite properties, where the
candidates are polyester, vinyl ester, and RTM-grade epoxies. Given that there are several hundred
candidates, we had to select representatives of each of the three resin types. The possibility exists
that generalizations drawn from this study concerning the effect of resin on composite properties are
invalid due to the limited number of resins evaluated.
A description of the resins tested is given in Table 1. The data which appears in Table 1
were taken from manufacturer's data sheets. Data were not available for the two epoxies evaluated.
However, Tactix 123:Millamine 5260 is essentially identical to Tactix 123:H3112, the data for which
appears in Table 1. In addition, given the apparent similarity between Tactix 123 and the Shell
Chemical resin, Epon 9405, the stiffness and failure strain are expected to be equivalent to the
Tactix 123:Millamine 5260 resin.
GLASS FABRIC STYLE
The 7 styles of E-glass fabric tested here are listed and described in Table 2. There are 5
woven rovings, a stitched biaxial, and a woven yam. The "woven roving" in Table 2 and Figures
2

Table 1. The resins evaluated in this study. Values of Young's modulus (E) are in ksi,and failure strains (E) are %.
Resin E E Description
Derakane 510A 500 6 Brominated vinyl ester
Derakane 8084 460 10 Rubber-toughened vinyl ester
CoRezyn 8510 NA 10 Vinyl ester toughened without rubber
CoRezyn 8520 360 20 Vinyl ester toughened without rubber
Tactix 123 430 6 RTM epoxy, cured with Millamine 5260
Epon 9405 430 6 RTM epoxy, cured with Millamine 5260
Cargill 8472 540 2 1:1 isothalic polyester
Table 2. The glass fabrics tested in this study. The "Mils" column is mils/ply in thelaminate.
Designation Oz/Yd2 Mils Weave Roving
10 oz. Twill 9.6 10 3X1 FGI, 1200 yds/lb
24 oz. Twill 24 26 3X1 Cert'teed 625, 225 yds/lb
Woven Roving 24 24 Plain Cert'teed 625, 225 yds/lb(WR)
Chomarat 24 31 2X2
DF 1400 40 42 2X1 Spun roving in fill
Stitched Biaxial 19.4 26 330/617 yd/lb (warp/fill)
Style 7781 8.5 9.5 SHS Hexcell F72, 7500 yds/lb
2-11 is so-designated because it is the industry standard, a 24 ounce plain weave. Five of the
fabrics are shown in Figure 1 for comparison.
The first three woven rovings in Table 2 were made at Seemann Composites. The fourth,
the Chomarat fabric, is a French material which has been given a mechanical surface treatment (see
Figure 1) for improved resistance to delamination. The fifth woven roving, DF 1400, is the fabric
3

Fig. 1. The glass fabrics shown are (top row, left to right) the 24 oz. woven roving and
Style 7781, and (bottom row) the 10 Twill, 24 Twill, and the Chomarat fabric.
4

used in the MHC 51 class for the hull, deck, and bulkheads 3. It was made by Certainteed and is
composed of spun roving in the fill direction. It is the only woven roving tested here with an
unbalanced composition in warp and fill. It is 25 oz/yd2 :n the fill direction, and 15 oz/yd 2 in the
warp. For this reason, properties of laminates conwaining this fabric were measured in both the
warp and fill direction.
The stitched biaxial fabric is Hexcel CD180. It was included to evaluate the effect of
uncrimped rovings. Also included in the testing was a woven yarn, or textile fabric, Style 7781, a
Hexcel material finished with F72, a polyester and vinyl ester compatible coupling agent.
FIBERS
Carbon, Kevlar, and Spectra fabrics were evaluated for comparison with E-glass. The
Table 3. The Carbon, Kevlar, and Spectra fabrics evaluated. The "Mils/Ply" values weremeasured in the laminate.
Fiber Style Oz/yd2 Mils/Ply Weave Tow
Carbon 1059 15.5 22 5HS 12K AS4W
Carbon 1029 10.9. 16 8HS 3K XASg
Carbon 1029 10.9 16 8HS 3K T300 UC309
Carbon 1030 10.2 15 5HS 6K (fiber unknown)
Kevlar 285 5.n) 13 Crowfoot K49, 1140 Denier
Kevlar 900 9.0 17 5HS K49, 2160 Denier
Spectra 985 5.5 10 8HS S1000, 650 Denier
materials used in this study are described in Table 3.
5
HYBRID REINFORCEMENT
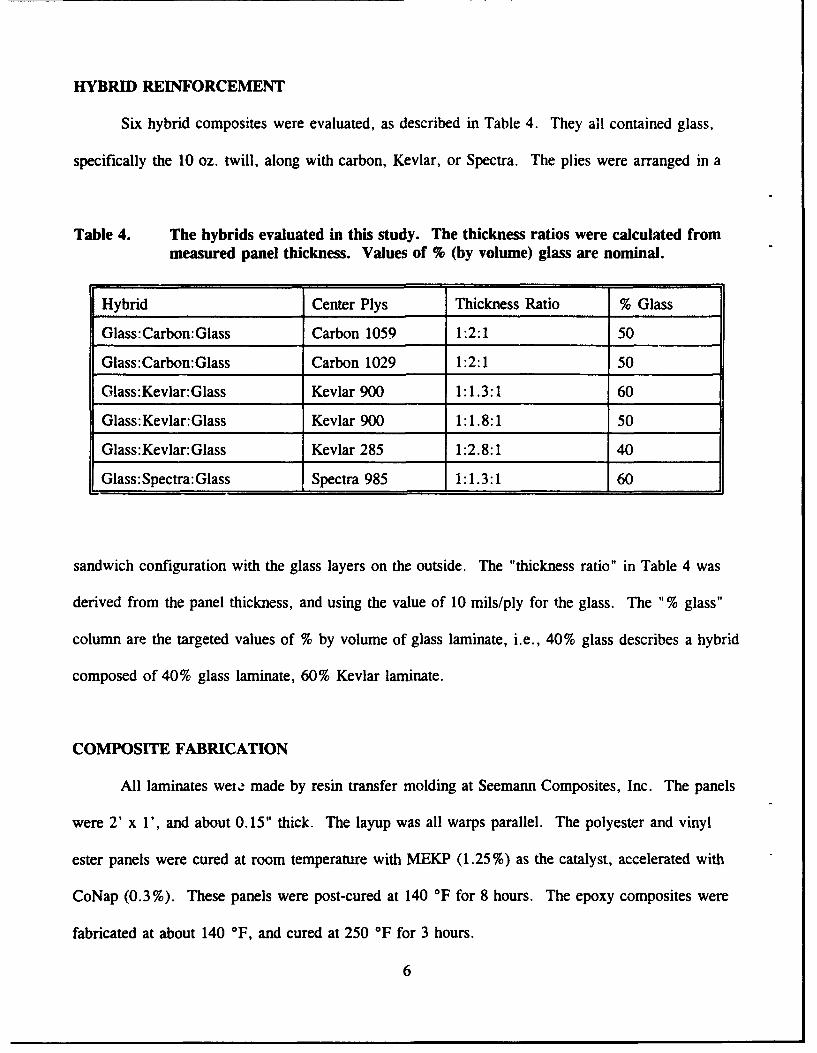
Six hybrid composites were evaluated, as described in Table 4. They all contained glass,
specifically the 10 oz. twill, along with carbon, Kevlar, or Spectra. The plies were arranged in a
Table 4. The hybrids evaluated in this study. The thickness ratios were calculated frommeasured panel thickness. Values of % (by volume) glass are nominal.
Hybrid Center Plys Thickness Ratio % Glass
Glass:Carbon:Glass Carbon 1059 1:2:1 50
Glass:Carbon:Glass Carbon 1029 1:2:1 50
Glass:Kevlar:Glass Kevlar 900 1:1.3:1 60
Glass:Kevlar:Glass Kevlar 900 1:1.8:1 50
Glass:Kevlar:Glass Kevlar 285 1:2.8:1 40
Glass: Spectra: Glass Spectra 985 1:1.3:1 60
sandwich configuration with the glass layers on the outside. The "thickness ratio" in Table 4 was
derived from the panel thickness, and using the value of 10 mils/ply for the glass. The "% glass"
column are the targeted values of % by volume of glass laminate, i.e., 40% glass describes a hybrid
composed of 40% glass laminate, 60% Kevlar laminate.
COMPOSITE FABRICATION
All laminates weie made by resin transfer molding at Seemann Composites, Inc. The panels
were 2' x 1', and about 0.15" thick. The layup was all warps parallel. The polyester and vinyl
ester panels were cured at room temperature with MEKP (1.25%) as the catalyst, accelerated with
CoNap (0.3%). These panels were post-cured at 140 'F for 8 hours. The epoxy composites were
fabricated at about 140 OF, and cured at 250 'F for 3 hours.
6

EVALUATION PROCEDURE
The composites were tested in compression, tension, flexure, short beam shear, and impact.
Some materials were tested for in-plane shear properties. Except where indicated, tensile,
compressive, and flexural properties were determined in the warp direction. Samples of the glass
panels were tested for fiber volume fraction and void content.
FIBER CONTENT AND PERCENT VOIDS
Fiber weight percent and void volume fraction were determined on the glass panels from
specific gravity measurements (ASTM D792) and ignition loss (ASTM D2584).
STRENGTH
Compression
Compression testing was done with the ASTM D695 methodology. These "dogbone"
specimens are end-loaded and side-supported, with nominal dimensions of 3.13" overall length and
0.5" wide in the gage section. The dogbone shapes are made by grinding with a Tensilcut router
and a template. Failure usually occurred in the gage, but occasionally the samples would crush at
an end.
Tension
Tensile strength was measured using the ASTM D638 methodology. These are dogbones
machined from 6" long, 3/4" wide coupons using a Tensilcut router and a template. The final
widths are nominally 1/2". Tensile strains were measured with an extensometer, and Young's
moduli determined by linear regression of the initial portion of the stress-stain curve.
7

Flexure
Flexural strength and modulus were measured with the ASTM D790 procedure (three point
bending.) The sample dimensions were about 5.5" long and 0.5" wide. The span used was 4.5".
Short Beam Shear
ASTM D2344 was used to measure SBS strength. A sample width of 0.5" was used for all
tests, and the span-to-depth ratio was kept approximately at 5.
IMPACT
Impact testing was done with a Dynatup Model 8200 drop tower. The drop weight was 15.2
lbs., and the impactor was a hemi-spherical tup with a diameter of 0.5". Impact specimens were
6"x4" panels clamped over a 5"x3" opening. Four spring-loaded clamps secure the specimen over
the rectangular hole, two along each of the 6" sides of the panels.
The tests were done at levels of 1000, 2000, 3000, 3500, 4000, 4500, and 5000 in.lbs./in, or
until penetration. Impact "level" is the energy in inch-pounds divided by the sample thickness in
inches. The data is presented by plotting the area of the daniage zone vs. impact level, the highest
level being that required for penetration. Damage area was quantified by measuring four diameters
(D) through the impact damage zone (at 00, 900, and ±450 with respect to the 6" dimension),
taking the average of these four numbers and computing the area 7rD 2a/ 4 . For the glass panels, the
damage areas were identified visually. The Kevlar and carbon reinforced laminates were
ultrasonically inspected to determine damage zone.
8

RESULTS AND DISCUSSION
All the data taken in this study is recorded in the Appendix. It will be discussed in four
sections: effect of resin, effect of glass fabric style, effect of fiber, and effect of hybrid
reinforcement.
FIBER CONTENT AND PERCENT VOIDS
Fiber contents for the seven glass laminates are compared in Figure 2. Panels reinforced
with the 24 oz. plain weave and the two twills had the highest weight percent fiber, more than 70%.
FIBER CONTENT80 80
60 60
40 .. . - 40
20 .. ... . . . 20
0 0WR 24 TWILL 10 TWILL 7701 DF1400 BIAX]AL CHOMARAT
Fig. 2. The weight % glass of the glass fabric reinforced laminates tested in this study.
Panels made with Style 7781, the stitched biaxial, the Chomarat fabric, and DF1400 contained
somewhat less fiber. The Chomarat and DF1400 materials presumably had lower fiber contents
because of the bulkiness which results from tufted or spun roving. The biaxial had lower fiber
9

contents because of the spacing between rovings. It is unclear why the textile fabric did not
impregnate to the high fiber content that SCRIMP provides to woven roving. All panels were void
free except the stitched biaxial, which had about 1 % voids. The intimate contact between rovings
caused by the stitching operation possibly led to the nominal void content in this material.
EFFECT OF RESIN
Six panels were procured from Seemann Composites, composed of different resins but all
having 24 oz. plain weave woven roving reinforcement. The effect of resin on compression,
tension, flexure, short beam shear, and impact damage is shown in Figures 3-7. It is clear from
the data that resin selection significantly effects composite properties, and that variations in both
resin modulus and failure strain caused the observed differences.
Streneth
Composite compression strength (Figure 3) increases with resin modulus for these fabric-
reinforced materials, a trend which was first reported for carbon/epoxy laminates from prepreg
tape4. The trend is also indicated in the data for unidirectional glass-reinforced vinyl ester' 6 .
Flexural strength (Figure 4) also increases with resin modulus, as it should, given that samples
deformed in flexure usually fail in compression.
The rule that composite compression (and flexural) strength is proportional to resin stiffness
is violated for the polyester. It can be postulated that the low failure strain of the polyester
precluded the composite from realizing the compression strength potential provided by the resin
modulus. Future work is planned to investigate polyesters with higher tensile failure strain (which
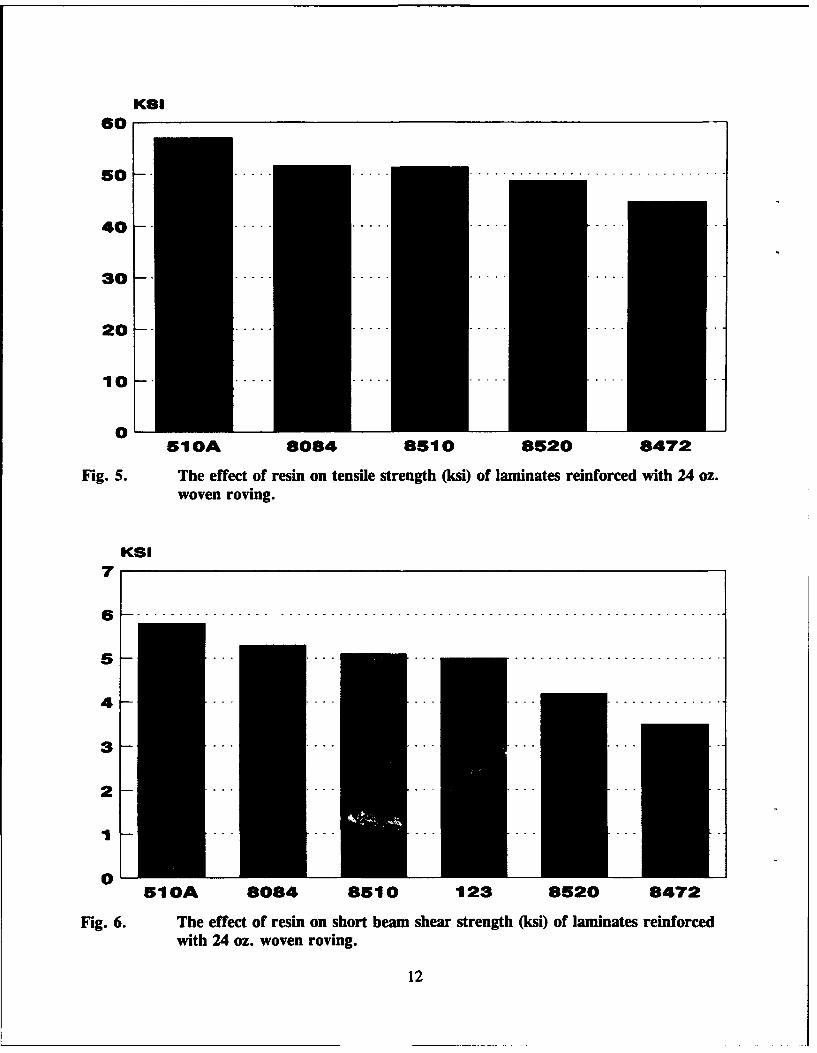
is achieved at the expense of Young's modulus). Composite tensile strength (Figure 5) was not
controlled by resin properties, as is usually reported4" 6.
10

KSI60
50
40
30
20- .
1 0 - ... .. . ...-
0510A 8084 123 8510 8520 8472
Fig. 3. The effect of resin on compression strength (ksi) of laminates reinforced with 24oz. woven roving.
KSI100
s o .......................................................80O
4 0 ............ ....
2 0 ............. ........
0510A 8084 123 8520 8510 8472
Fig. 4. The effect of resin on flexural strength (ksi) of laminates reinforced with 24 oz.woven roving.
11
KSI60
s o - .. .. . .. . . . . . . . . . . . . . . . . . . . . . . . . . . .
50
40 .. . .. .. .
3 0 .. . .. .. .. .
20 .... .............
1 0 .. . .. .. .- -
510A 8084 8510 8520 8472
Fig. 5. The effect of resin on tensile strength (ksi) of laminates reinforced with 24 oz.woven roving.
KSE7
5 . . . . . . . . . . . . . . . . . . . . . . . . . . . . . . . . . . . . . . . . . . . . . . .
4 - . ..-- -. . . . . . . . . . . . . . . . . . . ..
3 . ... .. . . . . . . . . . .
2 ......
S•. . ... . ... . ...- -. . ..
0510A 8084 8510 123 8520 8472
Fig. 6. The effect of resin on short beam shear strength (ksi) of laminates reinforcedwith 24 oz. woven roving.
12

SQUARE INCHES2.5
0 I1000 2000 3000 4000 5000
IMPACT ENERGY LEVEL (IN.LBS/IN)
-WR/8084 -+- WR/8510 -1- WR/8520
u WR/123 -K-- WR/510A -.- WR/8472
Fig. 7. The effect of resin on impact damage area (square inches) of laminates reinforcedwith 24 oz. woven roving.
Impact Resistance
The impact damage areas are given in Figure 7. It was surprising to note that the resistance
to impact damage of laminates having glass fabric reinforcement was relatively insensitive to resin
failure strain. Laminates whose resin failure strain was 6% (epoxy) did not have larger damage
areas than laminates composed of resins with 20% strain. Again, the polyester does not follow this
trend. Evidently the very low resin failure strain (2%) is below some critical value, which
precludes realization of the full deflection capable by the glass.
Summary
It should be realized that the scope of this resin evaluation was limited to basic mechanical
properties and a few resins with diverse characteristics. Under investigation was the effect of resin
13

stiffness and failure strain. It was found that composite properties increase with Young's modulus
of the resin, as long as the resin failure strain is above some critical (undetermined) value. It was
also found that increases in resin failure strain above this critical value do not improve composite
impact damage resistance.
This study was not an evaluation of the relative performance of the various manufacturers
candidate resins. Interplastics CoRezyn 8510 and 8520 were chosen for their failure strains, which
are the highest currently available. Although the formulated resin ductility of 8510 and 8520 did not
help impact damage resistance (and impaired static strength due to the accompanying low stiffness),
applications which require fatigue resistance or fracture toughness may benefit from the high resin
strain. Interplastics has a large number of vinyl ester resins, including the high modulus CoRezyn
8440, which would have performed as well as any in the study if the conclusions reached herein are
valid.
EFFECT OF GLASS FABRIC STYLE
Panels made with the seven E-glass fabrics selected for evaluation were procured from
Seemann Composites Inc., with Derakane 8084 resin. Comparison of the static strength and impact
damage resistance appears in Figures 8-12.
Strength
There was a surprisingly large effect of glass fabric selection on the strength of the
laminates, which could not in general be explained by fiber or void contents. The glass fabrics with
the best overall properties were the 10 oz. twill and 7781.
The 10 oz. twill and the textile fabric (7781) were the strongest in compression. As can be
seen in Figure 1 and Table 2, these are the two materials with the lightest (least coarse) input
14

KSI70
s o . . . . . . . . . . . . . . . . . . . . . . . . . . . . . . . . . . . . . . . . . . . . . . . . . . . . . . . . . . . . . .
5 0 . ... .... .. .. .. ... .. .. . .. .. ... . .
4 0 ... -......
20. ....
101 0 . . ... . .... . .. .- -. . ...
10 TWILL 7781 CHOMARAT 24 TWILL 24 WR BIAX]AL DF1400
Fig. 8. The effect of glass fabric on compression strength. The resin is Derakane 8084throughout. DF 1400 was tested in the fill direction.
KSU100
0 . . . . . . . . . . . . . . . . . . . . . . . . . . . . . . . . . . . . . . . . . . . . . . . . . . . . . . . . . . . .
60 ... . . ...
40 . -- ..
20 - ..
07781 24 TWILL 10 TWILL 24 WR CHOMARAT DF1400 BIAXIAL
Fig. 9. The effect of glass fabric on flexural strength. The resin is Derakane 8084throughout. DF 1400 was tested in the fill direction.
15

KS160
5 0 ........ -.. .... ...
40
30 - .. . .
20 ... ... ...... . .....
7781 10 TWILL 24 WR 24 TWILL BIAXAL DF1400 CHOMARAT
Fig. 10. The effect of glass fabric on tensile strength. The resin is Derakane 8084throughout. DF 1400 was tested in the fill direction.
KSI
6 . . . . . . . . . . . . . . . . . . . . . . . . . . . . . . . . . . . . . . . . . . . . . . . . . . . . . . ..
8
6
2... ... ..... .. .
07781 CHOMARAT 24 TWILL DF1400 24 WR 10 TWILL BIAXIAL
Fig. 11. The effect of glass fabric on SBS strength. The resin is Derakane 8084throughout. DF 1400 was tested in the fill direction.
16

rovings. This characteristic would minimize the displacement, or amplitude, of the rovings at each
crossover. An initial study of compression strength vs. amplitude of displacement is shown in
Figure 13, where the trend appears to agree with this argument.
A larger compressive strength was expected from the stitched biaxial fabric. As indicated in
Figure 13, the rovings in knitted fabric are not straight, but have a relatively small periodic
displacement from the stitch. The low compression and flexural strength values may be attributable
to the lower fiber content in this material, which appears to result from the relatively large spacings
between rovings. It should be noted that fabrics of uncrimped rovings such as the stitched biaxial
tested here possibly have superior fatigue resistance compared to woven forms of glass. There is
anecdotal evidence for this7 .
Impact Resistance
It can be seen in Figure 12 that the glass fabric style had a measurable effect on impact
damage area. A generalization can be made that the finer weaves had superior ability for impact
damage containment. Both glass twills had a 3x1 construction, but the impact resistance of the 10
oz. fabric, composed of 1200 yd./lb. rovings, was somewhat better than the 24 oz. material with
225 yd./lb. rovings. It also appears that a plain weave has superior ability at impact damage
containment than a twill, which can be seen by comparing the performances of the 24 oz. plain
weave (WR) with the 24 oz. twill in Figure 12. The stitched biaxial had relatively large impact
damage areas, but it required high levels to penetrate.
The tufted rovings of the Chomarat fabric apparently were useful for impact resistance,
possibly by increasing delamination resistance. In contrast, there was no evidence that the spun
roving in DF 1400 improved delamination resistance. We wish to note that these fabrics were all
evaluated with a high strain-to-failure resin. The spun roving in DF 1400 may improve impact
17

SQUARE INCHES2.5
.. . . . . . . . . . . . . . . . . . . . . . . . . . . . . .... . . .. E - - -
0 1 a I I I I
1000 2000 3000 4000 5000
IMPACT ENERGY LEVEL (IN.LBS/IN)
-10 TWILL +- CHOMARAT - 24 WR - 24 TWILL
->- BIAXIAL - 7781 - DF1400
Fig. 12. The effect of glass fabric on impact damage area. The resin is Derakane 8084throughout.
70
10 Twill
607781 24 Twill
"0 Chomarat 0-•50
WRC 0S40 Biaxial
DF 1400.0 30
E 200
10I00 I I I
0 200 400 600 800
Amplitude (microns)
Fig. 13. The compression strength of the glass fabrics correlates with the amplitude of
distortion of the rovings caused by the crossover in the weave.
18

damage resistance when a resin with a relatively low failure strain is used.
Woven Roving U. Woven Yarn
There are many significant differences between woven roving and woven yarn. It can be
stated that in general, material selection based on cost/property tradeoffs favor iven yarn (such as
Table 5. A comparison of the approximate cost per pound, flexural and compressionstrengths (ksi), and inputs used in three glass fabrics evaluated.
Fabric $lib Flexural Compressive Fabric InputsStrength Strength
24 oz Plain 1.25 71.9 47.8 225 yd/lb rovingWeave
10 oz Twill 2.5 76.7 61.7 1200 yd/lb roving
Style 7781 5.0 83.6 58.1 7500 yd/lb yarn
Style 7781) for properties and woven roving for cost. Our data also indicates that the light (10
oz/yd2 twill) woven roving has properties comparable to woven yarn but at much reduced cost.
These cost/property tradeoffs are summarized in Table 5.
Woven yarns, also called textile fabrics, are relatively expensive compared to woven roving
because there are many steps required for their production and loom throughputs are low. (Also, the
glass fibers in yarn have diameters from 7-10 microns, whereas filament diameters in roving are
usually 17-19 microns.) Immediately after the molten glass is extruded through the bushing and air
cooled, the filaments so-formed are sized with a protective lubricant and collected into strands of
various yield, such as 7,500, 15,000, and 22,500 yards/pound. The individua! strands are then
twisted to some specified number of turns per inch (in some cases two or more strands are twisted
19

together) to form yams. Some fabrics, like Style 7781, are woven from single, twisted yams, but
many are composed of two or more yarns which are plied together. Yarns are plied by twisting
them together, where the twist occurs in the direction opposite to that in the yarn so that the plied
yam does not take on a helical shape. The yam is then woven into a fabric with the specified
pattern. After the weaving operation, the fabric is heat cleaned to remove the size applied by the
yam manufacturer. The heat cleaned fabric is then coated with a "finish" for glass/resin adhesion.
Finishes are usually resin specific silane coupling agents: glycidyl- or amine-terminated silanes for
epoxy resins and vinyl-terminated silanes for polyesters and vinyl esters.
In contrast, woven rovings are made with fewer steps. After the filaments are extruded they
are coated with a size, composed of a resin compatible film former (usually a liquid or solid epoxy),
coupling agents, lubricants, emulsifiers, etc.8 The filaments are then gathered into a bundle called
a sliver, and the desired number of slivers are in turn assembled (without twisting) into a roving,
which are used as inputs for the weaving operation. More commonly, the slivers themselves are
used as inputs, usually called single end rovings. The most commonly used single end rovings have
yields of 217-250 yds/lb, but they are available in higher yields (such as the 1200 yds/lb roving used
to make the 10 oz. twill evaluated in this study). The sizes for rovings are usually tricompatible,
meaning they couple glass to polyesters, vinyl esters, and epoxies.
The properties of composites reinforced with textile fat-ics are in general somewhat better
than those with woven roving, which may be due to the finer inputs and resulting smaller
displacements of the former, as shown in Figure 13. It should be noted, however, that the twisting
of glass strands to make yarns, the rapid weaving operation, and the subsequent handling of the
woven yams, damage the glass. This fiber damage almost always results in lower tensile strength
than compressive strength for textile fabric laminates. In most composites, the tensile strength
exceeds the compressive strength.
20

KSI
70
6 0 .. . . . . . . . . . . . . . . . . . . . . . . . . . . . . . . . . . . . . . . . . . . . . . . . . . . . . . . . . . . . . . .!
s o - . . ... . . . . .. . . . . . . . . . . . . . . . . . . . .. I. . . . . . . . .
4 0 -. ..... ....... ...............
0 ....... .
20 .... ...
1 0 . ... . ... . .. .. .. ...-
1 OT/804 WR/51 OA WR/00s4 WR/S5 0 WR1/820 WR/8472
M Compression E Tension
Fig. 14. A comparison of tensile strength with compressive strength of woven rovingreinforced laminates.
KSI70
6 0 - - - - - - - - - - - - - - - -. . . . . . . . . . . . . . . . . . . . . . . . . . . . . . . . . . . . . . . . . . ..
5 0 .....................
40 ....
3 0 ......
20 ....
10 ....
7781/SPS?7 77•8•SPE3 13 1 ss/SpI5s 7701/8084 MEL.-R-o300B
M Compression E T'nsion
Fig. 15. A comparison of tensile strength with compressive strength of woven yarnreinforced laminates.
21

A comparison of tensile strength with compressive strength of woven roving laminates is
shown in Figure 14, and the same strength comparison of woven yarn composites is shown in
Figure 15. It is clear that the tensile strength usually exceeds the compressive. The first three
materials in Figure 15 were taken on autoclave-consolidated prepregs at the Carderock Division,
NSWC, and the fourth is the material evaluated in this study. Inspection of the textile fabric data
show tensile strength values lower than compressive, which can be taken as evidence for the rough
handling of the glass in woven yam. It is interesting to note, as shown in Figure 15, that the
compressive strength exceeds the tensile strength in MIL-R-9300B, the specification for textile fabric
reinforced epoxies.
Inspection of failed flexural coupons supports the measured values of tensile and compressive
strength. For woven roving laminates, and composites in general, flexural deformation results in
failure on the compressive surface of the sample since these materials are weaker in compression
than tension. In contrast, woven yarn laminates fail in tension when deformed in flexure due to the
relative weakness just described. Furthermore, flexural failures are sometimes observed on both
surfaces of the specimen, which almost invariably occurs when a material has approximately equal
tensile and compressive strengths.
Fiber/Matrix Adhesion
The first laminate made with 7781 reinforcement had poor properties. It was decided that
the fabric used probably had an epoxy compatible finish, and that inadequate fiber/matrix adhesion
resulted in the poor properties of this material. Since the finish was not known, it is referred to as
7781(U) in this paper. Seemann Composites subsequently procured 7781 from Hexcel finished with
F72, a vinyl ester compatible coupling agent. The strong effect of fiber/matrix adhesion can be
seen in Figures 16 and 17, which compare strength and impact resistance, respectively, for 7781(U)
22

KSI100
8 0 ........... .....................
6 0 --..----.------....
4 0 - - - - - - .- . .. . .. .... .......
2 0 . .. ... . . . . . . . .
0SBS FLEXURE COMPRESSION
FINISH U 0 FINISH F72
Fig. 16. The strength of 7781/8084 was a strong function of the finish applied to thefabric.
and 7781(F72). Glass reinforced composites will have low strength (except tensile, which does not
depend on fiber/matrix adhesion) and resistance to impact damage if an inappropriate size or finish
is applied to the glass.
Summary
The glass fabric survey reported herein indicates that for most Naval applications, the use of
textile fabrics is not recommended unless their superior drape is required. Equivalent mechanical
properties can be achieved at half the cost by a woven roving of comparable weight. Further cost
reduction is realized with heavier fabrics with only a modest decrease in mechanical performance.
23

* 6F~~ 7 Roy-o so . o
SQUARE INCHES2.5
1000 2000 3000 4000 5000
IMPACT ENERGY LEVEL (IN.LBS./IN)
-FINISH U -4- FINISH F72
Fig. 17. The impact damage area of 7781 was a strong function of the fabric finish, asshown in the graph above. The data at 1000 in.lbs/in was measured from thepanels pictured.
24

EFFECT OF FIBER
The effect of fiber type is shown in Figures 18-22. There are clearly large differences in the
properties of composites reinforced with the various available fibers. Taking strength, impact
resistance, and cost together, an overall superiority of glass is evident.
StrengLh
The compression strength data, Figure 18, shows comparable values for carbon/epoxy and
glass/vinyl ester, but low strength for carbon/vinyl ester. We have attributed the poor performance
of carbon/vinyl ester to interfacial adhesion, as discussed below.
The flexural strength of carbon/epoxy was significantly higher than that for glass/vinyl ester,
for reasons which are not clear. (As has been said, flexural deformation results in a compressive
failure, and the compression strength of carbon/epoxy and glass/vinyl ester were essentially the
same, as shown in Figure 18.). The unusually high flexural strength of the carbon/epoxy materials
may have been caused by the high uniaxial fiber content of the 5HS warp face.
The very low compression and flexural strength of the laminates reinforced with polymeric
fibers was expected, as they hE:' . often been reported9 . These materials perform well only in
tension.
Impact Resistance
The composite panels with the best resistance to low velocity impact damage had glass
reinforcement. Glass outperformed carbon, Spectra, Kevlar, and the hybrids.
The impact resistance of the carbon-reinforced materials was interesting. The carbon/vinyl
ester panels, with poor fiber/matrix adhesion, sustained large delaminations due to impact. The
spreading of the damage by delamination allowed these materials to resist penetration until 4000
25

KSI70
60
50 --.
40 -
30 ...
2 0 - ... ... --- --.
. .. .. .
20
... ...
----------........
0L106/EP 10 Twill 1030/EP 1029 105 KKVLAR SPECTRA
Fig. 18. The effect of fiber on compression strength. The resin was Derakane 8084 vinylester, except those materials indicated with EP, which had Epon 9405 epoxy.
KSI120
100
130 - . .. . . . . . . . . . . . . . ......................
80 .....
1050/EP 100/EP 10 TWILL 1029 1059 KEVLAR SPECTRA
Fig. 19. The effect of fiber on flexural strength. The resin was Derakane 8084 vinyl
ester, except those materials indicated with EP, which had Epon 9405 epoxy.
26

KS8120
s o - - . . . . . . .... . . . . . . . . . . . . . . . . . . . . . . . . . . . . . . . . . . . . . . . . . .
0 - .... ....................
40. .... ....
01029 1030/EP 1029/EP 10 Twill KEVLAR
Fig. 20. The effect of fiber on tensile strength. The resin was Derakane 8084 vinyl ester,except those materials indicated with EP, which had Epon 9405 epoxy.
KSI6
3 - . .-- . . . . . . . . . . . . . .
2 .... .. .... .... ....
4... ... .... .. .
0 i1059/EP 10 TWILL 1029 1059 KEVLAR SPECTRA
Fig. 21. The effect of fiber on SBS strength. The resin was Derakane 8084 vinyl ester,except the material indicated with EP, which had Epon 9405 epoxy.
27

SQUARE INCHES3.5
21 .. .. . . .... . . . . . . . . . . . . . . . . . . . . . . . . . . . . . . . . . . . . . .. . . . . . .
0 . j . ... .. . . . . . . . . . . . . . . . . . . . . . . . . . . . . . . . . . . . . . . .-. . . . . . . . . . . . . . . .
0.: 1 - - . . .I. . . .i .. . . ... . . . I . . . .I .. I .. . . .
1000 2000 3000 4000 6000
IMPACT ENERGY LEVEL (IN.LBS/IN)
- 10 TWILL -4- C 1029 -w- C 1059 --- KIEVLAR -><- C I 059/EP
Fig. 22. The effect of fiber on impact damage area. The resin was Derakane 8084 vinylester, except the material indicated with EP, which had Epon 9405 epoxy.
in.lbs/in. The carbon/epoxy laminates did not delaminate substantially, but this resistance to the
spread of damage caused penetration at very low impact levels.
The two polymer fiber reinforced materials did not perform as well as glass laminates. As
mentioned, the impact levels were normalized for panel thickness. If the tests had been run on a
weight basis, Kevlar and Spectra would have outperformed glass. Both the Kevlar and Spectra
panels penetrated at 4000 in.lbs/in.
The Spectra/vinyl ester panels tested in this program did not develop well defined damage
zones at the impact site, as in the case of glass, carbon, and Kevlar. The impacts resulted in large
plastic deformation of these laminates, so it was not possible to accurately determine damage areas.
28

Fiber/Matrix Adhesion
The three carbon fiber reinforced vinyl esters evaluated had low compression strength and
relatively low flexural strength compared to carbon/epoxy and glass/vinyl ester. Al: three fabrics
were composed of carbon tow which had been sized with epoxy-compatible coatings. Vinyl ester
chemistry cannot react with epoxy chemistry, and it is evident that the poor performance of carbon/
vinyl ester was caused by inadequate fiber/matrix adhesion.
SEM micrographs of a carbon/epoxy (1059/9405) failure is compared with carbon/vinyl ester
(1059/8084) in Figure 23, where a difference in level of adhesion is clear. Also presented in Figure
23 is the effect of water immersion on the flexural strength of these two materials. The flexural
strength of carbon/vinyl ester is further degraded by water, an indication of an adhesion problem.
The performance of carbon/vinyl ester in our study suggests that the development of vinyl
ester compatible sizes is necessary before these material systems achieve their full potential. It must
be noted, however, that the carbon/vinyl ester properties reported in Reference 6 did not indicate an
adhesion problem. The fiber tested in that reference was AS4, but the size was not mentioned.
EFFECT OF HYBRID REINFORCEMENT
Glass fiber is an excellent overall performer for strength, impact resistance, and cost.
However, for applications where weight is critical, glass becomes less desirable. This is shown in
Table 6, where properties on a volume basis are compared with properties on a weight basis, the
latter obtained by dividing by the composite density.
Carbon appears particularly efficient for strength/weight and stiffness/weight designs, but its
low resistance to impact damage (Figure 22), high cost, and concerns with corrosion'"] make the
general use of carbon for marine applications unlikely.
Kevlar and Spectra are competitive with glass and carbon on a weight basis in tension (the
29

IOf
!a
KSI
120
4 0 - . . . . . . .. . . . . . . . .
420-••.... ....
04p . .. . .
DRY 72 HR SOIL 5 MONTH 50C 5 MONTH RT
lEPOXY (EPON 9405) VINYL ESTER (8084)
Fig. 23. Flexural strength degradation after immersion and the appearance of dry failuresurfaces (right) indicate fiber/matrix adhesion problems in the carbon vinyl ester.Carbon/epoxy (left) appears well bonded.
30
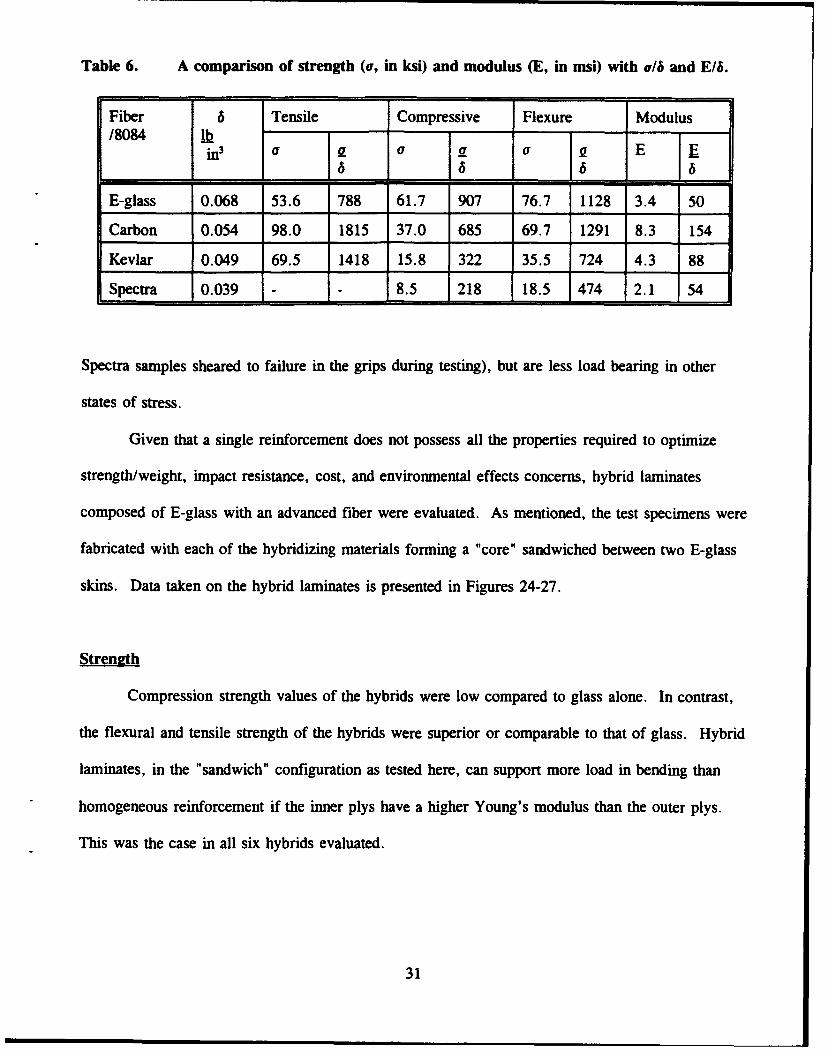
Table 6. A comparison of strength (o, in ksi) and modulus (E, in msi) with v/6 and E/6.
Fiber a Tensile Compressive Flexure Modulus/8084 lb3 a a or a E _E
E-glass 0.068 53.6 788 61.7 907 76.7 1128 3.4 50
Carbon 0.054 98.0 1815 37.0 685 69.7 1291 8.3 154
Kevlar 0.049 69.5 1418 15.8 322 35.5 724 4.3 88
Spectra 0.039 - 8.5 218 18.5 474 2.1 54
Spectra samples sheared to failure in the grips during testing), but are less load bearing in other
states of stress.
Given that a single reinforcement does not possess all the properties required to optimize
strength/weight, impact resistance, cost, and environmental effects concerns, hybrid laminates
composed of E-glass with an advanced fiber were evaluated. As mentioned, the test specimens were
fabricated with each of the hybridizing materials forming a "core" sandwiched between two E-glass
skins. Data taken on the hybrid laminates is presented in Figures 24-27.
Strength
Compression strength values of the hybrids were low compared to glass alone. In contrast,
the flexural and tensile strength of the hybrids were superior or comparable to that of glass. Hybrid
laminates, in the "sandwich" configuration as tested here, can support more load in bending than
homogeneous reinforcement if the inner plys have a higher Young's modulus than the outer plys.
This was the case in all six hybrids evaluated.
31

KS170
60
50O
40
3 0 - .. .... . .-- ....... .. . .....
20 - ... ... -- . ..
1 0 .. ..
.....- ---
I
10 TWILL 0:CI00 G:K(40%) 0:8(40%) Q:K(50%) Q:CIOGS 0:K(40%)
Fig. 24. The effect of hybrid reinforcement on compression strength. Derakane 8084 wasused throughout. The properties of an all-glass panel are included forcomparison.
KSI120
100
s o -. . . .. . . . . . . . . . .. . . . . . . . .. . .. . .. . . . . . . . . . . . . . . . . . . . . ..
Go0 ...
40
2 0 . . .. . . . . .. .- -. . .. . .
0 :1059 0:102 0:8(409%) 1OTwill G:K(60%) G:K(40@) G:K(609%)
Fig. 25. The effect of hybrid reinforcement on flexural strength. Derakane 8084 was usedthroughout. The properties of an all-glass panel are included for comparison.
32

KSI
80
60
40
20 .
0G:C 1029 G:C 1059 G:K (50%) 10 iWIiU 0:8(40%)
Fig. 26. The effect of hybrid reinforcement on tensile strength. Derakane 8084 was usedthroughout. The properties of an all-glass panel are included for comparison.
SQUARE INCHES5
1000 2000 3000 4000 5000
IMPACT ENERGY LEVEL (UN.LBS/IN)
4 10i� C 1029 (50%) �101� C 1059 (50%)-in- � 01� KEVLAR (50%) -� I 0I� SPECTRA (40%)
. I 0I� Kevlar (40%) � I 0T� Kevlar (60%)
Fig. 27. The effect of hybrid reinforcement on impact damage area. Derakane 8084 wasused throughout. Only the hybrids of Kevlar (at 40% and 50%) retained theexcellent impact resistance of glass.
33

Impact Rpsistance
The impact resistance, shown in Figure 27, was poor in general, due tn the formation of
large delaminations at the interface between hybrid layers. However, certain glass:Kevlar hybrids
were found to retain exceptional resistance to impact damage. Inspection of Figure 25 shows that
large delaminations did not occur in the Kevlar hybrids having 40% and 50% Kevlar by volume.
However, a laminate composed of 60% Kevlar did delaminate upon impact. It must be noted that,
as described in Table 4, the Kevlar hybrid composed of 60% Kevlai (40% glass) had style 285
fabric, whereas the other two hybrids had style 900. In addition, the panel thickness of the 60%
Kevlar hybrid was nominally 0.19" whereas the 40% Kevlar panel was about 0.12" thick, and the
50% Kevlar was 0.13" thick. It was not determined whether the impact resistance of glass: Kevlar
hybrids is controlled by Kevlar volume fraction, fabric style, thickness of the Kevlar plys, or overall
panel thickness.
34

SUMMARY AND CONCLUSIONS
EFFECT OF RESIN
Compression and flexural strength of glass fabric reinforced composites increased with resin
modulus if the resin failure strain was above some critical value. The impact damage resistance of
the glass laminates was independent of resin failure strain if the resin failure strain was above some
critical value. Vinyl esters and epoxies of comparable stiffness have comparable properties. The
polyester tested was inferior to epoxies and vinyl esters because of its low failure strain.
EFFECT OF GLASS FABRIC STYLE
Woven rovings were the overall best performers taking cost and properties into
consideration. There were no significant advantages to the higher cost versions of E-glass, namely,
woven yam, stitched biaxial, or spun roving. Glass/resin coupling agent was critical to the strength
and impact damage resistance.
EFFECT OF FIBER
Glass fiber was the overall best performer for strength and impact resistance. Carbon was
poor in impact, Kevlar and Spectra had low strength. The carbon/vinyl ester materials tested had
poor fiber/matrix adhesion.
EFFECT OF HYBRID
The hybrid concept evaluated, with glass outer plys and carbon, Kevlar, or Spectra inner
plys, was effective only with Kevlar. Carbon and Spectra hybrids sustained large delaminations
upon impact.
35

APPENDIX A - STRENGTH AND MODULUS DATA
36

Table A.1. The data taken in this study. Strengths are in ksi, Young's moduli in msi.
Material Compression Flexure Tension SBSStrength Strength Strength Modulus
Woven Roving/5 ilA 52.0 79.5 57.1 - 5.8
Woven Roving/8084 47.8 71.9 51.6 3.5 5.3
Woven Roving/123 43.6 70.6 - - 5.1
Woven Roving/8510 32.8 55.0 51.5 3.9 5.1
Woven Roving/8520 32.2 58.2 48.7 3.9 4.2
Woven Roving/8472 30.8 48.7 44.7 3.6 3.5
10 Twill/8084 61.7 76.7 53.6 3.4 4.9
7781/8084 58.1 83.6 56.9 3.4 7.1
Chomarat/8084 55.0 69.3 40.2 2.9 6.2
24 Twill/8084 52.9 79.1 51.3 3.1 5.7
Biaxial/8084 41.5 59.7 50.1 3.2 4.7
DF1400(Fill)/8084 39.3 61.3 47.2 3.9 5.6
DF1400(Warp)/8084 34.7 46.2 35.0 3.4 4.7
1059(XASg)/9405 64.5 100.1 89.2 8.3 5.0
1030/9405 57.2 99.2 92.0 8.5 5.0
1029(AS4W)/8084 37.0 69.7 98.0 8.3 4.9
1029(UC309)/8084 42.1 68.2 - - -
1059(XASg)/8084 29.5 60.2 - 7.9 4.4
Kevlar(900)/8084 15.8 35.5 69.5 4.3 2.4
Spectra(985)/8084 8.5 18.5 - 2.1 1.8!
G:C1029/8084 39.7 96.5 71.1 6.4 4.4
G:C1059/8084 29.0 99.3 64.2 6.1 4.3
G:K900(40%)/8084 36.7 73.9 - - -
G:K900(50%)/8084 31.8 62.6 57.5 3.7 -
G:K285(60%)/8084 23.8 75.4 - - 3.7
G:S985(40%)/8084 35.1 78.5 51.5 3.1 3.1
37

Table A.2. In-plane shear strength (S) andmodulus (Gxy).
Material Shear ShearStrength Modulus
Woven Roving/8084 9.5 0.62
10 Twil1/8084 9.4 0.58
G:K900(50%)/8084 8.1 0.44
O 4
"U1
2
C- / /
0
L /3-
0 20 40 60(ThousOnds,
STRAIN I
Fig. A.1. Shear stress/strain curve for WR/8084. The modulus in Table A.2 was
determined by the initial slope.
38

WOVEN ROVING/8084
60000 1
50000
40000 Compression
It)V)S30000 -.--
U)
20000
10000In Plane Shear
00 10000 20000 30000 40000 50000 60000
STRAIN
Fig. A.2. Woven Roving/8084 stress/strain curves for in-plane compression and shear.
39

Table A.3. Raw data for ASTM D 695 compression test.
13-15Oz Stflhed SWuO094 24oz WR/651 0Sample thicknmss width Load sigc Sample thickness width Load sag-c
1 0.175 0.507 3536 30653.5 1 0.152 0.465 2211 31261.62 0.166 0.51 3480 41105.6 2 0.151 0.467 2400 34034.33 0.173 0.51 3753 42536.6 3 0.151 0.466 2564 36262.34 0.175 0.513 3620 40323.0 4 0.152 0.468 2038 26640.35 0.174 0.506 3826 43455.5 5 0.153 0.40G 2405 33515.9
Avg. 0.173 0.500 3643 41454.8 Avg. 0.152 0.467 2324 32752.8Std. day. 0.004 0.003 145 1511.6 Std. dev. 0.001 0.002 203 290.9.
Coat of var. 2.2% 0.5% 4.0% 3.6% Coat of var. 0.6% 0.3% 8.7% 8.9%
6.Soz 776116064 (8H satin) 24oz WR6520Sample thickness width Load sig-c Sample thickness width Load sftc
1 0.151 0.5 4756 62903.4 1 0.145 0.500 2319 31420.62 0.151 0.504 3542 46541.6 2 0.146 0.506 2640 35584.93 0.151 0.506 4351 56721.8 3 0.148 0.500 2586 34354.64 0.152 0.505 4834 62975.5 4 0.147 0.507 2438 32712.15 0.15 0.496 4938 66104.4 5 0.146 0.51 1991 26730.2
Avg. 0.151 0.503 4484 50067.3 Avg. 0.146 0.506 2395 32164.3Std. dea. 0.001 0.004 572 7787.9 Std. dea. 0.001 0.001 250 3422.4
Coat of var. 0.5% 0.8% 12.8% 13.2% Coof of var. 0.8% 0.2% 10.8% 10.6%
24oz twill/6864 24 oz WR/Tactix 123Sample thickness width Load sig_c Sample thickness width Load sig-c
1 0.16 0.507 4239 52255.9 1 0.156 0.512 3515 44007.92 0.16 0.507 4366 54068.0 2 0.15 0.511 3640 47466.63 0.156 0.51 4632 58220.2 3 0.156 0.514 3578 44622.44 0.158 0.509 4104 51030.8 4 0.147 0.512 3323 44151.35 0.159 0.507 3962 49148.4 5 0.162 0.506 3107 37679.8
Avg. 0.159 0.508 4265 52944.7 Avg. 0.154 0.512 3433 43590.0Std. dev. 0.002 0.001 259 3451.2 Std. dev. 0.006 0.002 217 3594.6
Coal of var. 1.1% 0.3% 6.1% 6.5% Coat of var. 3.8% 0.4% 6.3% 8.2%
24 oz WR/8084 9.6oz twi1l/6084Sample thickness width Load sigc Sample thickness width Load sigc
1 0.146 0.47 3368 49373.4 1 0.15 0.475 4304 60407.02 0.145 0.466 2906 43051.7 2 0.155 0.465 4524 60179.63 0.145 0.465 3433 50615.8 3 0.153 0.486 4620 64621.54 0.146 0.465 3361 49506.6 4 0.153 0.464 4439 59944.45 0.145 0.465 3119 46258.8 5 0.151 0.481 4592 63223.7
Avg. 0.145 0.466 3242 47821.2 Avg. 0.152 0.482 4536 61715.2Std. dew. 0.001 0.002 222 3162.9 Std. dev. 0.002 0.004 192 2166.9
Coat of var. 0.4% 0.5% 6.9% 6.6% Coot of var. 1.3% 0.9% 4.2% 3.5%
G:K900(50%)/6084 68009m (26oz) Chomarat/084Sample thickness width Load sig_c Sample thickness width Load sic
1 0.113 0.519 1727 29447.4 1 0.192 0.51 5727 56466.52 0.112 0.511 1965 34683.4 2 0.191 0.508 5563 57334.03 0.114 0.522 2108 35423.8 3 0.195 0.508 4940 49668.84 0.116 0.515 1821 30482.1 4 0.195 0.507 5780 56463.65 0.113 0.507 1646 26730.5 5 0.195 0.508 5022 50696.5
Avg. 0.114 0.515 1857 31753.4 Avg. 0.194 0.508 5406 549d9.9Std. dev. 0.002 0.006 168 3087.4 Std. dea. 0.002 0.001 398 4314.1
Coat of var. 1.3% 1.2% 10.1% 9.7% Coat of var. 1.0% 0.2% 7.4% 7.8%
40

Table A.3. (Continued)
10.9o C1029(AS4W)/S054 9.6 TWMi 029/6014Sample thicknens width Load figc Sample th~ckness width Load $1g-_
1 0.156 0.496 2513 32347.3 1 0.172 0.493 2980 35143.22 0.156 0.505 2583 32787.5 2 0.173 0.483 3000 36010.53 0.157 0.49 2926 38034.6 3 0.173 0.494 3420 40017.84 0.157 0.485 3144 41241.6 4 0.172 0.495 3704 43504.85 0.158 0.505 3232 40506.3 5 0.17 0.485 3611 43796.2
Avg. 0.157 0.497 2860 36993.1 Avg. 0.172 0.490 3345 39004.5Std. day. 0.001 0.009 324 4217.8 Std. dev. 0.001 0.006 336 4053.8
Cost of var. 0.5% 1.8% 11.2% 11.4% Coaf of var. 0.7% 1.1% 10.0% 10.2%
G:K900(40%)/8064 9.6oz Twil/Cl 059/8064Sample thickness width Load sigc Sample thickness width Load sigo_
1 0.131 0.512 2519 37556.7 1 0.6 0.475 2256 29654.22 0.13 0.511 2283 34367.0 2 0.161 0.475 2333 30506.73 0.135 0.52 2663 37934.5 3 0.158 0.476 2075 27590.14 0.134 0.511 2671 39007.5 4 0.16 0.48 2066 23901.05 0.132 0.51 2326 34551.4 5 0.16 0.479 2327 30362.7
Avg. 0.132 0.513 2492 366083.4 Avg. 0.160 0.477 2211 29009.0Std. dev. 0.002 0.004 183 2100.0 Std. dev. 0.001 0.002 132 1657.4
Coa of var. 1.6% 0.8% 7.3% 5.7% Coat of var. 0.7% 0.5% 6.0% 5.7%
9.foz Twill/SPECTRA(40%)/8084 9.6oz Twilh/KEVLAR(60%)/8084Sample thickness width Load sigc Sample thickness width Load mig_€
1 0.134 0.472 2363 37360.9 1 0.191 0.488 2067 22390.82 0.129 0.472 2035 33422.0 2 0.188 0.492 2430 26271.43 0.129 0.47 2178 35922.8 3 0.192 0.48 2166 23719.64 0.132 0.478 2145 33995.8 4 0.187 0.484 2149 23743.85 0.131 0.476 2175 34880.4 5 0.188 0.486 2068 22633.7
Avg. 0.131 0.474 2179 35116.4 Avg. 0.160 0.486 2164 23751.9Std. dev. 0.002 0.003 118 1570.8 Std. dev. 0.002 0.004 145 1537.2
Cof of var. 1.6% 0.7% 5.4% 4.5% Col of var. 1.1% 0.9% 6.7% 6.5%
Kavlar 900/8084 DF1400(warp)/8084Sample thickness width Load sig_c Sample thickness width Load sigc
1 0.168 0.502 1404 16647.7 1 0.239 0.5 4260 35648.52 0.167 0.507 1353 15979.9 2 0.245 0.496 4124 33936.83 0.162 0.513 1331 16015.7 3 0.241 0.497 3967 33119.94 0.167 0.504 1242 14756.2 4 0.241 0.495 4148 34770.95 0 0 0 0.0 5 0.245 0.495 4359 35943.1
Avg. 0.166 0.507 1333 15849.9 Avg. 0.242 0.497 4172 34683.9Std. day. 0.003 0.005 66 791.0 Std. day. 0.003 0.002 148 1175.6
Coof of var. 1.6% 0.9% 5.1% 5.0% Coaf of var. 1.1% 0.4% 3.5% 3.4%
C1059(XASg)/e054 C1029(UC309)/8054Sample thickrMss width Load sigc Sample thickness width Load sigc
1 0.18 0.502 3150 34860.6 1 0.159 0.503 3309 41374.42 0.172 0.496 2451 28729.6 2 0.154 0.505 3194 41069.83 0.18 0.495 2562 28754.2 3 0.157 0.501 3409 43340.14 0.175 0.502 2610 29709.7 4 0.157 0.503 3432 43459.05 0.175 0.498 2217 25438.9 5 0.158 0.503 3294 41447.5
Avg. 0.176 0.499 2598 29498.6 Avg. 0.157 0.503 3328 42138.2Std. dev. 0.004 0.003 344 3406.7 Std. dev. 0.002 0.001 96 1160.9
Coat ot var. 2.0% 0.7% 13.2% 11.5% Coot of var. 1.2% 0.3% 2.9% 2.8%
41
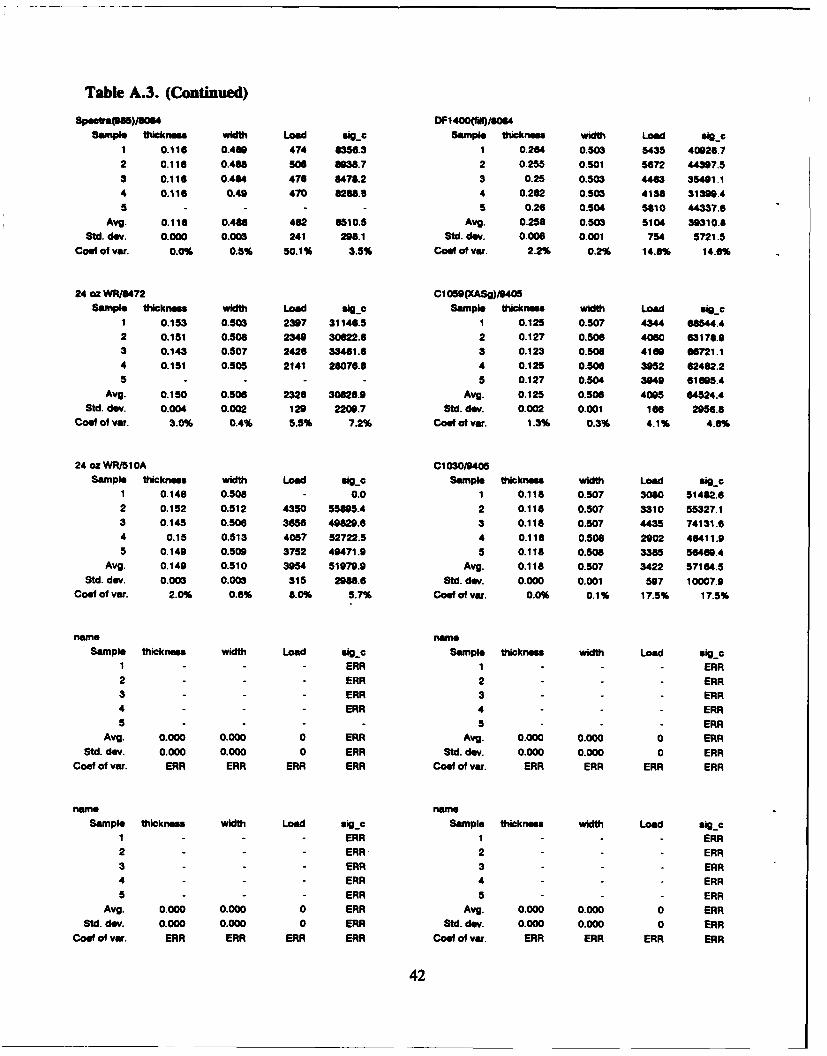
Table A.3. (Continued)Spea435 )/MoI DFi400f("/64
Sample thickness width Load Ogc Sample thickness width Load sagO1 0.116 0.449 474 6356.3 1 0.264 0.503 5435 40926.72 0.116 0.4" 506 0336.7 2 0.255 0.501 5672 44397.53 0.116 0.464 476 6476.2 3 0.25 0.503 4463 35491.14 0.116 0.49 470 6266.3 4 0.262 0.503 4138 31339.45 - - - 5 0.26 0.504 5810 44337.6
Avg. 0.116 0.466 482 8510.5 Avg. 0.258 0.503 5104 39310.5Std. dev. 0.000 0.003 241 293.1 Std. dev. 0.006 0.001 754 5721.5
Cost of var. 0.0% 0.5% 50.1% 3.5% Coal of var. 2.2% 0.2% 14.8% 14.6%
24 oz WR/8472 C1053(XASg)/9405Sample thickness width Load so0_ Sample thickness width Load siqc
1 0.153 0.503 2307 31146.5 1 0.125 0.507 4344 68544.42 0.151 0.508 2349 30622.6 2 0.127 0.506 4060 63176.93 0.143 0.507 2426 33461.6 3 0.123 0.508 4161 6872 1.14 0.151 0.505 2141 28076.6 4 0.125 0.506 3952 62462.25 - - - 5 0.127 0.504 3943 61015.4
Avg. 0.150 0.506 2328 30626.9 Avg. 0.125 0.506 4095 64524.4Std. dev. 0.004 0.002 129 2203.7 Std. dew. 0.002 0.001 166 2956.8
COW of var. 3.0% 0.4% 5.5% 7.2% Coetoa var. 1.3% 0.3% 4.1% 4.6%
24 oz WR/51OA C1 030/9405Sample thickness width Load sig_€ Sample thickness width Load sigc
1 0.146 0.508 - 0.0 1 0.118 0.507 3060 51462.62 0.152 0.512 4350 55895.4 2 0.118 0.507 3310 55327.13 0.145 0.506 3656 49020.6 3 0.118 0.507 4435 74131.64 0.15 0.513 4057 52722.5 4 0.116 0.508 2902 46411.95 0.149 0.509 3752 49471.9 5 0.118 0.508 3385 56461.4
Avg. 0.149 0.510 3954 51979.9 Avg. 0.118 0.507 3422 57164.5Std. dev. 0.003 0.003 315 2966.6 Std. dev. 0.000 0.001 597 10007.9
Coaf of var. 2.0% 0.6% 8.0% 5.7% Coef of var. 0.0% 0.1% 17.5% 17.5%
namenSample thickness width Load sig_€ Sample thickness width Load sigc
1 - ERR 1 - ERR
2 - ERR 2 - - ERR
3 - ERR 3 - - ERR
4 - ERR 4 - - ERR
5 - - - 5 - - - ERR
Avg. 0.000 0.000 0 ERR Avg. 0.000 0.000 0 ERRStd. dev. 0.000 0.000 0 ERR Std. dev. 0.000 0.000 0 ERR
Cost of var. ERR ERR ERR ERR Coet of var. ERR ERR ERR ERR
name nameSample thickness width Load sig_€ Sample thickness width Load sgc
1 - ERR 1 ERR
2 - - ERR 2 ERR
3 - - ERR 3 ERR
4 - - ERR 4 ERR
5 - - - ERR 5 - - - ERR
Avg. 0.000 0.000 0 ERR Avg. 0.000 0.000 0 ERRStd. dey. 0.000 0.000 0 ERR Std. dev. 0.000 0.000 0 ERR
CooW of var. ERR ERR ERR ERR Coof of var. ERR ERR ERR ERR
42
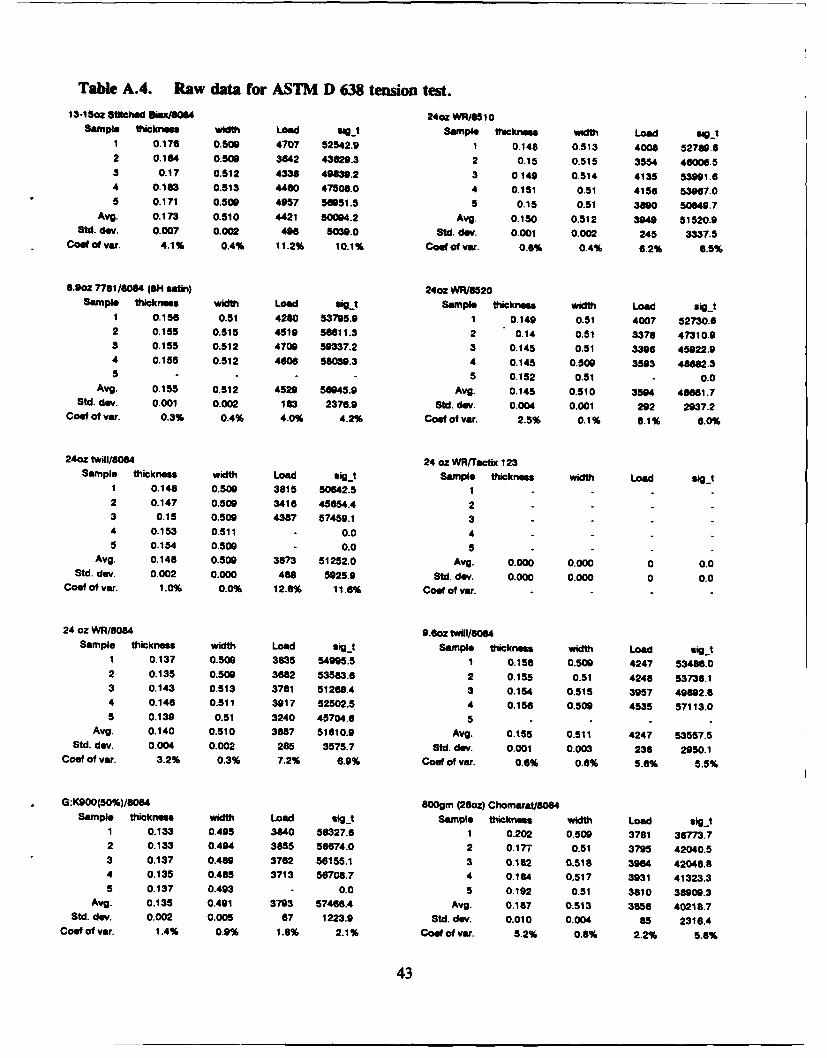
Table A.4. Raw data for ASTM D 638 tension test.13-15oz Stitched Bim/6064 24oz WR/6510
Sample thickness widh Load sigt Sample thicknesa width Load so_t1 0.176 0.509 4707 52542.9 1 0,148 0.513 4008 52719.62 0.164 0.509 3642 43629.3 2 0.15 0.515 3554 46006.53 0.17 0.512 4338 49839.2 3 0149 0.514 4135 53991.64 0.183 0.513 4460 47508.0 4 0.151 0.51 4156 53967.05 0.171 0.509 4957 56951.5 5 0.15 0.51 3890 50649.7
Avg. 0.173 0.510 4421 50094.2 Avg. 0.150 0.512 3948 51520.9Std. dew. 0.007 0.002 406 5039.0 Std. dev. 0.001 0.002 245 3337.5
Coaf of var. 4.1% 0.4% 11.2% 10.1% Coaf of var. 0.6% 0.4% 6.2% 6.5%
8.goz 7761/60/4 (am satin) 24oz WR/6520Sample thicknerss width Load sigt Sample thickners width Load sigt
1 0.156 0.51 4260 53795.9 1 0.149 0.51 4007 52730.62 0.155 0.515 4519 56611.3 2 0.14 0.51 3378 47310.93 0.155 0.512 4709 59337.2 3 0.145 0.51 3396 45022.94 0.155 0.512 4606 58039.3 4 0.145 0.509 3593 48662.35 - - - 5 0.152 0.51 - 0.0
Avg. 0.155 0.512 4529 56945.9 Avg. 0.145 0.510 3504 48661.7Std. dcy. 0.001 0.002 183 2376.9 Std. dev. 0.004 0.001 292 2937.2
Coat of var. 0.3% 0.4% 4.0% 4.2% Coat of var. 2.5% 0.1% 8.1% 6.0%
24oz twi1l/8084 24 oz WRrTactix 123Sample thickness width Load sigt Sample thickness width Load sig.t
1 0.148 0.509 3815 50642.5 12 0.147 0.509 3416 45654.4 23 0.15 0.509 4387 57459.1 34 0.153 0.511 0.0 45 0.154 0.509 - 0.0 5 - - -
Avg. 0.148 0.500 3873 51252.0 Avg. 0.000 0.000 0 0.0Std. dev. 0.002 0.000 488 5925.9 Std. dev. 0.000 0.000 0 0.0
Cot ot var. 1.0% 0.0% 12.6% 11.6% Coaf of var. - - -
24 oz WR/8084 9.Soz twIll80OSSample thickness width Load sig._t Sample thkikness width Load sig.t
1 0.137 0.500 3635 54995.5 1 0.156 0.509 4247 53486.02 0.135 0.509 3682 53583.6 2 0.155 0.51 4248 53738.13 0.143 0.513 3761 51268.4 3 0.154 0.515 3957 496892.64 0.146 0.511 3917 52502.5 4 0.156 0.509 4535 57113.05 0.139 0.51 3240 45704.6 5 - -
Avg. 0.140 0.510 3687 51610.9 Avg. 0.155 0.511 4247 53557.5Std. dev. 0.004 0.002 265 3575.7 Std. dev. 0.001 0.003 236 2950.1
Coat of var. 3.2% 0.3% 7.2% 6.9% Coaf of var. 0.6% 0.6% 5.6% 5.5%
G:K900(50%)/6084 600gm (28oz) Chomarat/8064Sample thickness width Load sig..t Sample thicknes width Load sigO
1 0.133 0.495 3840 58327.6 1 0.202 0.509 3781 36773.72 0.133 0.494 3855 58674.0 2 0.177 0.51 3795 42040.53 0.137 0.4689 3762 56155.1 3 0.182 0.516 3964 42046.84 0.135 0.465 3713 56708.7 4 0.164 0.517 3931 41323.35 0.137 0.493 - 0.0 5 0.192 0.51 3810 389009.3
Avg. 0.135 0.491 3793 57466.4 Avg. 0.167 0.513 3856 40218.7Std. dev. 0.002 0.005 67 1223.9 Std. dev. 0.010 0.004 65 2316.4
Coot of var. 1.4% 0.9% 1.6% 2.1% Coof of var. 5.2% 0.6% 2.2% 5.6%
43

Table A.4. (Continued)10.9oz CI029(AS4W)/8094 0.6 Twiil/Ci 029/1084
Sample thickness width Load sag_t Sample thickness width Load mg-t
1 0.150 0.515 8260 100873.2 1 0.177 0.404 6000 68620.1
2 0.150 0.518 7850 95310.9 2 0.177 0.480 6090 70361.5
3 0.158 0.517 7980 97691.2 3 0.177 0.460 was 73020.0
4 0.158 0.517 - 0.0 4 0.176 0.491 6177 71479.8
5 5
Avg. 0.159 0.517 8030 97958.4 Avg. 0.177 0.491 6166 71005.4
Std. dev. 0.001 0.002 210 2790.7 Std. dev. 0.001 0.002 171 2220.5
Coat of var. 0.4% 0.3% 2.6% 2.8% Coat of var. 0.3% 0.5% 2.6% 3.1%
G:KO00(40%)/6084 9.6oz Twill/C1050/8064
Sample thickness width Load sig-t Sample thicknesa width Load sigt
1 1 0.161 0.495 5213 65411.9
2 2 0.162 0.495 5216 65070.5
3 3 0.161 0.492 5042 63652.0
4 4 0.162 0.494 5011 62615.6
5 5
Avg. 0.000 0.000 0 0.0 Avg. 0.162 0.494 5121 64167.5Std. day. 0.000 0.000 0 0.0 Std. dev. 0.001 0.001 110 1295.7
Coat of var. - - - - Coal of var. 0.4% 0.3% 2.1% 2.0%
9.6oz Twill/SPECTRA(40%)/8084 9.6oz TwIiI/KEVLAR(60%)18084
Sample thickness width Load sig:t Sample thicknegs width Load sig.t
1 0.133 0.519 3863 55963.6 1
2 0.132 0.519 3395 49556.3 2
3 0.135 0.521 3454 49107.8 3
4 0.131 0.522 3507 51265.4 4
5 5Avg. 0.133 0.520 3555 51478.3 Avg. 0.000 0.000 0 0.0
Std. dev. 0.002 0.002 211 3134.1 Std. dev. 0.000 0.000 0 0.0
CooW of var. 1.3% 0.3% 5.9% 6.1% Cost of var. - -
Kev-ar 900/8084 DF1 400(warp)/8084
Sample thickness width Load sig-t Sample thickness width Load sig_t
1 0.171 1.009 11620 67347.1 1 0.253 0.514 4552 35004.1
2 0.174 1 11800 67816.1 2 0.252 0.52 4412 33669.1
3 0.17 1.011 11950 69529.3 3 0.266 0.518 4561 33101.6
4 0.171 1.000 12750 73869.3 4 0.252 0.52 4663 35564.6
5 - - - 5 0.245 0.518 4794 37774.8Avg. 0.172 1.007 12030 60647.2 Avg. 0.254 0.518 4596 35026.8
Std. dev. 0.002 0.005 499 2984.0 Std. dev. 0.008 0.002 142 1831.2
Coot of var. 1.0% 0.5% 4.1% 4.3% CoOt of var. 3.0% 0.5% 3.1% 5.2%
C1059(XASg)/8084 C1029 (UC309)/8084
Sample thickness width Load sig..t Sample thickness width Load sigt
1 - - - - 1 - - -
2 23 3
4 45 5
Avg. 0.000 0.000 0 0.0 Avg. 0.000 0.000 0 0.0
Std. dev. 0.000 0.000 0 0.0 Std. dea. 0.000 0.000 0 0.0
Coot of var. - - - CooW of var. - -
44
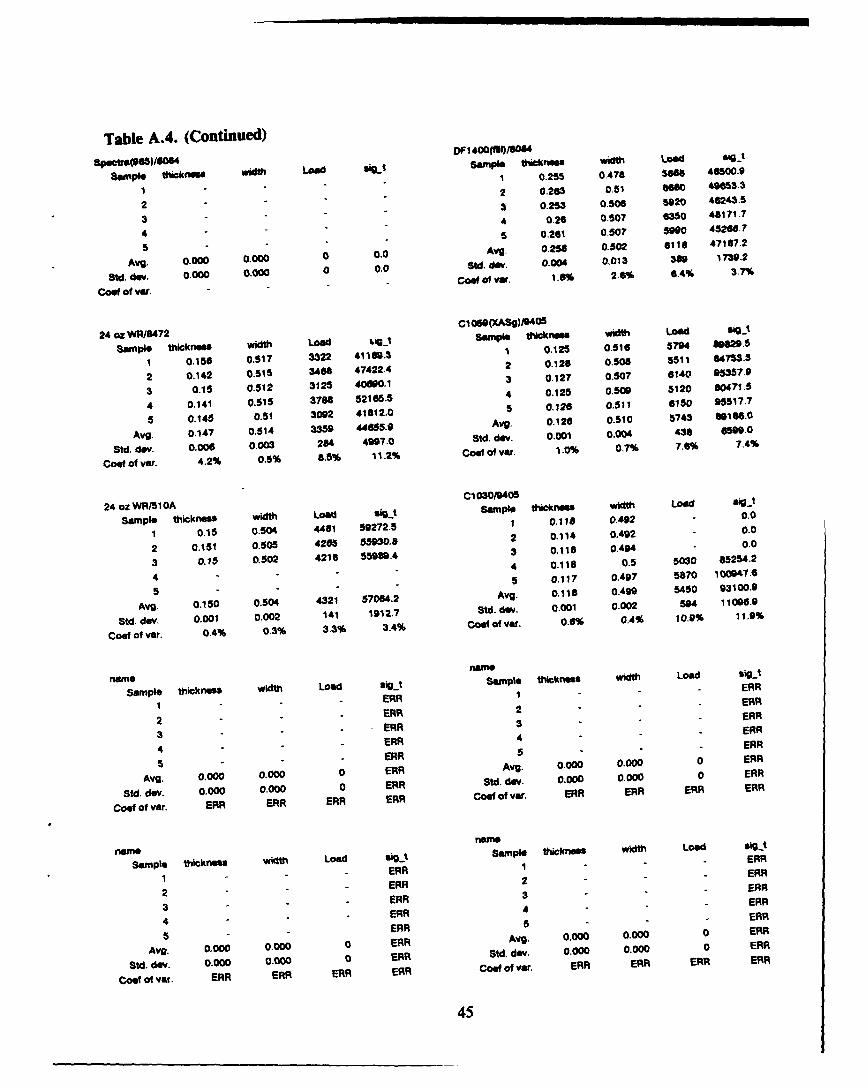
Table A.4. (Continued) DF1400IIW)/6094
sap lefteclO9 Load Sample thCknma width Loadt
Sampe -wkne" width 1 0.255 0.478 56 46500.9
1 2 0.23 0.51 6O6 49M3.3
2 3 0.253 0.506 5920 46243.5
3 4 0.26 0.507 6350 45171.7
4 5 0.261 0.507 50 45260675 -- Avg - 0.25 8 0.502 4110 47187,2
Avg. 0.000 0.000 0 0.0Av. 058 .52 61 4172
SA4. 4ev. 0.000 0.000 0 0.0 Std. dev. 0.004 0.013 360 1739.2
Coa. o v. 0 0 co Of Vat. 1.6% 2.6% 6.4% 3.7%
Coe( of var.
24 oz WR/6472 Cthk(ASQ)t9405owith oa
Sample thickness width Load 8&2_t Sampe e
1 0.150 0.517 3322 41169.3 1 0.125 0.516 5794 73.295
2 0.142 0.515 3468 47422.4 2 0.126 0.50" 5511 64753.
3 0.15 0.512 3125 40600.1 3 0.127 0.W57 6140 95357.9
4 0.141 0.515 3788 52165.5 4 0.125 0.501 5120 90471.5
5 0.145 0.51 3092 41812.0 5 0.126 0,511 6150 95517.7
Avg. 0.147 0.514 3359 44655.9 Avg. 0.126 0.510 5743 8166.0
S vg. 4ev. 0.006 0.003 254 4997.0 Std. d4ev. 0.001 0.004 438 6M99.0
Coef of vat. 4.2% 0.5% 8.5% 11.2% Coef of va. 1.0% 0.7% 7.6% 7.4%
Cl 03019405
24 ozWR/510A width Lod
Sample thickness width Load t Sample thicknes ih L2
1 0.15 0.504 4461 59272.5 1 0.118 0.692 0.0
2 0.151 0.505 4266 55930.8 2 0.114 0.492 0.0
3 0.15 0.502 4216 55969.4 3 0.118 0.494 0.0
4 4 0.118 0.5 5030 65254.2
4 5 0.117 0.497 5870 100947.65 -- Avg - 0.116 0.499 5450 93100.9
Avg. 0.150 0.504 4321 57064.2 Av. 0.1 0.0 54 9109
Std. dev. 0.001 0.002 141 1912.7 SCot. fva. 0.001 0.002 594 11006.9
Coat of var. 0.4% 0.3% 3.3% 3.4% Co of va. 0.6% 0.4 1 0.0% 11.9%
namename Load t Sample tickness width Load sigmt
Sample thickness width Lod stEARR
1 ERR 1 ERR
2 ERR 2 ERR
3 ERR 3 ERR
4 ERR 4 ERR
s ERR 5 0 ERR
Avg. 0,000 0.000 0 ERR Avg. 0.000 0.000 0 ERR
Std. dev. 0.000 0.000 0 ERR Std. dev. 0.000 0.000 0 ERR
Coof of var. ERR ERR ERR ERR CoaW of var. ERR ERR ERR ERR
name namename Sample Ohikywe width La" railt
Sample thickneO width Load sig.Sm ERR
1 ERR 1 ERR
2 ERR 2 ERR
2 ERR 3 - - ERR
3 ERR 34A
4 - ERR 4 - ERR
S- R 5 0.000 0.000 0 ERR
Avg. 0.000 0.000 0 ERR Avg. 0 ERR
Sf4. dev. 0.000 0.000 0 ERR Std. dev. 0.000 0.000 0 ERR
Coe at vat. ERR ERR ERR ERR Cooa of var. ERR ERR ERR ER
45
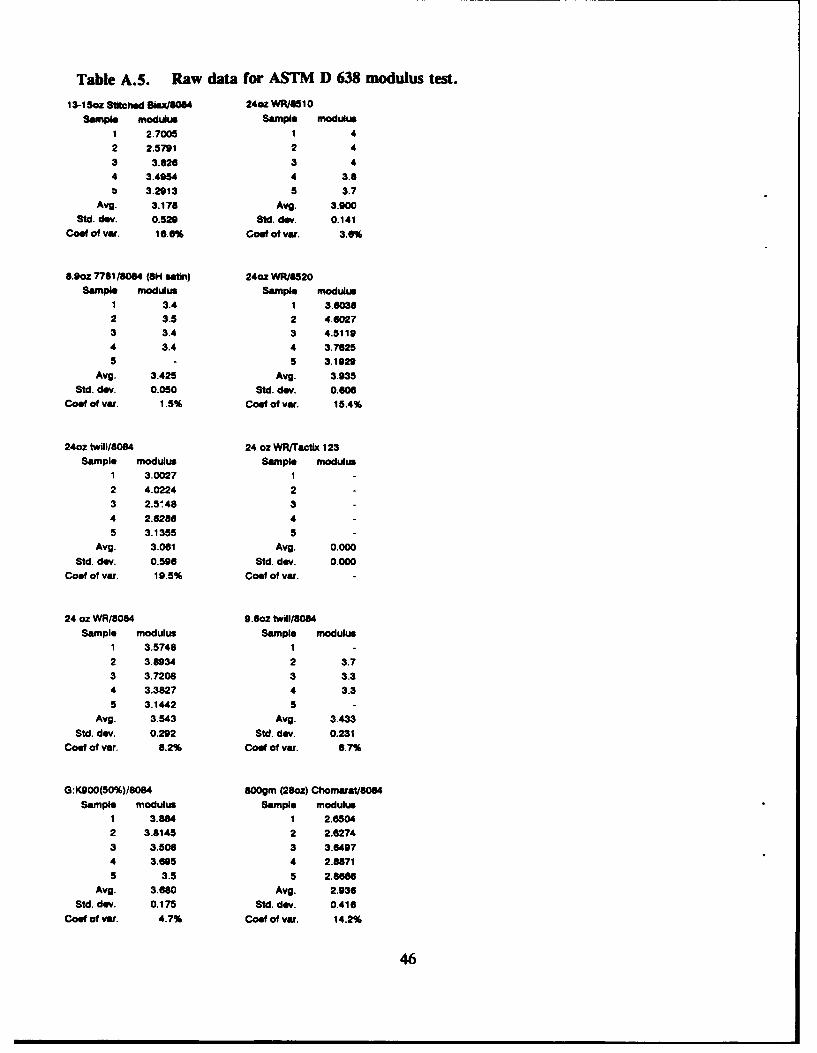
Table A.5. Raw data for ASTM D 638 modulus test.
13-1 5oz Stitched Bux1S084 240z WR/I61 0Sample modulus Sample modulus
1 2.7005 1 4
2 2.5791 2 4
3 3.826 3 4
4 3.4954 4 3.8S3.2913 5 3.7
Avg. 3.178 Avg. 3.900
Std. dev. 0.529 Std. dev. 0.141
Coos of var. 16.6% Coof of var. 3.6%
8.9oz 7781/8084 (81 satin) 24oz WR/8520
Sample modulus Sample modulus
1 3.4 1 3.6038
2 3.5 2 4.6027
3 3.4 3 4.5119
4 3.4 4 3.7625
5 - 5 3.1929
Avg. 3.425 Avg. 3.935
Std. dev. 0.050 Std. dev. 0.606
Coal of var. 1.5% Coof of var. 15.4%
24oz twill/8084 24 oz WRTacltix 123
Sample modulus Sample modulus
1 3.0027 1 -
2 4.0224 2 -
3 2.5'48 3 -
4 2.6286 4 -
5 3.1355 5 -
Avg. 3.061 Avg. 0.000
Std. dev. 0.596 Std. dev. 0.000
Coof of var. 19.5% Coof of vatr. -
24 oz WR/8084 9.6oz twill/8084
Sample modulus Sample modulus
1 3.5748 1 -
2 3.8934 2 3.73 3.7208 3 3.3
4 3.3827 4 3.3
5 3.1442 5 -
Avg. 3.543 Avg. 3°433
Std. deN. 0.292 Std. dev. 0.231
Cosf of var. 8.2% Cool of var. 6.7%
G:K900(50%)/8084 800gm (28oz) Chomaat/S854
Sample modulus Sample modulus
1 3.884 1 2.6504
2 3.8145 2 2.6274
3 3.508 3 3.6497
4 3.695 4 2.8871
5 3.5 5 2.8666
Avg. 3.680 Avg. 2.936
Std. dev. 0.175 Std. dev. 0.416
Coof of var. 4.7% Coot of var. 14.2%
46

Table A.S. (Continued)10.Soz C1029(AS4W)/I054 9.6 Twll/Cl 029/1084
Sample modulus Sample modulus1 8.3 1 6.1062 8.3 2 6.254
3 8.3 3 a.305
4 - 4 7.027
5 5Avg. 8.300 Avg. 6.423
Std dev. 0.000 Std. dev. 0.411
Coot of var. 0.0% Coof of var. 6.4%
G:KO00(40%)/804 9.6oz Twil/Cl059/8084
Sample modulus Sample modulus
1 1 5.612
2 2 5.718
3 3 6.2004 4 6.659
5 5Avg. 0.000 Avg. 8.050
Std. devN 0.000 Std. dev. 0.482
Coot of var. Coof of var. 8.0%
9.Soz Twill/SPECTRA(40%)/8084 9.6oz Twill/KEVLAR(60%)I8084
Sample modulus Sample modulus
I I
2 3 23 3.3 3
4 3.1 4
5 5Avg. 3.133 Avg. 0.000
Std. dev. 0.153 Std. dev. 0.000
Coef of var. 4.9% Coot of var. -
Kevlar 900/8084 0F1400(warp)/8084
Sample modulus Sample modulus
1 4.1395 1 5.3671
2 4.2016 2 5.0077
3 4.182 3 3.4791
4 4.693 4 2.3722
5 - 5 3.1595Avg. 4.304 Avg. 3.877
Std. dev. 0.261 Std. dev. 1.219Coef of var. 6.1% Coot of var. 32.7%
Cl 059 (XASg)/80o4 Cl 029(UC309)/8084
Sample modulus Sample modulus
1 7.8 1
2 7.6 2
3 8.1 3
4 8.1 4
5 5 -
Avg. 7.900 Avg. 0.000Std. dea. 0.245 Std. dea. 0.000
Coot of var. - Coat of var. -
47

Table A.5. (Continued)SpWtra(5)/l064 I 1400(fHI)I80S4
Sample modulus Sample modulus
1 1.66 1 3.12 2.4 2 3.4
3 3 4
4 4 3.5
5 5 3.2
Avg. 2.130 Avg. 3.440
Std. dey. 0.382 Std. dev. 0.351
CoeW of var. 17.9% Cost of var. 10.2%
24 oz WR/8472 C1059(XASg)/9405
Sample modulus Sample modulus
1 3.4846 1 8.6
2 3.854 2 a
3 3.4776 3 8.4
4 3.7537 4 -
5 3.4672 5 -
Avg. 3.614 Avg. 8.333
Std. dev. 0.194 Std. dev. 0.306
Coot of vat. 5.4% Cost of var. 3.7%
24 oz WR/51 OA C1030/9405
Sample modulus Sample modulus
1 3.6 1 8.8
2 3.6 2 8.6
3 3.9 3 8.24 - 4 6.4
5 5 8.5
Avg. 3.700 Avg. 8.500
Std. dev. 0.173 Std. dev. 0.224
Coot of var. 4.7% Coot of var. 2.6%
name name
Sample modulus Sample modulus
I - 1 -
2 2
3 3
4 4
5 5Avg. 0.000 Avg. 0.000
Std. deN. 0.000 Std. dev. 0.000
Coot of var. ERR Coof of var. EqR
name name
Sample modulus Sample modulus
1 - I -
2 2
3 3
4 4
5 5Avg. 0.000 Avg. 0.000
Std. deN. 0.000 Std. dev. 0.000
Coof of var. ERR Cofof var. ERR
48

Table A.6. Raw data for ASTM D 790 flexure test.
13-15OX Stitched Bx6W0S04 span- 4.5 24oz WR/8510 spen- 4.5Sample thickness width Load sigb Sample thickness width Load sig_b
1 0.177 0.505 129 55037.1 1 0.151 0.502 91 53664.62 0.174 0.504 131 57949.0 2 0.153 0.504 99 56640.3
3 0.182 0.503 156 63200.1 3 0.156 0.507 102 55801.64 0.177 0.504 146 62413.6 4 0.152 0.504 102 59127.15 0.174 0.509 137 60007.8 5 0.157 0.499 91 49939.6
Avg. 0.177 0.505 140 59721.5 Avg. 0.154 0.503 97 55034.6Std. dev. 0.003 0.002 11 3336.0 Std. dev. 0.003 0.003 6 3455.1
Coat of vat. 1.9% 0.5% 8.0% 5.6% Coof of var. 1.7% 0.6% 5.8% &.3%
8.9oz 7781/8084 (8H satin) span= 4.5 24oz WR/8520 span= 4.5Sample thickness width Load slgb Sample thickness width Load sigb
1 0.152 0.505 147 85043.8 1 0.148 0.502 107 65664.12 0.151 0.504 139 81645.9 2 0.148 0.505 104 63463.23 0.152 0.508 141 81090.9 3 0.147 0.503 82 50023.1
4 0.15 0.504 139 82738.1 4 0.148 0.501 88 54128.45 0.152 0.502 150 67298.0 5 0.146 0.501 90 56885.7
Avg. 0.151 0.505 143 63563.3 Avg. 0.147 0.502 94 58216.9Std. dev. 0.001 0.002 5 2579.2 Std. dev. 0.001 0.002 11 6224.4
Coal of var. 0.6% 0.4% 3.5% 3.1% Coef of var. 0.6% 0.3% 11.4% 10.7%
24oz twill/8084 span= 4.5 24 oz WR/Tactix 123 span= 4.5Sample thickness width Load sigb Sample thickness width Load sigb
1 0.157 0.497 145 79894.4 1 0.154 0.504 114 64377.92 0.158 0.507 129 68797.3 2 0.156 0.503 117 64516.7
3 0.157 0.501 155 54722.4 3 0.15 0.503 140 83499.04 0.156 0.504 150 82549.7 4 0.148 0.502 116 71209.05 0.159 0.495 147 79290.6 5 0.155 0.505 125 69543.9
Avg. 0.157 0.501 145 79050.9 Avg. 0.153 0.503 122 70629.3Std. dev. 0.001 0.005 10 6130.1 Std. dev. 0.003 0.001 11 7803.6
Coef of var. 0.7% 1.0% 6.8% 7.8% Coot of vat. 2.3% 0.2% 8.7% 11.0%
24 oz WR/8084 span= 4.5 9.6oz twill/8084 span= 4.5
Sample thickness width Load sigb Sample thickness width Load sig_b1 0.145 0.501 110 70489.2 1 0.151 0.505 134 78553.12 0.145 0.5 120 77051.1 2 0.152 0.512 130 74180.5
3 0.145 0.506 104 65985.8 3 0.149 0.511 128 76158.84 0.144 0.504 118 76213.2 4 0.15 0.505 128 76039.65 0.144 0.5 107 69661.5 5 0.154 0.502 139 78808.6
Avg. 0.145 0.502 112 71880.2 Avg. 0.151 0.507 132 76748.1
Std. dev. 0.001 0.003 7 4666.8 Std. dev. 0.002 0.004 5 1932.9Coef of var. 0.4% 0.5% 6.2% 6.5% Coof of var. 1.3% 0.8% 3.6% 2.5%
G:K900(50%)/8084 span= 4.5 80Ogrm (28oz) ChomaratV084 span= 4.5Sample thickness width Load sigb Sample thickness width Load sigb
1 0.114 0.515 61 61520.0 1 0.187 0.499 195 75431.62 0.114 0.516 62 62407.4 2 0.186 0.5 189 73751.3
3 0.114 0.516 62 62407.4 3 0.189 0.504 175 65612.74 0.117 0.514 65 62356.6 4 0.188 0.503 179 67963.15 0.116 0.514 66 64412.3 5 0.182 0.502 157 63731.9
Avg. 0.115 0.515 63 62620.7 Avg. 0.186 0.502 179 69298.2Std. dev. 0.001 0.001 2 1070.3 Std. dev. 0.003 0.002 15 5094.1
Cool of vat. 1.2% 0.2% 3.4% 1.7% Coot of var. 1.4% 0.4% 8.2% 7.4%
49
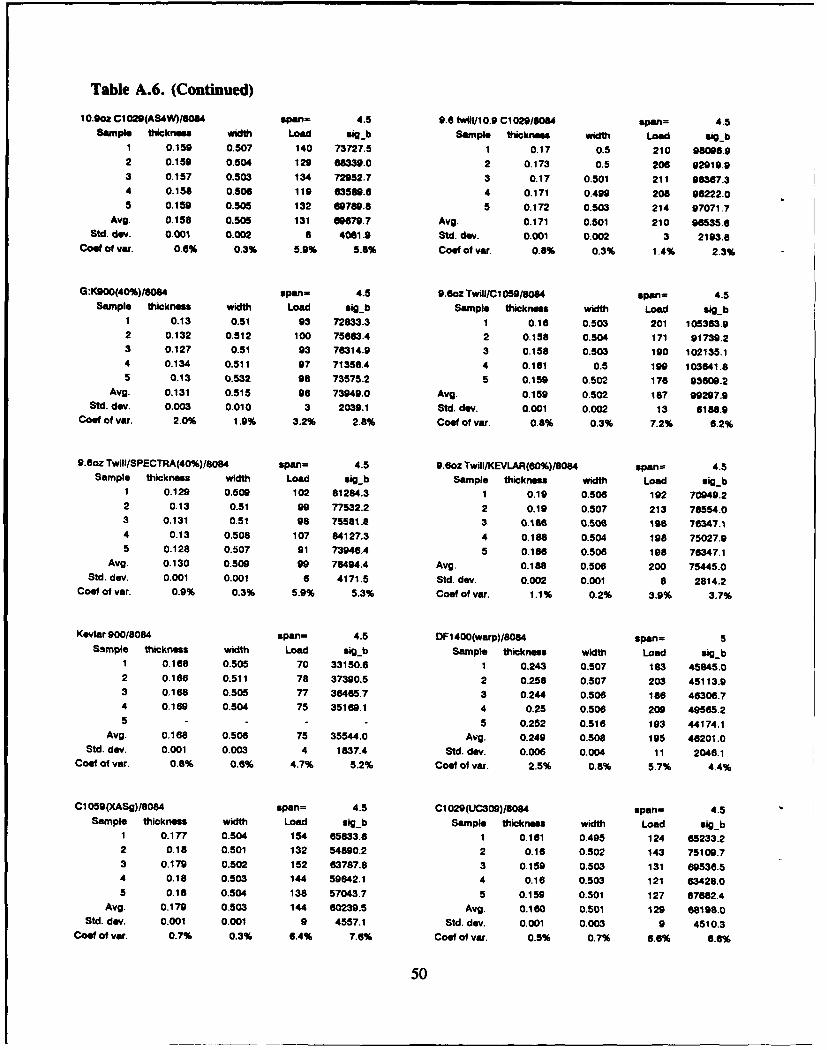
Table A.6. (Continued)
10.9oz CI 029(AS4W)/8064 open- 4.5 9.6 twill/1 0.9 Cl 029/8084 span= 4.5Sample thickness width Load sigb Sample thickness width Load ag_b
1 0.159 0.507 140 73727.5 1 0.17 0.5 210 9806.92 0.159 0.504 129 68339.0 2 0.173 0.5 206 92919.93 0.157 0.503 134 72952.7 3 0.17 0.501 211 98367.34 0.156 0.506 119 63589.6 4 0.171 0.490 208 96222.05 0.159 0.505 132 69789.8 5 0.172 0.503 214 97071.7
Avg. 0.158 0.505 131 69679.7 Avg. 0.171 0.501 210 98535.6Std. day. 0.001 0.002 8 4061.9 Std. dev. 0.001 0.002 3 2193.8
Coat of var. 0.6% 0.3% 5.9% 5.8% Coof of var. 0.8% 0.3% 1.4% 2.3%
G:K900(40%)I8064 span- 4.5 9.6oz Twil/C1 059/8084 span- 4.5Sample thickness width Load sigb Sample thickness width Load sig_b
1 0.13 0.51 93 72833.3 1 0.16 0.503 201 105363.92 0.132 0.512 100 75663.4 2 0.158 0.504 171 91739.23 0.127 0.51 93 76314.9 3 0.158 0.503 190 102135.14 0.134 0.511 97 71358.4 4 0.161 0.5 199 103641.85 0.13 0.532 98 73575.2 5 0.159 0.502 176 93609.2
Avg. 0.131 0.515 96 73949.0 Avg. 0.159 0.502 187 99297.9Std. dev. 0.003 0.010 3 2039.1 Std. dey. 0.001 0.002 13 6188.9
Coot of var. 2.0% 1.9% 3.2% 2.8% Coef of var. 0.8% 0.3% 7.2% 6.2%
9.6oz Twill/SPECTRA(40%)/8084 span= 4.5 9.6oz TwiII/KEVLAR(60%)/8084 span= 4.5Sample thickness width Load sigb Sample thickness width Load sig_b
1 0.129 0.509 102 81284.3 1 0.19 0.506 192 70949.22 0.13 0.51 99 77532.2 2 0.19 0.507 213 78554.03 0.131 0.51 98 75561.6 3 0.166 0.506 106 76347.14 0.13 0.508 107 64127.3 4 0.188 0.504 198 75027.95 0.128 0.507 91 73946.4 5 0.186 0.506 198 76347.1
Avg. 0.130 0.509 99 76494.4 Avg. 0.188 0.506 200 75445.0Std. dev. 0.001 0.001 6 4171.5 Std. dey. 0.002 0.001 8 2814.2
Coot of var. 0.9% 0.3% 5.9% 5.3% Coot of var. 1.1% 0.2% 3.9% 3.7%
Kevlar 900/8084 span= 4.5 DF1400(warp)/8084 span- 5Simple thickness width Load sigb Sample thickness width Load sigfb
1 0,168 0.505 70 33150.6 1 0.243 0.507 183 45845.02 0.166 0.511 78 37390.5 2 0.258 0.507 203 45113.93 0,168 0.505 77 36465.7 3 0.244 0.506 186 46306.74 0.169 0.504 75 35169.1 4 0.25 0.506 209 49565.25 - - - - 5 0.252 0.516 193 44174.1
Avg. 0.168 0.506 75 35544.0 Avg. 0.249 0.508 195 46201.0Std. dev. 0.001 0.003 4 1837.4 Std. dey. 0.006 0.004 11 2046.1
Coot of var. 0.8% 0.6% 4.7% 5.2% Coot of var. 2.5% 0.8% 5.7% 4.4%
C1 059(XASg)/8084 span= 4.5 C1029 (UC309)/8084 span= 4.5Sample thickness width Load sigb Sample thickness width Load sig b
1 0.177 0.504 154 65633.6 1 0.161 0.495 124 65233.22 0.18 0.501 132 54890.2 2 0.16 0.502 143 75109.73 0.179 0.502 152 63787.8 3 0.159 0.503 131 69536.54 0.18 0.503 144 59642.1 4 0.16 0.503 121 63428.05 0.18 0.504 138 57043.7 5 0.159 0.501 127 67682.4
Avg. 0.179 0.503 144 60239.5 Avg. 0,160 0.501 129 68198.0Std. dev. 0.001 0.001 9 4557.1 Std. dev. 0.001 0.003 9 4510.3
Coot of var. 0.7% 0.3% 6.4% 7.6% Coot of var. 0.5% 0.7% 6.6% 6.6%
50

Table A.6. (Continued)Spc•fra(985)/8084 span= 4.5 DF1400(fil1)/80a4 span. 5
Sample thickness width Load sigb Sample thickness width Load Wg_b1 0.116 0.500 18 17739.5 1 0.264 0.505 265 56468-72 0. 115 0.506 19 19052.1 2 0.257 0.505 289 6498333 0.115 0.509 19 19052.1 3 0.259 0.505 279 61709.64 0.116 0.508 19 18761.9 4 0.26 0.504 280 61637.15 0.116 0.51 18 17704.8 5 0.263 0.505 286 61407.9
Avg. 0.116 0.506 19 18482.1 Avg. 0.261 0.505 280 61253.3Std. dev. 0.001 0,001 1 685.9 Std. dev. 0.003 0.000 9 3051.3
Coat of var. 0.5% 0.1% 2.9% 3.7% Coef of var. 1.1% 0.1% 3.3% 5.0%
24 oz WR/8472 span- 4.5 C1059(XASg)/9405 span= 4.5Sample thickness width Load sig_b Sample thickness width Load sig_b
1 0.145 0.501 110 70489.2 1 0.127 0.508 118 97210.82 0.145 0.5 120 77051.1 2 0.124 0.503 111 96875.83 0.145 0.506 104 65985.8 3 0.13 0.507 133 104775.74 0.144 0.504 118 76213.2 4 0.13 0.508 129 101424.55 0.144 0.5 107 68681.5 5 - - -
Avg. 0.145 0.502 112 71880.2 Avg. 0.128 0.507 123 100071.7Std. dea. 0.001 0.003 7 4666.8 Std. dea. 0.003 0.002 10 3757.5
Coat of var. 0.4% 0.5% 6.2% 6.5% Cool of var. 2.2% 0.5% 8.2% 3.8%
24 oz WR/510A span= 4.5 C1030/9405 span= 4.5Sample thickness width Load sigb Sample thickness width Load sig_b
1 0.152 0.51 136 77908.6 1 0.118 0.508 105 100199.52 0.15 0.507 128 75739.6 2 0.118 0.507 104 99440.93 0.148 0.509 134 81127.4 3 0.119 0.508 104 97564.24 0.152 0.507 132 76064.6 4 0.117 0.506 104 101347.95 0.15 0.508 147 86811.0 5 0.12 0.506 105 97270.3
Avg. 0.150 0.508 135 79530.2 Avg. 0.118 0.507 104 99168.6Std. dav. 0.002 0.001 7 4598.1 Std. dev. 0.001 0.001 1 1732.1
Coeo of var. 1.1% 0.3% 5,3% 5.8% Coef of var. 1.0% 0.2% 0.5% 1.7%
name span= 4.5 name span= 4.5Sample thickness width Load sigb Sample thickness width Load sig_b
1 ERR 1 ERR
2 ERR 2 ERR3 ERR 3 ERR
4 ERR 4 ERR
5 - - - ERR 5 - - - ERR
Avg. 0.000 0.000 0 ERR Avg. 0.000 0.000 0 ERRStd. dev. 0.000 0.000 0 ERR Std. dev. 0.000 0.000 0 ERR
Coot of var. ERR ERR ERR ERR Coot of var. ERR ERR ERR ERR
name span= 4.5 name span= 4.5Sample thickness width Load sigb Sample thickness width Load sigb
1 ERR 1 ERR
2 ERR 2 ERR
3 ERR 3 ERR
4 ERR 4 ERR
5 - - ERR 5 - - - ERR
Avg. 0.000 0.000 0 ERR Avg. 0.000 0.000 0 ERRStd. dea. 0.000 0.000 0 ERR Std. dea. 0.000 0.000 0 ERR
Cool of var. ERR ERR ERR ERR Coot of var. ERR ERR ERR ERR
51

Table A.7. Raw data for ASTM D 2344 shear test.13-1Soz Stitched BiaW6064 span- 0.9 24oZ WR/651 0 span 0.9
Sample thickness width Load tau Sample thickness widtl Load tau1 0.175 0.505 589 4998.6 1 0.152 0.502 503 4944.02 0.178 0.505 526 4388.7 2 0.148 0.499 489 4966.03 0.16 0.503 602 4966.7 3 0.148 0.502 536 5410.84 0.177 0.5 600 5064.7 4 0.148 0.501 513 5168.95 0.182 0.499 515 4253.0 5 0.152 0.497 495 4914.4
Avg. 0.178 0.502 566 4742.4 Avg. 0.150 0.500 507 5084.8Std. dev. 0.003 0.003 42 380.6 Std. dea. 0.002 0.002 16 212.2
Cost of var. 1.5% 0.6% 7.5% 8.2% Cool of var. 1.5% 0.4% 3.6% 4.2%
8.9oz 7781/8084 (SH satin) span= 0.9 24oz WR/8520 span= 0.9Sample thickness width Load tamu Sample thickness width Load tau
1 0.152 0.504 730 7146.8 1 0.155 0.504 426 4089.92 0.153 0.502 738 7206.5 2 0.151 0.511 408 3965.73 0.153 0.504 729 7090.3 3 0.153 0.502 423 4130.54 0.152 0.504 720 7048.9 4 0.152 0.503 438 4296.65 0.152 0.503 731 7170.8 5 0.153 0.503 471 4590.1
Avg. 0.152 0.503 730 7132.6 Avg. 0.153 0.505 433 4214.6Std. dev. 0.001 0.001 6 83.1 Std. dev. 0.001 0.004 24 241.0
Coof of var. 0.4% 0.2% 0.9% 0.9% Coat of var. 1.0% 0.7% 5.5% 5.7%
24oz twil/8084 span= 0.9 24 oz WRfTactix 123 span= 0.9Sample thicknsss width Load tau Sample thickness width Load tau
1 0.16 0.504 615 5719.9 1 0.157 0.499 490 4690.92 0.157 0.5 612 5847.1 2 0.15 0.507 553 5453.63 0.162 0.51 601 5455.7 3 0.154 0.455 453 4848.74 0.156 0.505 586 5578.8 4 0.151 0.505 509 5006.25 0.162 0.505 625 5729.7 5 0.15 0.502 535 5328.7
Avg. 0.159 0.505 608 5686.3 Avg. 0.152 0.494 508 5065.6Std. dev. 0.003 0.004 15 151.3 Std. dea. 0.003 0.022 39 320.4
Coof of var. 1.8% 0.7% 2.4% 2.7% Coal of var. 2.0% 4.4% 7.7% 6.3%
24 az WR/8084 span= 0.9 9.6oz twi11/8084 span= 0.9Sample thickness width Load tau Sample thickness width Load tau
1 0.146 0.497 518 5354.0 1 0.157 0.501 520 4958.22 0.145 0.502 536 5522.7 2 0.15 0.501 541 5399.23 0.145 0.5 534 5524.1 3 0.156 0.499 497 4788.44 0.145 0.5 486 5027.6 4 0.157 0.501 503 4796.15 0.146 0.498 507 5229.8 5 0.156 0.5 483 4644.2
Avg. 0.145 0.499 516 5331.7 Avg. 0.155 0.500 509 4917.2Std. dea. 0.001 0.002 21 210.3 Std. dea. 0.003 0.001 22 291.4
Cool of var. 0.4% 0.4% 4.0% 3.9% Coof of var. 1.9% 0.2% 4.4% 5.9%
G:K900(50%)/8084 span= 0.9 800gm (28oz) Chomarat/8064 span= 0.9Sample thickness width Load tau Sample thickness width Load tau
1 - 1 0.185 0.502 790 6379.9
2 - - 2 0.185 0.498 768 6252.0- - - 3 0.185 0.499 719 5841.4
4 - - 4 0.187 0.499 793 6373.75 - - - - 5 0.183 0.499 757 6217.4
Avg. 0.000 0.000 0 0.0 Avg. 0.185 0.499 765 6212.9Std. dea. 0.000 0.000 0 0.0 Std. dea. 0.001 0.002 30 219.8
Coaf of var. - - - Cooa of var. 0.8% 0.3% 3.9% 3.5%
52

Table A.7. (Continued)I 0.oz C1 029(AS4W)/IOO4 span. 0.9 9.8oz twil/1 0.9 CI 029/6W04 Span- 0.9
Sample thickness width Load tau Sample thickneas width Load tau
1 0.158 0.502 515 4869.8 1 0.17 0.509 496 429901
2 0.157 0.503 535 5081.0 2 0,175 0.505 512 4345.1
3 0.158 0.503 529 4992.2 3 0.17 0.503 513 4499.5
4 0.157 0.507 522 4918.4 4 0.171 0,508 509 4394.6
5 0.150 0.44 443 4749.1 5 0.17 0.503 500 4385.5
Avg. 0.158 0.491 509 4922.1 Avg. 0.171 0.506 506 4384.7
Std. day. 0.001 0.029 38 125.3 Std. day. 0.002 0.003 8 74.4
Coat of var. 0.5% 5.8% 7.4% 2.5% Coat of var. 1.3% 0.0% 1.5% 1.7%
G:K900(40%)IS084 span- 0.9 9.6oz Twill/C1050)8084 span= 0.9
Sample thickness width Load tau Sample thickness width Load tau
1 1 0.162 0.5 458 4240.7
2 2 0.161 0.504 461 4260.9
3 - 3 0.161 0.503 457 4232.4
4 4 0.165 0.501 488 4427.5
5 . - - 5 0.162 0.502 478 4408.3
Avg. 0.000 0.000 0 0.0 Avg. 0.162 0.502 468 4314.0
Std. day. 0.000 0.000 0 0.0 Std. dev. 0.002 0.002 14 95.7
Coat of var. - - Cost of var. 1.0% 0.3% 3.0% 2.2%
9.6oz Twill/SPECTRA(40%)/8084 span= 0.9 9.6oz Twill/KEVLAR(60%)/8064 span= 0.9
Sample thickness width Load tau Sample thickness width Load tau
1 0.129 0.51 275 3135.0 1 0.188 0.504 450 3561.9
2 0.13 0.508 270 3066.3 2 0.186 0.504 464 3712.2
3 0.132 0.504 266 2998.7 3 0.187 0.503 471 3755.5
4 0.131 0.513 282 3147.2 4 0.184 0.504 471 3809.2
5 0.129 0.51 281 3203.4 5 0.186 0.503 457 3663.5
Avg. 0.130 0.509 275 3110.1 Avg. 0.186 0.504 463 3700.5
Std. dey. 0.001 0.003 7 79.1 Std. dev. 0.001 0.001 9 94.3
Coat of var. 1.0% 0.7% 2.5% 2.5% Cost of var. 0.8% 0.1% 2.0% 2.5%
Kevlar 900/8084 span= 0.9 OF1400(warp)/8084 span= 1.25
Sample thickness width Load tau Sample thickness width Load tau
1 0.169 0.514 274 2365.7 1 0.244 0.51 763 4598.6
2 0.166 0.509 278 2467.6 2 0.245 0.511 738 4421.1
3 0.167 0.505 276 2454.5 3 0.235 0.511 731 4565.5
4 0.168 0.504 281 2489.0 4 0.245 0.507 857 5174.5
5 5
Avg. 0.168 0.508 277 2444.2 Avg. 0.242 0.510 772 4689.9
Std. dev. 0.001 0.005 3 54.2 Std. day. 0.005 0.002 58 332.1
Coal of var. 0.8% 0.9% 1.1% 2.2% Coat of var. 2.0% 0.4% 7.5% 7.1%
C1059(XASg)I8084 span= 0.9 C1029(UC309)/8084 span= 0.9
Sample thickneoi. width Load tau Sample thickness width Load tau
1 0.163 0.5 569 4663.9 1 0.158 0.502 515 4869.8
2 0.18 0.505 529 4384.7 2 0.157 0.503 535 5081.0
3 0.18 0.505 534 4405.9 3 0.158 0.503 529 4992.2
4 0.175 0.5 491 4208.6 4 0.157 0.507 522 4918.4
5 0.163 0.503 562 4579.1 5 0.157 0.44 443 4809.6
Avg. 0.180 0.503 537 4444.4 Avg. 0.157 0.491 509 4934.2
Std. dev. 0.003 0.003 31 180.1 Std. dev. 0.001 0.029 38 105.9
Coef of va. 1.8% 0.5% 5.8% 4.1% Cow of var. 0.3% 5.8% 7.4% 2.1%
53
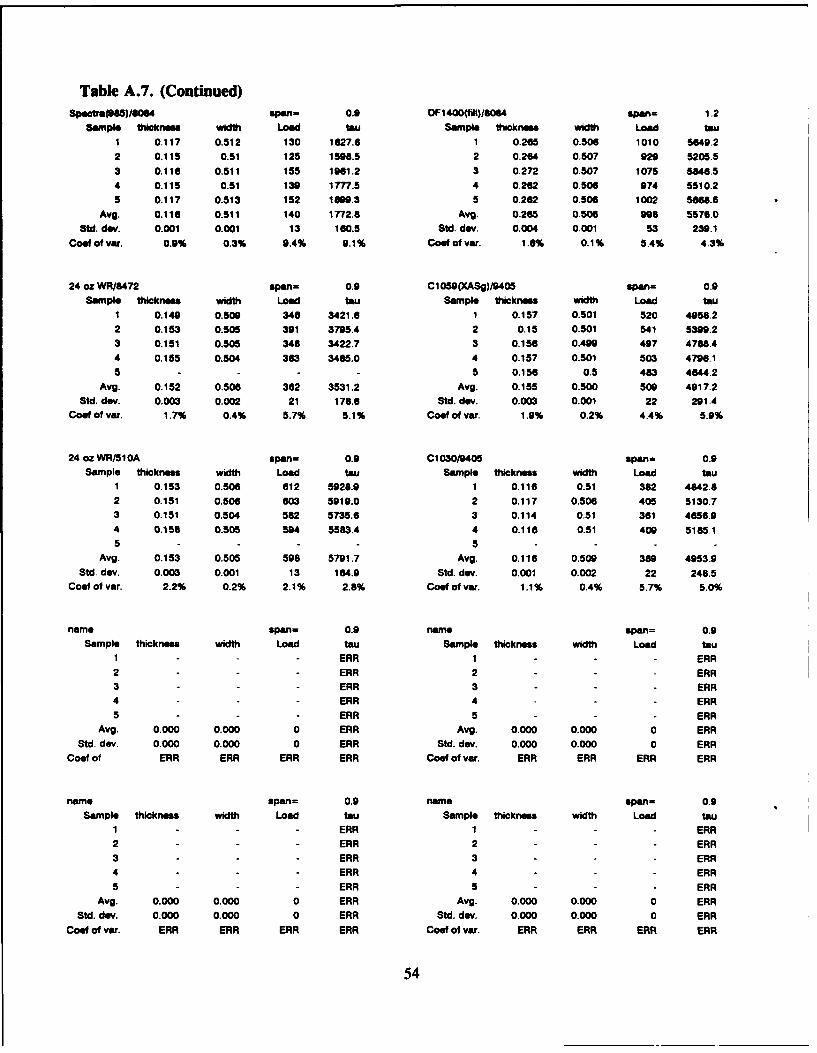
Table A.7. (Continued)Spectra(985)/804 span. 0.9 OF1400(fil)16064 span= 1.2
Sample thickne width Load tau Sample thickness width Load tau1 0.117 0.512 130 1627.6 1 0.265 0.506 1010 5649.22 0.115 0.51 125 1598.5 2 0.264 0.507 929 5205.53 0.116 0.511 155 1961.2 3 0.272 0.507 1075 5846.54 0.115 0.51 139 1777.5 4 0.262 0.506 974 5510.25 0.117 0.513 152 1699.3 5 0.262 0.506 1002 5668.6
Avg. 0.116 0.511 140 1772.6 Avg. 0.265 0.506 996 5576.0Std. dev. 0.001 0.001 13 160.5 Std. dev. 0.004 0.001 53 239.1
Coat of var. 0.9% 0.3% 9.4% 9.1% Coof of var. 1.6% 0.1% 5.4% 4.3%
24 oz WR/6472 spanr 0.9 C1059(XASg)/9405 span= 0.9Sample thickneas width Load tau Sample thickness width Load tau
1 0.148 0.509 346 3421.6 1 0.157 0.501 520 4958.22 0.153 0.505 391 3795.4 2 0.15 0.501 541 5399.23 0.151 0.505 348 3422.7 3 0.156 0.499 497 4788.44 0.155 0.504 363 3485.0 4 0.157 0.501 503 4796.15 - - - - 5 0.156 0.5 483 4644.2
Avg. 0.152 0.506 362 3531.2 Avg. 0.155 0.500 509 4917.2Std. dev. 0.003 0.002 21 178.6 Std. dev. 0.003 0.001 22 291.4
Cool of vat. 1.7% 0.4% 5.7% 5.1% Coat of vat. 1.9% 0.2% 4.4% 5.9%
24 oz WR/51 OA span- 0.9 C1 030/9405 span= 0.9Sample thickness width Load tau Sample thickness width Load tau
1 0.153 0.506 612 5928.9 1 0.116 0.51 382 4642.82 0.151 0.506 603 5919.0 2 0.117 0.506 405 5130.73 0.151 0.504 582 5735.6 3 0.114 0.51 361 4656.94 0.158 0.505 504 5583.4 4 0.116 0.51 409 5185.15 5
Avg. 0.153 0.505 598 5791.7 Avg. 0.116 0.509 389 4953.9Std. dev. 0.003 0.001 13 164.9 Std. dev. 0.001 0.002 22 248.5
Coof of var. 2.2% 0.2% 2.1% 2.8% Coof of var. 1.1% 0.4% 5.7% 5.0%
name span- 0.9 name span= 0.9Sample thickness width Load tau Sample thickness width Load tau
1 ERR 1 ERR
2 - ERR 2 ERR3 - ERR 3 ERR
4 - ERR 4 ERR
5 - - ERR 5 - - ERRAvg. 0.000 0.000 0 ERR Avg. 0.000 0.000 0 ERR
Std. dev. 0.000 0.000 0 ERR Std. dev. 0.000 0.000 0 ERRCost of ERR ERR ERR ERR Coof of var. ERR ERR ERR ERR
name span= 0.9 name span= 0.9Sample thickness width Load tau Sample thickness width Load tau
1 ERR 1 ERR
2 - ERR 2 ERR
3 - ERR 3 ERR
4 - ERR 4 ERR
5 - - - ERR 5 - - - ERR
Avg. 0.000 0.000 0 ERR Avg. 0.000 0.000 0 ERRStd. dev. 0.000 0.000 0 ERR Std. dev. 0.000 0.000 0 ERR
Coof of var. ERR ERR ERR ERR Cooa of var. ERR ERR ERR ERR
54

REFERENCES
1. W. Seemann, U.S. Patent # 4,902,215.
2. P. Puckett, Dow Chemical, personal communication.
3. Hepburn, R.D., Magliulo, G., and Wright, T., "The U.S.Navy's New Coastal Minehunter (MHC): Design, Material, andConstruction Facilities", Naval Engineers Journal, May1991, page 66.
4. Palmer, R.J., "Investigation of the Effect of Resin Materialon Impact Damage to Graphite/Epoxy Composites", NASAContractor Report 165677, March 1981.
5. White, W.D., and Barron, J.H., "Vinyl Ester Resins forMilitary and Aerospace Applications", 34th InternationalSAMPE Symposium, May 8-11, 1989.
6. Blankenship, L.T., White, M.N., and Puckett, P.M., "VinylEster Resins-Versatile Resins for Composites"' 34th SAMPESymposium, May 1989.
7. M. Russell, NSWC Norfolk Division, personal communication.
8. R. McCoy, U.S. Patent # 4,107,118.
9. Marchant, A., and Pinzelli, R.F., "Composites for MarineStructures. Where is the Future?", SAMPE Conf., Euro. Chpt.,La Baule, France, May '87.
10. Tucker, W.C., Brown, R., and Russell, L., "Corrosion Betweena Graphite/Polymer Composite and Metals", Journal ofComposite Materials, Vol. 24, January 1990, Page 92.
11. Aylor, D. and Murray, J., "The Effect of SeawaterEnvironment on the Galvanic Corrosion Behavior ofGraphite/Epoxy Composites Coupled to Metals", CDNSWC-SME-92/32 August 1992.
55

INITIAL DISTRIBUTION
Copies CENTER DISTRIBUTION
4 DTIC Copies Code Name
1 DARPA 1 0115 Caplan1 (Kelly) 10 1720.2 Mayes
1 1730.2 Critchfield1ONT 1 1730.2 Nguyen
1 225 (Sloter) 1 1730.2 Bartlett1 1730.2 Potter
7 NAVSEA 1 1730.2 Bense1 05P13 (Kadala) 1 1730.2 Purcell1 05P13 (Kurzweil) 1 1730.2 Kuo1 06Z (Cummins) 1 1720.2 Sutliff1 03P (Packard) 1 1720.2 Macander1 PMS30041 (Sheedlo) 1 1720.2 Hoffman1 PMS30041 (McGrath) 1 1720.2 Rasmussen1 PMS3003 (Hollingsworth) 1 2723 Wilhelmi
1 601 (2802) Morton2 NAVAIR 1 644 (2844) Castelli
1 5304 C2 (Moore) 20 644 (2844) Juska1 5304 C2 (Thompson) 1 644 (2844) Loup
1 644 (2844) Gipple1 NRL 1 644 (2844) Sorathia
1 6383 (Gause) 1 644 (2844) Williams1 644 (2844) Coffin
1 NSWC White Oak 1 644 (2844) Telegadas1 R31 (Augl)
2 Carderock Division, NSWCCombatant Craft Detachment1 1771 (Russell)1 1771 (Rowland)
8 Dahlgren Division, NSWCCoastal Systems Station1 2310 (Wyman)1 2310 (Richards)1 2310 (Gollwitzer)1 2310 (Lee)1 2320 (Whitfield)1 2320 (Parks)1 3220 (Howell)1 3220 (Jones)
1ONR1 1132SM (Fishman)
1 NUWC1 8215 (Tucker)
1 NAWC1 6064 (Cochran)

Mr. Bill Seemann Dr. Rolf JohnsSeemann Composites, Inc. Thiokol CorporationP.O. Box 3449 P.O. Box 707, M/S 246Gulfport, MS 39505 Brigham City, UT 84302-0707
Dr. Walter Bradley Dr. Don HunstonMechanical Engineering Dept. Polmer Composites GroupTexas A&M University NISTCollege Station, TX 77843-3141 Bldg. 224, Rm. A209
Gaithersburg, MD 20899Mr. Longin GreszczukMcDonnell Space Systems Company Dr. Forrest Sloan5301 Bolsa Avenue Allied-Signal, Inc.Huntington Beach, CA 92647 SPECTRA Composites Group
P.O. Box 31Mr. Steve Kopf Petersburg, VA 23804EI DuPont DeNemours & Co.Composites Division Mr. Tony FalconeChestnut Run Plaza Boeing Aerospace CompanyBox 80702 P.O. Box 3999, MS 73-09Wilmington DE 19880-0702 Seattle, WA 98124-2499
Dr. Don Adams Mr. Brian EcclesMechanical Engineering Dept. Intermarine USAUniv. of Wyoming P.O. Box 3045Laramie, WY 82071 Savannah, GA 31402-3045
Dr. Travis Bogetti Mr. Bill GregoryMechanics and Structures Branch CASDE CorporationU.S. BRL 2800 Shirlington RoadAberdeen, MD 21005-5066 Arlington, VA 22206
Dr. Jack Gillespie Mr. Bill Haskell IIICenter for Composite Materials Army Materials and MechanicsComposites Manufacturing Lab. Research CenterUniversity of Delaware Composites Development DivisionNewark, DE 19716 Watertown, MA 02172
Dr. Doug Cairns Mr. Eric GreeneHercules, Inc. Structural Composites, Inc.Science and Technology Dept. 18 Cushing AvenueBacchus Works Annapolis, MD 21403Magna, UT 84044-0098
Ms. Patricia HelblingDr. Mac Puckett Composites Education Assn.,Inc.Dow Chemical Company P.O. Box 130Reaction Molding & Composites Melbourne, FL 32902Applications Development LabBuilding B-2009 LCDR J. Rowland HussFreeport, Texas 77541 Supervisor of Shipbuilding,
Conversion, and RepairMr. Bryant Bernhard 14520 Porteaux Bay DriveSwiftships, Inc. Biloxi, MS 39532P.O Box 1908Morgan City, LA 70381

Dr. Jim Seferis Mr. Hugh PattersonDept. of Chemical Eng., BF-10 Atlantic Boat GroupUniversity of Washington 1850 Lake Park DriveSeattle, WA 98195 Smyrna, GA 30080
Mr. George Tunis Mr. Eric GoetzHardcore Composites Goetz Custom Sailboats19 Lukens Drive 15 Broad Common RoadNew Castle, DE 19720 Bristol, R.I. 02809
Mr. Paul Biermann Mr. Val JenkinsJohns Hopkins University Cigarette Racing TeamApplied Physics Laboratory 3131 N.E. 188th StreetJohns Hopkins Road North Miami Beach, FL 33180Laurel, MD 20707
Mr. Everett PearsonMr. Hal Coleman TPI, Inc.Fibercote Industries, Inc. P.O. Box 328P.O. Box 10001 Warron, R.I. 02885172 East Aurora St.Waterbury, CT 06725-0001 Mr. Steve Crane
Corsair MarineMr. Terry McCabe 150 Reed CourtInterplastics Corporation Chula Vista, CA 91911Commercial Resins Division1225 Wolters Blvd. Mr. Jim GardnerVadnals Heights, MN 55110-5145 Consolidated Yacht Company
775 B Taylor LaneMr. David Shepard Dania, FL 33004U.S. Coast Guard HDQRTS(G-ENE-5A) Room 6220 Mr. Rick Rust2100 Second Street SW Westport Shipyard, Inc.Washington, D.C. 20593-0001 P.O. Box 308
Westport, WA 98595Mr. Robert SchofieldNaval Architect Mr. Khiem NguyenN 1742 Shore Drive Christensen Motor Yacht CompanyMarinette, WI 54143 4400 East Columbia Way
Vancouver, WA 98661Mr. Mark LivesaySunrez Corporation Mr. Peter Wilson374 Merritt Drive Marine Construction ManagementEl Cajon, CA 92020 P.O. Box 1289
Newport, R.I. 02840Mr. Jeff DavidsonNewport News Shipbuilding Mr. Philip BeirnesBldg 600-1, Dept. E-20 North Coast Boats, Inc.4101 Washington Ave. 401 Alexander Ave. #407Newport News, VA 23607 Tacoma, WA 98421
Mr. Bruce Pfund Dr. John KunzBruce Pfund Special Projects Mega Marine Structures, Inc.RR#3, Box 419-C Shore Road 3200 W. 71st Ave., #14#7 Windover Turn Westminster, CO 80030Westerly, R.I. 02891