finaladem.alabama.gov/programs/water/wquality/tmdls/... · i / final threemile creek total maximum...
TRANSCRIPT

i /
FINAL
Threemile Creek
Total Maximum Daily Load (TMDL)
for Pathogens (Enterococci)
Assessment Unit IDs: AL03160204-0504-101, AL03160204-0504-102 Mobile County, Alabama
Alabama Department of Environmental Management
Water Division, Water Quality Branch August 2013

THREEMILE CREEK HUC 031602040504
FINAL TMDL DOCUMENT PATHOGENS (ENTEROCOCCI)
Prepared by ADEM/Water Quality Branch ii Last Revision: 08/26/2013
Table of Contents 1.0 EXECUTIVE SUMMARY ...................................................................................................................... 1
1.1 §303(d) Listing of the Impairment ............................................................................................ 2
1.2 Data Capture and Results Summary ......................................................................................... 3
1.3 TMDL Calculation Summary ...................................................................................................... 3
2.0 Introduction to TMDLs ...................................................................................................................... 6
2.1 Alabama’s TMDL Program Overview ........................................................................................ 6
2.1.1 What is a TMDL? ................................................................................................................... 6
2.1.2 §303(d) List of Impaired Waters ........................................................................................... 6
2.1.3 Causes of Impairment & Source Assessment Overview ....................................................... 7
2.1.4 TMDL Establishment & Implementation Overview .............................................................. 8
3.0 Threemile Creek Watershed Description .......................................................................................... 9
3.1 Watershed Geography .............................................................................................................. 9
3.2 Hydrology ................................................................................................................................ 11
3.3 Ecoregions in the Threemile Creek Watershed ...................................................................... 13
3.4 Soil Characteristics .................................................................................................................. 15
3.5 Slope & Erosion Potential ....................................................................................................... 16
3.6 Climate & Rainfall .................................................................................................................... 17
3.7 Land Use Assessment .............................................................................................................. 19
3.8 Special Conditions ................................................................................................................... 22
3.9 Threatened or Endangered Species ........................................................................................ 22
4.0 Problem Statement ......................................................................................................................... 23
4.1 Original Listing Information .................................................................................................... 23
4.2 Water Quality Standards & Criteria Exceeded ........................................................................ 23
5.0 Technical Basis for TMDL Development ......................................................................................... 26
5.1 Water Quality Target Identification ........................................................................................ 26
5.2 Pollutant Source Assessment .................................................................................................. 26
5.2.1 Point Source Discharges ...................................................................................................... 26
5.2.2 Nonpoint Source Assessment ............................................................................................. 30
5.2.3 Impervious Surfaces Assessment ........................................................................................ 30
5.2.4 Drainage Assessment .......................................................................................................... 31
5.3 Linkage between Numeric Targets & Sources ........................................................................ 32
5.3.1 Nonpoint Loading Information ........................................................................................... 32
5.4 Data Availability & Analysis ..................................................................................................... 33
5.4.1 Data Acquisition and Results .............................................................................................. 33
5.5 Critical Conditions ................................................................................................................... 34

THREEMILE CREEK HUC 031602040504
FINAL TMDL DOCUMENT PATHOGENS (ENTEROCOCCI)
Prepared by ADEM/Water Quality Branch iii Last Revision: 08/26/2013
5.5.1 Low Flow Estimates ............................................................................................................. 34
5.6 Margin of Safety ...................................................................................................................... 35
6.0 TMDL Development ........................................................................................................................ 36
6.1 TMDL Definition & Equations .................................................................................................. 36
6.2 Load Calculations .................................................................................................................... 36
6.2.1 Allowable Loading ............................................................................................................... 36
6.2.2 Existing Conditions .............................................................................................................. 39
6.2.3 Required Load Reductions .................................................................................................. 39
7.0 Follow-up Monitoring ..................................................................................................................... 41
8.0 Public Participation ......................................................................................................................... 42
9.0 Appendices ...................................................................................................................................... 43
9.1 References .............................................................................................................................. 43
9.2 Listing Methodology Criteria ................................................................................................... 45
9.3 Water Quality Dataset ............................................................................................................ 46
9.3.1 303(d) sampling Results (Intensive Survey) ........................................................................ 46
9.3.2 Low-flow Estimates ............................................................................................................. 50
9.4 DMR Data ................................................................................................................................ 53
9.5 Facility DMR Data (March 2011) ............................................................................................. 58
9.6 Supporting Photographs ......................................................................................................... 60
List of Maps
Map 1-1: General Location of the Threemile Creek Watershed ............................................................... viii
Map 1-2: Threemile Creek Watershed ........................................................................................................ ix
Map 3-1: The Mobile River Basin ................................................................................................................. 9
Map 3-2: Threemile Creek Watershed & Sampling Stations ..................................................................... 10
Map 3-3: Threemile Creek Level IV Ecoregions .......................................................................................... 14
Map 3-4: Hydrologic Soil Groups in the Threemile Creek Watershed ....................................................... 16
Map 3-5: Erosion Potential in the TMC Watershed ................................................................................... 17
Map 3-6: Annual Average Rainfall (in) ....................................................................................................... 17
Map 3-7: Threemile Creek Land Cover (NLCD, 2006) ................................................................................ 21
Map 5-1: NPDES & MS4 Entities in the Threemile Creek Watershed ........................................................ 29
Map 5-2: Impervious Surfaces in the Threemile Creek Watershed ........................................................... 31
Map 5-3: Drainage Characteristics of the Threemile Creek Watershed .................................................... 32
Map 5-4: Threemile Creek Pathogen TMDL Sampling Stations ................................................................. 33

THREEMILE CREEK HUC 031602040504
FINAL TMDL DOCUMENT PATHOGENS (ENTEROCOCCI)
Prepared by ADEM/Water Quality Branch iv Last Revision: 08/26/2013
List of Figures
Figure 2-1: Pathogen Source Assessment Diagram .................................................................................... 8
Figure 3-1: Illustration of Tidal Variation, Mobile River, April 2013 .......................................................... 13
Figure 3-2: Mobile, AL Climate Summary .................................................................................................. 18
Figure 3-3 Threemile Creek Land Cover (Ungrouped) ................................................................................ 19
Figure 3-4: Threemile Creek Land Cover (Grouped) .................................................................................. 20
Figure 6-1: Allowable WLA Loadings .......................................................................................................... 37
Figure 6-2: Pathogen Loading Worksheet .................................................................................................. 38
Figure 6-3: Existing Point Source Loading Calculations .............................................................................. 39
Figure 6-4: Existing Nonpoint Source Loading Calculations ....................................................................... 39
Figure 9-1: Low-flow Estimate for TMCM-5 ............................................................................................... 50
Figure 9-2: Low-flow Estimate for TMCM-4 ............................................................................................... 51
Figure 9-3: 7Q10 Analysis Graph ................................................................................................................ 52
Figure 9-4: 1Q10 Analysis Graph ................................................................................................................ 52
Figure 9-5: Wright Smith WWTP DMR Form (March 2011) ....................................................................... 58
Figure 9-6: Carlos A. Morris WWTP (March 2011) ..................................................................................... 59
List of Tables
Table 1-1: TMDL Summary ........................................................................................................................... 2
Table 1-2: Enterococci Load Reduction Requirements ................................................................................ 4
Table 1-3: Individual NPDES Point Source Reductions ................................................................................. 5
Table 1-4: Enterococci Pathogen TMDL Summary for Threemile Creek...................................................... 5
Table 3-1: Ungrouped Land Cover Statistics .............................................................................................. 19
Table 3-2: Grouped Land Cover Statistics .................................................................................................. 20
Table 4-1: Alabama Bacteriological Criteria for A&I Waterbodies ............................................................ 23
Table 5-1: Major Municipal WWTPs in the Threemile Creek Watershed .................................................. 27
Table 6-1: Enterococci Load Reduction Requirements .............................................................................. 40
Table 6-2: Individual NPDES Point Source Reductions ............................................................................... 40
Table 6-3: Enterococci Pathogen TMDL Summary for Threemile Creek.................................................... 40
Table 7-1: Surface Water Quality Monitoring Schedule ............................................................................ 41
Table 9-1: 303(d) Listing Requirements ...................................................................................................... 45
Table 9-2: 303(d) Delisting Requirements ................................................................................................. 45
Table 9-3: TMCM-5 ADEM Enterococci Data (Lower Segment) ................................................................. 46
Table 9-4: TM-1 ADEM Enterococci Data (Lower Segment) ...................................................................... 46
Table 9-5: TMCM-4 ADEM Enterococci Data (Upper Segment) ................................................................ 48
Table 9-6: TMCM-6 ADEM Enterococci Data (Upper Segment)) ............................................................... 49
Table 9-7: USGS Pathogen Indicator Data (2000-2003) (USGS, 2004) ....................................................... 50
Table 9-8: Wright Smith WWTP DMR Data ................................................................................................ 53
Table 9-9: Carlos A Morris WWTP DMR Data ............................................................................................ 55

THREEMILE CREEK HUC 031602040504
FINAL TMDL DOCUMENT PATHOGENS (ENTEROCOCCI)
Prepared by ADEM/Water Quality Branch v Last Revision: 08/26/2013
List of Pictures Picture 3-1: Drops Structures on Threemile Creek near Fillingim Street ................................................... 11
Picture 3-2: Threemile Creek below Municipal Park.................................................................................. 12
Picture 3-3: Threemile Creek at I-65 .......................................................................................................... 12
Picture 3-4: Threatened and Endangered Species in the Threemile Creek Watershed ............................ 22
Picture 9-1: Threemile Creek @ I-65 (Upstream View) – 1/29/2013......................................................... 60
Picture 9-2: Threemile Creek @ I-65 (Downstream View) – 1/29/2013 .................................................... 60
Picture 9-3: Threemile Creek @ Fillingim Street (Upstream View) – 1/29/2013 ...................................... 61
Picture 9-4: Threemile Creek @ Fillingim Street (Downstream View) – 1/29/2013 .................................. 61
Picture 9-5: Threemile Creek @ Confluence w/ TMC UT (Upstream View) – 1/29/2013 ......................... 62
Picture 9-6: Threemile Creek @ Confluence w/ TMC UT (Upstream View) – 1/29/2013 ......................... 62

THREEMILE CREEK HUC 031602040504
FINAL TMDL DOCUMENT PATHOGENS (ENTEROCOCCI)
Prepared by ADEM/Water Quality Branch vi Last Revision: 08/26/2013
Useful Acronyms & Abbreviations
A A&I - Agriculture and Industry Use
Classification
AAF - Average Annual Flow
ACES - Alabama Cooperative Extension Service
ADEM - Alabama Department of Environmental
Management
ADPH - Alabama Department of Public Health
AEMC - Alabama Environmental Management
Commission
AFO - Animal Feeding Operation
AL - Alabama; Aluminum (Metals)
AS - Arsenic
ASWCC - Alabama Soil & Water Conservation
Committee
AWIC - Alabama Water Improvement Commission
B BAT - Best Available Technology
BCT - Best Conventional Pollutant Control
Technology
BMP - Best Management Practices
BOD - Biochemical Oxygen Demand
BPJ - Best Professional Judgment
C CAFO - Confined Animal Feeding Operation
CBOD5 - Five-Day Carbonaceous Biochemical
Oxygen Demand
CBODu - Ultimate Carbonaceous Biochemical
Oxygen Demand
CFR - Code of Federal Regulations
CFS - Cubic Feet per Second
CMP - Coastal Monitoring Program
COD - Chemical Oxygen Demand
COE - Corps of Engineers (US Army)
CPP - Continuing Planning Process
CWA - Clean Water Act
CY - Calendar Year
D DA - Drainage Area
DEM - Digital Elevation Model
DMR - Discharge Monitoring Report
DNCR - Department of Conservation & Natural
Resources
DO - Dissolved Oxygen
E E. coli - Escherichia Coliform Bacteria
EOP - End of Pipe
F F&W - Fish and Wildlife Use Classification
FDA - Food and Drug Administration
Fe - Iron
FO - Field Operations
FS - Forestry Service (US)
FY - Fiscal Year
G GIS - Geographic Information Systems
GOMA - Gulf of Mexico Alliance
GPS - Global Positioning System
GSA - Geological Survey of Alabama
H HCR - Hydrographic Controlled Release
Hg - Mercury
HUC - Hydrologic Unit Code
I IBI - Index of Biotic Integrity
IF - Incremental Flow
IWC - Instream Waste Concentration
L LA - Load Allocation
Lat/Long- Latitude / Longitude
LDC - Load Duration Curve
LIDAR - Light Detection & Ranging
LWF - Limited Warmwater Fishery Use
Classification
M m3/s - Cubic Meters per Second
MAF - Mean Annual Flow (MAF = AAF)
mg/l - Milligrams per Liter
MGD - Million Gallons per Day
mi - Miles
MOS - Margin of Safety
MS4s - Municipal Separate Storm Sewer Systems
MZ - Mixing Zone
THREEMILE CREEK HUC 031602040504
FINAL TMDL DOCUMENT PATHOGENS (ENTEROCOCCI)
Prepared by ADEM/Water Quality Branch vii Last Revision: 08/26/2013
N N - Nitrogen
NA - Not Applicable
NASS - National Agricultural Statistics Service
NBODx - Nitrogenous Biochemical Oxygen Demand
NED - National Elevation Database
NH3-N - Ammonia Nitrogen
NHD - National Hydrography Database
NLCD - National Land Cover Dataset
NO3+NO2-N -Nitrate + Nitrite Nitrogen
NOAA - National Oceanic and Atmospheric
Administration
NOV - Notice of Violation
NPDES - National Pollutant Discharge Elimination
System
NPS - Non-Point Source
NRCS - National Resource Conservation Service
NTUs - Nephelometric Turbidity Units
NWS - National Weather Service
0 OAW – Outstanding Alabama Water Use
Classification
OE - Organic Enrichment
ONRW - Outstanding National Resource Water
Designation
P P - Phosphorus
Pb - Lead
PCBs - Polychlorinated Biphenyl
pH - Concentration of Hydrogen Ions Scale
POTW - Publicly Owned Treatment Works
ppb - Parts per Billion
ppm - Parts per Million
ppt - Parts per Trillion
PS - Point Source
PWS - Public Water Supply Use Classification
PWSS - Public Water Supply System
Q Q - Flow (MGD, m3/s, cfs)
QA/QC - Quality Assurance / Quality Control
QAPP - Quality Assurance Project Plan
R RRMP - River and Reservoirs Monitoring Program
RSMP - River and Streams Monitoring Program
S S - Swimming and Other Whole Body Waters
Contact Sports Use Classification
SH - Shellfish Harvesting Use Classification
SID - State Indirect Discharge
SMZ - Streamside Management Zone
SOD - Sediment Oxygen Demand
SOP - Standard Operating Procedure
SRF - State Revolving Fund
SSO - Sanitary Sewer Overflow
STP - Sewage Treatment Facility
SW - Surface Water
SWMP - Stormwater Management Plan
SWQM - Spreadsheet Water Quality Model (AL)
SWQMP - Surface Water Quality Monitoring Program
T TBC - Technology-Based Controls
TBD - To be Determined
TDS - Total Dissolved Solids
TKN - Total Kjeldahl Nitrogen
TMDL - Total Maximum Daily Load
TON - Total Organic Nitrogen
TOT - Time of Travel
Total P - Total Phosphorus
TSS - Total Suspended Solids
TVA - Tennessee Valley Authority
U UAA - Use Attainability Analysis
UIC - Underground Injection Control
USDA - United Stated Department of Agriculture
USGS - United States Geological Survey
USEPA - United States Environmental Protection
Agency
USFWS - United States Fish & Wildlife Services
UT - Unnamed Tributary
UV - Ultraviolet Radiation
W WCS - Watershed Characterization System
WET - Whole Effluent Toxicity
WLA - Wasteload Allocation
WMA - Wildlife Management Area
WPCP - Wastewater Pollution Control Plant
WQB - Water Quality Branch
WRDB - Water Resources Database
WTP - Water Treatment Plant
WWTF - Wastewater Treatment Facility
WWTP - Wastewater Treatment Plant
WY - Water Year

THREEMILE CREEK HUC 031602040504
FINAL TMDL DOCUMENT PATHOGENS (ENTEROCOCCI)
Prepared by ADEM/Water Quality Branch viii
Last Revision: 08/26/2013
Map 1-1: General Location of the Threemile Creek Watershed

THREEMILE CREEK HUC 031602040504
FINAL TMDL DOCUMENT PATHOGENS (ENTEROCOCCI)
Prepared by ADEM/Water Quality Branch ix
Last Revision: 08/26/2013
Map 1-2: Threemile Creek Watershed

THREEMILE CREEK HUC 031602040504
FINAL TMDL DOCUMENT PATHOGENS (ENTEROCOCCI)
Prepared by ADEM/Water Quality Branch 1 / 62
Last Revision: 08/26/2013
Threemile Creek Pathogen TMDL (Enterococci)
1.0 EXECUTIVE SUMMARY
Embedded in an industrialized urban area, nearly all of Threemile Creek’s (TMC) 30-
square-mile drainage area is contained within the incorporated limits of the City of
Mobile, with smaller portions located in the City of Prichard and unincorporated areas
of west Mobile. It begins as a small freshwater creek and meanders eastward through
nearly 15 miles of city landscape, ultimately transforming into a broad and deep
tidally-influenced estuarine stream before flowing into the Mobile River. As a result
of this watershed’s abundance of high-use areas and growing population densities, as
well as municipal and industrial infrastructure, TMC is very susceptible to water
quality impairment from both point and nonpoint sources.
Pursuant to Section §303(d) of the Clean Water Act (CWA) and the United States
Environmental Protection Agency’s (USEPA) Water Quality Planning and Management
Regulations (40 CFR Part 130), states are required to identify waterbodies which are
not meeting their designated uses and then determine the Total Maximum Daily Load
(TMDL) for pollutants causing the use impairment. A TMDL is the maximum amount of
pollutant a waterbody can assimilate while meeting all applicable water quality
standards. All TMDLs include a wasteload allocation (WLA) for all National Pollutant
Discharge Elimination System (NPDES)-regulated discharges (point sources), a load
allocation (LA) for all nonpoint sources, and an explicit and/or implicit margin of
safety (MOS). TMDLs provide the framework that allows states to establish and
implement pollution control and management plans with the ultimate goal indicated
in §101(a)(2) of the CWA: “water quality which provides for the protection and
propagation of fish, shellfish, and wildlife, and recreation in and on the water,
wherever attainable” (USEPA, 1991).
Several segments in the Threemile Creek watershed have been identified as impaired
waters, some of which already have USEPA-approved TMDLs. Namely, TMC has an
existing TMDL for organic enrichment/dissolved oxygen (OE/DO) that was completed
in 2007, while Toulmins Spring Branch and an Unnamed Tributary of Threemile Creek
both have pathogen TMDLs that were completed in 2009. This specific TMDL,
however, explicitly addresses two segments on the lower mainstem of TMC that have
been identified as impaired for pathogens (Enterococci). Map 1-1: General Location
of the Threemile Creek Watershed and Map 1-2: Threemile Creek Watershed offer a
general geographic representation of the watershed, while Table 1-1 on the following
page presents an overview of the TMDL.

THREEMILE CREEK HUC 031602040504
FINAL TMDL DOCUMENT PATHOGENS (ENTEROCOCCI)
Prepared by ADEM/Water Quality Branch 2 / 62
Last Revision: 08/26/2013
Table 1-1: TMDL Summary
Threemile Creek Pathogen TMDL Summary
Impaired Waterbody Threemile Creek
Use Classification Agricultural & Industrial Water Supply (A&I)
River Basin Mobile
County Mobile (FIPS 097)
12-Digit HUC 031602040504
HUC-12 Name Toulmins Spring Branch - Threemile Creek
Assessment Units AL03160204-0504-101 (2.04 miles - lower) AL03160204-0504-102 (4.34 miles - upper)
Total Length = 6.38 miles
Coordinates (at mouth) (-88.043700°, 30.725966°)
Total Watershed Area 29.68 mi² / 18,993 acres
Year Listed 2004
Date of Data 2000-2001
Water Quality Impairment Pathogens
Pathogen WQ Criteria (Coastal Waters)
Enterococci (colonies /100 ml) Single-sample Maximum ≤ 500
Major Sources Collection system failure Municipal Infrastructure
Urban runoff / storm sewers
Loading Capacity (TMDL - MOS)
2.68 E+12 colonies / day
Wasteload Allocation 3.19 E+11 colonies / day
Load Allocation 2.36 E+12 colonies / day
Margin of Safety 2.97 E+11 colonies / day
Percent Reduction 97%
1.1 §303(d) Listing of the Impairment
These two segments of Threemile Creek were originally placed on Alabama’s 2004
§303(d) List of Impaired Waterbodies for pathogens based on data collected in 2000-
2001 by the United States Geological Survey (USGS). In accordance with Alabama’s
Water Quality Assessment and Listing Methodology, an Agricultural and Industrial

THREEMILE CREEK HUC 031602040504
FINAL TMDL DOCUMENT PATHOGENS (ENTEROCOCCI)
Prepared by ADEM/Water Quality Branch 3 / 62
Last Revision: 08/26/2013
Water Supply (A&I) waterbody can be placed in Category 5 (303(d) listed waterbodies
that require a TMDL) for bacteriological impairment if more than 10% of single
samples exceed the criteria. Of the samples collected by USGS, 43% exceeded the
state’s bacteriological criteria for fecal coliform. In January of 2010, Alabama
adopted Enterococci as the indicator bacteria for coastal waters, thus the loadings in
this TMDL are expressed accordingly. Subsequent sampling in the TMC watershed has
continued to show impairment with respect to pathogens.
The lower listed segment of Threemile Creek (AL03160205-0504-101) spans 2.04 miles
from its confluence with the Mobile River upstream to the mouth of Toulmins Spring
Branch. The upper segment (AL03160205-0504-102) extends 4.34 miles farther
upstream and ends at Mobile Street. The entire mainstem of TMC holds an A&I use
classification. A detailed description of the TMC watershed can be found in section
3.0 Threemile Creek Watershed Description.
1.2 Data Capture and Results Summary
Following its listing in 2004, stations on the impaired portions of TMC were sampled
by ADEM for both Enterococci and fecal coliform. Per ADEM TMDL development
guidelines, only the Enterococci data collected in the previous 6 years was chosen to
represent the “existing condition” considered in this TMDL. ADEM collected
bacteriological data at 4 sampling locations, two on each listed segment. Over 90
individual samples were collected, including geometric means at 3 of the 4 stations.
The A&I use classification only has a single-sample criteria for Enterococci. Full
datasets listed by sampling station can be found in section 9.3 Water Quality Dataset
of this report. Further review of the general water quality and intensive Enterococci
study revealed that the segments of Threemile Creek listed for pathogens were still
not meeting the water quality criterion applicable to the A&I use classification. Over
the course of the intensive survey during the spring and summer of 2011, exceedances
were observed at all 4 stations with an occurrence rate of around 30%. Therefore, a
TMDL has been developed to bring the waterbody into compliance with water quality
standards of the State of Alabama.
1.3 TMDL Calculation Summary
For some pollutants, TMDLs are expressed on a mass loading basis (e.g. pounds per
day). However, for pathogens, TMDL loads are typically expressed in terms of
organism counts per unit volume (colonies/100 ml) or per unit time (colonies/day), in
accordance with 40 CFR 130.2(i). In this instance, streamflow was taken into
consideration, and loadings are expressed in the form of colonies/day (col/day). A
THREEMILE CREEK HUC 031602040504
FINAL TMDL DOCUMENT PATHOGENS (ENTEROCOCCI)
Prepared by ADEM/Water Quality Branch 4 / 62
Last Revision: 08/26/2013
percent reduction was calculated in order to quantify the necessary decrease in
bacteria loading. The highest single-sample exceedance was selected as the existing
condition, while the allowable condition was set to the pathogen criteria for a coastal
A&I waterbody (Enterococci).
After calculating the percent reduction, a method similar to a mass balance was used
for calculating the pathogen TMDL for Threemile Creek. Existing loads (in col/day)
were calculated by multiplying the Enterococci concentrations (col/100 ml) by the
instream flows at the time and location where the samples were collected. As
mentioned previously, the existing condition was calculated using the highest single-
sample exceedance event of 12,000 col/100 ml measured at station TMCM-5, which is
located just downstream of the confluence of Threemile Creek and Toulmins Spring
Branch. In the absence of measured streamflow for Threemile Creek, flow was
estimated using real-time USGS data for nearby Chickasaw Creek and ratioed based on
contributing drainage area.
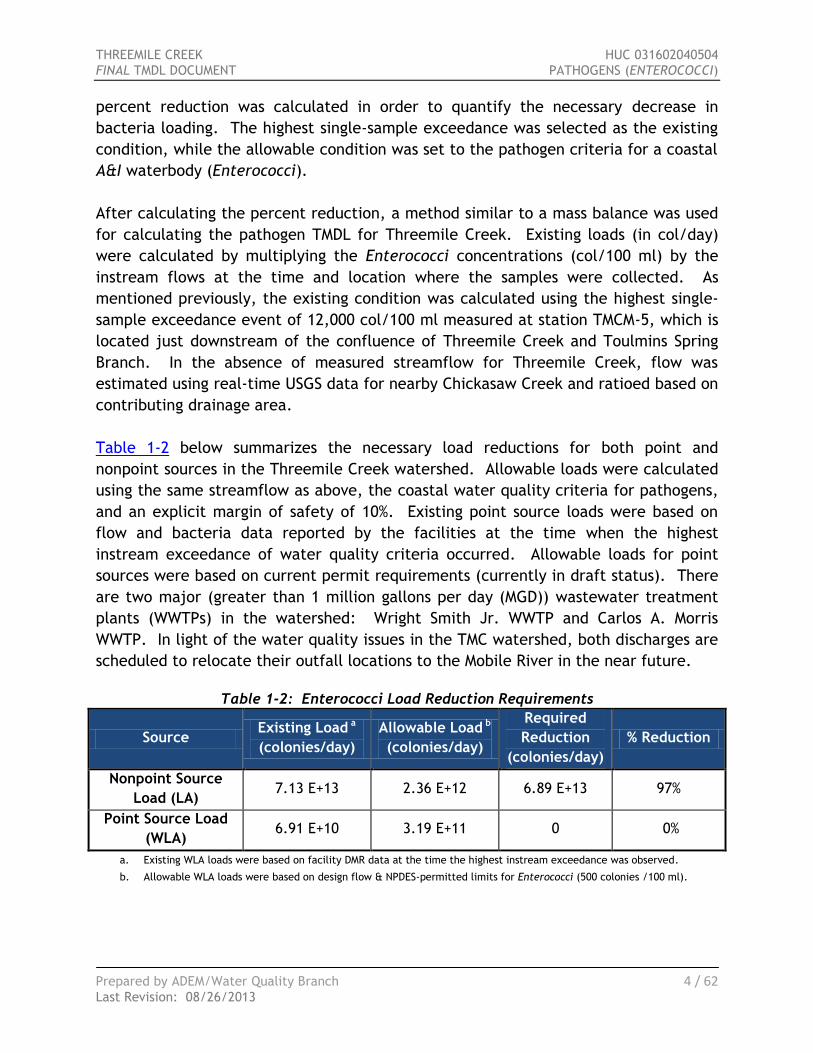
Table 1-2 below summarizes the necessary load reductions for both point and
nonpoint sources in the Threemile Creek watershed. Allowable loads were calculated
using the same streamflow as above, the coastal water quality criteria for pathogens,
and an explicit margin of safety of 10%. Existing point source loads were based on
flow and bacteria data reported by the facilities at the time when the highest
instream exceedance of water quality criteria occurred. Allowable loads for point
sources were based on current permit requirements (currently in draft status). There
are two major (greater than 1 million gallons per day (MGD)) wastewater treatment
plants (WWTPs) in the watershed: Wright Smith Jr. WWTP and Carlos A. Morris
WWTP. In light of the water quality issues in the TMC watershed, both discharges are
scheduled to relocate their outfall locations to the Mobile River in the near future.
Table 1-2: Enterococci Load Reduction Requirements
Source Existing Load a
(colonies/day)
Allowable Load b
(colonies/day)
Required
Reduction
(colonies/day)
% Reduction
Nonpoint Source
Load (LA) 7.13 E+13 2.36 E+12 6.89 E+13 97%
Point Source Load
(WLA) 6.91 E+10 3.19 E+11 0 0%
a. Existing WLA loads were based on facility DMR data at the time the highest instream exceedance was observed.
b. Allowable WLA loads were based on design flow & NPDES-permitted limits for Enterococci (500 colonies /100 ml).

THREEMILE CREEK HUC 031602040504
FINAL TMDL DOCUMENT PATHOGENS (ENTEROCOCCI)
Prepared by ADEM/Water Quality Branch 5 / 62
Last Revision: 08/26/2013
Table 1-3: Individual NPDES Point Source Reductions
Source Existing Load a
(colonies/day)
Allowable Load b
(colonies/day)
Required
Reduction
(colonies/day)
% Reduction
Wright Smith WWTP
(AL0023094) 1.50 E+10 2.42 E+11 0 0%
Carlos Morris WWTP
(AL0023205) 5.40 E+10 7.72 E+10 0 0%
Total WWTPs (WLA) 6.91 E+10 3.19 E+11 0 0%
a. Existing WLA loads were based on facility DMR data at the time the highest instream exceedance was observed
b. Allowable WLA loads were based on design flow & NPDES-permitted limits for Enterococci (500 colonies /100 ml)
Table 1-4: Enterococci Pathogen TMDL Summary for Threemile Creek
TMDL a Margin of
Safety (MOS)
Waste Load Allocation (WLA)
Load Allocation (LA) WWTPs b MS4s c
Leaking
Collection
Systems d
(col/day) (col/day) (col/day) Reduction (col/day) (col/day) Reduction
2.97 E+12 2.97 E+11 3.19 E+11 97% 0 2.36 E+12 97%
a. TMDL was established using the single-sample Enterococci criterion for the A&I use classification (500 colonies/100 ml)
b. WLAs for WWTPs are expressed as a daily maximum. Any future WWTPs (and expansions of existing facilities) must
meet the applicable instream water quality criteria for Enterococci at the point of discharge.
c. Future MS4 areas would be required to demonstrate consistency with the assumptions and requirements of this TMDL.
d. The WLA target for leaking collection systems is zero. It is recognized, however, that a WLA of 0 col/day may not be
practical. For these sources, the WLA is interpreted to mean a reduction in Enterococci loading to the maximum extent
practicable, consistent with the requirement that these sources not contribute to a violation of the water quality
criteria for Enterococci.
Compliance with the terms and conditions of existing and future NPDES permits will
effectively implement the WLA and demonstrate consistency with this TMDL. The
WLA reductions shown in the previous tables illustrate the difference between
“existing conditions” and “allowable conditions.” However, in lieu of a numeric
percent reduction or loading reduction mandate on point sources, discharges must
simply meet or exceed the Enterococci water quality criterion of 500 col/100 ml, end-
of-pipe. This permitting strategy is protective of water quality and consistent with
the requirements of this TMDL. Required load reductions in the LA portion of this
TMDL can be implemented through citizen and stakeholder initiatives (such as the
remediation of failing onsite waste treatment systems), education and outreach, and
other measures which may be eligible for CWA §319 funding. In order to address
future changes in the watershed and the relative uncertainties (e.g. source
assessment), an adaptive management approach will be utilized.

THREEMILE CREEK HUC 031602040504
FINAL TMDL DOCUMENT PATHOGENS (ENTEROCOCCI)
Prepared by ADEM/Water Quality Branch 6 / 62
Last Revision: 08/26/2013
2.0 INTRODUCTION TO TMDLS
Total Maximum Daily Loads (TMDLs) were created as a tool to improve water quality
and provide a roadmap for sustainable, productive, and healthy water resources. The
term TMDL was first introduced in the Clean Water Act and is a tool used extensively
by the USEPA in collaboration with state environmental agencies such as ADEM. Each
state has a TMDL program which submits TMDLs to the respective regional office of
the USEPA for approval. The following contains information concerning Alabama’s
TMDL Program.
2.1 Alabama’s TMDL Program Overview
2.1.1 What is a TMDL?
Water quality monitoring data is collected and compared with state water quality
standards. If any standard is violated, the waterbody can be placed on the state’s
§303(d) List of Impaired Waters. Alabama’s Water Quality Assessment and Listing
Methodology outlines the decision making criteria for this process. Once a waterbody
is placed on this list, additional water quality data is collected and analyzed. If the
data shows there is an impairment of water quality, a TMDL is developed specific to
the pollutant(s) of concern and the impaired waterbody. A TMDL determines the
amount of the pollutant that the waterbody can assimilate while still meeting all
applicable water quality standards. In essence, a TMDL establishes a “pollution
budget” or allocation for each pollutant causing water quality impairment.
A single waterbody or stream/river segment may have several TMDLs developed if it is
impaired by more than one pollutant. Likewise, a stream or watershed may have
multiple segments or assessment units that are impaired. Typically, a TMDL will be
developed to address pathogens, dissolved oxygen, nutrients, pH, metals, turbidity,
or other impairments, separately and distinctly. The ultimate goal of a TMDL is to
identify specific pollutants, link them to their sources, and set a numeric target in
order to reduce pollution loadings and ensure the waterbody is meeting all water
quality standards for its use classification. A TMDL addresses both point source
discharges and nonpoint sources. Once developed, a TMDL is implemented through
load reductions and watershed management practices that aim to improve and
protect water quality throughout the watershed.
2.1.2 §303(d) List of Impaired Waters
As mentioned before, each state is tasked with developing a comprehensive list of
impaired waterbodies. Moreover, the state also prioritizes these lists for

THREEMILE CREEK HUC 031602040504
FINAL TMDL DOCUMENT PATHOGENS (ENTEROCOCCI)
Prepared by ADEM/Water Quality Branch 7 / 62
Last Revision: 08/26/2013
development of TMDLs which are then submitted to EPA for approval. This list is part
of the Integrated Water Quality Report to Congress, a biennial review of water
quality developed by each state and submitted to Congress (commonly referred to as
the “305(b) report”). Alabama’s §303(d) list and additional TMDL information can be
found on ADEM’s website:
http://www.adem.state.al.us/programs/water/waterquality.cnt.
2.1.3 Causes of Impairment & Source Assessment Overview
Pollutants may enter waterbodies from municipal WWTPs, industrial or agricultural
discharges, waste disposal operations, stormwater conveyance systems, or other
defined sources. These types of sources are labeled point sources because the
pollutants are discharged from a discrete end-of-pipe location. All point sources that
discharge effluent to waters of the United States are required under the Clean Water
Act to obtain a National Discharge Pollution Elimination System (NPDES) permit.
ADEM administers these permits on a state level, effectively controlling what type and
how much of each pollutant can be discharged based on applicable water quality
standards for the receiving waterbody. As a result, point sources are tasked with
treating effluent to a degree that is protective of these standards. These types of
sources are addressed in the wasteload allocation (WLA) portion of the TMDL.
In addition to point sources, pollutants may also enter waterbodies from diffuse
sources that are more difficult to distinguish. As overland flow moves over the
Earth’s surface following storm events, materials such as waste, excess nutrients,
sediment, and other matter is transported and deposited into surface waters. This is
called nonpoint source pollution which is address in the load allocation (LA) portion of
the TMDL. In some instances, the distinction between point and nonpoint sources of
pollution is unclear, such as failing onsite waste treatment systems or the
concurrence of nonpoint sources with municipal separate stormwater sewer systems
(MS4) sources.
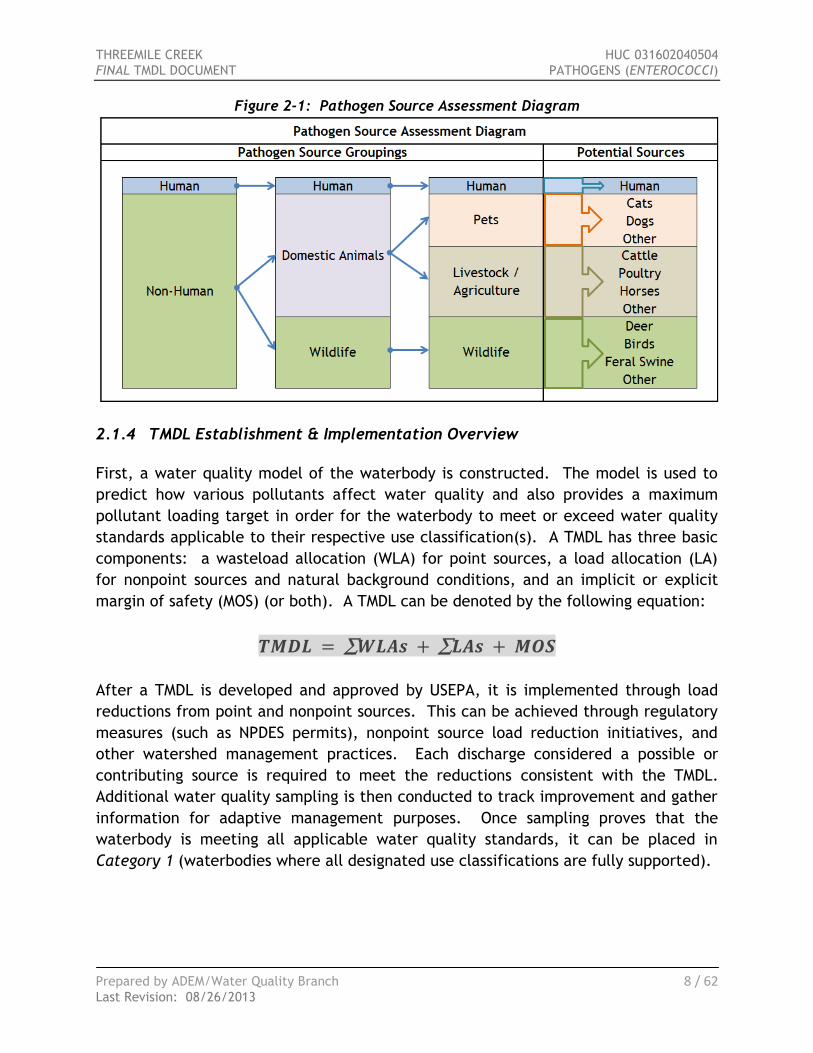
Pathogen impairments can be effectively remediated if comprehensive source
assessments are performed in order to pinpoint where problems lie. The most
prominent sources of pathogen impairments are improperly or untreated human and
animal wastes. Since there are many types of waterborne pathogens, indicator
bacteria are often used to gauge the presence of potentially harmful (but naturally
occurring) bacteria and other disease-causing organisms. Periods of low flow, high
temperatures, and other variables create critical periods where risk of pathogen
impairment is at its highest; thus, critical conditions are used for TMDL analysis and
development. Figure 2-1 on the following page shows potential sources of pathogens.
THREEMILE CREEK HUC 031602040504
FINAL TMDL DOCUMENT PATHOGENS (ENTEROCOCCI)
Prepared by ADEM/Water Quality Branch 8 / 62
Last Revision: 08/26/2013
Figure 2-1: Pathogen Source Assessment Diagram
2.1.4 TMDL Establishment & Implementation Overview
First, a water quality model of the waterbody is constructed. The model is used to
predict how various pollutants affect water quality and also provides a maximum
pollutant loading target in order for the waterbody to meet or exceed water quality
standards applicable to their respective use classification(s). A TMDL has three basic
components: a wasteload allocation (WLA) for point sources, a load allocation (LA)
for nonpoint sources and natural background conditions, and an implicit or explicit
margin of safety (MOS) (or both). A TMDL can be denoted by the following equation:
After a TMDL is developed and approved by USEPA, it is implemented through load
reductions from point and nonpoint sources. This can be achieved through regulatory
measures (such as NPDES permits), nonpoint source load reduction initiatives, and
other watershed management practices. Each discharge considered a possible or
contributing source is required to meet the reductions consistent with the TMDL.
Additional water quality sampling is then conducted to track improvement and gather
information for adaptive management purposes. Once sampling proves that the
waterbody is meeting all applicable water quality standards, it can be placed in
Category 1 (waterbodies where all designated use classifications are fully supported).
THREEMILE CREEK HUC 031602040504
FINAL TMDL DOCUMENT PATHOGENS (ENTEROCOCCI)
Prepared by ADEM/Water Quality Branch 9 / 62
Last Revision: 08/26/2013
3.0 THREEMILE CREEK WATERSHED DESCRIPTION
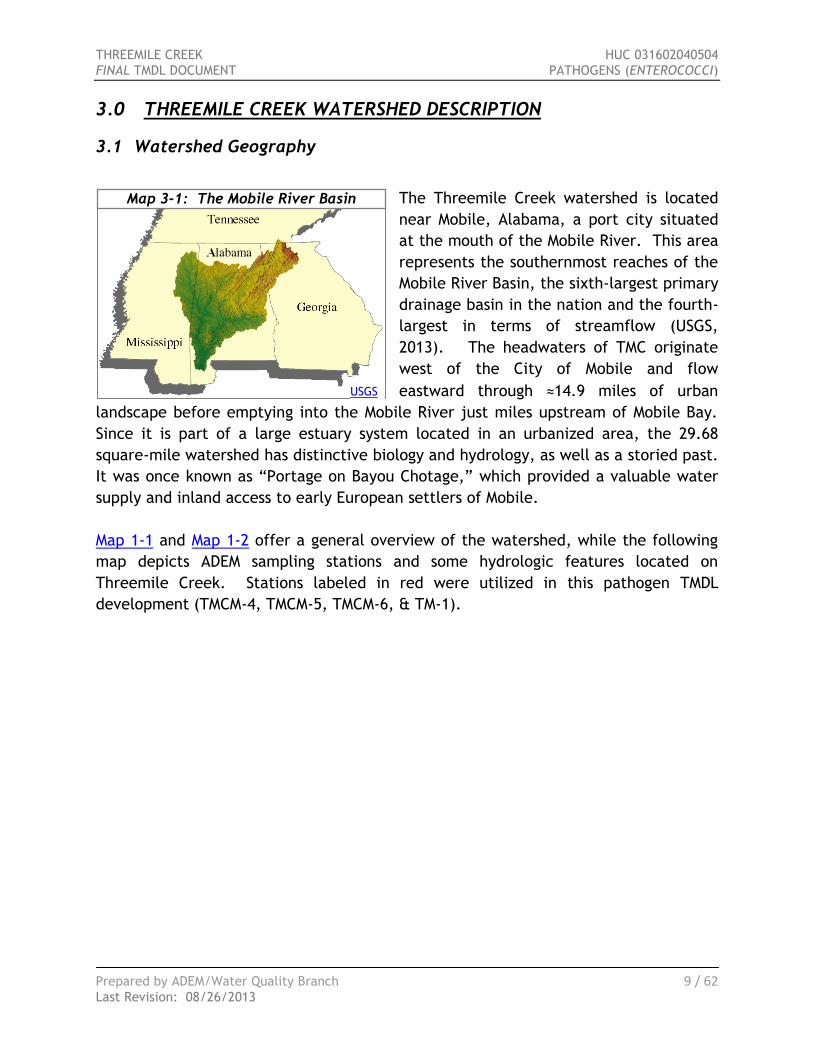
3.1 Watershed Geography
The Threemile Creek watershed is located
near Mobile, Alabama, a port city situated
at the mouth of the Mobile River. This area
represents the southernmost reaches of the
Mobile River Basin, the sixth-largest primary
drainage basin in the nation and the fourth-
largest in terms of streamflow (USGS,
2013). The headwaters of TMC originate
west of the City of Mobile and flow
eastward through ≈14.9 miles of urban
landscape before emptying into the Mobile River just miles upstream of Mobile Bay.
Since it is part of a large estuary system located in an urbanized area, the 29.68
square-mile watershed has distinctive biology and hydrology, as well as a storied past.
It was once known as “Portage on Bayou Chotage,” which provided a valuable water
supply and inland access to early European settlers of Mobile.
Map 1-1 and Map 1-2 offer a general overview of the watershed, while the following
map depicts ADEM sampling stations and some hydrologic features located on
Threemile Creek. Stations labeled in red were utilized in this pathogen TMDL
development (TMCM-4, TMCM-5, TMCM-6, & TM-1).
Map 3-1: The Mobile River Basin
USGS

THREEMILE CREEK HUC 031602040504
FINAL TMDL DOCUMENT PATHOGENS (ENTEROCOCCI)
Prepared by ADEM/Water Quality Branch 10 / 62
Last Revision: 08/26/2013
Map 3-2: Threemile Creek Watershed & Sampling Stations

THREEMILE CREEK HUC 031602040504
FINAL TMDL DOCUMENT PATHOGENS (ENTEROCOCCI)
Prepared by ADEM/Water Quality Branch 11 / 62
Last Revision: 08/26/2013
3.2 Hydrology
As mentioned previously, Threemile Creek possesses unique hydrology due to its
geographic location and landforms. In addition, urbanization and manmade features
within the watershed have also altered the behavior, distribution, and quality of
surface water. A number of hydrodynamic restructuring projects were completed in
order to alleviate the impacts of flooding in residential and commercial areas of
Mobile. The headwaters of Threemile Creek originate just west of Cody Road and
then flow into a series of artificial impoundments in Municipal (Langin) Park. Excess
water from these lakes then flows over a spillway near Springhill Avenue. From this
point, TMC flows eastward through intermittent residential and forested areas. There
are a couple of small riprap stream crossings before reaching the first major drop
structure just west of I-65. Up until this point, the streambanks are relatively stable
with a somewhat intact riparian buffer. Downstream of this location, however, TMC
is much more channelized and lined periodically with riprap and tiered gabion baskets
(see Picture 3-2 and Picture 3-3 on the following page). After another 3 drop
structures spaced evenly over the 2 miles following the I-65 crossing, TMC becomes a
free-flowing waterbody until it reaches the Mobile River. As it nears Downtown
Mobile, a straight, one-mile-long canal connects two locations on the original
mainstem of the creek. The original streambed meanders alongside this canal
through low wetland areas surrounding the abandoned Hickory Street Landfill. The
waterbody begins to widen as it nears its confluence with the Mobile River, the area
around which is highly industrialized. Finally, Threemile Creek flows into the Mobile
River just 4 miles upstream of where Mobile River enters Mobile Bay.
Picture 3-1: Drops Structures on Threemile Creek near Fillingim Street

THREEMILE CREEK HUC 031602040504
FINAL TMDL DOCUMENT PATHOGENS (ENTEROCOCCI)
Prepared by ADEM/Water Quality Branch 12 / 62
Last Revision: 08/26/2013
Picture 3-2: Threemile Creek below Municipal Park
Picture 3-3: Threemile Creek at I-65
The aerial image on the left shows a representative segment of Threemile Creek between Municipal Park and the first drop structure
located about 0.5 miles upstream of I-65. In contrast, the picture on the right shows the second series of drop structures and banks
stabilized with gabion baskets near the I-65 crossing. Reduction in riparian buffers reduces the natural filtering capacity of land
adjacent to waterbodies which can exacerbate impairments and aid in transport of pollutants.

THREEMILE CREEK HUC 031602040504
FINAL TMDL DOCUMENT PATHOGENS (ENTEROCOCCI)
Prepared by ADEM/Water Quality Branch 13 / 62
Last Revision: 08/26/2013
With respect to tidal influence, approximately the lower third of the watershed is
impacted, while the areas above the last drop structure are not. The last drop
structured is about 5.6 miles upstream from the mouth between stations TMCM-4 and
TMCM-6 (see Map 3-2). The areas below this point down to the low-lying areas near
the confluence with the Mobile River have normal diurnal tidal fluctuations as much
as two feet during spring tide events and almost no change during a neap tide. Figure
3-1 is an example of monthly tidal oscillations of the Mobile River near the mouth of
TMC (NOAA Data, 2013).
Figure 3-1: Illustration of Tidal Variation, Mobile River, April 2013
3.3 Ecoregions in the Threemile Creek Watershed
An ecoregion (short for ecological region) is a geographical area defined by unique
physical characteristics and environmental conditions. This includes a wide range of
physiographic elements such as geology, hydrology, soil characteristics, climate,
native vegetation, and so on. Recognizing how these characteristics are spatially
correlated help us to better understand ecological impacts and aid in managing
natural resources.
The TMC watershed is located in the southernmost portion of the East Gulf Coastal
Plain physiographical region. This area includes Southeastern Plains Ecoregion (65)
and the Southern Coastal Plain Ecoregion (75). These two level III ecoregions can be
-0.5
0
0.5
1
1.5
2
2.5
Wate
r Level (f
t)
Mobile River Tidal Range (Mobile State Docks - April 2013)
Water Level in Feet (Relative to MLLW)

THREEMILE CREEK HUC 031602040504
FINAL TMDL DOCUMENT PATHOGENS (ENTEROCOCCI)
Prepared by ADEM/Water Quality Branch 14 / 62
Last Revision: 08/26/2013
further broken down into three level IV ecoregions, which are displayed in Map 3-3:
Threemile Creek Level IV Ecoregions. This illustration is followed by brief
descriptions of each ecoregion (listed in order of proportion of the total watershed
area, largest to smallest).
Map 3-3: Threemile Creek Level IV Ecoregions
In Alabama, the Gulf Coast Flatwoods (75a) Ecoregion occupies a narrow strip along the coastal areas surrounding Mobile Bay and adjacent estuaries. This region is characterized by wet, sandy flats and broad (sometimes swampy) depressions that are typically covered with Southern mixed forests. Streams
are low-gradient with sandy and silty substrates. (14.07 mi² of watershed) The Southern Pine Plains and Hills (65f) are dominated by southern yellow
pine and mixed forests spread over southward-sloping dissected irregular plains, low hills, and slightly steeper slopes near drains. Streams in this area tend to display low- to moderate-gradients, higher acidity, stained or tannic color, with sandy or clay bottoms. (12.95 mi² of watershed)
The Gulf Barrier Islands and Coastal Marshes (75k) Ecoregion is an even more narrow sliver of land consisting of river delta, intertidal salt/brackish marshes, barrier islands, beaches, and mixed pine and hardwood scrub/shrub stretched along the shorelines of Alabama and Mississippi. (2.67 mi² of watershed) (Griffith et al, 2001)

THREEMILE CREEK HUC 031602040504
FINAL TMDL DOCUMENT PATHOGENS (ENTEROCOCCI)
Prepared by ADEM/Water Quality Branch 15 / 62
Last Revision: 08/26/2013
It should be noted that though these are the naturally occurring landscapes of the
region, some of which are still present, much of the watershed has been transformed
by development and urbanization. More information concerning changes in land cover
and impervious surfaces are discussed in more detail in Section 5.2.3.
3.4 Soil Characteristics
Soil types and their physical characteristics can have a large impact on water quality.
Much like the taxonomic system used in naming plants or animals, a similar
convention exists for soils. Out of the 12 soil orders, two are present in the
Threemile Creek watershed. Soils in the TMC watershed are primarily Ultisols, which
are also referred to as red clay soils. A small portion near the mouth is classified as
Histosols, which are organic soils common in swampy or marshy areas.
The Threemile Creek watershed is comprised of mostly loamy sands and sandy loams
in all four hydrologic soil groups. The following excerpt from the Natural Resource
Conservation Service (NRCS) Soil Data Viewer Extension for ArcMap 10 describes each
soil group (NRCS, 2012):
Group A: Soils having a high infiltration rate (low runoff potential) when thoroughly
wet. These consist mainly of deep, well drained to excessively drained sands or
gravelly sands. These soils have a high rate of water transmission.
Group B: Soils having a moderate infiltration rate when thoroughly wet. These
consist chiefly of moderately deep or deep, moderately well drained or well drained
soils that have moderately fine texture to moderately coarse texture. These soils
have a moderate rate of water transmission.
Group C: Soils having a slow infiltration rate when thoroughly wet. These consist
chiefly of soils having a layer that impedes the downward movement of water or soils
of moderately fine texture or fine texture. These soils have a slow rate of water
transmission.
Group D: Soils having a very slow infiltration rate (high runoff potential) when
thoroughly wet. These consist chiefly of clays that have a high shrink-swell potential,
soils that have a high water table, soils that have a claypan or clay layer at or near
the surface, and soils that are shallow over nearly impervious material. These soils
have a very slow rate of water transmission.
If a soil is assigned to a dual hydrologic group (A/D, B/D, or C/D), the first letter is
for drained areas and the second is for undrained areas. Only soils that are rated D in
their natural condition are assigned to dual classes.
The distribution of the soil types are shown in Map 3-4.

THREEMILE CREEK HUC 031602040504
FINAL TMDL DOCUMENT PATHOGENS (ENTEROCOCCI)
Prepared by ADEM/Water Quality Branch 16 / 62
Last Revision: 08/26/2013
Map 3-4: Hydrologic Soil Groups in the Threemile Creek Watershed
3.5 Slope & Erosion Potential
In the previous section, soil characteristics were discussed. The type of soil and
topography of the landscape plays a large role in how susceptible watersheds are to
sheet and rill erosion by surface runoff. Almost the entire TMC watershed has a
representative slope of less than 5% and a moderate erodibility factor (0.1 < k < 0.4).
Higher k-values represent increased vulnerability to erosion. The fate and transport
of pathogens is correlated to erosion and the resulting sediment transport. As seen in
Map 3-5, the areas with a higher potential for erosion are located near the pathogen
impairment.

THREEMILE CREEK HUC 031602040504
FINAL TMDL DOCUMENT PATHOGENS (ENTEROCOCCI)
Prepared by ADEM/Water Quality Branch 17 / 62
Last Revision: 08/26/2013
Map 3-5: Erosion Potential in the TMC Watershed
3.6 Climate & Rainfall
The humid subtropical climate of Mobile,
AL is typical of the southern temperate
rainforests, which are characterized by
long growing seasons, periods of intense
rainfall, and generally mild temperatures.
According to a study completed in 2007 by
Weatherbill, Inc., Mobile, AL receives an
average of 66+ inches of rainfall per year,
officially making it the wettest US city by
volume. It also ranks second in most rainy
days per year with 59.3 (days with 0.25” or
more). A summary of the climate of
Mobile, AL is displayed in Figure 3-2.
In addition to localized coastal weather phenomena, the area is also affected by
global weather patterns such as El Niño, La Niña, and the warm Gulf Stream current
which loops through the Gulf of Mexico before flowing northward up the Atlantic
Seaboard.
Map 3-6: Annual Average Rainfall (in)

THREEMILE CREEK HUC 031602040504
FINAL TMDL DOCUMENT PATHOGENS (ENTEROCOCCI)
Prepared by ADEM/Water Quality Branch 18 / 62
Last Revision: 08/26/2013
Figure 3-2: Mobile, AL Climate Summary
5.7 5.3
6.1
4.8 5.1
6.1
7.3 7.0
5.1
3.7
5.1 5.1
40 43
49
55
64
70 73 73
68
58
49
42
61
65
71
78
85
89 91 91
87
79
71
63
0
5
10
15
20
0
10
20
30
40
50
60
70
80
90
100
Avera
ge M
onth
ly
Rain
fall (
in)
Avera
ge T
em
pera
ture
(°F)
Mobile, AL Climate Summary
Average Rainfall (in) Average Low Temperature (°F) Average High Temperature (°F)

THREEMILE CREEK HUC 031602040504
FINAL TMDL DOCUMENT PATHOGENS (ENTEROCOCCI)
Prepared by ADEM/Water Quality Branch 19 / 62
Last Revision: 08/26/2013
3.7 Land Use Assessment
The following illustrations represent land uses in the Threemile Creek watershed. First, land cover types are displayed ungrouped,
and then they are categorized by general type (natural, developed, and other). About 78% of the watershed is considered
developed land. These statistics were derived from geospatial land cover data from the National Land Cover Dataset (NLCD, 2006).
Figure 3-3 Threemile Creek Land Cover (Ungrouped)
Table 3-1: Ungrouped Land Cover Statistics
Class Description mi² Acres Percent
Deciduous Forest 0.01 6.22 0.03%
Barren Land 0.09 56.90 0.30%
Open Water 0.10 66.90 0.35%
Grassland / Herbaceous 0.14 87.79 0.46%
Emergent Herbaceous Wetlands 0.18 116.68 0.61%
Hay/Pasture 0.20 124.90 0.66%
Mixed Forest 0.26 164.24 0.86%
Shrub/Scrub 0.32 202.47 1.07%
Developed, High Intensity 0.86 551.62 2.90%
Evergreen Forest 1.93 1238.15 6.52%
Developed, Medium Intensity 3.15 2017.14 10.62%
Woody Wetlands 3.41 2180.71 11.48%
Developed, Low Intensity 7.39 4730.80 24.91%
Developed, Open Space 11.64 7448.03 39.22%
TOTALS → 29.68 18992.56 100.00%

THREEMILE CREEK HUC 031602040504
FINAL TMDL DOCUMENT PATHOGENS (ENTEROCOCCI)
Prepared by ADEM/Water Quality Branch 20 / 62
Last Revision: 08/26/2013
Figure 3-4: Threemile Creek Land Cover (Grouped)
Table 3-2: Grouped Land Cover Statistics
Class Description mi² Acres Percent
Open Water / Other 0.39 248.70 1.31%
Forested / Natural 6.24 3996.27 21.04%
Developed Land (Grouped) 23.04 14747.59 77.65%
TOTALS → 29.68 18992.56 100.00%

THREEMILE CREEK HUC 031602040504
FINAL TMDL DOCUMENT PATHOGENS (ENTEROCOCCI)
Prepared by ADEM/Water Quality Branch 21 / 62
Last Revision: 08/26/2013
Map 3-7: Threemile Creek Land Cover (NLCD, 2006)

THREEMILE CREEK HUC 031602040504
FINAL TMDL DOCUMENT PATHOGENS (ENTEROCOCCI)
Prepared by ADEM/Water Quality Branch 22 / 62
Last Revision: 08/26/2013
3.8 Special Conditions
As a coastal city on the northern Gulf of Mexico, Mobile is subject to powerful tropical
storm systems including hurricanes. In addition to damaging winds and large amounts
of precipitation, there are often storm surges associated with these systems. This rise
in water level can result in widespread inland flooding which can leads to disruption
in normal hydrological and ecological function.
3.9 Threatened or Endangered Species
There are three species in the Threemile Creek watershed that have been designated
as threatened or endangered: the alligator snapping turtle (Macroclemys
temminckii), the Alabama red-belly turtle (Pseudemys alabamensis), and the gulf
sturgeon (Acipenser Oxyrinchus Desotoi). The alligator snapping turtle has been
identified by the Alabama National Heritage Program as fair to good established
variability with no signs of decline. The red-bellied turtle is primarily threatened by
loss of habitat and nesting area, which has led to an apparent decrease in
recruitment. Their range is limited to the Mobile-Tensaw River Delta in Mobile and
Baldwin Counties of Alabama (ADEM, 2006). Finally, the gulf sturgeon was listed as a
threatened species by the US Fish and Wildlife Service in 1991. The gulf sturgeon is
anadromous, living in salt water yet spawning in fresh water and is also threatened by
habitat destruction and degradation (Mettee et al, 1996).
Picture 3-4: Threatened and Endangered Species in the Threemile Creek Watershed

THREEMILE CREEK HUC 031602040504
FINAL TMDL DOCUMENT PATHOGENS (ENTEROCOCCI)
Prepared by ADEM/Water Quality Branch 23 / 62
Last Revision: 08/26/2013
4.0 PROBLEM STATEMENT
4.1 Original Listing Information
Two segments on the lower portion of Threemile Creek were originally placed on
Alabama’s 2004 §303(d) List of Impaired Waterbodies for pathogens (fecal coliform)
based on data collected in 2000-2001 by the United States Geological Survey (USGS).
In accordance with Alabama’s Water Quality Assessment and Listing Methodology, an
A&I waterbody can be placed in Category 5 for bacteriological impairment if more
than 10% of single samples exceed the criteria. Of the samples collected by USGS,
three of seven, or 43%, exceeded the state’s bacteria criteria. In January of 2010,
Alabama adopted Enterococci as the indicator bacteria for coastal waters, thus the
loadings in this TMDL are expressed accordingly. Subsequent sampling in the TMC
watershed has continued to show impairment with respect to pathogens
(Enterococci). Pathogen data collected by both ADEM and USGS can be found in the
Water Quality Dataset section.
4.2 Water Quality Standards & Criteria Exceeded
Table 4-1: Alabama Bacteriological Criteria for A&I Waterbodies
Use Classification Non-Coastal Waters Coastal Waters
Agricultural and Industrial Water Supply (A&I)
E. Coli (colonies/100 ml)
Geometric Mean ≤ 700
Single Sample Max ≤ 3200
Enterococci (colonies/100 ml)
Single Sample Max ≤ 500
The following excerpt from ADEM’s Administrative Code, Chapter 335-6-10-.09
outlines the specific water quality criteria for the A&I use classification:
(7) AGRICULTURAL AND INDUSTRIAL WATER SUPPLY (a) Best usage of waters: agricultural irrigation, livestock watering, industrial cooling and
process water supplies, and any other usage, except fishing, bathing, recreational
activities, including water-contact sports, or as a source of water supply for drinking or
food-processing purposes.
(b) Conditions related to best usage:
(i) The waters, except for natural impurities which may be present therein, will be
suitable for agricultural irrigation, livestock watering, industrial cooling waters, and fish
survival. The waters will be usable after special treatment, as may be needed under each
particular circumstance, for industrial process water supplies. The waters will also be
suitable for other uses for which waters of lower quality will be satisfactory.

THREEMILE CREEK HUC 031602040504
FINAL TMDL DOCUMENT PATHOGENS (ENTEROCOCCI)
Prepared by ADEM/Water Quality Branch 24 / 62
Last Revision: 08/26/2013
(ii) This category includes watercourses in which natural flow is intermittent and non-
existent during droughts and which may, of necessity, receive treated wastes from
existing municipalities and industries, both now and in the future. In such instances,
recognition must be given to the lack of opportunity for mixture of the treated wastes
with the receiving stream for purposes of compliance. It is also understood in considering
waters for this classification that urban runoff or natural conditions may impact any
waters so classified.
(c) Specific criteria:
1. Sewage, industrial wastes, or other wastes: none which are not effectively treated or
controlled in accordance with rule 335-6-10-.08.
2. pH: sewage, industrial wastes or other wastes shall not cause the pH to deviate more
than one unit from the normal or natural pH, nor be less than 6.0, nor greater than 8.5.
For salt waters and estuarine waters to which this classification is assigned, wastes as
herein described shall not cause the pH to deviate more than one unit from the normal or
natural pH, nor be less than 6.5, nor greater than 8.5.
3. Temperature: the maximum temperature rise above natural temperatures due to the
addition of artificial heat shall not exceed 5°F in streams, lakes, and reservoirs, nor shall
the maximum water temperature exceed 90°F.
4. Dissolved oxygen: sewage, industrial wastes, or other wastes shall not cause the
dissolved oxygen to be less than 3.0 mg/l. In the application of dissolved oxygen criteria
referred to above, dissolved oxygen shall be measured at a depth of 5 feet in waters 10
feet or greater in depth; and for those waters less than 10 feet in depth, dissolved oxygen
criteria will be applied at middepth.
5. Color, odor, and taste-producing substances, toxic substances, and other deleterious
substances, including chemical compounds attributable to sewage, industrial wastes, and
other wastes: only such amounts as will not render the waters unsuitable for agricultural
irrigation, livestock watering, industrial cooling, industrial process water supply
purposes, and fish survival, nor interfere with downstream water uses. For the purpose of
establishing effluent limitations pursuant to chapter 335-6-6 of the Department's
regulations, the minimum 7-day low flow that occurs once in 10 years (7Q10) shall be the
basis for applying the acute aquatic life criteria. The use of the 7Q10 low flow for
application of acute criteria is appropriate based on the historical uses and/or flow
characteristics of streams to be considered for this classification.
6. Bacteria: In non-coastal waters, bacteria of the E. coli group shall not exceed a
geometric mean of 700 colonies/100 ml; nor exceed a maximum of 3,200 colonies/100
ml in any sample. In coastal waters, bacteria of the Enterococci group shall not exceed a
maximum of 500 colonies/100 ml in any sample. The geometric mean shall be calculated
from no less than five samples collected at a given station over a 30-day period at
intervals not less than 24 hours.
7. Radioactivity: the concentrations of radioactive materials present shall not exceed the
requirements of the State Department of Public Health.

THREEMILE CREEK HUC 031602040504
FINAL TMDL DOCUMENT PATHOGENS (ENTEROCOCCI)
Prepared by ADEM/Water Quality Branch 25 / 62
Last Revision: 08/26/2013
8. Turbidity: there shall be no turbidity of other than natural origin that will cause
substantial visible contrast with the natural appearance of waters or interfere with any
beneficial uses which they serve. Furthermore, in no case shall turbidity exceed 50
Nephelometric units above background. Background will be interpreted as the natural
condition of the receiving waters without the influence of man-made or man-induced
causes. Turbidity levels caused by natural runoff will be included in establishing
background levels.
THREEMILE CREEK HUC 031602040504
FINAL TMDL DOCUMENT PATHOGENS (ENTEROCOCCI)
Prepared by ADEM/Water Quality Branch 26 / 62
Last Revision: 08/26/2013
5.0 TECHNICAL BASIS FOR TMDL DEVELOPMENT
5.1 Water Quality Target Identification
For this TMDL analysis, the numeric water quality target is set to ≤ 500 colonies /
100ml, the instream single-sample bacteria criteria for the A&I use classification.
This target, in conjunction with a target of zero for leaking collection systems and
illicit discharges, is the basis for the TMDL and load allocations, and is protective of
water quality standards applicable to the A&I use classification.
5.2 Pollutant Source Assessment
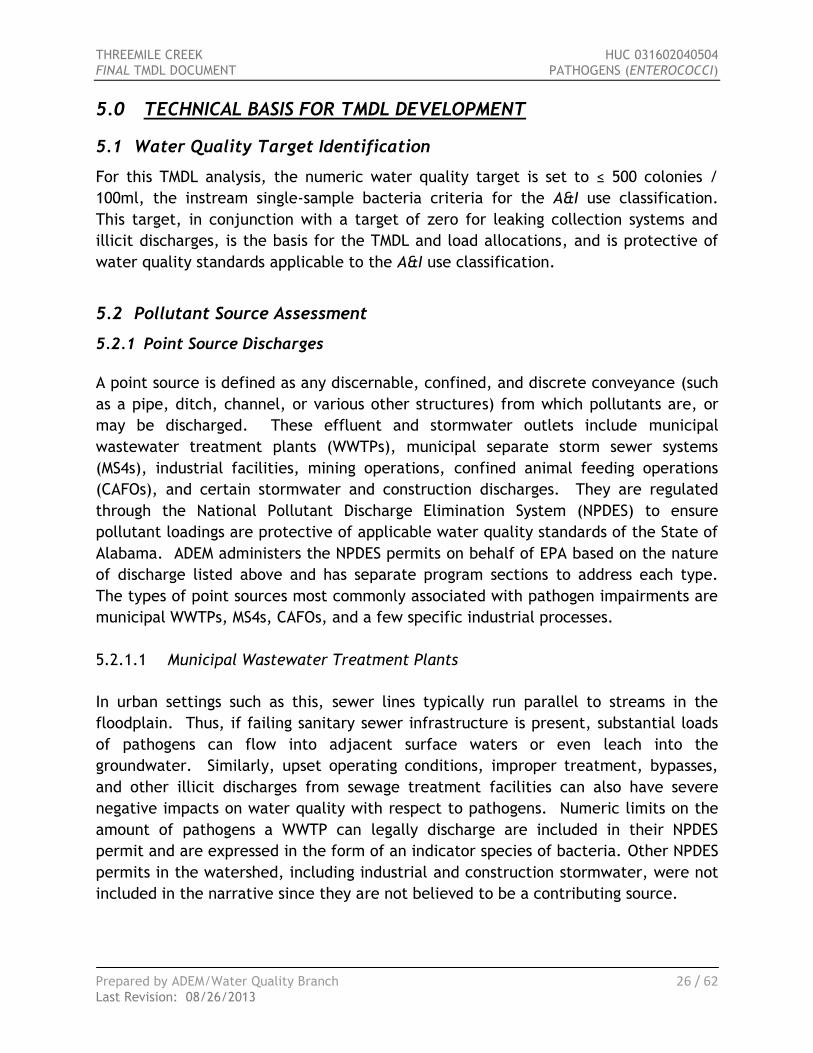
5.2.1 Point Source Discharges
A point source is defined as any discernable, confined, and discrete conveyance (such
as a pipe, ditch, channel, or various other structures) from which pollutants are, or
may be discharged. These effluent and stormwater outlets include municipal
wastewater treatment plants (WWTPs), municipal separate storm sewer systems
(MS4s), industrial facilities, mining operations, confined animal feeding operations
(CAFOs), and certain stormwater and construction discharges. They are regulated
through the National Pollutant Discharge Elimination System (NPDES) to ensure
pollutant loadings are protective of applicable water quality standards of the State of
Alabama. ADEM administers the NPDES permits on behalf of EPA based on the nature
of discharge listed above and has separate program sections to address each type.
The types of point sources most commonly associated with pathogen impairments are
municipal WWTPs, MS4s, CAFOs, and a few specific industrial processes.
5.2.1.1 Municipal Wastewater Treatment Plants
In urban settings such as this, sewer lines typically run parallel to streams in the
floodplain. Thus, if failing sanitary sewer infrastructure is present, substantial loads
of pathogens can flow into adjacent surface waters or even leach into the
groundwater. Similarly, upset operating conditions, improper treatment, bypasses,
and other illicit discharges from sewage treatment facilities can also have severe
negative impacts on water quality with respect to pathogens. Numeric limits on the
amount of pathogens a WWTP can legally discharge are included in their NPDES
permit and are expressed in the form of an indicator species of bacteria. Other NPDES
permits in the watershed, including industrial and construction stormwater, were not
included in the narrative since they are not believed to be a contributing source.

THREEMILE CREEK HUC 031602040504
FINAL TMDL DOCUMENT PATHOGENS (ENTEROCOCCI)
Prepared by ADEM/Water Quality Branch 27 / 62
Last Revision: 08/26/2013
There are two major (> 1.0 million gallons per day (MGD)) WWTPs located in the TMC
watershed: Mobile’s Wright Smith WWTP (AL 0023094) and the City of Prichard’s
Carlos Morris WWTP (AL0023205), both of which are currently operated by Mobile Area
Water and Sewer System (MAWSS). Both of these discharges are located near station
TMCM-5 where the highest exceedance was observed.
Wright Smith WWTP discharges to the mainstem of TMC near the confluence of TMC
with Toulmins Spring Branch with a current permitted design flow of 12.8 MGD. This
plant provides service to approximately 28,000 people and has 355 miles of gravity
mains, 12 miles of force mains, 8,185 manholes, and 35 lift stations in its footprint.
Carlos Morris WWTP, which was only recently acquired by MAWSS as part of ongoing
litigation, also discharges to TMC just downstream of Wright Smith’s outfall with a
design flow of 4.08 MGD. It has a service population of about 7,000 people and has
around 48 miles of gravity mains, 1+ miles of force mains, 1,060 manholes, and 8 lift
stations within its service area (MAWSS, 2013).
Table 5-1: Major Municipal WWTPs in the Threemile Creek Watershed
NPDES Permit ID
Facility Name Receiving Waterbody
Design Flow (MGD)
Enterococci Limit a
AL0023034 Wright Smith Jr.
WWTP Threemile Creek 12.8 500 col/100 ml
AL0023205 Carlos A. Morris
WWTP Threemile Creek 4.08 500 col/100 ml
a. Pending NPDES permit limits are applied as a daily maximum reported monthly.
As a result of load reductions required by the 2006 Threemile Creek Organic
Enrichment / Dissolved Oxygen TMDL and consent decrees due to degraded water
quality in the watershed, both facilities are transitioning to outfall locations located
on the Mobile River which would allow for greater assimilative capacity of pollutants.
Thus, for Wright Smith WWTP, a tiered NPDES permit for both outfall locations is
currently under development. The relocation is on schedule for completion by the
end of 2013. As for Carlos A. Morris WWTP, the future is uncertain at this time,
though it is certain the discharge location in Threemile Creek will be abandoned.
In addition to the permitted continuous discharge of treated effluent (i.e. end-of-
pipe), sanitary sewer overflows (SSOs) caused by excessive stormwater, power failure,
blockage, or other upset condition can also contribute to pathogen loadings. The vast
amount of infrastructure mentioned above requires constant maintenance and
upgrades over time. SSOs are required to be reported to ADEM and are fairly common
during rain events. Typically, overflows are detected and addressed quickly in order
to minimize pathogen exposure to the public. ADEM maintains a database of SSOs
that includes the time, date, location, and duration of the event. Failure to
remediate ongoing issues can result in penalties and other enforcement action. SSOs
THREEMILE CREEK HUC 031602040504
FINAL TMDL DOCUMENT PATHOGENS (ENTEROCOCCI)
Prepared by ADEM/Water Quality Branch 28 / 62
Last Revision: 08/26/2013
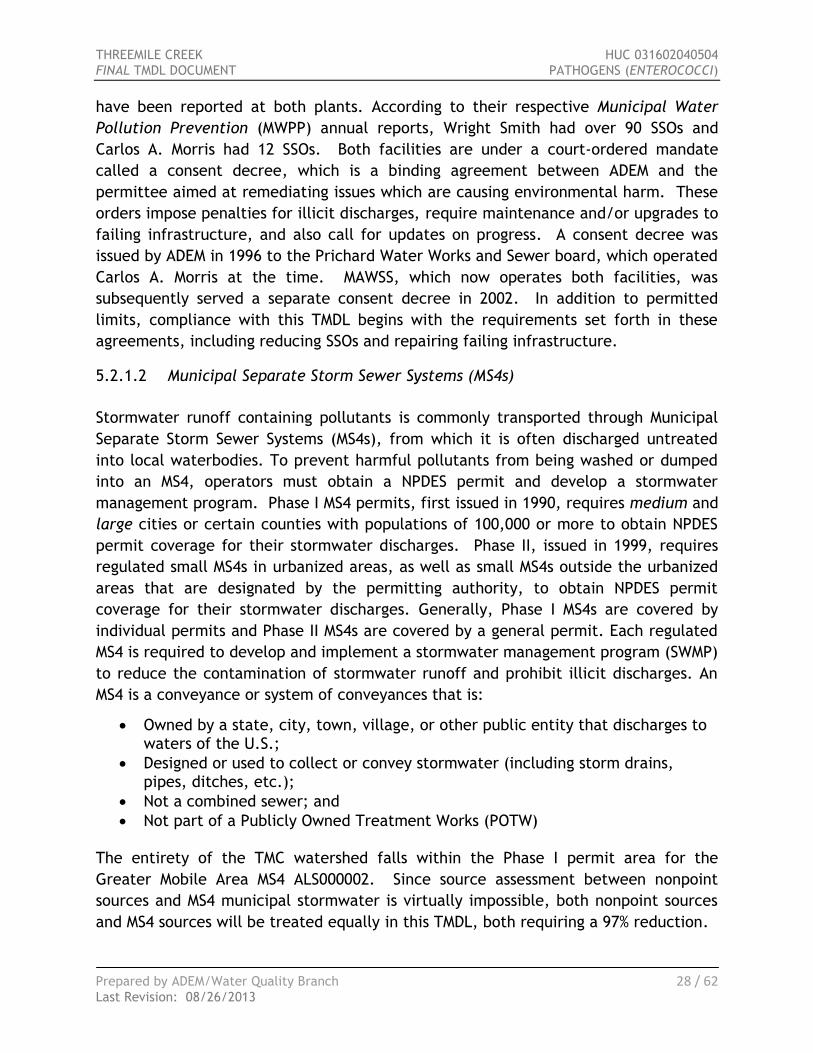
have been reported at both plants. According to their respective Municipal Water
Pollution Prevention (MWPP) annual reports, Wright Smith had over 90 SSOs and
Carlos A. Morris had 12 SSOs. Both facilities are under a court-ordered mandate
called a consent decree, which is a binding agreement between ADEM and the
permittee aimed at remediating issues which are causing environmental harm. These
orders impose penalties for illicit discharges, require maintenance and/or upgrades to
failing infrastructure, and also call for updates on progress. A consent decree was
issued by ADEM in 1996 to the Prichard Water Works and Sewer board, which operated
Carlos A. Morris at the time. MAWSS, which now operates both facilities, was
subsequently served a separate consent decree in 2002. In addition to permitted
limits, compliance with this TMDL begins with the requirements set forth in these
agreements, including reducing SSOs and repairing failing infrastructure.
5.2.1.2 Municipal Separate Storm Sewer Systems (MS4s)
Stormwater runoff containing pollutants is commonly transported through Municipal
Separate Storm Sewer Systems (MS4s), from which it is often discharged untreated
into local waterbodies. To prevent harmful pollutants from being washed or dumped
into an MS4, operators must obtain a NPDES permit and develop a stormwater
management program. Phase I MS4 permits, first issued in 1990, requires medium and
large cities or certain counties with populations of 100,000 or more to obtain NPDES
permit coverage for their stormwater discharges. Phase II, issued in 1999, requires
regulated small MS4s in urbanized areas, as well as small MS4s outside the urbanized
areas that are designated by the permitting authority, to obtain NPDES permit
coverage for their stormwater discharges. Generally, Phase I MS4s are covered by
individual permits and Phase II MS4s are covered by a general permit. Each regulated
MS4 is required to develop and implement a stormwater management program (SWMP)
to reduce the contamination of stormwater runoff and prohibit illicit discharges. An
MS4 is a conveyance or system of conveyances that is:
Owned by a state, city, town, village, or other public entity that discharges to waters of the U.S.;
Designed or used to collect or convey stormwater (including storm drains, pipes, ditches, etc.);
Not a combined sewer; and
Not part of a Publicly Owned Treatment Works (POTW)
The entirety of the TMC watershed falls within the Phase I permit area for the
Greater Mobile Area MS4 ALS000002. Since source assessment between nonpoint
sources and MS4 municipal stormwater is virtually impossible, both nonpoint sources
and MS4 sources will be treated equally in this TMDL, both requiring a 97% reduction.

THREEMILE CREEK HUC 031602040504
FINAL TMDL DOCUMENT PATHOGENS (ENTEROCOCCI)
Prepared by ADEM/Water Quality Branch 29 / 62
Last Revision: 08/26/2013
Map 5-1: NPDES & MS4 Entities in the Threemile Creek Watershed
Note: The MS4 permit for the greater Mobile area (ALS000002) includes the entities of the City of Prichard and
unincorporated Mobile County. Thought they are covered under the same permit, each entity is responsible for
stormwater management within their respective boundaries.

THREEMILE CREEK HUC 031602040504
FINAL TMDL DOCUMENT PATHOGENS (ENTEROCOCCI)
Prepared by ADEM/Water Quality Branch 30 / 62
Last Revision: 08/26/2013
5.2.2 Nonpoint Source Assessment
5.2.2.1 Wildlife
Wildlife can also contribute to pathogen impairments, especially where it is plentiful
and widespread. The State of Alabama boasts a very diverse river and stream
network that also provides plenty of habitats for all kinds of wildlife. Waste from
these animals can contribute to pathogen impairment. These are generally
considered as natural background conditions and do not require a load reduction.
5.2.2.2 Agricultural Activities & Domesticated Animals (AFOs, CAFOs, etc.)
This is not a significant source of pathogens in the TMC watershed.
5.2.2.3 Failing Onsite Wastewater Disposal Systems
Onsite wastewater disposal systems can pose a serious threat to water quality if not
maintained properly. The Alabama Department of Public Health (ADPH) estimates
that about 25% of septic systems in Alabama could be failing. The Mobile County
Health Department requires initial site suitability tests for new installations as well as
inspections for existing systems. More information can be found on their website at:
http://www.mobilecountyhealth.org/
5.2.2.4 Domestic Pets
Domestic pets, such as dogs, cats, and so forth, can also be contributors to pathogen
impairment. If the waste of these animals is not properly disposed of, it eventually
washes into the streams through storm sewers and overland flow. Since a majority of
the watershed is considered developed, it can be safely assumed that pet waste is a
contributing factor to pathogen impairment.
5.2.3 Impervious Surfaces Assessment
Impervious surfaces have become a key indicator of the impact of developed lands on
water quality. These surfaces increase runoff velocity and restrict stormwater from
permeating the natural soil. The runoff is typically gathered in to storm sewer
systems which discharge into lakes and streams, carrying with it any pollutants that
are present. From the land use assessment above, the TMC Creek watershed is
predominantly developed land (approximately 78%). Though not all of developed land
is impervious, a large portion of it is.

THREEMILE CREEK HUC 031602040504
FINAL TMDL DOCUMENT PATHOGENS (ENTEROCOCCI)
Prepared by ADEM/Water Quality Branch 31 / 62
Last Revision: 08/26/2013
Map 5-2 depicts impervious surfaces (dark red) versus non-impervious surfaces (blue).
The darker the color red, the higher degree and density of impervious surfaces exists.
Potential adverse water quality impacts can be reduced through engineering design of
stormwater systems, best management practices, urban forestry and landscaping, and
other initiatives.
Map 5-2: Impervious Surfaces in the Threemile Creek Watershed
5.2.4 Drainage Assessment
Based on SSURGO (Soil Survey Geographic Database) data produced and distributed by
the Natural Resources Conservation Service (NRCS), soil drainage properties can be
spatially analyzed to identify areas where poorly drained soils may add to land use
and impervious surface issues. Increased runoff due to low infiltration rates can
increase transport of contaminants such as pathogens during storm events. The
natural filtering process as water is absorbed into the soil is reduced where poor
drainage exists. Much of the area in the lower part of the Threemile Creek watershed
is considered “poorly drained” or “very poorly drained.” Some of the heavily
urbanized areas in downtown Mobile were not rated due to the lack of availability of
soil samples (all impervious). Aside from stormwater infrastructure, it is safe to
assume that these areas are also considered “very poorly drained.”

THREEMILE CREEK HUC 031602040504
FINAL TMDL DOCUMENT PATHOGENS (ENTEROCOCCI)
Prepared by ADEM/Water Quality Branch 32 / 62
Last Revision: 08/26/2013
Map 5-3: Drainage Characteristics of the Threemile Creek Watershed
5.3 Linkage between Numeric Targets & Sources
5.3.1 Nonpoint Loading Information
The Threemile Creek watershed has three main land cover types: urbanized
developed areas, forests, and all others. Pollutant loadings from forested areas tend
to be low due to their filtering capabilities and will be considered as background
conditions. The most likely sources of pathogen loadings from nonpoint sources in the
TMC watershed are urban runoff, failing septic systems, and illicit discharges. It is
not considered a logical approach to calculate individual components for nonpoint
source loadings. Hence, there will not be individual loads or reductions calculated for
the various nonpoint sources. The loadings and reductions will only be calculated as a
single total nonpoint source load and reduction.

THREEMILE CREEK HUC 031602040504
FINAL TMDL DOCUMENT PATHOGENS (ENTEROCOCCI)
Prepared by ADEM/Water Quality Branch 33 / 62
Last Revision: 08/26/2013
5.4 Data Availability & Analysis
5.4.1 Data Acquisition and Results
Following its listing in 2004, a §303(d) sampling study was performed by ADEM on the
listed segments of TMC for additional water quality assessment. ADEM collected
samples from several different surface water quality stations, including stations along
the entire length of the impaired segments. It should be noted that this segment was
originally listed while fecal coliform was the indicator bacteria used for Alabama’s
listing methodology. In January 2010, Alabama adopted Enterococci as the pathogen
indicator for coastal waterbodies. Consequently, the load reductions within this TMDL
are entirely based on the Enterococci criteria and data, though the fecal coliform
data was also scrutinized in order to formulate the most practical and effective way
to implement the TMDL. Further review of the general water quality and intensive
Enterococci study revealed that the listed segments of TMC were still not meeting the
pathogen criterion applicable to its use classification (A&I). Each station was carefully
examined and the data compiled to identify specific areas of impairment and possible
sources. All stations had multiple single-sample exceedances. Therefore, a TMDL has
been developed for the listed segment of TMC specific to the data collected.
Map 5-4: Threemile Creek Pathogen TMDL Sampling Stations
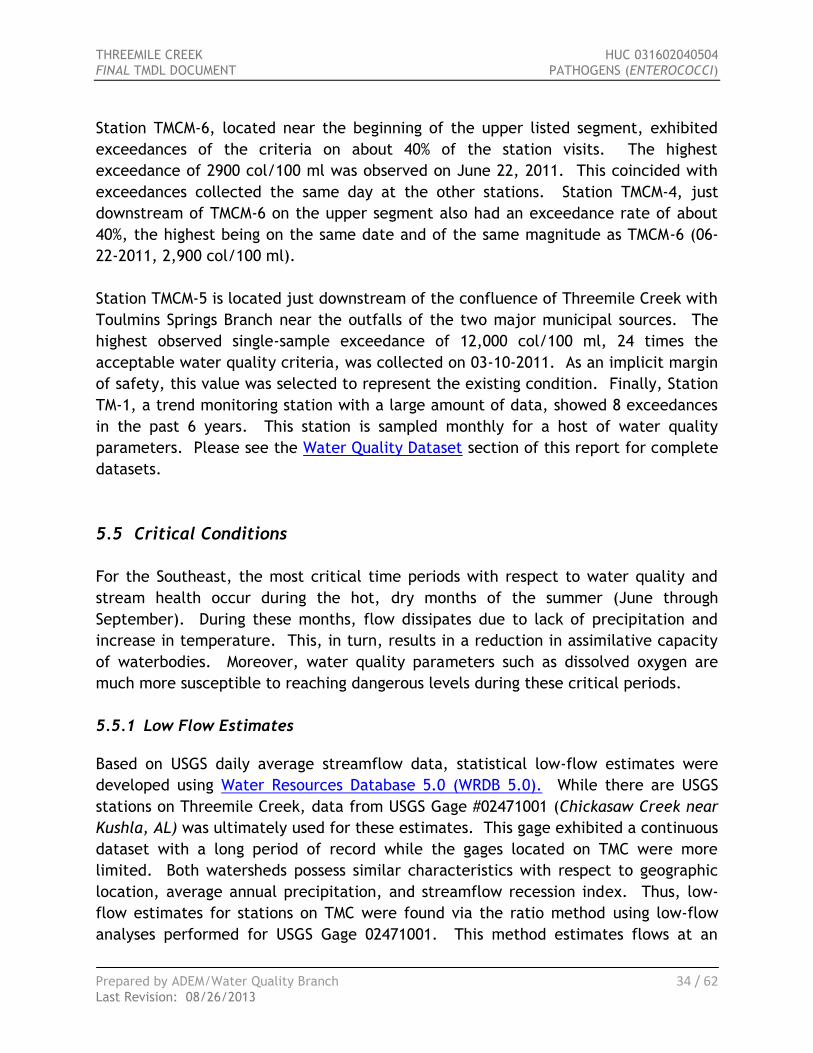
THREEMILE CREEK HUC 031602040504
FINAL TMDL DOCUMENT PATHOGENS (ENTEROCOCCI)
Prepared by ADEM/Water Quality Branch 34 / 62
Last Revision: 08/26/2013
Station TMCM-6, located near the beginning of the upper listed segment, exhibited
exceedances of the criteria on about 40% of the station visits. The highest
exceedance of 2900 col/100 ml was observed on June 22, 2011. This coincided with
exceedances collected the same day at the other stations. Station TMCM-4, just
downstream of TMCM-6 on the upper segment also had an exceedance rate of about
40%, the highest being on the same date and of the same magnitude as TMCM-6 (06-
22-2011, 2,900 col/100 ml).
Station TMCM-5 is located just downstream of the confluence of Threemile Creek with
Toulmins Springs Branch near the outfalls of the two major municipal sources. The
highest observed single-sample exceedance of 12,000 col/100 ml, 24 times the
acceptable water quality criteria, was collected on 03-10-2011. As an implicit margin
of safety, this value was selected to represent the existing condition. Finally, Station
TM-1, a trend monitoring station with a large amount of data, showed 8 exceedances
in the past 6 years. This station is sampled monthly for a host of water quality
parameters. Please see the Water Quality Dataset section of this report for complete
datasets.
5.5 Critical Conditions
For the Southeast, the most critical time periods with respect to water quality and
stream health occur during the hot, dry months of the summer (June through
September). During these months, flow dissipates due to lack of precipitation and
increase in temperature. This, in turn, results in a reduction in assimilative capacity
of waterbodies. Moreover, water quality parameters such as dissolved oxygen are
much more susceptible to reaching dangerous levels during these critical periods.
5.5.1 Low Flow Estimates
Based on USGS daily average streamflow data, statistical low-flow estimates were
developed using Water Resources Database 5.0 (WRDB 5.0). While there are USGS
stations on Threemile Creek, data from USGS Gage #02471001 (Chickasaw Creek near
Kushla, AL) was ultimately used for these estimates. This gage exhibited a continuous
dataset with a long period of record while the gages located on TMC were more
limited. Both watersheds possess similar characteristics with respect to geographic
location, average annual precipitation, and streamflow recession index. Thus, low-
flow estimates for stations on TMC were found via the ratio method using low-flow
analyses performed for USGS Gage 02471001. This method estimates flows at an

THREEMILE CREEK HUC 031602040504
FINAL TMDL DOCUMENT PATHOGENS (ENTEROCOCCI)
Prepared by ADEM/Water Quality Branch 35 / 62
Last Revision: 08/26/2013
ungaged station of a known drainage area based on the drainage area and flows at a
hydrologically similar location. These estimates are available in Section 9.3.2. Low-
flow estimates are often used in permit development and other water quality
calculations as a representation of critical conditions. In this case, however, the
instantaneous streamflow measurement at the Kushla, AL gage was ratioed based on
drainage area in order to find the streamflow for Threemile Creek at the actual time
the sample was collected. Low-flow estimates were still included as a point of
reference and an illustration on the magnitude of flow during critical periods.
5.6 Margin of Safety
There are two methods for incorporating a Margin of Safety (MOS) during a TMDL
analysis: implicitly incorporate the MOS using conservative model assumptions to
develop allocations, or 2) by explicitly specifying a portion of the TMDL as the MOS
and using the remainder for allocations.
Both an explicit and implicit MOS were incorporated into this TMDL. The MOS
accounts for the uncertainty associated with pathogen loadings. An explicit MOS of
10% was applied to the TMDL. An implicit MOS was also incorporated in the TMDL by
basing the existing condition on the highest measured Enterococci organism count
that was collected during critical conditions.

THREEMILE CREEK HUC 031602040504
FINAL TMDL DOCUMENT PATHOGENS (ENTEROCOCCI)
Prepared by ADEM/Water Quality Branch 36 / 62
Last Revision: 08/26/2013
6.0 TMDL DEVELOPMENT
6.1 TMDL Definition & Equations
A total maximum daily load (TMDL) is the sum of individual wasteload allocations for
point sources (WLAs), load allocations (LAs) for nonpoint sources including natural
background levels, and a margin of safety (MOS). As mentioned in the previous
section, the margin of safety can be included either explicitly or implicitly and
accounts for the uncertainty in the relationship between pollutant loads and the
quality of the receiving waterbody. A TMDL can be denoted by the equation:
TMDL = Σ WLAs + Σ LAs + MOS
The TMDL is the total amount of pollutant that can be assimilated by the receiving
waterbody while achieving water quality standards under critical conditions. For
some pollutants, TMDLs are expressed on a mass loading basis (e.g. pounds per day).
However, for pathogens, TMDL loads are typically expressed in terms of organism
counts per day (colonies/day) or by volume (colonies/100 ml), in accordance with 40
CFR 130.2(i).
6.2 Load Calculations
A method similar to a mass balance approach was used to calculate the Enterococci
pathogen TMDL for Threemile Creek. This approach utilizes the conservation of mass
principle (or organism loadings in this case). Total loads can be calculated by
multiplying the Enterococci concentrations by streamflow, yielding a daily organism
count. The existing condition was calculated for the exceedance at station TMCM-5,
which resulted in the highest percent reduction. In the same manner, the allowable
load was calculated by multiplying the single-sample bacteria criterion for coastal
waters by the same flow used in calculating the existing condition.
6.2.1 Allowable Loading
The allowable load of pathogens in the watershed was calculated under the same
physical conditions as discussed in the Existing Conditions section. This was done by
taking the streamflow and multiplying it by the single-sample Enterococci criterion for
the A&I use classification (see Calculation B in Figure 6-2: Pathogen Loading
Worksheet). Calculation C in the same figure shows how the explicit MOS was
calculated. Finally, the allowable loading, including the explicit MOS, is shown in
Calculation D.

THREEMILE CREEK HUC 031602040504
FINAL TMDL DOCUMENT PATHOGENS (ENTEROCOCCI)
Prepared by ADEM/Water Quality Branch 37 / 62
Last Revision: 08/26/2013
In addition to the overall allowable loadings discussed above, allowable loadings were
also calculated for individual point sources based on their design flow and pending
permit limits (which is also the single-sample Enterococci criterion for the A&I use
classification). These calculations are shown below:
Figure 6-1: Allowable WLA Loadings
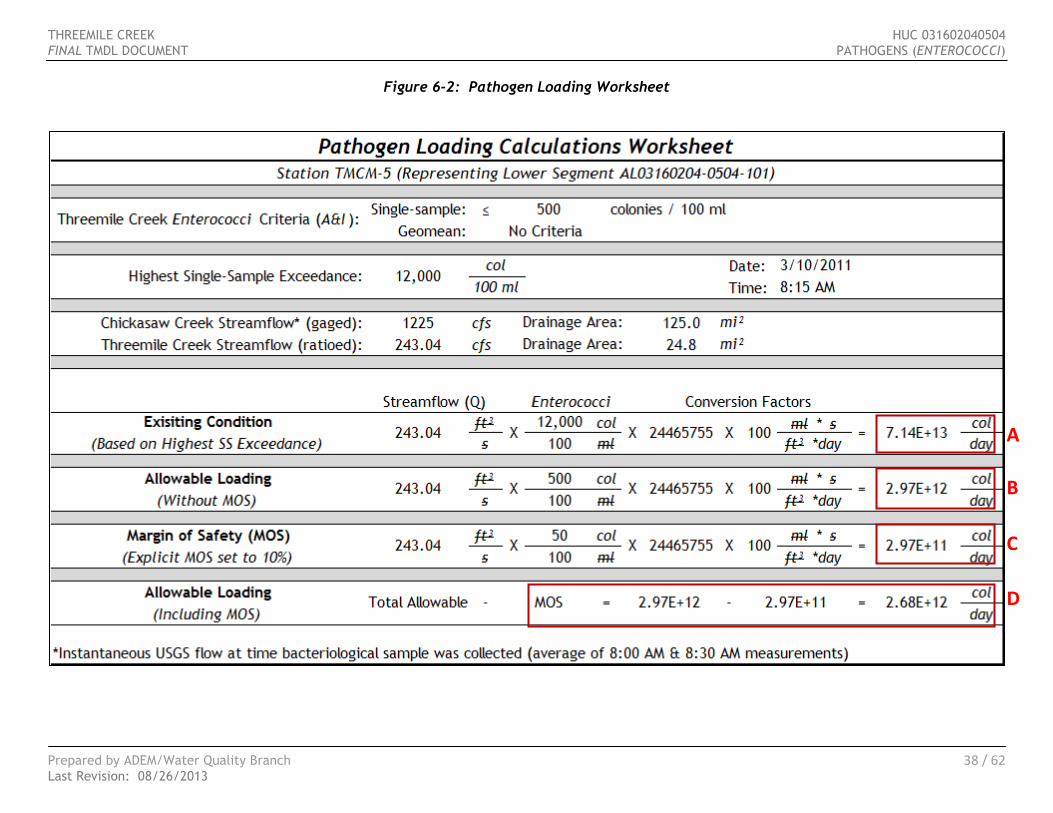
THREEMILE CREEK HUC 031602040504
FINAL TMDL DOCUMENT PATHOGENS (ENTEROCOCCI)
Prepared by ADEM/Water Quality Branch 38 / 62
Last Revision: 08/26/2013
Figure 6-2: Pathogen Loading Worksheet
A
B
C
D

THREEMILE CREEK HUC 031602040504
FINAL TMDL DOCUMENT PATHOGENS (ENTEROCOCCI)
Prepared by ADEM/Water Quality Branch 39 / 62
Last Revision: 08/26/2013
6.2.2 Existing Conditions
The existing pathogen loading conditions were calculated by multiplying the
Enterococci single-sample exceedance concentration of 12,000 col/100 ml by the
instantaneous streamflow of 243.04 cfs. The product of these two values multiplied
by a conversion factor yields the total loading (col/day) of Enterococci (Calculation A
in Figure 6-2: Pathogen Loading Worksheet). Existing LA loading was found by
subtracting the existing WLA loading from the total existing loading.
Figure 6-3: Existing Point Source Loading Calculations
Figure 6-4: Existing Nonpoint Source Loading Calculations
6.2.3 Required Load Reductions
The difference in the pathogen loading between the existing condition (exceedance
event) and the allowable condition (water quality criteria) represents the total load
reduction required and amounts to a 97% reduction. The following tables show the
result of the Enterococci TMDL for Threemile Creek.

THREEMILE CREEK HUC 031602040504
FINAL TMDL DOCUMENT PATHOGENS (ENTEROCOCCI)
Prepared by ADEM/Water Quality Branch 40 / 62
Last Revision: 08/26/2013
Table 6-1: Enterococci Load Reduction Requirements
Source Existing Load a
(colonies/day)
Allowable Load b
(colonies/day)
Required
Reduction
(colonies/day)
% Reduction
Nonpoint Source
Load (LA) 7.13 E+13 2.36 E+12 6.89 E+13 97%
Point Source Load
(WLA) 6.91 E+10 3.19 E+11 0 0%
a. Existing WLA loads were based on facility DMR data at the time the highest instream exceedance was observed.
b. Allowable WLA loads were based on design flow & NPDES-permitted limits for Enterococci (500 colonies /100 ml).
Table 6-2: Individual NPDES Point Source Reductions
Source Existing Load a
(colonies/day)
Allowable Load b
(colonies/day)
Required
Reduction
(colonies/day)
% Reduction
Wright Smith WWTP
(AL0023094) 1.50 E+10 2.42 E+11 0 0%
Carlos Morris WWTP
(AL0023205) 5.40 E+10 7.72 E+10 0 0%
Total WWTPs (WLA) 6.91 E+10 3.19 E+11 0 0%
a. Existing WLA loads were based on facility DMR data at the time the highest instream exceedance was observed
b. Allowable WLA loads were based on design flow & NPDES-permitted limits for Enterococci (500 colonies /100 ml)
Table 6-3: Enterococci Pathogen TMDL Summary for Threemile Creek
TMDL a Margin of
Safety (MOS)
Waste Load Allocation (WLA)
Load Allocation (LA) WWTPs b MS4s c
Leaking
Collection
Systems d
(col/day) (col/day) (col/day) Reduction (col/day) (col/day) Reduction
2.97 E+12 2.97 E+11 3.19 E+11 97% 0 2.36 E+12 97%
a. TMDL was established using the single-sample Enterococci criterion for the A&I use classification (500 colonies/100 ml)
b. WLAs for WWTPs are expressed as a daily maximum. Any future WWTPs (and expansions of existing facilities) must
meet the applicable instream water quality criteria for Enterococci at the point of discharge.
c. Future MS4 areas would be required to demonstrate consistency with the assumptions and requirements of this TMDL.
d. The WLA target for leaking collection systems is zero. It is recognized, however, that a WLA of 0 col/day may not be
practical. For these sources, the WLA is interpreted to mean a reduction in Enterococci loading to the maximum extent
practicable, consistent with the requirement that these sources not contribute to a violation of the water quality
criteria for Enterococci.
Compliance with the terms and conditions of existing and future NPDES permits will
effectively implement the WLA and demonstrate consistency with the assumptions
and requirements of the TMDL. Required load reductions in the LA portion of this

THREEMILE CREEK HUC 031602040504
FINAL TMDL DOCUMENT PATHOGENS (ENTEROCOCCI)
Prepared by ADEM/Water Quality Branch 41 / 62
Last Revision: 08/26/2013
TMDL can be implemented through voluntary measures and may be eligible for CWA
§319 grants.
The Department recognizes that adaptive implementation of this TMDL will be needed
to achieve applicable water quality criteria and we are committed towards targeting
the load reductions to improve water quality in the Threemile Creek watershed. As
additional data and/or information become available, it may become necessary to
revise and/or modify the TMDL accordingly.
7.0 FOLLOW-UP MONITORING
ADEM has adopted a basin approach to water quality management which divides
Alabama’s fourteen major river basins into five groups. Each year, ADEM’s water
quality resources are concentrated in one of the five basin groups. One goal is to
continue to monitor impaired waterbodies. Monitoring will help further characterize
water quality conditions resulting from the implementation of best management
practices and load reductions in the watershed. This monitoring will occur in each
basin according the schedule shown in the table below:
Table 7-1: Surface Water Quality Monitoring Schedule
River Basin Group Year to be
Monitored
Tennessee 2013
Chattahoochee / Chipola / Choctawhatchee / Perdido-Escambia 2014
Alabama / Coosa / Tallapoosa 2015
Escatawpa / Upper Tombigbee / Lower Tombigbee / Mobile 2016
Black Warrior / Cahaba 2017

THREEMILE CREEK HUC 031602040504
FINAL TMDL DOCUMENT PATHOGENS (ENTEROCOCCI)
Prepared by ADEM/Water Quality Branch 42 / 62
Last Revision: 08/26/2013
8.0 PUBLIC PARTICIPATION
As part of the public participation process, this TMDL was placed on public notice and
made available for review and comment. The public notice was prepared and
published in the four major daily newspapers in Montgomery, Huntsville, Birmingham,
and Mobile, as well as submitted to persons who have requested to be on ADEM’s
postal and electronic mailing distributions. In addition, the public notice and subject
TMDL was made available on ADEM’s Website: www.adem.state.al.us. The public can
also request paper or electronic copies of the TMDL by contacting Mr. Chris Johnson at
334-271-7827 or [email protected]. The public was given an opportunity to
review the TMDL and submit comments to the Department in writing. At the end of
the public review period, all written comments received during the public notice
period became part of the administrative record. ADEM considered all comments
received by the public prior to finalization of this TMDL and subsequent submission to
EPA Region 4 for final review and approval.

THREEMILE CREEK HUC 031602040504
FINAL TMDL DOCUMENT PATHOGENS (ENTEROCOCCI)
Prepared by ADEM/Water Quality Branch 43 / 62
Last Revision: 08/26/2013
9.0 APPENDICES
9.1 References
Alabama Department Environmental Management (ADEM), Water Division – Water
Quality Branch. Threemile Creek Organic / Dissolved Oxygen TMDL, December 2006.
ADEM, Water Division – Water Quality Program. Alabama’s 2004 §303(d) List and
Fact Sheet, 2004.
ADEM, Water Division – Water Quality Program. ADEM Administrative Code,
Chapter 335-6-10, Water Quality Criteria, March 2013.
ADEM, Water Division – Water Quality Program. ADEM Administrative Code,
Chapter 335-6-10, Use Classifications for Interstate and Intrastate Waters, March
2013.
ADEM, Water Division – Water Quality Program. Alabama’s Water Quality
Assessment and Listing Methodology, 2012.
ADEM, Water Division – Field Operations Division. Alabama’s Surface Water Quality
Monitoring Plan. 2000 - 2012. ADEM.
Griffith, G.E., Omernik, J.M., Comstock, J.A., Lawrence, S., Martin, G., Goddard, A., Hulcher, V.J., and Foster, T., 2001, Ecoregions of Alabama and Georgia, (color poster with map, descriptive text, summary tables, and photographs): Reston, Virginia, U.S. Geological Survey (map scale 1:1,700,000).
James M. Omernik, Glenn E. Griffith (Lead Author);Mark McGinley (Topic Editor)
"Ecoregions of Mississippi (EPA)". In: Encyclopedia of Earth. Eds. Cutler J.
Cleveland (Washington, D.C.: Environmental Information Coalition, National
Council for Science and the Environment). [First published in the Encyclopedia of
Earth December 11, 2008; Last revised Date June 25, 2012; Retrieved May 9, 2013
<http://www.eoearth.org/article/Ecoregions_of_Mississippi_(EPA)>
McPherson, A.K., Gill, A.C., and Moreland, R.S., 2005, Assessment of water quality, benthic invertebrates, and periphyton in the Threemile Creek basin, Mobile, Alabama, 1999 – 2003: U.S. Geological Survey Scientific Investigations Report 2004 – 5302, 153 p.

THREEMILE CREEK HUC 031602040504
FINAL TMDL DOCUMENT PATHOGENS (ENTEROCOCCI)
Prepared by ADEM/Water Quality Branch 44 / 62
Last Revision: 08/26/2013
Mettee, Maurice F., O’neil, Patrick E., Pierson, and J. Malcolm. Fishes of Alabama
and the Mobile Basin. Birmingham, AL. Oxmoor House Publishing, 1996. Print.
United States Environmental Protection Agency, 1991. Guidance for Water Quality-
Based Decisions: The TMDL Process. Office of Water. EPA 440/4-91-001.
United States Environmental Protection Agency, 1986. Quality Criteria for Water.
Office of Water. EPA 440/4-91-001.

THREEMILE CREEK HUC 031602040504
FINAL TMDL DOCUMENT PATHOGENS (ENTEROCOCCI)
Prepared by ADEM/Water Quality Branch 45 / 62
Last Revision: 08/26/2013
9.2 Listing Methodology Criteria
Table 9-1: 303(d) Listing Requirements
Table 9-2: 303(d) Delisting Requirements

THREEMILE CREEK HUC 031602040504
FINAL TMDL DOCUMENT PATHOGENS (ENTEROCOCCI)
Prepared by ADEM/Water Quality Branch 46 / 62
Last Revision: 08/26/2013
9.3 Water Quality Dataset
9.3.1 303(d) sampling Results (Intensive Survey)
Table 9-3: TMCM-5 ADEM Enterococci Data (Lower Segment)
Station ID
Visit Date Enterococcus Col / 100ml Geomean (Col / 100ml)
TMCM-5 3/10/2011 12000
TMCM-5 4/4/2011 50
TMCM-5 5/11/2011 82
TMCM-5 6/21/2011 570
477
TMCM-5 6/22/2011 3000
TMCM-5 6/23/2011 96
TMCM-5 6/27/2011 250
TMCM-5 7/12/2011 600
TMCM-5 8/23/2011 900
220
TMCM-5 8/24/2011 590
TMCM-5 8/29/2011 44
TMCM-5 8/30/2011 200
TMCM-5 9/13/2011 110
TMCM-5 10/12/2011 42
N: 14
Minimum: 42
Maximum: 12000
Median: 225
Mean: 1323.86
Exceedance Rate: 43%
Table 9-4: TM-1 ADEM Enterococci Data (Lower Segment)
Station ID
Visit Date Enterococcus Col / 100ml Geomean (Col / 100ml)
TM-1 2/7/2007 2
TM-1 3/22/2007 6
TM-1 4/12/2007 120
TM-1 5/29/2007 88
TM-1 6/18/2007 8

THREEMILE CREEK HUC 031602040504
FINAL TMDL DOCUMENT PATHOGENS (ENTEROCOCCI)
Prepared by ADEM/Water Quality Branch 47 / 62
Last Revision: 08/26/2013
TM-1 7/5/2007 600
TM-1 8/6/2007 230
TM-1 8/14/2007 50
TM-1 8/21/2007 490
TM-1 8/29/2007 390
TM-1 9/4/2007 360
TM-1 10/15/2007 120
TM-1 11/19/2007 2
TM-1 12/11/2007 4
TM-1 1/9/2008 4
TM-1 2/19/2008 600
TM-1 3/25/2008 2
TM-1 4/15/2008 40
TM-1 5/6/2008 30
TM-1 6/12/2008 38
TM-1 7/2/2008 2
TM-1 8/4/2008 2
TM-1 9/9/2008 48
TM-1 10/16/2008 240
TM-1 12/3/2008 2
TM-1 1/8/2009 570
TM-1 2/26/2009 40
TM-1 3/17/2009 600
TM-1 4/16/2009 18
TM-1 5/11/2009 8
TM-1 6/15/2009 2
TM-1 7/13/2009 10
TM-1 8/18/2009 600
TM-1 9/23/2009 48
TM-1 10/19/2009 6
TM-1 11/12/2009 300
TM-1 12/9/2009 10
TM-1 1/25/2010 2300
TM-1 2/18/2010 2

THREEMILE CREEK HUC 031602040504
FINAL TMDL DOCUMENT PATHOGENS (ENTEROCOCCI)
Prepared by ADEM/Water Quality Branch 48 / 62
Last Revision: 08/26/2013
TM-1 5/12/2010 40
TM-1 7/27/2010 2
TM-1 9/13/2010 82
TM-1 5/24/2011 68
TM-1 7/26/2011 1200
TM-1 9/27/2011 2
TM-1 8/16/2012 6
TM-1 9/6/2012 580
TM-1 10/17/2012 470
N: 48
Minimum: 2
Maximum: 2300
Median: 40
Mean: 217.54
Exceedance Rate: 17%
Table 9-5: TMCM-4 ADEM Enterococci Data (Upper Segment)
Station ID
Visit Date Enterococcus Col / 100ml Geomean (Col / 100ml)
TMCM-4 3/10/2011 1300
TMCM-4 4/4/2011 50
TMCM-4 5/11/2011 84
TMCM-4 6/20/2011 20
140
TMCM-4 6/21/2011 20
TMCM-4 6/22/2011 2900
TMCM-4 6/23/2011 76
TMCM-4 7/12/2011 600
TMCM-4 8/23/2011 600
71
TMCM-4 8/24/2011 1100
TMCM-4 8/29/2011 2
TMCM-4 8/31/2011 32
TMCM-4 9/13/2011 44
TMCM-4 10/12/2011 8
N: 14
Minimum: 2

THREEMILE CREEK HUC 031602040504
FINAL TMDL DOCUMENT PATHOGENS (ENTEROCOCCI)
Prepared by ADEM/Water Quality Branch 49 / 62
Last Revision: 08/26/2013
Maximum: 2900
Median: 63
Mean: 488.29
Exceedance Rate: 36%
Table 9-6: TMCM-6 ADEM Enterococci Data (Upper Segment))
Station ID
Visit Date Enterococcus Col / 100ml Geomean (Col / 100ml)
TMCM-6 3/10/2011 700
TMCM-6 4/5/2011 1300
TMCM-6 5/11/2011 14
TMCM-6 6/21/2011 20
155
TMCM-6 6/22/2011 2900
TMCM-6 6/23/2011 76
TMCM-6 6/27/2011 34
TMCM-6 7/12/2011 600
TMCM-6 8/23/2011 1600
17
TMCM-6 8/24/2011 2
TMCM-6 8/29/2011 10
TMCM-6 8/30/2011 20
TMCM-6 9/13/2011 2
TMCM-6 10/12/2011 4
N: 14
Minimum: 2
Maximum: 2900
Median: 27
Mean: 520.14
Exceedance Rate: 36%

THREEMILE CREEK HUC 031602040504
FINAL TMDL DOCUMENT PATHOGENS (ENTEROCOCCI)
Prepared by ADEM/Water Quality Branch 50 / 62
Last Revision: 08/26/2013
Table 9-7: USGS Pathogen Indicator Data (2000-2003) (USGS, 2004)
9.3.2 Low-flow Estimates
Figure 9-1: Low-flow Estimate for TMCM-5

THREEMILE CREEK HUC 031602040504
FINAL TMDL DOCUMENT PATHOGENS (ENTEROCOCCI)
Prepared by ADEM/Water Quality Branch 51 / 62
Last Revision: 08/26/2013
Figure 9-2: Low-flow Estimate for TMCM-4

THREEMILE CREEK HUC 031602040504
FINAL TMDL DOCUMENT PATHOGENS (ENTEROCOCCI)
Prepared by ADEM/Water Quality Branch 52 / 62
Last Revision: 08/26/2013
Figure 9-3: 7Q10 Analysis Graph
Figure 9-4: 1Q10 Analysis Graph
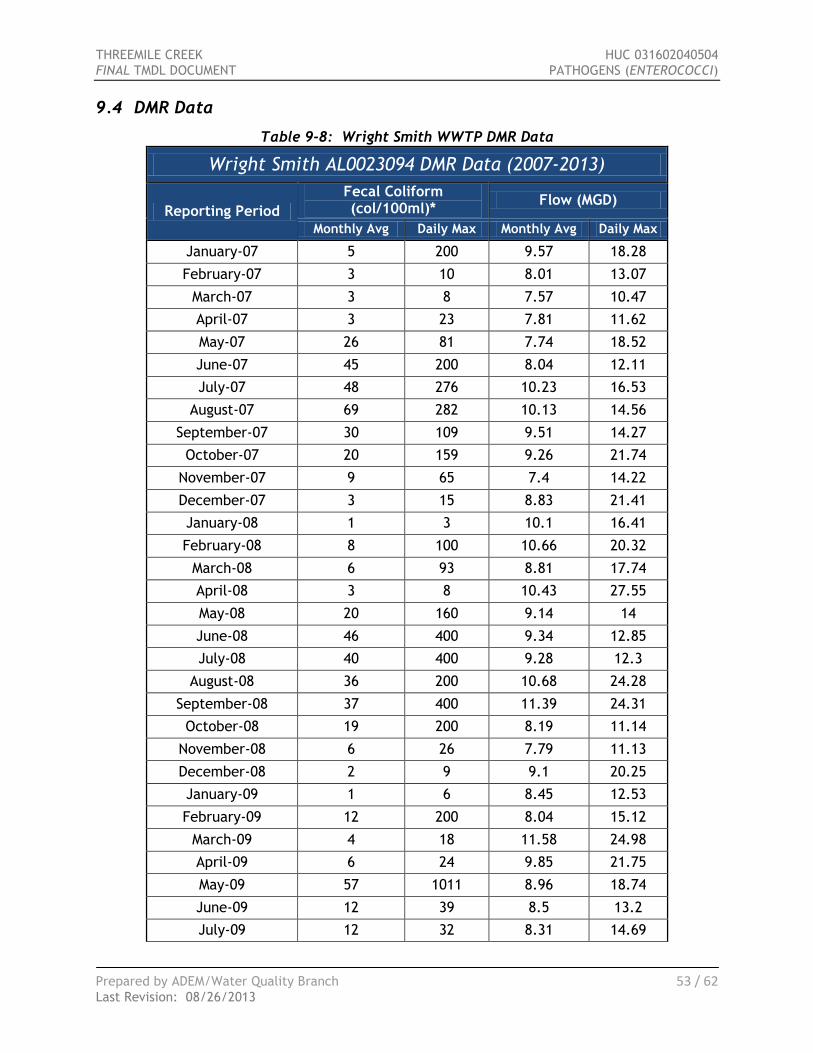
THREEMILE CREEK HUC 031602040504
FINAL TMDL DOCUMENT PATHOGENS (ENTEROCOCCI)
Prepared by ADEM/Water Quality Branch 53 / 62
Last Revision: 08/26/2013
9.4 DMR Data
Table 9-8: Wright Smith WWTP DMR Data
Wright Smith AL0023094 DMR Data (2007-2013)
Reporting Period
Fecal Coliform (col/100ml)*
Flow (MGD)
Monthly Avg Daily Max Monthly Avg Daily Max
January-07 5 200 9.57 18.28
February-07 3 10 8.01 13.07
March-07 3 8 7.57 10.47
April-07 3 23 7.81 11.62
May-07 26 81 7.74 18.52
June-07 45 200 8.04 12.11
July-07 48 276 10.23 16.53
August-07 69 282 10.13 14.56
September-07 30 109 9.51 14.27
October-07 20 159 9.26 21.74
November-07 9 65 7.4 14.22
December-07 3 15 8.83 21.41
January-08 1 3 10.1 16.41
February-08 8 100 10.66 20.32
March-08 6 93 8.81 17.74
April-08 3 8 10.43 27.55
May-08 20 160 9.14 14
June-08 46 400 9.34 12.85
July-08 40 400 9.28 12.3
August-08 36 200 10.68 24.28
September-08 37 400 11.39 24.31
October-08 19 200 8.19 11.14
November-08 6 26 7.79 11.13
December-08 2 9 9.1 20.25
January-09 1 6 8.45 12.53
February-09 12 200 8.04 15.12
March-09 4 18 11.58 24.98
April-09 6 24 9.85 21.75
May-09 57 1011 8.96 18.74
June-09 12 39 8.5 13.2
July-09 12 32 8.31 14.69

THREEMILE CREEK HUC 031602040504
FINAL TMDL DOCUMENT PATHOGENS (ENTEROCOCCI)
Prepared by ADEM/Water Quality Branch 54 / 62
Last Revision: 08/26/2013
August-09 14 40 10.08 15.78
September-09 5 32 11.4 20.91
October-09 19 200 9.06 14.84
November-09 9 80 8.9 25.81
December-09 8 78 14.81 29.98
January-10 3 35 13.45 28.95
February-10 1 2 14.68 27.46
March-10 11 200 12.26 23.83
April-10 1 3 10.27 13.24
May-10 6 23 12.26 23.83
June-10 11 57 9.52 17.05
July-10 20 200 8.26 9.58
August-10 17 200 10.01 16.24
September-10 29 200 8.26 12.03
October-10 25 200 7.15 9.26
November-10 206 2300 8.51 16.69
December-10 11 200 9.24 12.93
January-11 1 1 8.09 13.38
February-11 1 2 8.67 14.53
March-11 3 31 9.11 17.47
April-11 2 10 7.61 8.24
May-11 14 105 7.35 8.16
June-11 21 128 7.89 10.09
July-11 22 215 10.1 20.99
August-11 41 200 9.74 20.25
September-11 29 200 10.97 25.23
October-11 23 99 7.23 7.85
November-11 5 35 6.96 9.99
December-11 10 191 6.67 8.07
January-12 1 1 6.92 10.67
February-12 1 6 9.18 18.96
March-12 1 12 9.99 18.56
April-12 24 400 7.99 11.08
May-12 47 400 9.55 27.69
June-12 38 229 13.02 29.11
July-12 16 63 10.53 14.89
August-12 30 150 11.66 14.09
September-12 13 67 11.88 28.2

THREEMILE CREEK HUC 031602040504
FINAL TMDL DOCUMENT PATHOGENS (ENTEROCOCCI)
Prepared by ADEM/Water Quality Branch 55 / 62
Last Revision: 08/26/2013
October-12 8 63 8.41 21.36
November-12 2 6 7.25 8.1
December-12 3 28 7.48 10.63
January-13 6 35 8.21 16.5
February-13 1 4 13.59 23.3
March-13 13 244 8.5 27.09
Fecal Coliform (col/100ml)*
Flow (MGD)
Monthly Avg Daily Max Monthly Avg Daily Max
90th %-ile: 40.60 279.60 11.79 26.58
Min: 1.00 1.00 6.67 7.85
Max: 206.00 2300.00 14.81 29.98
Mean: 18.19 156.43 9.40 17.11
Median: 11.00 80.00 9.11 16.24
N: 75.00 75.00 75.00 75.00
*Fecal Coliform used in absence of Enterococci data
Table 9-9: Carlos A Morris WWTP DMR Data
Carlos Morris AL0023205 DMR Data (2007-2013)
Reporting Period Enterococci (col/100ml) Flow (MGD)
Monthly Avg Daily Max Monthly Avg Daily Max
January-07 102 2420 2.64 3.74
February-07 781 2420 1.74 2.56
March-07 186 2460 1.62 2.07
April-07 86 2420 1.87 2.13
May-07 No Data
June-07 3 18 2.1 4.6
July-07 12 3000 2.898 3.657
August-07 7.3 4900 2.485 12.8
September-07 12 2800 2.16 4.97
October-07 4 154 2.367 9.35
November-07 3 2700 1.669 3.37
December-07 5 80000 2.765 8.79
January-08 3 17 3.865 5.074
February-08 7 490 3.888 8.21
March-08 2 2 2.596 6.9
April-08 2 6 2.842 11.15

THREEMILE CREEK HUC 031602040504
FINAL TMDL DOCUMENT PATHOGENS (ENTEROCOCCI)
Prepared by ADEM/Water Quality Branch 56 / 62
Last Revision: 08/26/2013
May-08 2 13 2.257 5.394
June-08 3 20 2.039 4.235
July-08 3 12 2.04 5.038
August-08 3 15 2.217 7.113
September-08 3 210 3.002 11.39
October-08 3 13 1.378 3.893
December-08 No Data
January-09 3 70 2.348 5.842
February-09 2 2 2.155 6.45
March-09 3 25 3.524 11.424
May-09 4 210 2.356 11.207
June-09 2 2 1.935 6.29
July-09 6 380 1.858 5.011
August-09 3 64 5.066 12.764
September-09 2 4 4.526 10.551
October-09 5 126 3.178 6.816
November-09 113 5600 2.669 7.144
December-09 4 72 5.732 12.864
January-10 4 1070 4.422 10.155
February-10 0.1 0.1 4.381 7.305
March-10 2 40 2.874 6.36
April-10 2 2 1.721 2.857
May-10 5 5300 2.855 10.276
June-10 4 310 2.517 6.519
July-10 2 10 1.673 3.72
August-10 2 2 3.199 8.206
September-10 2 12 1.659 4.888
October-10 2 8 1.297 3.255
November-10 3 84 2.77 11.932
December-10 2 35 3.034 9.161
January-11 3 74 3.166 6.501
February-11 6 460 4.003 15.4
March-11 10 350 2.799 11.602
April-11 6 8000 1.447 2.222
May-11 2 13 1.252 1.556
June-11 2 2 1.293 1.982
July-11 2 2 3.46 18.596
August-11 2 12 1.424 3.49

THREEMILE CREEK HUC 031602040504
FINAL TMDL DOCUMENT PATHOGENS (ENTEROCOCCI)
Prepared by ADEM/Water Quality Branch 57 / 62
Last Revision: 08/26/2013
September-11 2 2 3.624 21.308
October-11 2 2 1.043 1.4
November-11 2 2 1.504 4.841
December-11 2 2 1.951 4.139
January-12 2 2 1.914 7.103
February-12 3 13 3.896 17.938
March-12 3 34 3.633 18.962
April-12 2 6 1.654 4.001
May-12 2 5 2.242 12.979
June-12 3 100 3.512 12.799
July-12 2 2 1.71 5.857
August-12 2 5 3.665 21.921
September-12 2 2 3.728 16.572
October-12 2 3 1.624 6.94
November-12 3 22 1.618 2.432
December-12 4 52 2.197 4.137
January-13 3 72 2.572 5.662
February-13 3 16 5.658 8.838
March-13 3 10 2.866 5.08
Enterococci (col/100ml) Flow (MGD)
Monthly Avg Daily Max Monthly Avg Daily Max
90th %-ile: 10.00 2700.00 3.90 12.98
Min: 0.10 0.10 1.04 1.40
Max: 781.00 80000.00 5.73 21.92
Mean: 20.98 1785.68 2.64 7.77
Median: 3.00 20.00 2.49 6.50
N: 71.00 71.00 71.00 71.00

THREEMILE CREEK HUC 031602040504
FINAL TMDL DOCUMENT PATHOGENS (ENTEROCOCCI)
Prepared by ADEM/Water Quality Branch 58 / 62
Last Revision: 08/26/2013
9.5 Facility DMR Data (March 2011)
Figure 9-5: Wright Smith WWTP DMR Form (March 2011)

THREEMILE CREEK HUC 031602040504
FINAL TMDL DOCUMENT PATHOGENS (ENTEROCOCCI)
Prepared by ADEM/Water Quality Branch 59 / 62
Last Revision: 08/26/2013
Figure 9-6: Carlos A. Morris WWTP (March 2011)

THREEMILE CREEK HUC 031602040504
FINAL TMDL DOCUMENT PATHOGENS (ENTEROCOCCI)
Prepared by ADEM/Water Quality Branch 60 / 62
Last Revision: 08/26/2013
9.6 Supporting Photographs
Picture 9-1: Threemile Creek @ I-65 (Upstream View) – 1/29/2013
Picture 9-2: Threemile Creek @ I-65 (Downstream View) – 1/29/2013
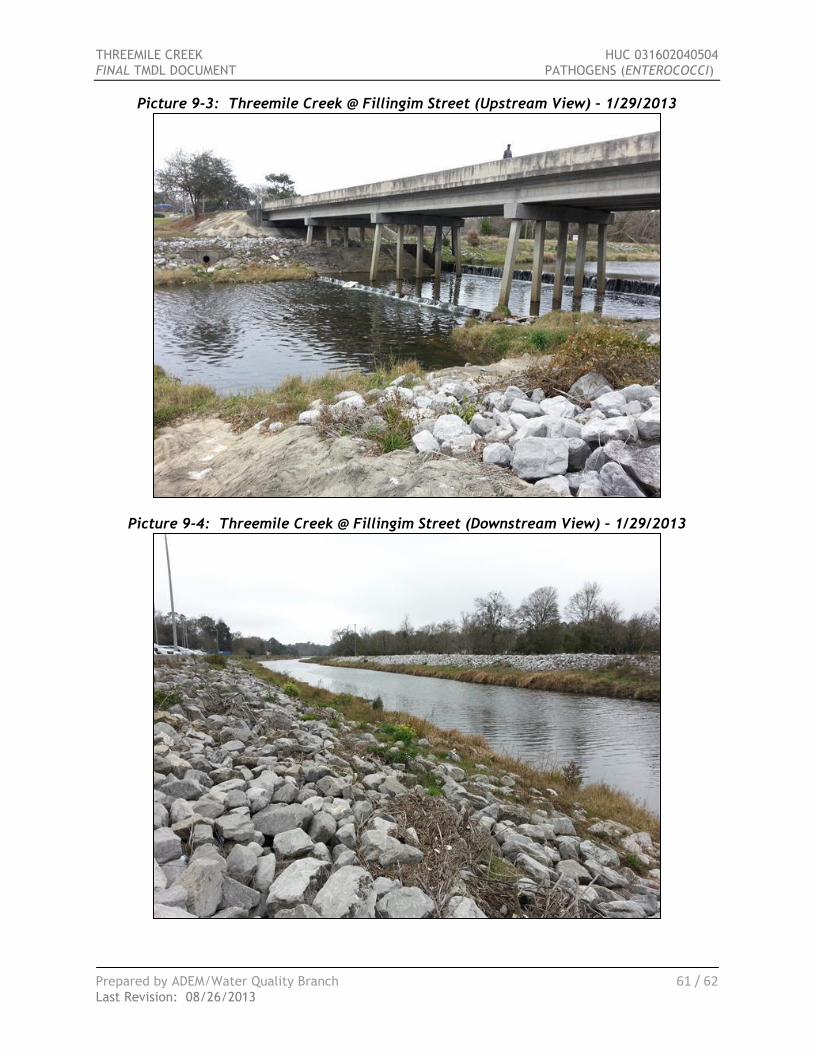
THREEMILE CREEK HUC 031602040504
FINAL TMDL DOCUMENT PATHOGENS (ENTEROCOCCI)
Prepared by ADEM/Water Quality Branch 61 / 62
Last Revision: 08/26/2013
Picture 9-3: Threemile Creek @ Fillingim Street (Upstream View) – 1/29/2013
Picture 9-4: Threemile Creek @ Fillingim Street (Downstream View) – 1/29/2013

THREEMILE CREEK HUC 031602040504
FINAL TMDL DOCUMENT PATHOGENS (ENTEROCOCCI)
Prepared by ADEM/Water Quality Branch 62 / 62
Last Revision: 08/26/2013
Picture 9-5: Threemile Creek @ Confluence w/ TMC UT (Upstream View) – 1/29/2013
Picture 9-6: Threemile Creek @ Confluence w/ TMC UT (Upstream View) – 1/29/2013