i-710 initial screening results - metromedia.metro.net/projects_studies/i710/images/initial...
TRANSCRIPT

Los Angeles County Metropolitan Transportation Authority
I-710 Initial Screening ResultsPresented to I-710 CAC
February 18, 2009

2
• Purpose of Alternatives Screening
• Review of Alternatives
• Findings by Goal/Objective
• CAC Discussion
Presentation Overview

3
HybridAlternative
(LPS)
Major Corridor Study Phase
Winter 2002 Summer 2002 Fall 2004
Initial SetFinal Set
LPS
Many Alternatives, Less Detail Fewer Alternatives, More Detail
Hybrid Alternative(LPS)
New Ideas/Community Input
TIER II Report
Alt 3Low GP
Alt 1No Build
Alt 7Medium Truck
Alt 5Medium HOV
Alt 11High HOV
Alt 9High Truck
Alt 4Low Truck
Alt 2TSM/TDM
Alt 8High GP
Alt 6Medium GP
Alt 12High Rail
Alt 10High GM
Alt ANo Build
Alt CMedium GP
Alt BTSM/TDM
Alt EHigh Truck
Alt DHigh GP
Alternatives Screening Process

4
Winter 2008 Summer 2010
Scoping
EnvironmentalAnalysis LPA
Summer 2011Summer 2008
EIR/EIS Phase
Hybrid Alternative(LPS)
New Ideas/Community Input
TIER II Report
Alt 1No Build
Alt 3Alt. Technology
Alt 2TSM/TDM
Alt 5GP Lane Imp.
Alt 4Congestion Relief
Alt 6Alt. 5 + Freight
Corridor
LPA
Screened Alt. 2
Screened Alt. 1
No Build
Many Alternatives, Less Detail Fewer Alternatives, More Detail
Alternatives Screening Process

5
Alternatives for Screening
1. No Build2. Transportation System Management/Transportation
Demand Management/Transit3. Goods Movement Enhancement by Railroad and/or
Advanced Technology (fixed guideway)4. Arterial Highways and I-710 Congestion Relief
Improvements (includes Alternatives 2 and 3(Rail) )5. Mainline I-710 Improvements (includes Alternatives 2,
3(Rail) and 4)A. 10 General Purpose Lanes or, B. 8 General Purpose Lanes w/ 1 carpool lane in each direction (total of
10)
6. Hybrid LPS (includes Alternative 5 + freight corridor of 4 truck lanes)

6
• Mobility
• Air Quality
• Traffic Safety
• Right of Way Impacts
• Environmental Impacts
• Cost
Screening Criteria

7
Mobility Measures
8
• Screenline Volume/Capacity Ratios on I-710 General Purpose Lanes
• Total Screenline Volume/Capacity Ratios
• I-710 Travel Time
Overview of Mobility Screening Measures
9
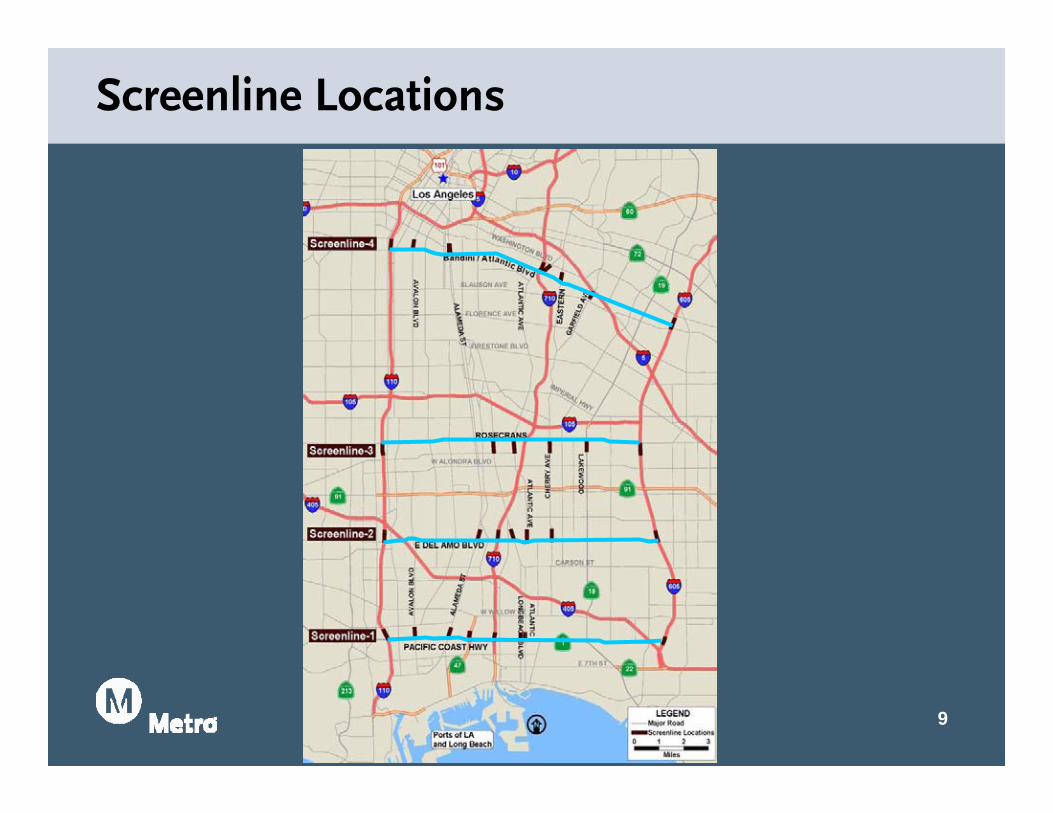
Screenline Locations

10
Year 2035 Screenline V/C Ratio on I-710 General Purpose Lanes by Time Period (PM Peak Period NB)
0.00
0.20
0.40
0.60
0.80
1.00
1.20
1.40
PCH (1) Del Amo (2) Rosecrans (3) Atlantic/Bandini (4)
Screenlines
Volu
me/
Cap
acity
Rat
io
1-No Build 2-TSM/TDM3-Adv Tech4-Art Impv5A-10 GP Lns5B-HOV Lns6-LPS
Mobility Screening Results

11
Year 2035 Total Screenline (I-710, I-110, I-605, Arterials) V/C Ratio (PM Peak NB)
0.00
0.20
0.40
0.60
0.80
1.00
1.20
1.40
PCH (1) Del Amo (2) Rosecrans (3) Atlantic/Bandini (4)
Screenlines
Volu
me/
Cap
acity
Rat
io
1-No Build 2-TSM/TDM3-Adv Tech4-Art Impv5A-10 GP Lns5B-HOV Lns6-LPS
Mobility Screening Results

12
Year 2035 I-710 PM Peak Travel Times in Northbound Direction (Ocean Blvd. to SR-60)
0
10
20
30
40
50
60
70
1 2 3 4 5A 5B 6
Alternatives
Min
utes
GP LnsHOV Lns
Mobility Screening Results
Truck Lns

13
• Substantial need for new capacity in corridor demonstrated by No-Build V/C
– Only Alternative 6 provides sufficient capacity to reduce peak period I-710 V/C’s below 1.0
– Reduction in Alternative 6 total screenline V/C suggests potential for significant positive impacts on arterials as compared to other alternatives
Mobility Screening Findings

14
• Results at Screenline 1 (PCH) suggest Alternative 6 may have more capacity south of I-405(14 lanes) on I-710 than needed
– Alternatives 5A and 5B (10 lanes) also provide peak period speeds of 50 mph or higher at south end
• Only Alternative 6 has average end-to-end speed on I-710 GP lanes higher than 35 mph
• Top performing alternatives:
– Alternative 6 (1st), Alternative 5A (2nd), Alternative 5B (3rd)
Mobility Screening Findings

15
Air Quality Measures

16
Overview of Air Quality Screening Measures
• Screening analysis metrics:– Criteria pollutants (ozone, PM, NO2):
Daytime Freeway Oxides of Nitrogen (NOx) Emissions
– Air toxics: Daytime Freeway Diesel Particulate Matter (DPM) Emissions
• Emissions estimated using screenline information (vehicle volumes and average speed)
• Screening analysis: Year 2035 freeway (I-710, I-110, I-605) emissions only– 2035 per-vehicle emissions are 80 to 90% lower than 2008
17
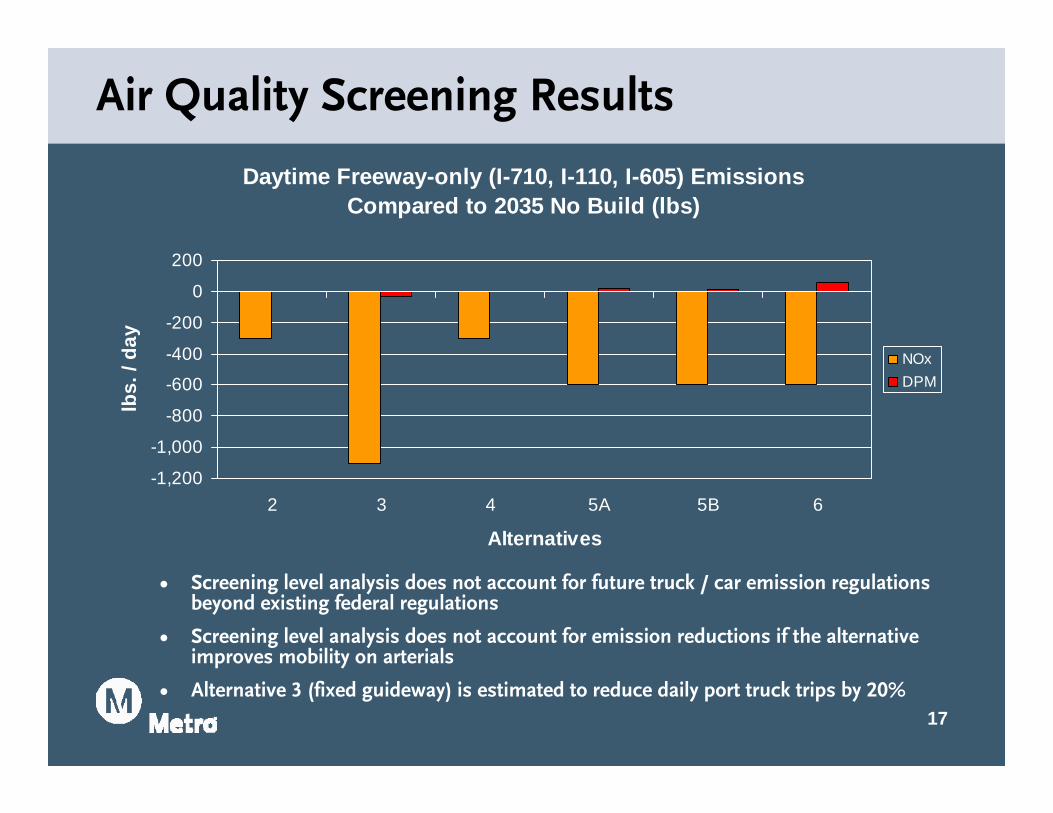
Air Quality Screening Results
Daytime Freeway-only (I-710, I-110, I-605) Emissions Compared to 2035 No Build (lbs)
-1,200
-1,000
-800
-600
-400
-200
0
200
2 3 4 5A 5B 6
Alternatives
lbs.
/ da
y
NOxDPM
• Screening level analysis does not account for future truck / car emission regulations beyond existing federal regulations
• Screening level analysis does not account for emission reductions if the alternative improves mobility on arterials
• Alternative 3 (fixed guideway) is estimated to reduce daily port truck trips by 20%
18
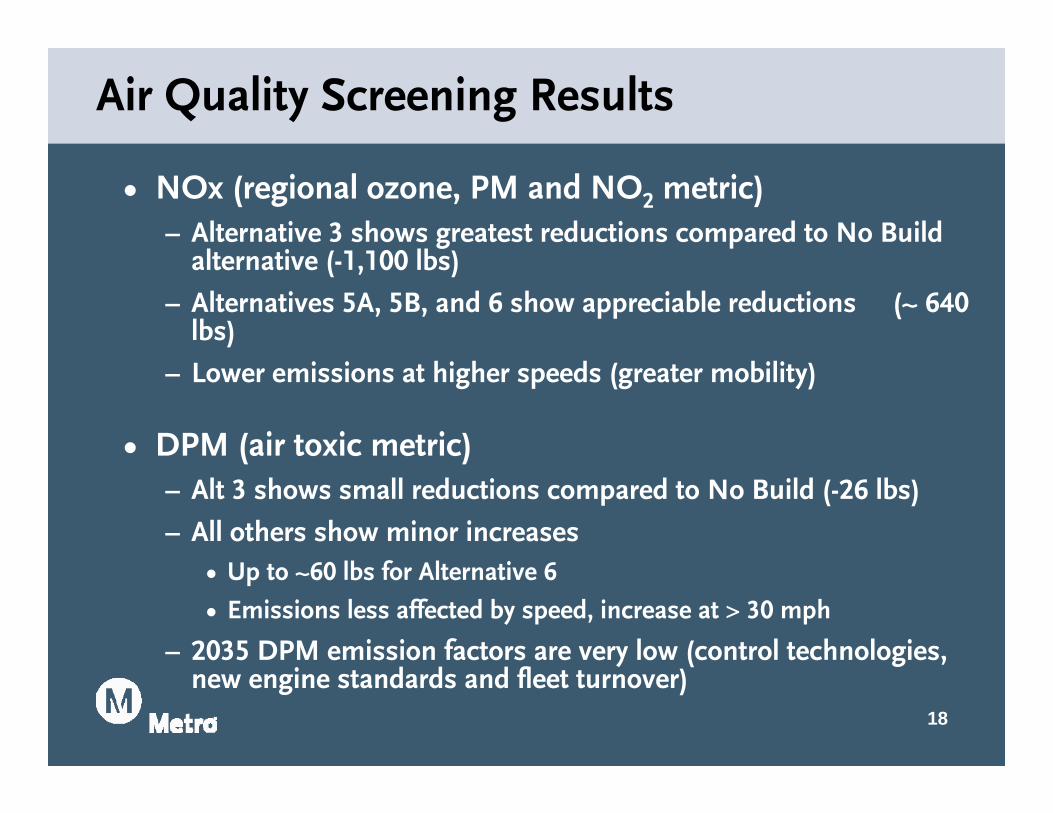
• NOx (regional ozone, PM and NO2 metric)– Alternative 3 shows greatest reductions compared to No Build
alternative (-1,100 lbs)
– Alternatives 5A, 5B, and 6 show appreciable reductions (~ 640 lbs)
– Lower emissions at higher speeds (greater mobility)
• DPM (air toxic metric)– Alt 3 shows small reductions compared to No Build (-26 lbs)
– All others show minor increases• Up to ~60 lbs for Alternative 6
• Emissions less affected by speed, increase at > 30 mph
– 2035 DPM emission factors are very low (control technologies, new engine standards and fleet turnover)
Air Quality Screening Results

19
Air Quality Screening Findings
• All 2035 alternatives may show emission decreases compared to 2008 baseline (new standards/controls vs. VMT increases)
• Compared to the 2035 No Build Alternative:– Alternative 3 (fixed guideway) shows greatest
reductions in NOx, DPM• 22,400 daily truck trips (~20% of Port trucks) eliminated by
fixed guideway container transport technology
– Alternatives 5A, 5B, and 6 show appreciable reductions in NOx with slight increases in DPM
• DPM emissions could be reduced with alternative (zero-emission) technologies

20
Air Quality Screening Findings
• Screening analysis does not include effect of improved mobility on arterials (not feasible to include in screening analysis) – NOx and DPM emissions would be reduced for
alternatives that improve mobility on arterials
• Greenhouse gases (CO2 – qualitative):– Expect similar response among alternatives as NOx

21
Traffic Safety Measures

22
• Percentage of PM Peak Period Traffic on I-710 General Purpose Lanes Consisting of Heavy Duty Trucks
– Reflects the significant mix of trucks and passenger vehicles
• Number of Existing Highway Design Deficiencies Eliminated
Overview of Traffic Safety Measures

23
Heavy Duty Trucks as a Percent of Total Traffic in GP Lanes (PM Peak NB)
0%
5%
10%
15%
20%
25%
30%
35%
PCH (1) Del Amo (2) Rosecrans (3) Atlantic/Bandini (4)
Screenlines
% H
DT
(Veh
icle
s) 1-No Build 2-TSM/TDM3-Adv Tech4-Art Impv5A-10 GP Lns5B-HOV Lns6-LPS
Traffic Safety Screening Results

24
Traffic Safety Screening Results
Number of Existing Physical Design Deficiencies Eliminated
• Examples of design deficiencies are: – Poor weaving and merging conditions– Poor sight distance– Sharp curvature of ramp alignments
Over 500 existing deficiencies throughout the corridor
420420420135000
65B5A4321
Alternatives
25
• Proposed design improvements and Heavy Duty Truck reductions should substantially reduce accident rates
• Alternative 6 has the lowest percentage of HDT on the GP lanes as it separates cars and trucks– This percentage could be reduced further through the
inclusion of alternative technology
• Alternative 6 plus Alternative 3 are best for traffic safety
• Alternatives 5A and 5B provide safety benefits
Traffic Safety Screening Findings

26
Right of Way Measures

27
• Number of Impacted Residential Properties
• Number of Impacted Non-Residential Buildings
• Potential Relocations of Regionally Significant Utilities – Power Transmission
Overview of Right of Way Measures

28
Right of Way Requirement Assumptions
• LPS from Major Corridor Study required approval of some non-standard designs to avoid residential impacts
• Designs of current alternatives have been updated
• Requirements are based upon standard designs and protocols
Overview of Right of Way Measures

29
Right of Way Screening Results
1 2 3 4 5A 5B 6
0
5
10
15
20
25
30
35
40
45
50
Num
ber o
f Im
pact
ed P
rope
rtie
s
Alternatives
Number of Impacted Residential Properties
with 91 Connectors

30
Right of Way Screening Results
*Alternative 3 results do not include land required for fixed guideway terminals andterminal connectors (approx. 3 acres/marine terminal)
Number of Impacted Non-Residential Buildings
0
20
40
60
80
100
120
140
160
180
1 2 3* 4 5A 5B 6
Alternatives
Num
ber o
f Im
pact
ed
Prop
ertie
s

31
Right of Way Screening Results
Potential Relocations of Power Transmission Utilities
020406080
100120140160180200
1 2 3 4 5A 5B 6
Alternatives
Tow
ers
Affe
cted
• Electric facility relocation may require acquisition of replacement rights-of-way • The utility acquisition process may include condemnation, or purchases • The existing affected Edison right-of-way involves 233 acres, and replacement right-
of-way may involve more acreage depending on the relocation- Southern California Edison

32
Right of Way Screening Findings
• All alternatives are consistent with the project objective of minimizing right of way impacts, notably residential acquisitions
• Mobility and traffic safety benefits are trade-offs to residential impacts
• Alternatives 3, 5 and 6 have a substantially greater impact to regional transmission utilities
• Alternatives 1, 2 and 4 have the least impacts

33
Environmental Impact Measures

34
• Right of Way Impacts on Waters of the U.S.
• Right of Way Impacts on Section 4(f) Properties
– Examples of Section 4(f) properties are publicly owned parks, recreational areas, wildlife refuges, or public and private historical sites
• Environmental Justice Assessment
Overview of Environmental Impact Screening Measures

35
Environmental Impact Screening Results
Right of Way Impacts on Waters of the U.S.
0
500
1,000
1,500
2,000
2,500
3,000
3,500
4,000
1 2 3 4 5A 5B 6
Alternatives
Line
ar F
eet
36
Environmental Impact Screening Results
Right of Way Impacts on Section 4(f) Properties
• Cesar Chavez Park
– Full acquisition is not necessary (would be impacted by Alternatives 4, 5 and 6; possibly Alternative 3)
– Benefits of Proposed Project:
• Increase park size by 40%
• Improved public access to park
• No other 4(f) properties impacted

37
Environmental Impact Screening Results
Environmental Justice Assessment
• Analysis performed using demographic data
– Did not distinguish meaningfully between alternatives at the screening level of analysis
– Did not account for potential benefits as a result of project implementation at the screening level
38
• Alternative 6 has the highest impact to Waters of the U.S.
– May be the only practicable alternative as it meets the Purpose and Need of the project
• Only 1 Section 4(f) property affected by Alternatives 3, 4, 5A, 5B, and 6
– May experience benefits from project implementation
• Environmental Justice measure as defined did not distinguish differences among the alternatives
Environmental Impact Screening Findings

39
Capital Cost Measure
40
• Total Capital Cost
– Freeway Improvements
– Interchanges
– Arterials
– ITS
– Transit
– Alternative Technology
Overview of Capital Cost Screening Measure

41
Capital Cost Screening Results
2 3 4 5A 5B 6
$0
$2,000
$4,000
$6,000
$8,000
$10,000
$12,000
($ m
illio
ns)
Alternatives
Estimated Capital Costs Above No Build
Low CostHigh Cost

42
• Alternatives 3 and 6 have the highest cost
– Alternative 6 and Alternative 3 provide the greatest benefits
Capital Cost Screening Findings

43
• Alternative 6 (Updated Hybrid LPS) is only one to meet Mobility element of Purpose and Need
• Alternative 5A (10 General Purpose Lanes) is second best performer on Mobility element of Purpose and Need
• Alternative 6 is best performer on Traffic Safety
• Alternative 6 reduces NOx but slightly increases freeway daytime DPM compared to No Build
– Additional emission reductions could be achieved by combining Alt. 6 with Alt. 3 alternative (zero-emission) technologies
• Alternative 6 impacts (affected properties, waters of the US, cost) are highest compared to other alternatives– Directly related to mobility and safety improvement features
• Alternative 3 (Alternative Technology) is highest capital cost followed by Alternative 6
Screening Results Summary

44
Discussion
CAC Screening Recommendations