i-405 traffic data and corridor performance analysisleg.wa.gov/jtc/meetings/documents/agendas/2017...
TRANSCRIPT
1
I-405 Traffic Data and Corridor Performance Analysis
DRAFT Final Report
December 6, 2017
University of Minnesota
Department of Civil, Environmental, and Geo-Engineering
Humphrey School of Public Affairs

2
EXECUTIVE SUMMARY This report reflects findings from an independent and objective analysis of traffic data pertaining to
performance of Washington’s I-405 tolled corridor. Researchers were asked to describe where the I-405
express toll lane (ETL) facility is working and where it is underperforming by analyzing the accuracy, utility,
and limitations of available and applicable traffic data. Further, researchers were asked to compare
findings against relevant performance measures contained in state statute.
Statutory Performance Measures
Washington state statute RCW 47.56.880 lists several general performance measures for the I-405 ETL
facility. Of these, three measures are of primary interest to this study:
a) Whether the express toll lanes generate sufficient revenue to pay for all I-405 express toll lane-
related operating costs;
b) Whether the express toll lanes maintain speeds of 45 miles per hour (mph) at least 90 percent of
the time during peak periods; and
c) Whether the average traffic speed changed in the general purpose lanes.
If measures (a) and (b) above are not met within two years of ETL facility operation, statute directs the
ETL project on I-405 be terminated as soon as practicable.
The Washington State Department of Transportation (WSDOT) reports that the ETL facility is generating
sufficient revenue to pay for all I-405 express toll lane-related operating costs. As such, this study focuses
on the two remaining traffic performance measures listed above due to the availability of robust traffic
data capable of producing conclusive findings and due to the primary importance state statute attributes
to the 45 mph ETL speed goal. In addition, the study examines overall corridor throughput in both the ETL
and general purpose lanes (GPL) as another important performance measure.
This study finds that the I-405 ETL facility is meeting the financial performance measure, but is missing
the ETL speed performance measure:
a) Financial Performance Measure Met. The I-405 ETL facility is achieving the first primary
performance measure the Washington Legislature set for the facility – to be financially self-
sufficient.
b) ETL Speed Performance Measure Not Met. The I-405 ETL facility is not meeting the second
primary performance measure the Washington Legislature set for the facility – to have vehicles
on the ETL averaging 45 mph at least 90 percent of the time. This study finds that on average the
amount of time in peak period where ETL speed is above the 45 mph statutory goal is 85 percent
in the northbound direction and 78 percent in the southbound direction (Jan 2017 – Jun 2017).
c) GPL Speeds Showed No Significant Change. Average GPL speeds during the peak period were not
dramatically different before and after opening of the ETL facility. Improved speed was recorded
immediately following opening of the paved GPL shoulder, but that improvement returned to pre-
ETL levels as time passed.

3
Corridor Performance
Following are some of our major findings regarding the state of the I-405 corridor and its ETL facility:
a) ETL speed performance measure not met. On average, the percent time in peak period where
ETL speed is above 45 mph is falling short of the statutory goal of 90 percent – with the
performance measure being met 85 percent of the time in the northbound direction and 78
percent of the time in the southbound direction (Jan 2017 – Jun 2017).
b) Speed improved after transforming HOV lane to ETL. From January 2014 to August 2015, the
percent time in peak period where high occupancy vehicle (HOV) lane speed was above 45
mph is 69 percent in the northbound direction and 67 percent in the southbound direction –
both considerably less than ETL performance.
c) ETL facility increasing corridor throughput. Even though the ETL facility is not meeting the 45
mph speed requirement, its lanes are serving more vehicles than did the HOV lane: 42.9
percent more in the northbound direction and 63.5 percent more in the southbound
direction. In other words, the corridor is carrying significantly more vehicles after ETL facility
opening. This, in combination with better travel times, can be considered as overall
improvements of the corridor. Tables 1 and 2 show a significant increase in total corridor VMT
after opening of the ETL facility. The total lane-miles increase in the corridor was 4.5% in
northbound direction and 7.2% in the southbound direction. For comparison, statewide VMT
grew by an average of roughly 2.7 percent during the study period.
Table 1. Northbound average daily VMT traveled in corridor for the study period
On GPL On HOV/ETL Total
VMT Before ETL 929,963 143,786 1,073,749
VMT After ETL 993,682 205,536 1,199,218
Percent Increase 6.9% 42.9% 11.7%
Table 2. Southbound average daily VMT traveled in corridor for the study period
On GPL On HOV/ETL Total
VMT Before ETL 1,031,257 149,616 1,180,873
VMT After ETL 1,067,538 244,679 1,312,217
Percent Increase 3.5% 63.5% 11.1%
d) GPL Speeds Showed No Significant Change. Average GPL speeds during the peak period were
similar before and after the opening of the ETL facility. Improved speed was recorded
immediately following opening of the paved GPL shoulder, but that improvement returned to
pre-ETL levels as time passed.
e) ETL toll rates max out during 15 percent of peak period. The maximum toll, set in
administrative rule at $10, was charged on average 15 percent of the time in either direction
during the study period. Reaching the maximum toll rate is problematic from a traffic
management standpoint because once the maximum is reached the lane volume can no
longer be managed to ensure desired ETL speed.

4
f) Tolling algorithm is not optimally responsive and toll rate is too low as traffic volume builds.
The difference between the toll rate actually paid and the toll rate displayed at a trip's
conclusion can be as high as $4.00. That is, a motorist might enter the ETL and lock in a toll
rate that does not reflect the actual traffic volume building during their trip along the ETL
corridor. Particularly during peak travel times, the toll algorithm and pricing is not controlling
input traffic along the ETL effectively, which in turn can result in too many vehicles in the ETL,
unmanageable congestion and ETL break down, and thus unacceptably low average ETL
vehicle speeds.
Variables Likely Impacting I-405 Corridor Performance. Many factors are impacting the GPL speeds.
Among them are the opening of the 1.8-mile northbound shoulder lane, recent changes in striping,
signage and merge lanes, population growth in the area, and the change in carpool rules from 2+ HOV to
3+ HOV. However, the relative impact of multiple variables on corridor performance cannot be measured
without the use of more sophisticated traffic modeling – which this study could not accommodate due to
time and budget considerations.
While a number of variables are impacting the performance of the corridor, significant improvements in
speeds and throughput are occurring during the study period following ETL implementation.
In sum, the I-405 ETL facility is meeting the statutory performance measure related to financial
sustainability, but not the performance measure related to average ETL speeds. This is due in part to
overall traffic volume growth and a toll rate algorithm and pricing not adequately responsive to rapidly-
increasing traffic volume during peak periods.
Key findings regarding ETL speed performance are depicted in the infographic below (Figure 1). These
recommendations, as well as additional longer-term suggestions, are described in more detail in following
section.
Figure 1. ETL facility breakdown infographic

5
RECOMMENDATIONS In addition to providing independent and objective analysis of traffic data and I-405 corridor performance, we were asked to provide recommendations – both short-term and long-term – for improving the ETL facility in particular and I-405 corridor generally. Study of traffic data and research about other ETLs around the world has revealed a number of opportunities for improving the I-405 ETL facility and corridor performance. We are confident the following recommendations are both actionable and have a high likelihood of addressing challenges identified in our data analysis. Top Tier Short-Term Recommendations The following recommendations could be implemented in the relative short term and offer the greatest promise for addressing current congestion and improving corridor performance:
1) Improve ETL speed though a more responsive dynamic toll algorithm Our analysis reveals that the tolling algorithm is not optimally responsive. More specifically, the toll rate is too low as traffic volume builds in the ETL. In fact, the difference between the toll rate actually paid and the toll rate displayed at a trip's conclusion can be as high as $4.00. That is, a motorist might enter the ETL and lock in a toll rate that does not reflect the actual traffic volume building during their respective trip along the ETL corridor. Particularly during peak travel times, the toll algorithm and pricing is not adequately controlling input traffic along the ETL, which in turn can result in unmanageable ETL congestion and break down – and thus unacceptably low average ETL vehicle speeds. This is a short-term recommendation. It could be implemented without new infrastructure investment. However, it may require additional study focused on the specifics how WSDOT would make its toll algorithm more responsive to volume changes.
Impact achievable in short term
Additional study recommended
$ (relatively low cost compared with other recommendations)
2) Improve ETL speed through segmented corridor tolling WSDOT currently allows motorists to “lock in” one corridor-long toll rate upon entering the facility. This is a business rule which WSDOT enacted for simplicity and ease-of-use for motorists. However, locking in one corridor-long toll rate also has significant traffic management disadvantages. Traffic conditions and volumes can change considerably along the 17-mile tolled corridor – especially during peak periods. Applying tolls on a segment-by-segment basis, with segment-specific toll rates that are more reflective of real-time traffic conditions and volumes, will improve speeds in the ETL and corridor performance overall.
Under this approach, an electronic dynamic pricing sign would advise motorists entering the facility of segment-specific toll rates. The toll rates for each segment would be updated every few minutes based upon the volume in each segment. Segment pricing is used in many U.S. cities, and there are many different approaches for structuring and communicating segment prices. This recommendation also could be implemented in the short-term. Although it would involve certain infrastructure enhancements, such as additional dynamic pricing signs and access points through striping, these changes are relatively simple compared to other facility adjustments that have been made in the
6
past. However, this change in WSDOT’s business rule would require clear communication with motorists who currently expect to lock in a corridor-long toll rate.
Impact achievable in short term
Additional study recommended
$$ (relatively moderate cost compared with other recommendations) 3) Move toward an “open access” ETL facility to smooth lane transfer The ETL facility currently is striped to limit entrance from and exit to the GPL. Controlling the flow of traffic between lanes has advantages, especially in situations where prevailing lane speed can contrast considerably. However, in some cases, limiting the number of entrance and exit points can concentrate lane transfer and actually impede traffic flow and reduce speed overall. Therefore, we believe that implementing an open access strategy on some parts of the ETL facility could improve traffic flow and throughput. Any changes in access policy should be in concert with the corridor segment toll structure described above. Although this recommendation can be considered short-term in nature, further study of how best to apply an open access approach may reveal corridor segments where restricted ETL access remains beneficial.
Impact achievable in short term
Additional study recommended
$$ (relatively moderate cost compared with other recommendations)
4) Increase maximum toll rate to reduce ETL breakdown Analysis reveals that the maximum toll rate was applied on average 15 percent of the time in either direction during the study period. The maximum toll rate set in administrative rule is $10. This is an indication of ETL breakdown. For dynamically-priced toll facilities such as the I-405 ETL, the goal is to reach the maximum toll rate only rarely. Reaching the maximum toll rate is problematic from a traffic management standpoint, because once the maximum is reached the lane volume can no longer be managed through pricing to ensure ETL speed. This phenomenon is known as a facility breakdown. During breakdown, the benefits of the ETL facility are lost altogether while the resulting congestion can seriously disrupt travel for extended periods.
Although this recommendation could be implemented in the short-term, it should be considered complementary to the recommendations described above. We believe that the combination of a more responsive dynamic toll algorithm and application of toll rates by segment should significantly reduce congestion in the ETL, and thus reduce the frequency the $10 maximum toll rate is charged. However, to ensure ETL speed and facility performance during the most adverse traffic conditions, an increased maximum toll rate is recommended, even after the adjustments described above.
Impact achievable in short term
Additional study recommended
$ (relatively low cost compared with other recommendations)
Second Tier Short-Term Recommendations The following recommendations also could be implemented in the relative short term, and we believe
they would help address current congestion and improve corridor performance:
7
5) Adjust AM peak period times to increase ETL speed Extending the AM peak period for an additional hour in order to remove 2+ HOVs during this time would improve ETL performance by reducing the frequency and/or intensity of ETL breakdown. The AM peak period is currently defined as 5AM to 9AM, Monday through Friday. However, analysis reveals that traffic volumes along the corridor are consistent with peak period condition between 9AM and 10AM – and significantly greater between 9AM and 10AM than between 5AM and 6AM. Although ETL toll rates apply to motorists in these lanes throughout each weekday, 2+ HOV motorists are allowed into the ETL facility without paying a toll during non-peak hours. As such, the current AM peak period hours restrict free use of the ETL facility for 2+ HOV motorists at a time when the facility could support them (5-6AM), and they permit 2+ HOV motorists to use the facility for free at a time when the facility is congested, and therefore doesn’t have the capacity to support them (9-10AM).
We have two alternative recommendations to address this:
a) As a recommendation that could be implemented in the short-term, expanding the AM peak period to 5AM – 10AM would provide ETL congestion relief.
b) As an alternative, adjusting the AM peak period from 5AM – 9AM to 6AM – 10AM would produce ETL congestion relief during the latter portion of the AM commute; however, shifting the peak period rather than expanding it could invite more motorists into the ETL lane as volumes begin to mount and contribute to unintended congestion early in the AM peak period.
Either recommendation would help alleviate AM peak period congestion in the ETL.
Impact achievable in short term
Additional study recommended
$ (relatively low cost compared with other recommendations)
Long-term Recommendations The following recommendations would require a longer period of time to implement, but nonetheless offer promise for addressing congestion and improving corridor performance:
6) Extend second full ETL in each direction to improve ETL speed In high-growth and geographically confined traffic corridors such as the I-405 corridor, congestion pricing approaches such as the ETL facility offer the dual promise of predictable ETL drive time and increased throughput, as compared to GPL-only facilities. This is the case with the I-405 corridor. Based upon how similar facilities have performed around the country, we are confident that extending two full ETLs from 160 Street NE in Woodinville to I-5 in Lynnwood would remove current ETL bottleneck conditions and improve the flow of traffic along the ETL facility – likely producing improved ETL speeds and overall corridor traffic throughput. This recommendation would require more time to implement than the others described above. Optimal design of the additional ETLs would require in-depth traffic modeling and scenario analysis, and construction would take additional time. Nonetheless, researchers are confident that congestion pricing has and will continue to improve traffic performance along and the I-405 corridor.
Impact achievable in long term
Additional study recommended
$$$ (relatively high cost compared with other recommendations)

8
7) Add Capacity to Ensure Lane Continuity and Ease Bottlenecks Bottlenecks occur in areas where traffic volumes converge – be it through lane loss, on ramps, etc. The I-405 corridor includes a number of bottlenecks in both the GPL and ETL, and it may be beneficial to add lane capacity in areas with bottlenecks to improve corridor continuity. We recommend studying this issue to better inform a final decision on the question. This is a long-term recommendation, because it would require time to study where and how GPLs should be expanded, and additional time to construct GPL expansions.
Impact achievable in long term
Additional study recommended
$$$ (relatively high cost compared with other recommendations)
8) Increase transit options to improve throughput and speed Growth in VMT along the I-405 corridor is well outpacing statewide and national averages. Therefore, regardless of the ETL changes we describe in this section, the corridor will continue to experience significant pressure from recent and projected population and motorist growth. Over time, the short-term benefits of added lane capacity will be reduced by growth in VMT. As a result, maintaining and improving long-term corridor performance requires a balanced approach of roadway infrastructure improvements and transit options. Research conducted by others has found that well-designed transit options can help move more people through a corridor in fewer vehicles. In this way, transit can help improve corridor throughput efficiency in both the ETL and the GPLs. Over the long term, implementation of I-405 master plan transit improvements will reduce congestion and increase passenger throughput in the high-growth corridor. These improvements include new transit centers and park and ride spaces, a bus rapid transit (BRT) system, vanpools, direct access ramps for transit and carpools, and an overall increase in transit service.
Impact achievable in long term
Additional study recommended
$$ (relatively moderate cost compared with other recommendations)
Conclusion
The I-405 ETL facility is meeting the statutory performance measure related to financial sustainability, but
not the performance measure related to average ETL speeds. This is due in part to overall traffic volume
growth and a toll rate algorithm and pricing not adequately responsive to rapidly-increasing traffic volume
during peak periods. Our findings suggest that a number of adjustments could be made that should lead
to both of the primary statutory performance measures being met.
As time passes and conditions change, even the most sophisticated ETL facilities require regular
adjustments. This is particularly true of those operating in traffic corridors like the I-405 corridor that serve
rapidly growing regions. Therefore, these recommendations should be considered part of the natural
evolution of the corridor, not criticisms of work that has been done in the past. We are confident that
implementation of these recommendations will improve I-405 ETL performance and significantly increase
throughput and efficiency along the corridor.

9
Table of Contents
EXECUTIVE SUMMARY ................................................................................................................................... 1
1. INTRODUCTION ....................................................................................................................................... 11
1.1 Background per Washington Joint Transportation Committee ........................................................ 11
1.2 Timeline of the I-405 Express Toll Lanes ........................................................................................... 12
2. DATA DESCRIPTION ................................................................................................................................. 14
2.1 Loop Detector Data ........................................................................................................................... 14
2.2 ETL Transaction Data ......................................................................................................................... 16
2.3 HERE Data ......................................................................................................................................... 16
2.4 Data Summary and Comparison ....................................................................................................... 17
3. DATA ANALYSIS METHODOLOGY ............................................................................................................ 18
3.1 Travel Time Analysis .......................................................................................................................... 18
3.2 Volume Analysis ................................................................................................................................ 18
3.3 Speed Analysis................................................................................................................................... 19
4. RESULTS ................................................................................................................................................... 20
4.1 Travel Time Analysis .......................................................................................................................... 20
4.2 Volume Analysis ................................................................................................................................ 26
4.3 Speed Analysis................................................................................................................................... 32
4.4 Tolling Analysis .................................................................................................................................. 38
5. DISCUSSION ............................................................................................................................................. 40
6. RECOMMENDATIONS .............................................................................................................................. 42
7. CONCLUSION ........................................................................................................................................... 46

10
Table of Figures Figure 1. ETL facility breakdown infographic ................................................................................................ 4
Figure 2. I-405 corridor map ....................................................................................................................... 11
Figure 3. Timeline of the I-405 ETL facility .................................................................................................. 13
Figure 4. Double loop detectors in theory .................................................................................................. 15
Figure 5. Double loop detectors in practice ................................................................................................ 15
Figure 6. Monthly travel times, entire corridor (loop detector data) Jan 2014 to June 2017. ................... 21
Figure 7. Northbound monthly travel times, specific corridor segments (loop detector data) ................. 22
Figure 8. Southbound monthly travel times, specific corridor segments (loop detector data) ................. 23
Figure 9. Peak travel time profiles in the ETL for April 2016 and April 2017. ............................................. 25
Figure 10. Average daily VMT for the 42-month study period ................................................................... 26
Figure 11. Share of VMT in GPL and HOV/ETL in the corridor .................................................................... 28
Figure 12. Northbound lane-by-lane average daily vehicle-miles .............................................................. 29
Figure 13. Southbound lane-by-lane average daily vehicle-miles .............................................................. 30
Figure 14. Northbound ETL volume by entry and exit points from transaction data ................................. 31
Figure 15. Southbound ETL volume by entry and exit points from transaction data ................................. 32
Figure 16. Speed profiles in the northbound ETL and GPL in the peak period ........................................... 33
Figure 17. Speed profiles in the southbound ETL and GPL in the peak period ........................................... 34
Figure 18. Percent time in peak hour with northbound ETL speed above 45 mph………………………………….35
Figure 19. Percent time in peak hour with southbound ETL speed above 45 mph………………………………….36
Figure 20. Peak speed profiles in the ETL for April 2016 and April 2017 .................................................... 37
Figure 21. Percent time the maximum toll is reached in the peak period ................................................. 38
Figure 22. Northbound peak hours average toll paid in April 2017 ........................................................... 39
Figure 23. Northbound peak hours average toll difference in April 2017 .................................................. 39
Table of Tables Table 1. Northbound average daily VMT traveled in corridor for the study period ..................................... 3
Table 2. Southbound average daily VMT traveled in corridor for the study period ..................................... 3
Table 3. Data summary and comparison .................................................................................................... 17
Table 4. Northbound average daily VMT traveled in corridor for the study period ................................... 27
Table 5. Southbound average daily VMT traveled in corridor for the study period ................................... 27

11
1. INTRODUCTION
1.1 Background per Washington Joint Transportation Committee Unpredictable commute times during peak hours on I-405 and increasing congestion that impeded bus
transit led lawmakers in 2011 to authorize WSDOT to build a system of express toll lanes. This initial phase
of ETLs spanned a 17-mile stretch between Bellevue in the south and Lynnwood in the north (Figure 2).
The project included one new paved ETL in each direction from Bellevue to Bothell, and converting the
old HOV lanes from Bellevue to Lynnwood. This resulted in two ETLs each direction Bellevue-Bothell, and
one each way Bothell-Lynnwood.
Figure 2. I-405 corridor map

12
The goal was to provide drivers a choice for a faster, more reliable trip on I-405. As stated in statutory
performance measures, another goal is for the ETLs to maintain speeds of 45 mph at least 90% of the time;
this goal is one of two performance measures that the facility must meet or else state law requires
termination of the ETLs after a two-year pilot project that ended on September 27, 2017.
The Washington State Transportation Commission sets toll rates in Washington, and after analyzing
extensive traffic, performance and population growth data, they set a minimum of 75 cents and a
maximum of $10 for the I-405 facility. Tolling in the ETLs is dynamic; electronic signs post the toll rate
based on destination and automatically adjust depending on real-time traffic conditions. As more vehicles
enter or exit the lanes at designated access points, toll rates adjust to try to keep traffic moving at least
45 miles per hour in the ETL. Toll rates are based on speeds and traffic volumes in the ETLs, and take into
account volumes in the general-purpose lanes.
The ETLs opened to traffic on September 27, 2015. Upon opening, 3+ HOVs with a Flex Pass transponder
drove for free in the ETLs at all times. In a policy change, 2+ HOVs now had to pay to drive in the ETLs
during peak hours (5AM-9AM, 3PM-7PM), Monday through Friday. Solo drivers paid to drive in the ETLs
at all times. The Commission changed that policy in March, 2016, to allow all vehicles to drive toll-free
during weekday evenings (7 PM-5AM). In addition, the lanes became toll-free for everyone on weekends
and six major federal holidays.
The $10 maximum toll was predicted to be rare, but by December of 2015, drivers paid $10 more
frequently than expected. WSDOT’s data showed that while traffic improved in the southern part of the
corridor, it slowed in general-purpose lanes in the Bothell area and at points north of SR 522 – the area
where only one ETL was added. WSDOT reported that the additional northbound capacity in the southern
portion of the project moved some of the worst congestion north, from Kirkland to Bothell. Toll payers
and buses were saving up to 14 minutes in the morning. Southbound general-purpose traffic saved time
in the morning, but evening northbound traffic was delayed through Bothell.
Delays actually worsened on weekends and afternoon commutes going north through Bothell.
The Legislature also funded a study of shoulder hardening along the corridor in the northbound direction
between SR 527 and I-5, and adding a northbound auxiliary lane in Kirkland between SR 520 and NE 70th
Place. In August 2016, the shoulder-hardening project began, using toll dollars to convert 1.8 miles of
shoulder north of the SR 527 on-ramp to hard shoulder, available to traffic during peak travel times. It
opened to traffic in April 2017.
1.2 Timeline of the I-405 Express Toll Lanes Figure 3 shows the timeline for implementation of the ETL on the I-405 corridor. Major events are shown
at the top part of the timeline. The red colors in the timeline represent ongoing construction, blue colors
represent before and green represents after the ETL facility opened. The width of the green parts of the
timeline represents the tolling window.
In particular, the timeline notes that construction of the ETL facility began in fall 2012 and continued
through September 2015. The ETL facility opened to traffic on September 27, 2015, and within months
was improved through extension of access points near SR 527; during this time the tolling algorithm was

13
adjusted to help keep ETL traffic moving. On March 18, 2016, the tolling policy was adjusted and thereafter
tolls were no longer applied on weekends. In August 2016 the northbound GPL was improved through a
1.8 mile stretch of shoulder hardening, which was opened to traffic in April 2017.
Figure 3. Timeline of the I-405 ETL facility

14
2. DATA DESCRIPTION This section describes the data that the study team has received from WSDOT for evaluating the
performance of the I-405 ETL facility. Analyses are conducted on three datasets, namely the loop detector
data, the ETL transaction data, and HERE data. A brief description of each dataset along with its contents
and limitations is provided below. For purposes of this study, researchers obtained raw data from WSDOT
for independent observation and analysis.
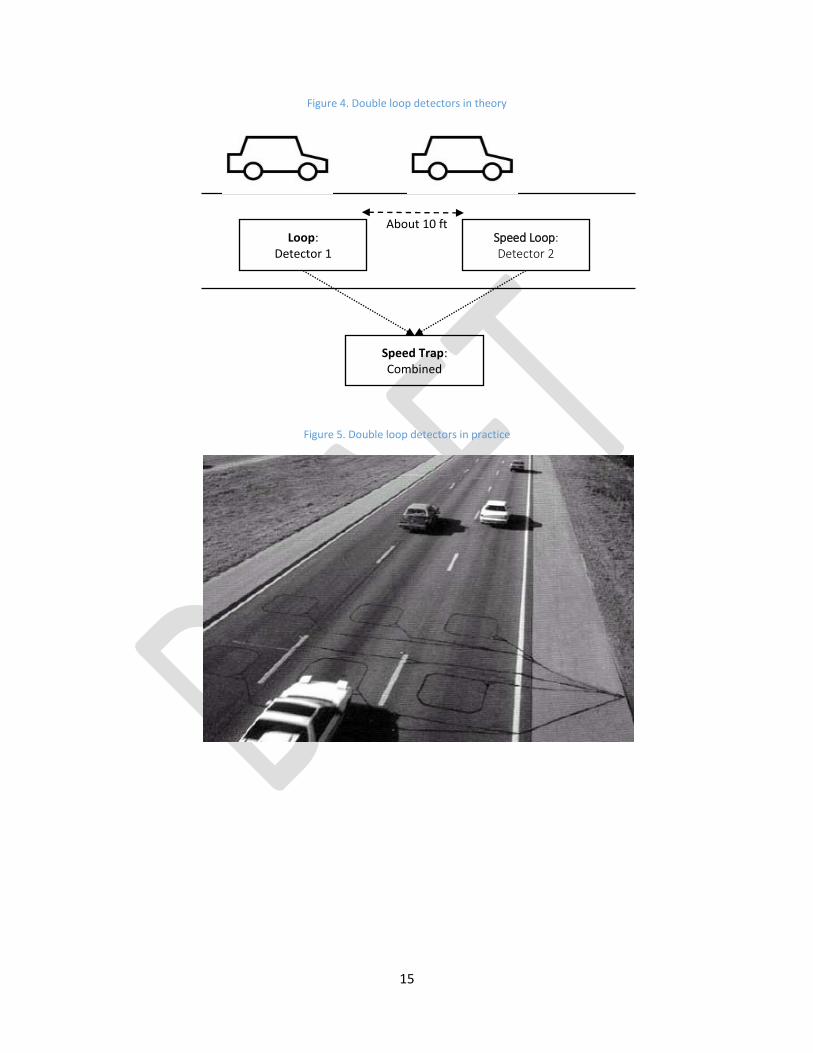
2.1 Loop Detector Data WSDOT has embedded pairs of loop detectors in the pavement of all lanes of the I-405 corridor. Figures
4 and 5 show the conceptual and actual deployment of loop detectors, respectively. The loop detectors
collect information about traffic volume and speed that is aggregated and analyzed by WSDOT.
This study relied upon simple raw data, in the basic form it was originally collected by WSDOT, for the
period spanning January 2014 to June 2017. The data was collected by inductive loop detectors embedded
in the pavement by WSDOT. Detectors collect the passage of vehicles by sending a signal to a controller.
Then, digital information from signals are recorded in a computer database. Detectors are installed every
0.5 miles and in every lane of the corridor, collecting data in a lane-by-lane format. Thus, analysis of loop
detector data can illustrate the traffic conditions on both ETL and GPL. The data covers both before and
after the opening of the ETL facility. Thus, the analysis compares corridor performance before and after
opening of the ETL.
WSDOT employs double loop detector systems, meaning that two detectors about ten feet apart collect
data as shown in Figures 4 and 5. Therefore, three types of loop detector data are available in the data
set: “Loop” and “Speed Loop” (collected by the first and second detectors respectively) can provide traffic
volume, density, and estimated speed. “Speed Trap” is the combination of the data from the two loops.
This provides more reliable and consistent speed estimates than the other two types. Thus, speed and
travel time analysis is conducted based on the data collected by Speed Trap. Volume analysis is conducted
using the data from the first loop.
The loop detector data are aggregated in 20-second time intervals, and can be further aggregated to five-
minute intervals for faster analysis without compromising the data quality.
15
Figure 4. Double loop detectors in theory
Figure 5. Double loop detectors in practice
Speed Loop: Detector 2
Loop: Detector 1
Speed Trap: Combined
About 10 ft

16
2.2 ETL Transaction Data Data from toll transactions on the ETL from January 2016 to June 2017 were utilized for this study. There
are 10 northbound and 11 southbound gantries to detect the entry and exit of vehicles on the ETL. Any
vehicle passing through the gantries is detected and related information such as time, location, and toll
amount is recorded. Particularly, each record of data contains a unique trip identification (ID), the trip
start and end location, date and time, toll amount, intermediate locations and detected time, trip type
(e.g. HOV, toll paid via transponder, or toll paid via mail), and some additional information.
The transaction data contain the starting and ending locations of a trip as well as intermediate points.
Combining the transaction locations and transaction times, travel times and speed can be calculated for
the trips and for each segment. Volume analysis can be performed on a segment-based level and on an
entry-exit based level in the ETL but not in the GPL because there are no tolling gantries in the GPLs (and
there were no tolling gantries in the HOV lanes before ETL). The toll charged for each trip using the ETL
facility is also available.
In sum, an analysis of speed, travel time, volume, and toll rates can be conducted with ETL transaction
data, but the outcomes are limited to the ETL. A complete picture of the corridor requires information
from GPLs and HOV lanes before ETL was implemented, which is obtained from loop detector data.
2.3 HERE Data WSDOT also provided a HERE dataset that includes several months of data (usually the fourth quarter)
from 2013 to 2017. HERE collects the data from vehicle probes, such as GPS devices and cell phones when
drivers use the company’s HERE WE GO app. National highways are divided into Traffic Message Channel
(TMC) codes with approximate lengths of 0.5-0.8 miles and the measured travel times are coded to the
TMC locations. HERE data contains travel times for three categories of vehicles (all vehicles, passenger
vehicles, and trucks) at five-minute intervals. However, the data cannot differentiate the vehicles traveling
on the ETL and GPL. As a result, the travel times provided by HERE data are the average estimates from
vehicles in all the lanes, not distinguishing between ETL and GPL travel times – even though actual travel
times may vary significantly between the ETL and the GPLs. In addition, the values are calculated from
relatively small samples and therefore provide no volume information. Due to these shortcomings, the
travel time can be biased and misleading; this is the major shortcoming of the HERE data, and the reason
it was not used in this study.
A similar data source is INRIX, which also collects traffic data using GPS-equipped vehicles. The data
provided by INRIX also comes with the TMC locations. INRIX data is known to have similar shortcomings
relative to those described above for HERE data.

17
2.4 Data Summary and Comparison Table 3 summarizes the content, sample characteristics, advantages, and shortcomings of the three data
sets available and considered for this study.
Table 3. Data summary and comparison
Data set Loop Detector Data ETL Transaction Data HERE Data
Available dates Jan 2014-Jun 2017 Oct 2015-Jun 2017 Partial months from 2013 to 2017
Contents Speed and volume, date, time, milepost and lane information
Transaction date, time, locations, toll amount, etc.
Estimated segment travel times
Sample rate 20 seconds, every 0.5 miles
Real time at 21 gantries 5 minutes, 0.5-0.8 miles
Advantages
Provides both volume and speed info; High resolution data; Provides lane usage info; Provides good coverage along the corridor
Tracks trips on ETL, so complete trip info; Provides accurate travel time info; Provides accurate volume info
Estimated travel times for different types of vehicles
Disadvantages Reported speeds are local, need processing for travel time
Lacks info on GPL and HOV lanes before ETL
No volume information; No distinction between ETL and GPL; No lane usage info; Small sample size; Potentially biased travel times
# of records* 13 million / month 4 million / month 300,000 / month
* # of records does not necessarily mean the number of sampled vehicles.

18
3. DATA ANALYSIS METHODOLOGY
3.1 Travel Time Analysis Travel time analysis by loop detector data: The speeds are measured at loop detector locations
approximately 0.5 miles apart. The GPL and ETL have separate detectors on the entire corridor. Travel
times are calculated by dividing the distance between two consecutive detectors by the average speed of
the two detectors. Adding up these travel times along the corridor makes up the travel time on the
corridor. Similarly, travel times for the most common trips are calculated using the segment travel times.
Travel times are calculated for every five-minute interval of peak period (according to WSDOT definitions,
5AM-9AM in the southbound direction and 3PM-7PM in the northbound direction) on Tuesday,
Wednesday, and Thursday of every week for each month of the study period. The reason to select these
three days among five weekdays is that traffic peak in other days may be shifted due to potentially
irregular work schedules of commuters on Mondays and Fridays. Travel times are calculated for non-peak
hours (hours outside the peak period) as well. Finally, these travel times are aggregated to three measures
of average, 90th percentile, and 10th percentile of travel time in each month. The percentile travel times
represent day-to-day variability of travel time. The wider the gap between the 90th and 10th percentiles
the more variable and less reliable the travel time.
Travel time analysis by ETL transaction data: A single trip on the ETL contains several segments, each with
a start and end point (gantry) together with the corresponding transaction times. Travel time of each
segment is the difference between the timestamps at the start and end point. The travel times are
calculated for one-minute intervals for peak and off-peak hours of the three weekdays for every month
with available data. The 90th percentile and 10th percentile travel times are calculated as well, representing
travel time variability.
3.2 Volume Analysis Volume by loop detector data: Loop detectors collect lane-by-lane volume data by counting vehicles on a
continuous basis and recording counts in 20-second intervals. Information on how volume is distributed
along the corridor in both the ETL and GPL can be obtained from the detector data. By observing monthly
volume changes, the effect of major events in the corridor can be investigated, for example the opening
of the ETL or opening of shoulder lane.
Volume data can be aggregated over many different time periods. Monthly volume aggregation is
commonly used to illustrate changes and trends over several years. Monthly and or weekly aggregations
are also used to reveal changes around major policy or capacity affecting events. For example, monthly
aggregation of volume is used to investigate the effect on the system by the opening of the ETL and later
of the shoulder lane.
For this purpose, the vehicle-mile travelled (VMT) metric is developed. VMT is the volume from detectors
multiplied by the distance between consecutive detectors, summed over all the detectors in the corridor.
This is a very common metric with vehicle-mile unit, representing how many vehicles used the corridor
along with the length of their trips in the corridor. The monthly VMT trend is presented herein.

19
Volume by ETL transaction data: Volume information on the ETL can be obtained from the ETL transaction
data. Trip records in the data set are distinguished as one of the following: 3+ HOV vehicles traveling for
free; vehicles paying tolls with a transponder; or vehicles without transponders paying tolls by mail.
Counting the trips by their start/end points and transaction times indicates where vehicles enter and exit
the facility and how trips are distributed along the corridor.
3.3 Speed Analysis Speed analysis by loop detector data: Loop detectors collect speeds along the corridor on both GPLs and
ETLs every 0.5 miles. These data show the speed when vehicles pass over the two paired detectors, thus
representing the local speed at certain points along the corridor. By arranging these location speeds in
the milepost order, speed profiles along the corridor can be created for both types of lanes. The speed
profiles are created every 5 minutes for the peak and off-peak hours on the weekdays. The average and
percentiles of speed are calculated for the months with available data. The wider the gap between the
90th and 10th percentile speed, the more variable the corridor speed on different days. Moreover, by
comparing the average speed with the required minimum of 45 mph, the percentage of the time in peak
hours that speed is below the threshold is calculated for every month in the ETL and GPL.
Speed analysis by transaction data: A single trip on the ETL is broken down into several components, each
with a start and end point together with the corresponding transaction times. Based on the distance
between the starting and ending points and the measured travel time, average segment speed can be
calculated. Aggregating the data monthly, the speed variations are calculated.

20
4. RESULTS
4.1 Travel Time Analysis Travel time analysis by loop detector data: As explained in the methodology, travel times are calculated
from the loop detector data for the entire corridor in both directions, and separately for the ETL and GPL.
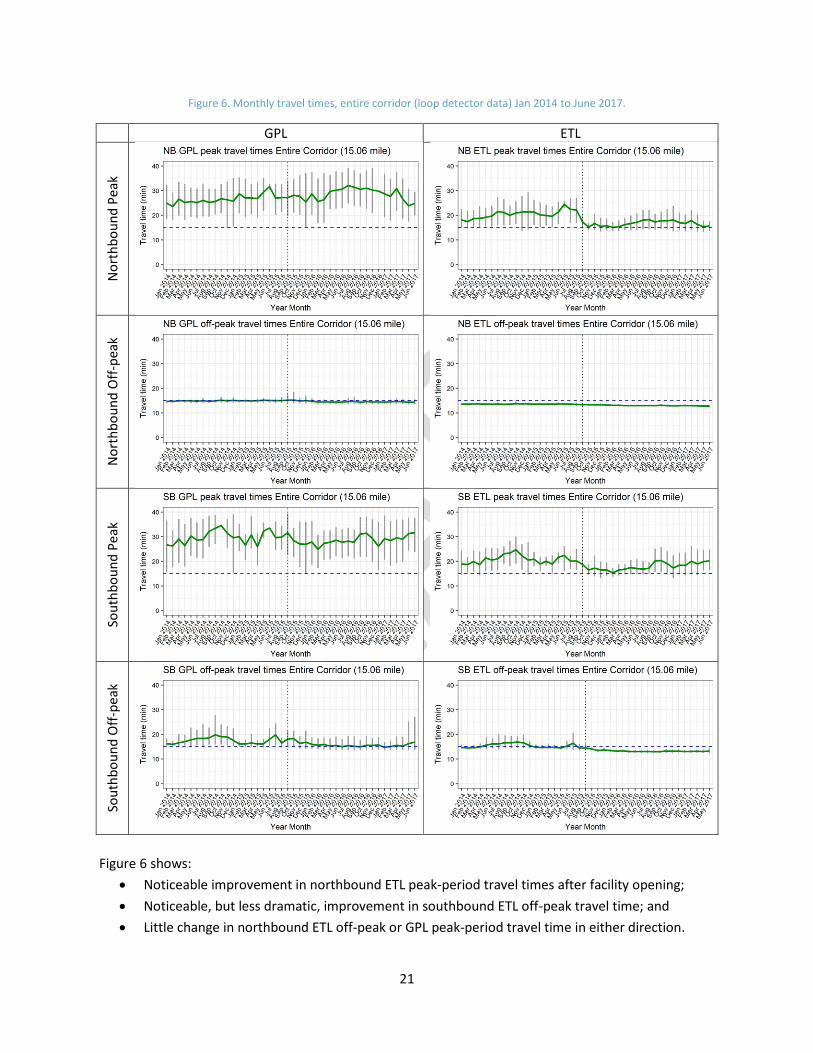
Results for the start-to-end of the corridor (NE 8th Street to I-5) are presented in Figure 6, which displays
total corridor monthly travel times as recorded by loop detector data. The green lines show average travel
time and the vertical bars show the range between the 10th percentile and the 90th percentile. The
vertical dashed line shows the ETL opening month. The horizontal dashed line shows free flow travel time.
A smaller vertical bar indicates greater trip reliability.
21
Figure 6. Monthly travel times, entire corridor (loop detector data) Jan 2014 to June 2017.
GPL ETL
No
rth
bo
un
d P
eak
No
rth
bo
un
d O
ff-p
eak
Sou
thb
ou
nd
Pea
k
Sou
thb
ou
nd
Off
-pea
k
Figure 6 shows:
Noticeable improvement in northbound ETL peak-period travel times after facility opening;
Noticeable, but less dramatic, improvement in southbound ETL off-peak travel time; and
Little change in northbound ETL off-peak or GPL peak-period travel time in either direction.

22
Figure 7 shows northbound monthly peak-period travel time averages for select common trips in the
corridor. The green lines show average travel time; vertical bars show the range between the 10th and
the 90th percentiles. The vertical dashed line shows the ETL opening month and the horizontal dashed
line shows the free flow travel times. Observations of common northbound trips include the following:
Noticeable improvement in ETL peak-period travel times in all depicted common-trip segments
following facility opening; and
No sustained change in GPL travel times.
Figure 7. Northbound monthly travel times, specific corridor segments (loop detector data) Jan 2014 to June 2017.
NB GPL ETL
NE
8th
– N
E 8
5th
(4
.07
mi)
NE
85
th –
NE
16
0th
(4
.74
mi)
SR 5
20
– S
R 5
22
(8
.13
mi)
Travel times improved after ETL opening.

23
Figure 8 shows southbound monthly peak-period travel time averages for select common trips in the
corridor. The green lines show average travel time; vertical bars show the range between the 10th and
the 90th percentiles. The vertical dashed line shows the ETL opening month and the horizontal dashed
line shows the free flow travel times. Observations of common southbound trips include the following:
Travel times on all segments of the ETL are lower and less variant compared with travel time on
the HOV lanes before opening the ETL (low travel time variation indicates higher reliability); and
Travel times on the northbound direction of GPLs do not show noticeable changes after opening
of ETL. However, more travel time variation (wider range in travel time) can be observed in the
segments between NE 85th St to NE 160th St as well as between SR 520 to ST 522 (high travel
time variability indicates lower reliability).
Figure 8. Southbound monthly travel times, specific corridor segments (loop detector data) Jan 2014 to June 2017.
SB GPL ETL
. NE
85
th –
NE
8th
(4
.07
mi)
NE
16
0th
– N
E 8
5th
(4
.74
mi)
SR 5
22
– S
R 5
20
(8
.56
mi)
Travel time before ETL is below free flow travel time. This indicates potential data quality issue.
Travel time before ETL is below free flow travel time. This indicates potential data quality issue.

24
Travel time analysis by ETL transaction data: Travel times are also calculated for the ETL traffic using ETL
transaction data (as explained in the methodology) and are used for validating the travel times calculated
from detector data. In this case, travel times are calculated for the trips according to the nearest gantries,
and for every month from January 2016 to June 2017. Comparison of average monthly travel times from
transaction data and from detector data confirms that the measures calculated from detector data are
reliable and the conclusions are robust. In other words, this comparison adds another level of confidence
to detector data as a reliable data source.

25
Figure 9 shows minute-by-minute travel time profiles in the peak period for the sample month of April
2017. The green lines display average travel time and the vertical bars show the range between the 10th
percentile and the 90th percentile travel time.
Travel time profiles in Figure 9 indicate that:
Peak travel time in the southbound direction is more variant than in northbound direction,
meaning that travel time in the southbound direction is less reliable; and
Peak travel time in the southbound direction starts later than the defined peak period. Indeed,
while the defined peak period is from 5AM to 9AM, the actual peak travel time starts after 6AM
and extends beyond 9AM.
Figure 9. Peak travel time profiles in the ETL for April 2017.
Northbound Southbound

26
4.2 Volume Analysis Volume by loop detector data: The volume data collected by loop detectors are analyzed in this section.
The presented measure is the daily vehicle miles traveled (VMT) in the corridor, which reflects changes
both in the number of trips and in the length of the trips in the corridor (shown in Figure 10).
Figure 10. Average daily VMT for the 42-month study period separated by direction, ETL sections, and lane types
Southbound Northbound
Sin
gle
ETL
Sect
ion
Do
ub
le E
TL S
ecti
on
Figure 10 shows:
In the single ETL section of southbound direction, VMT increased on both GPL and ETL;
In the double ETL section of southbound direction, VMT increased on both GPL and ETL, where
the increase is much higher on the ETL;
In the single ETL section of northbound direction, VMT increased in both GPL and ETL; and
In the double ETL section of northbound direction, VMT increased in both GPL and ETL, where the
increase is significant on both types of lanes.

27
Tables 4 and 5 compare average daily VMT on the GPL and HOV/ETL for the 42-month study period, before
and after opening of ETL. The average daily VMT increased in all lanes, leading to an overall northbound
increase of 11.7 percent and an overall southbound increase of 11.1 percent.
Table 4. Northbound average daily VMT traveled in corridor for the study period
On GPL On HOV/ETL Total
VMT Before ETL 929,963 143,786 1,073,749
VMT After ETL 993,682 205,536 1,199,218
Percent Increase 6.9% 42.9% 11.7%
Table 5. Southbound average daily VMT traveled in corridor for the study period
On GPL On HOV/ETL Total
VMT Before ETL 1,031,257 149,616 1,180,873
VMT After ETL 1,067,538 244,679 1,312,217
Percent Increase 3.5% 63.5% 11.1%
Growth in VMT indicates that the corridor carries significantly more vehicles after opening the ETL. This,
in combination with better travel times, can be considered as overall improvements of the corridor.
For comparison, the average Washington State VMT increased in 2014 by 1.7 percent; in 2015 by 3.6
percent; and in 2016 by 2.7 percent.
As noted before, VMT must be taken into consideration when travel time or speed analysis is conducted.
In a corridor with VMT well-above the Washington state average, traffic volume has increased and average
travel times have decreased after opening the ETL.
28
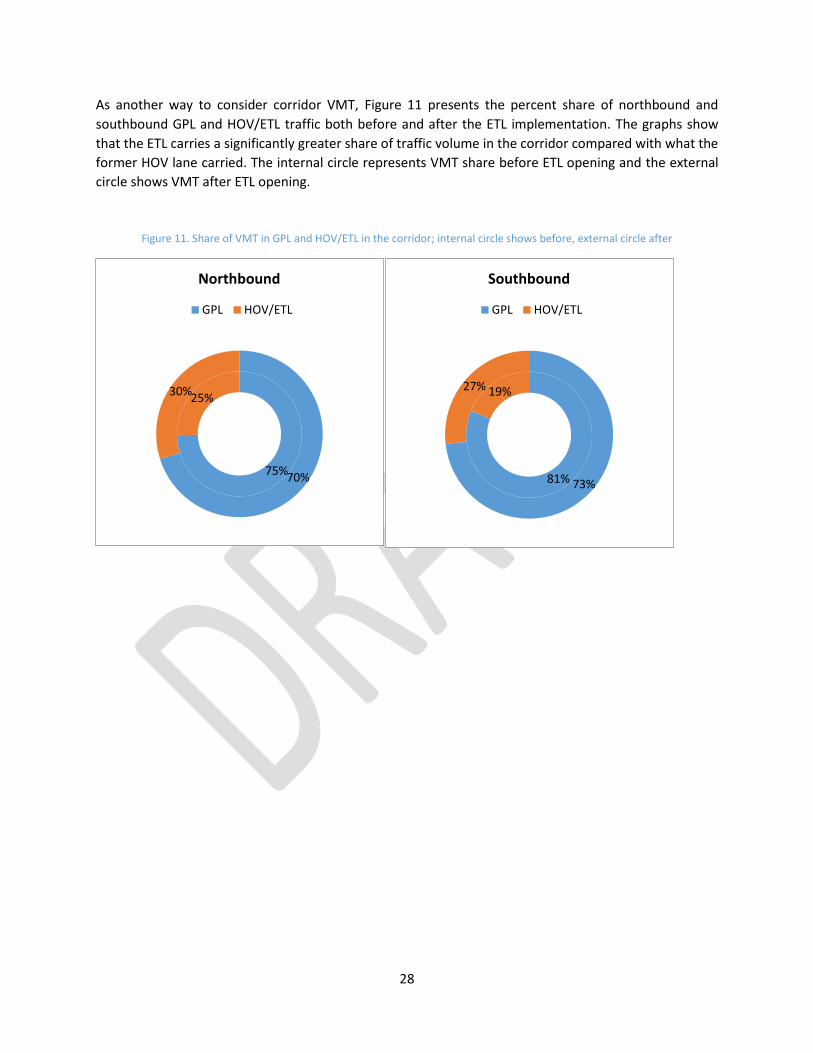
As another way to consider corridor VMT, Figure 11 presents the percent share of northbound and
southbound GPL and HOV/ETL traffic both before and after the ETL implementation. The graphs show
that the ETL carries a significantly greater share of traffic volume in the corridor compared with what the
former HOV lane carried. The internal circle represents VMT share before ETL opening and the external
circle shows VMT after ETL opening.
Figure 11. Share of VMT in GPL and HOV/ETL in the corridor; internal circle shows before, external circle after
75%
25%
70%
30%
Northbound
GPL HOV/ETL
81%
19%
73%
27%
Southbound
GPL HOV/ETL

29
VMT in a lane-by-lane basis is presented in Figures 12 and 13. In the graphs, dark red color represents
higher volume and the spectrum key is shown on the right side. Each bar shows one lane with labels – GPL
1; GPL2; GPL3; ETL1; and ETL2 – along the horizontal axis. The vertical axis depicts months increasing
upward. The dashed line is when the ETL opened.
Figure 12. Northbound lane-by-lane average daily vehicle-miles for the study period, separated by dual and single sections
In the double ETL section
of northbound, VMT
increased on the second
and third GP lanes. VMT on
ETL1 is almost comparable
to the previous HOV lane
while ETL2 carries
additional traffic, so
overall higher traffic on
ETL compared to the HOV
lane.
In the single ETL section of
northbound, VMT
changes on GPL are not
significant. However, the
ETL has considerably high
VMT. This indicates that
the higher VMT in the
Single section is primarily
served by the ETL.

30
Figure 13. Southbound lane-by-lane average daily vehicle-miles for the study period, separated by dual and single sections
In the double
ETL section of
southbound
direction, VMT
increased on the
second and third
GP lanes. VMT
on ETL1 is
almost
comparable to
the previous
HOV lane while
ETL2 carries
additional
traffic, so overall
higher traffic on
ETL compared to
the HOV lane.
VMT changes in
the single ETL
southbound
section are not
significant to be
captured
visually. Figure
10 shows this
information
more
accurately.

31
Volume by ETL transaction data: Although loop detector data provide comprehensive volume information,
ETL volume from transaction data can be used as an additional input to the study. To make the information
more useful, the ETL volume by entrance and exit points are presented in Figures 14 and 15. Each cell
represents a trip by start and end points. Blue colors show higher volume while green colors show lower
volume.
Note that since ETL transactions are collected at the gantries only, the gantries are selected as the
entrance and exit points rather than actual trip origin or destinations. Figure 14 shows that:
The highest volume in the northbound direction is destined to Rose Hill, primarily starting from
NE 85th Street and NE 8th Street; and
Other significant volume is observed toward I-5 from NE 85th and NE 8th Street, as well as SR 527
gantry.
Figure 14. Northbound ETL volume by entry and exit points from transaction data

32
Figure 15 shows that:
In the southbound direction, the highest volume is observed at NE 8th Street primarily starting
from SR-522 and I-5; and
Other significant volume is destined to NE 85th Street coming from SR 522 and I-5.
Figure 15. Southbound ETL volume by entry and exit points from transaction data
4.3 Speed Analysis Speed analysis by loop detector data: Loop detectors collect lane-by-lane speeds every 0.5 miles along the
corridor. Speed profiles with respect to time are created for both lane types and both directions and for
the 42-month duration of study. For illustration, data for the month of April in the four consecutive years
are presented in Figures 16 and 17. The green line shows the average speed and the vertical bars show
the range between the 10th percentile and the 90th percentile speeds. The red line shows the 45 mph
threshold.

33
The following observations can be made, although conclusions would require a more comprehensive
investigation of the results, including the consideration of volume growth in the corridor:
In the northbound direction, the HOV lane speed was close to the 45 mph in 2014 and 2015
and improved in 2016 and 2017, which is likely due to the opening of the ETL;
In the northbound direction, the GPL speed was below 45 mph and gradually decreased from
2014 to 2016 and increased in 2017, likely due to the shoulder lane opening; and
Figure 16. Speed profiles in the northbound ETL and GPL in the peak period for the month of April 2014-2017
GPL HOV/ETL
Ap
r 2
01
4
Ap
r 2
01
5
Ap
r 2
01
6
Ap
r 2
017
In the southbound direction, GPL speed was below 45 mph for a period of time within peak
period in April 2014, April 2015, April 2016 and April 2017. The graphs do not show noticeable

34
change in average speed from 2014-2017. However, high speed variations (low reliability) is
observed in April 2016 and low speed variations (high reliability) is observed in April 2017. In
general, and most noticeably in 2016, the observed speed drop is in the later hours of the
peak period (5AM-9AM) and extends beyond it. This suggests a need to revisit the peak period
definition. As was the case with the northbound HOV, southbound HOV speed was close to
45 mph in 2014 and 2015 and improved after the ETL opening.
Figure 17. Speed profiles in the southbound ETL and GPL in the peak period for the month of April 2014-2017
GPL ETL
Ap
r 2
01
4
Ap
r 2
01
5
Ap
r 2
01
6
Ap
r 2
017
While the graphs in Figures 16 and 17 show the average vehicle speeds in the entire corridor, and although
they look above 45 mph, some locations have average speeds below 45 mph. This fact is carefully taken
into account when calculating the percentages in Figures 18 and 19 – which show the percentage of time

35
in the peak period where ETL speed is above 45 mph. For example, if one out of 10 detectors showed
speed below 45mph on eight out of 20 days, the percentage would be calculated as 1 - 1x8/(10x20) = 96%.
The graphs indicate that, in general, the percentage is below the 90 percent threshold. However, the
percentage was noticeably lower before the opening of the ETL and improved after that. In some months
after opening of the ETL, the 90 percent threshold was achieved, but over time the percentage has
declined gradually; that can be attributed to the volume growth in the corridor as explained in Section 4.2
(more than 11 percent overall VMT growth after opening of ETL). On average, the ETL speed is above 45
mph 85 percent of the time in the northbound lanes, and 82 percent in the southbound lanes from
September 2015 to June 2017.
Before the ETL opened, from January 2014 to August 2015 the HOV lane was above 45 mph during the
peak period 69 percent of the time in the northbound direction and 67 percent of the time in the
southbound direction.
Figure 18: Percent time in peak hour with northbound ETL speed above 45 mph
0%10%20%30%40%50%60%70%80%90%
100%
Per
cen
t A
bo
ve 4
5 m
ph

36
Figure 19: Percent time in peak hour with southbound ETL speed above 45 mph
Speed analysis by transaction data: Speeds are also calculated for the ETL traffic using ETL transaction
data (as explained in the methodology) and are used for validating the speeds obtained from detector
data. In this case, speeds are calculated for the ETL trips for every month from January 2016 to June
2017. Comparison of average speeds from transaction data and from detector data confirms that the
measures calculated from detector data are reliable and the conclusions are robust. In other words, this
comparison adds another level of confidence to detector data as a reliable data source.
0%10%20%30%40%50%60%70%80%90%
100%P
erce
nt
Ab
ove
45
mp
h
37
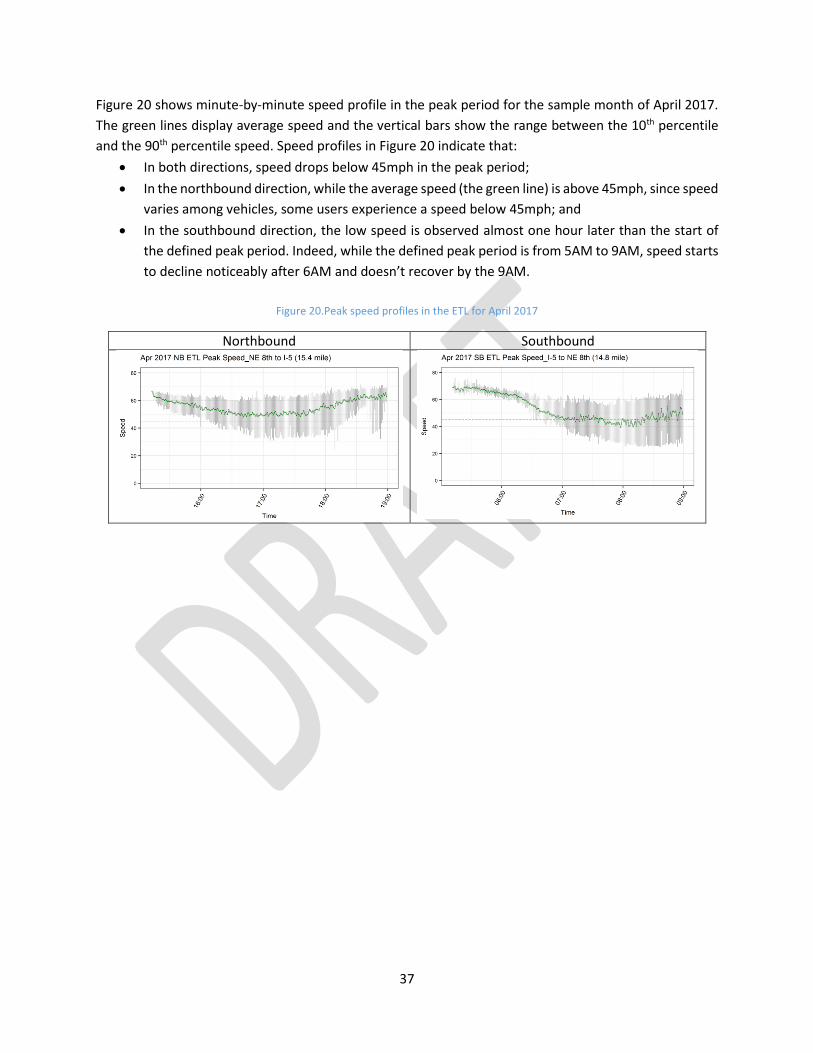
Figure 20 shows minute-by-minute speed profile in the peak period for the sample month of April 2017.
The green lines display average speed and the vertical bars show the range between the 10th percentile
and the 90th percentile speed. Speed profiles in Figure 20 indicate that:
In both directions, speed drops below 45mph in the peak period;
In the northbound direction, while the average speed (the green line) is above 45mph, since speed
varies among vehicles, some users experience a speed below 45mph; and
In the southbound direction, the low speed is observed almost one hour later than the start of
the defined peak period. Indeed, while the defined peak period is from 5AM to 9AM, speed starts
to decline noticeably after 6AM and doesn’t recover by the 9AM.
Figure 20.Peak speed profiles in the ETL for April 2017
Northbound Southbound

38
4.4 Tolling Analysis To shed light on how the tolling algorithm works on the ETL facility, data from ETL transactions and applied
toll rates were analyzed. Figure 21 shows the percentage of time the toll has reached the maximum value
of $10.00.
The $10 maximum toll rate was reached during 15 percent the peak period during the last six
months of the study time (January – June, 2017); and
The percentage is higher in the southbound direction than in the northbound direction.
This is a high percentage of time to hit the maximum toll rate, which could indicate that the demand for
the ETL exceeds expectations, and the algorithm must frequently adjust the price to the maximum to
avoid congestion on ETL.
Potential reasons for this could be either high demand and high willingness to pay on the part of ETL users
or an imperfect pricing algorithm that fails to keep up with increasing traffic volumes during peak period,
reaches the $10 maximum toll rate too frequently, and thus contributes to “break down” in the ETL facility.
Figure 21. Percent time the maximum toll is reached in the peak period
In Figure 22 the average paid toll in April 2017 is shown as a sample. Each square represents the toll at an
entrance plaza in a five-minute time intervals. Deep red squares represent higher tolls and green squares
represent lower tolls. Highest toll rates (darker red squares) are observed at the NB07 plaza, which is
located at State Road 522; however, traffic in the segment downstream of SR522 primarily comes from
other locations ranging from NE 8th Street and NE 128th Street, which are located upstream from SR522.
This could suggest that the tolling algorithm does not control the traffic proactively on time at upstream
entrance points, like NE 8th Street or NE 128th Street, and has to do it at downstream points, like SR522,
when traffic is already close to capacity.
0%
5%
10%
15%
20%
25%
30%
Oct
-15
No
v-1
5
De
c-1
5
Jan
-16
Feb
-16
Mar
-16
Ap
r-1
6
May
-16
Jun
-16
Jul-
16
Au
g-1
6
Sep
-16
Oct
-16
No
v-1
6
De
c-1
6
Jan
-17
Feb
-17
Mar
-17
Ap
r-1
7
May
-17
Jun
-17
NB SB

39
Figure 22. Northbound peak hours average toll paid in April 2017
Figure 23. Northbound peak hours average toll difference in April 2017
Figure 23 shows the difference between the toll that users paid and the toll that was displayed at their
starting points when they arrived at the ending point. Darker cells represent a larger difference between
the paid toll and the displayed toll at trips’ end time. High toll differences represent that users’
contribution in congestion is greater than what they pay. This suggests that the tolling algorithm should
be more responsive and raise the price faster or more consistently with traffic increases on the ETL. In
other words, higher values in the graph represent the delay in toll rate setting to control the performance
of the ETL. In particular, entrance points ranging from NE 8th Street to NE 128th Street show darker squares
indicating that they contribute in downstream congestion but pay less. Simply put, vehicles are locked in
a low price at an upstream point and may not be charged according to their impact on the downstream
congestion. This contributes to facility breakdown – failure to maintain 45 mph speed at least 90% of the
time.
As shown in Figure 23, toll differences are as high as $4.00, which is an indicator for imperfect dynamic
toll setting algorithm. This suggests a focused study on the pricing algorithm, which could lead to
improvements in corridor performance.
High toll at NB07
gantry near SR 522
Higher toll displayed later at
points upstream of SR 522

40
5. DISCUSSION This section provides a brief discussion on the data analysis in reference to the following items:
Minimum speed on the ETL
GPL speed changes
Other performance criteria
Even though the ETL facility is not meeting the 45 mph speed requirement, it is serving far more vehicles
than the HOV lane served – 42.9 percent more vehicle-miles in the northbound direction and 63.5 percent
more vehicle miles in the southbound direction – and is performing in a predictable way. By increasing
traffic volume in the ETL facility without significantly reducing speeds along the GPL, the corridor is
experiencing increased overall vehicle throughput (more than 11 percent overall).
Regarding the 90 percent threshold to maintain the ETL speed above 45 mph, the study team has observed
that this criterion has not been satisfied in several months. The southbound corridor has a higher
frequency of failing the minimum speed. Aside from overarching factors such as population growth, land
use changes around the corridor, and economic growth, two potential factors could be considered for this
phenomenon.
First, evaluating speed by itself is not sufficient, as traffic is a complex phenomenon
and factors such as density and volume play roles. The volume observation analysis
indicates there has been a rapid vehicle-mile increase of more than 11 percent after
opening the ETL, bringing more vehicles to the corridor. This new volume could be
associated with new population or new trips being made in the region, existing trips
diverted to the I-405 corridor after opening the ETL, or existing trips using longer
segments of the corridor. In any case, this growth can have noticeable impact on
corridor performance.
Second, our observation of the toll rates leads us to conclude that the way
toll rates change in response to traffic congestion may not be optimal. A
dynamic pricing algorithm such as that designed for this corridor should
reduce the number of vehicles entering the ETL before the managed lane
breaks down However, it seems that the I-405 algorithm either does not
respond fast enough or locks in a toll rate for vehicles for too long a segment
of the corridor. For example, a vehicle entering at the beginning of the
corridor may pay a low toll because at that time there is no congestion in
the corridor, but by the time it reaches a downstream segment 10 – 15
miles away, congestion may be built up, while the vehicle still pays the same
low toll. An improvement would be to apply variable toll charges to smaller
segments of the facility; this would allow the algorithm to take more
information into account, and set toll rates that are more responsive to
congestion before it actually happens.
Regarding the speed changes in the corridor, the most important factor is the volume increase in the
corridor. Analyses show that in most cases, after opening the ETL, speed on the GPL slightly increased.
Volumes on the corridor are up 11% since its opening, impacting corridor performance.
The algorithm controlling
toll rates in the I-405 ETL
allows too many vehicles
into the ETL when
congestion is building, and
that leads to breakdown of
the facility. At peak times, it
sets toll rates too low to
optimally manage the
facility.

41
However, because of the volume increase over time, the GPL speeds did not change substantially. In the
northbound direction, opening of the shoulder lane showed improvements in GPL speed in recent months
of the analysis.
Finally, the study of the corridor as a closed system using available data provides some insights into the
facility performance, but the underlying factors go beyond the corridor and to the broader region. Indeed,
by changing transportation facilities, users change their travel habits accordingly to achieve the best
available outcome from their travel. The changes could be in their departure time, mode of transportation,
or route/path.
For a better understanding of how a transportation facility performs and why, a more comprehensive
regional study could provide greater insight into various factors influencing traffic conditions along the
I-405 corridor in general and within the ETL facility in particular.

42
6. RECOMMENDATIONS In addition to providing independent and objective analysis of traffic data and I-405 corridor performance, we were asked to provide recommendations – both short-term and long-term – for improving the ETL facility in particular and I-405 corridor generally. Study of traffic data and research about other ETLs around the world has revealed a number of opportunities for improving the I-405 ETL facility and corridor performance. We are confident the following recommendations are both actionable and have a high likelihood of addressing challenges identified in our data analysis. Top Tier Short-Term Recommendations The following recommendations could be implemented in the relative short term and offer the greatest promise for addressing current congestion and improving corridor performance:
1) Improve ETL speed though a more responsive dynamic toll algorithm Our analysis reveals that the tolling algorithm is not optimally responsive. More specifically, the toll rate is too low as traffic volume builds in the ETL. In fact, the difference between the toll rate actually paid and the toll rate displayed at a trip's conclusion can be as high as $4.00. That is, a motorist might enter the ETL and lock in a toll rate that does not reflect the actual traffic volume building during their respective trip along the ETL corridor. Particularly during peak travel times, the toll algorithm and pricing is not adequately controlling input traffic along the ETL, which in turn can result in unmanageable ETL congestion and break down – and thus unacceptably low average ETL vehicle speeds. This is a short-term recommendation. It could be implemented without new infrastructure investment. However, it may require additional study focused on the specifics how WSDOT would make its toll algorithm more responsive to volume changes.
Impact achievable in short term
Additional study recommended
$ (relatively low cost compared with other recommendations)
2) Improve ETL speed through segmented corridor tolling WSDOT currently allows motorists to “lock in” one corridor-long toll rate upon entering the facility. This is a business rule which WSDOT enacted for simplicity and ease-of-use for motorists. However, locking in one corridor-long toll rate also has significant traffic management disadvantages. Traffic conditions and volumes can change considerably along the 17-mile tolled corridor – especially during peak periods. Applying tolls on a segment-by-segment basis, with segment-specific toll rates that are more reflective of real-time traffic conditions and volumes, will improve speeds in the ETL and corridor performance overall.
Under this approach, an electronic dynamic pricing sign would advise motorists entering the facility of segment-specific toll rates. The toll rates for each segment would be updated every few minutes based upon the volume in each segment. Segment pricing is used in many U.S. cities, and there are many different approaches for structuring and communicating segment prices. This recommendation also could be implemented in the short-term. Although it would involve certain infrastructure enhancements, such as additional dynamic pricing signs and access points through striping, these changes are relatively simple compared to other facility adjustments that have been made in the
43
past. However, this change in WSDOT’s business rule would require clear communication with motorists who currently expect to lock in a corridor-long toll rate.
Impact achievable in short term
Additional study recommended
$$ (relatively moderate cost compared with other recommendations) 3) Move toward an “open access” ETL facility to smooth lane transfer The ETL facility currently is striped to limit entrance from and exit to the GPL. Controlling the flow of traffic between lanes has advantages, especially in situations where prevailing lane speed can contrast considerably. However, in some cases, limiting the number of entrance and exit points can concentrate lane transfer and actually impede traffic flow and reduce speed overall. Therefore, we believe that implementing an open access strategy on some parts of the ETL facility could improve traffic flow and throughput. Any changes in access policy should be in concert with the corridor segment toll structure described above. Although this recommendation can be considered short-term in nature, further study of how best to apply an open access approach may reveal corridor segments where restricted ETL access remains beneficial.
Impact achievable in short term
Additional study recommended
$$ (relatively moderate cost compared with other recommendations)
4) Increase maximum toll rate to reduce ETL breakdown Analysis reveals that the maximum toll rate was applied on average 15 percent of the time in either direction during the study period. The maximum toll rate set in administrative rule is $10. This is an indication of ETL breakdown. For dynamically-priced toll facilities such as the I-405 ETL, the goal is to reach the maximum toll rate only rarely. Reaching the maximum toll rate is problematic from a traffic management standpoint, because once the maximum is reached the lane volume can no longer be managed through pricing to ensure ETL speed. This phenomenon is known as a facility breakdown. During breakdown, the benefits of the ETL facility are lost altogether while the resulting congestion can seriously disrupt travel for extended periods.
Although this recommendation could be implemented in the short-term, it should be considered complementary to the recommendations described above. We believe that the combination of a more responsive dynamic toll algorithm and application of toll rates by segment should significantly reduce congestion in the ETL, and thus reduce the frequency the $10 maximum toll rate is charged. However, to ensure ETL speed and facility performance during the most adverse traffic conditions, an increased maximum toll rate is recommended, even after the adjustments described above.
Impact achievable in short term
Additional study recommended
$ (relatively low cost compared with other recommendations)

44
Second Tier Short-Term Recommendations The following recommendations also could be implemented in the relative short term, and we believe
they would help address current congestion and improve corridor performance:
5) Adjust AM peak period times to increase ETL speed Extending the AM peak period for an additional hour in order to remove 2+ HOVs during this time would improve ETL performance by reducing the frequency and/or intensity of ETL breakdown. The AM peak period is currently defined as 5AM to 9AM, Monday through Friday. However, analysis reveals that traffic volumes along the corridor are consistent with peak period condition between 9AM and 10AM – and significantly greater between 9AM and 10AM than between 5AM and 6AM. Although ETL toll rates apply to motorists in these lanes throughout each weekday, 2+ HOV motorists are allowed into the ETL facility without paying a toll during non-peak hours. As such, the current AM peak period hours restrict free use of the ETL facility for 2+ HOV motorists at a time when the facility could support them (5-6AM), and they permit 2+ HOV motorists to use the facility for free at a time when the facility is congested, and therefore doesn’t have the capacity to support them (9-10AM).
We have two alternative recommendations to address this:
a) As a recommendation that could be implemented in the short-term, expanding the AM peak period to 5AM – 10AM would provide ETL congestion relief.
b) As an alternative, adjusting the AM peak period from 5AM – 9AM to 6AM – 10AM would produce ETL congestion relief during the latter portion of the AM commute; however, shifting the peak period rather than expanding it could invite more motorists into the ETL lane as volumes begin to mount and contribute to unintended congestion early in the AM peak period.
Either recommendation would help alleviate AM peak period congestion in the ETL.
Impact achievable in short term
Additional study recommended
$ (relatively low cost compared with other recommendations)
Long-term Recommendations The following recommendations would require a longer period of time to implement, but nonetheless offer promise for addressing congestion and improving corridor performance:
6) Extend second full ETL in each direction to improve ETL speed In high-growth and geographically confined traffic corridors such as the I-405 corridor, congestion pricing approaches such as the ETL facility offer the dual promise of predictable ETL drive time and increased throughput, as compared to GPL-only facilities. This is the case with the I-405 corridor. Based upon how similar facilities have performed around the country, we are confident that extending two full ETLs from 160 Street NE in Woodinville to I-5 in Lynnwood would remove current ETL bottleneck conditions and improve the flow of traffic along the ETL facility – likely producing improved ETL speeds and overall corridor traffic throughput.

45
This recommendation would require more time to implement than the others described above. Optimal design of the additional ETLs would require in-depth traffic modeling and scenario analysis, and construction would take additional time. Nonetheless, researchers are confident that congestion pricing has and will continue to improve traffic performance along and the I-405 corridor.
Impact achievable in long term
Additional study recommended
$$$ (relatively high cost compared with other recommendations) 7) Add Capacity to Ensure Lane Continuity and Ease Bottlenecks Bottlenecks occur in areas where traffic volumes converge – be it through lane loss, on ramps, etc. The I-405 corridor includes a number of bottlenecks in both the GPL and ETL, and it may be beneficial to add lane capacity in areas with bottlenecks to improve corridor continuity. We recommend studying this issue to better inform a final decision on the question. This is a long-term recommendation, because it would require time to study where and how GPLs should be expanded, and additional time to construct GPL expansions.
Impact achievable in long term
Additional study recommended
$$$ (relatively high cost compared with other recommendations)
8) Increase transit options to improve throughput and speed Growth in VMT along the I-405 corridor is well outpacing statewide and national averages. Therefore, regardless of the ETL changes we describe in this section, the corridor will continue to experience significant pressure from recent and projected population and motorist growth. Over time, the short-term benefits of added lane capacity will be reduced by growth in VMT. As a result, maintaining and improving long-term corridor performance requires a balanced approach of roadway infrastructure improvements and transit options. Research conducted by others has found that well-designed transit options can help move more people through a corridor in fewer vehicles. In this way, transit can help improve corridor throughput efficiency in both the ETL and the GPLs. Over the long term, implementation of I-405 master plan transit improvements will reduce congestion and increase passenger throughput in the high-growth corridor. These improvements include new transit centers and park and ride spaces, a bus rapid transit (BRT) system, vanpools, direct access ramps for transit and carpools, and an overall increase in transit service.
Impact achievable in long term
Additional study recommended
$$ (relatively moderate cost compared with other recommendations)

46
7. CONCLUSION The I-405 ETL facility is meeting the statutory performance measure related to financial sustainability, but
not the performance measure related to average ETL speeds. This is due in part to overall traffic volume
growth and a toll rate algorithm and pricing not adequately responsive to rapidly-increasing traffic volume
during peak periods. Our findings suggest that a number of adjustments could be made that should lead
to both of the primary statutory performance measures being met.
As time passes and conditions change, even the most sophisticated ETL facilities require regular
adjustments. This is particularly true of those operating in traffic corridors like the I-405 corridor that serve
rapidly growing regions. Therefore, these recommendations should be considered part of the natural
evolution of the corridor, not criticisms of work that has been done in the past. We are confident that
implementation of these recommendations will improve I-405 ETL performance and significantly increase
throughput and efficiency along the corridor.