hysteresis behaviour and specific damping capacity of...
TRANSCRIPT

1
Hysteresis Behaviour and Specific Damping Capacity of Negative Poisson's Ratio Foams
Martz, E. O., Lakes, R. S., and Park, J. B. "Hysteresis behaviour and specific damping capacity ofnegative Poisson's ratio foams", Cellular Polymers, 15, 349-364, (1996).
Abstract
Open cell polyurethane foams have been previously made to be re-entrant, in that their cellribs are inwardly bent, which results in the foam exhibiting a negative Poisson's ratio(1).Untransformed control and transformed negative Poisson's ratio foams were cyclically loaded atvarious levels of pre-strain to determine their hysteresis behavior, and from this, to elucidate itsspecific damping characteristics. Both untransformed and transformed foams exhibited non-linearhysteresis behavior at high cyclic strains, regardless of their initial levels of pre-strain. The specificdamping capacity of the transformed foam with extreme compressive pre-strain was higher than thatof the untransformed foam. This effect was attributed to the rubbing of the inwardly buckled cellribs of the transformed foam. The specific damping capacity varied with both the level of pre-strainand with the amplitude of cyclic strain about that level.
IntroductionPoisson's ratio for a homogeneous, isotropic material under longitudinal load is defined as
the negative of the ratio of lateral strain to longitudinal strain. Ordinary materials, including cellularsolids, exhibit a positive Poisson's ratio, however, materials with a negative Poisson's ratio have beenshown to exist(1-5). A method of transforming open cell foam such that it will then possess anegative Poisson's ratio has been demonstrated by one of the authors(1). The causal mechanism forthis resultant negative Poisson's ratio is the inward buckling of the cell ribs of the foam, this hasbeen described as having a "re-entrant" shape(1). Materials with a negative Poisson's ratio willshow increased resilience and improved fracture toughness. Applications for such materials havebeen envisioned based on their unusual properties.
Viscoelastic materials are those in which the relationship between stress and strain dependson time or frequency. In dynamic (sinusoidal) loading of a linearly viscoelastic material, therelationship between stress and strain can be related by the loss tangent (tan δ). The loss angle δrepresents the phase angle between the stress and strain sinusoids. The loss tangent, whichdepends upon frequency, is a measure of the viscoelastic damping of a material. When a linearviscoelastic material is cyclically loaded, the resulting stress vs. strain curve is an elliptic Lissajousfigure, as shown in Figure 1(a). From this curve one can determine the loss angle [δ = sin-1(A/B)].For a nonlinear viscoelastic material, cyclic loading will result in a hysteresis loop which is notelliptic, for example the ones shown in Figure 1(b) or (c) . For all viscoelastic materials the path ofloading differs from the path of unloading. Polymeric materials can exhibit pronouncedviscoelastic effects at ambient temperature.
Damping can be defined in several ways. Tan δ is an appropriate expression for linearlyviscoelastic materials. For non-linear materials, a stress which is sinusoidal in time gives rise to astress which is not sinusoidal, consequently a more general measure of damping is required. Forexample the specific damping capacity, referred to as Ψ, is defined as the ratio of dissipated energyWd to stored energy Ws per unit volume in cyclic loading. Such a ratio of energies has physicalmeaning regardless of the shape of the hysteresis loop.
WdWs
= Ψ. (1)
Ψ in the general case can be related to tan δ in the linear case by computation of the areawithin the elliptic curve in Figure 1(a). That area corresponds to dissipated energy Wd for a fullcycle. The stored energy over a quarter cycle is computed as the area "opq" in Fig. 1 (a). Since the
2
material returns to its original values of stress and strain after each cycle it is not meaningful tospeak of stored energy over a full cycle. Tan δ is related to Ψ via
Ψ = 2π tan δ. (2)
Since there are several possible ways of defining the stored energy, there are also severalexpressions for Ψ(6). In the above, the stored elastic component of energy was used, in harmonywith Ferry(7) and Nashif et al.(8). The slope of the line "op" forming the triangle used forcalculation of area in Figure 1 (a) is the storage modulus E', which is the real (in phase) part of thecomplex dynamic modulus. The quantity J' shown is the storage or in-phase compliance. It is alsopossible to consider as stored energy the total strain energy at maximum deformation or the totalkinetic plus potential energies in vibrating systems with inertia(9).
Nonlinear viscoelastic materials will dissipate energy, but δ as a phase angle betweensinusoids does not have the physical significance it does in linear materials, since nonlinearitycauses the response to be non-sinusoidal. However, the energy ratio Ψ will continue to have ameaningful physical interpretation despite the more complex shape of the hysteresis curve. Thedissipated energy is proportional to the area within the curve regardless of its shape. Stored energymay be evaluated from the area of a triangle as was done for linear materials, but the slope of thehypotenuse corresponds to a secant modulus; see Figure 1 (c). Moreover, if the hysteresis loop isasymmetric, the slope is different for tension compared with compression. The area under an actualstress-strain curve should provide a more realistic value of the stored energy, but since the curvesfor loading and unloading are different there arises the question of what curve to use. Onepossibility is to construct a curve based the average of stress for loading and unloading, asrepresented by the dashed curve in Figure 1 (c).
Materials and Methods
MaterialsOpen cell polyurethane foams (Scott Industrial Foam, from Foamade Industries, Auburn
Hills, MI) were used for these experiments as in earlier ones(1). The relative density, defined as theratio (ρ/ρs) of the density ρ of the foam to the density ρs of the solid material composing the foam,was 0.03 ± 7%. The length of the cell ribs of this foam was 1.2 mm. Sections were cut from thefoam sample with dimensions as follows: 114.3 mm x 38.1 mm x 38.1 mm, and these sectionswere transformed into negative Poisson's ratio foam.
ProcessingAn aluminum tube of square cross section and inner dimensions 22 mm x 22 mm x 125
mm, was used as the mold, into which the foam specimens were inserted. The insertion resulted incompression in two transverse directions. Compression in the third direction was accomplished byapplying an endplate (22 mm x 22 mm x 2.1 mm) to each end of the open ended aluminum tube. Aseries of spacers with a total length of 58.4 mm was used to compress the foam longitudinally; thecombination of spacers and end plates was held in place using a clamping device. The moldassembly was placed in a furnace, which was heated to a predetermined temperature of 167˚C.After the assembly had been heated for 19 minutes, it was removed from the furnace and allowed tocool to room temperature for an hour. The foam specimen was then removed and was gentlystretched in the three orthogonal directions to eliminate any adhesion of the cell ribs.
Testing and analysisA section (23 mm x 22 mm x 22 mm) was cut from the center of the transformed foam
specimen, as well as from an untransformed foam sample, for hysteresis testing. The rationale forsuch a short column geometry was to prevent buckling in trials at high compressive strain. No

3
attempt was made to infer Young's modulus. The transformed foam was prepared with a permanentvolumetric compression factor of 3.7, which based on previous work with this foam results in aPoisson's ratio of about -0.7(10). The specimen was oriented with the 23 mm length as thelongitudinal direction, parallel with the stroke of the testing machine. The center region was chosenbecause it exhibited the most visible effect in Poisson's ratio. The test coupons were fixed tosmooth metal plates using a cyanoacrylate cement.
Stress vs. strain curves ranging from compression through tension were generated for boththe untransformed and transformed samples by using a servohydraulic materials testing machine(Model 810, MTS Systems Corp., Minneapolis, MN). All tests were done in stroke control, with asinusoidal waveform at a frequency of 1 Hz and at room temperature (20˚C). Based on thesecurves, various strain levels were chosen about which cyclical loading was performed. Since theabsolute values for strain were different in both the untransformed and transformed specimens,levels were chosen based on similar positions, relative to the stress vs. strain curve. About eachlevel of strain, the sample was cyclically loaded at 4 successive strains (±2, ±5, ±10, and ±15%strain). Ten cycles were performed for each cyclic strain level. Values of initial strain ranged fromextreme compression to extreme tension.
Results from the mechanical testing were recorded and plotted, and from these plots theratio between energy dissipated and energy stored was determined. The area of the closed curve(representing the energy dissipated over a full cycle), and the area of the largest triangle(representing the energy stored over a quarter cycle associated with a secant modulus at peakstress), drawn from the origin of the cyclic strain, to the largest peak stress), were used to determineΨ. For comparison, some calculations were performed using a tangent approach represented by thearea under the dashed curve in Figure 1 (c). These areas were plotted and then their shapes were cutout from the paper and weighed using an analytical balance. The ratio of their weights were thenused to determine Ψ, since with constant thickness the ratio of their weights is identical to the ratioof their areas.
Results
Due to the large amount of data generated, it was decided to emphasize the extremes of theresults obtained, namely, the cyclic loading of ±2 and ±15% strain. The hysteresis loops for ±2and ±15% cyclic strain, for both the untransformed and transformed foams, are shown in Figures2-5. All hysteresis loops are superimposed upon a monotonic stress vs. strain curve generated forthe foam being examined. For cyclic strains of ±2%, elliptical hysteresis loops were generated forthe most part from both the untransformed and transformed foams. At ±2% cyclic strain, at eachlevel of pre-strain, linear behavior of both the untransformed and transformed foams was bestexhibited, as elliptical hysteresis loops. At ±15% cyclic strain, non-linear behavior, in the form of"boomerang" shaped hysteresis loops, were most dramatic. Between these extremes, ±5 and ±10%cyclic strain, there was a gradual transition between the linear and non-linear regimes. From theseresults, it is observed that the orientation of the hysteresis loops is in good agreement with the slopeof the stress vs. strain curves, at the level of pre-strain about which the cyclic loading wasconducted.
The specific damping capacity of both the untransformed and transformed foam wasdetermined based on the hysteresis loops generated from the various tests. The specific dampingcapacity is most commonly taken to be proportional to tan δ, however, this is only for materialstested in the linear regime. For cyclic loading at ±15% strain, both the untransformed andtransformed foams exhibited non-linear behavior. The measure of specific damping capacity used
was Ψ2π , equivalent to tan δ for the linear case according to Eq. (2).
The changes in specific damping capacity as a function of cyclic strain are given in Tables 1and 2 and are shown in Figures 6-8. Comparison of the specific damping capacity of the

4
untransformed and transformed foams was based on the regions in the respective stress vs. straincurve in which the slope of this curve was similar for both types of foam. This was considered thebest comparison due to the inherent differences in the stress vs. strain curve for each type of foam.
Figures 6-8 show how Ψ2π varies with cyclic strain for the cases of extreme tensile pre-strain, no pre-
strain, and extreme compressive pre-strain. In each of these figures, only the results from the last(10th) cycle are shown. The transformed foam exhibited a higher specific damping capacity thancontrol foam under compressive pre-strain; at large cyclic strains with no pre-strain, but not undertensile pre-strain, as shown in Fig. 6-8.
Discussion
Cellular solids(11) are composite materials in which one phase is empty space or a fluidsuch as water or air. Cellular solids include honeycombs, foams and other porous materials. In lowdensity closed cell foams, the pressure of air or other gas in the pores contributes to the overallstiffness. In open cell foams, air in the pores is free to escape as the material is stressed. Underquasistatic conditions or at low frequency, flow of air has little effect. The correspondence principleof the linear theory of viscoelasticity may then be applied to the foam as a composite with onemechanically active phase. So, given(11)
EfoamEsolid
= [ρfoamρsolid
]2, (3)
for an elastic open cell foam (with solid referring to the solid material of which the foam is made, Eas Young's modulus and ρ is density), the relationship for a corresponding viscoelastic foam is:
E*foam = E*
solid[ρfoamρsolid
]2, (4)
in which E* is a complex quantity dependent on frequency. The loss tangent, in terms of thecomplex modulus is:
tan δ = Im[E*]Re[E*]
. (5)
If one assumes, in addition to sufficiently low frequency, that no chemical changes have occurredduring the foaming process then the tan δ of a linearly viscoelastic cellular solid is that of the solidmaterial of which it is made.
At sufficiently high frequency, significant viscoelastic loss can occur in cellular solids as aresult of the viscosity of the air or water in the pores. Under quasistatic circumstances, below suchfrequencies, the tan δ of the cellular solids is that of the solid material of which it is made, followingthe correspondence principle. At very high frequency it may be possible to set the ribs or walls ofthe foam into vibration, resulting in additional loss and dispersion(12). The present study wasconducted at too low a frequency for such effects to be important.
The discussion thus far applies to linear materials. Under large strain conditions, materialsmay behave nonlinearly, and new viscoelastic mechanisms including nonlinear processes in thepolymer itself(13) as well as friction between the ribs, may become operative.
Viscoelasticity at low frequency in foams is due to the viscoelasticity of the solid fromwhich it is made, but in negative Poisson's ratio foams, a second causal mechanism is possible:friction between cell ribs in contact. The negative Poisson's ratio itself is not responsible for

5
damping; rather, the inwardly buckled structure of the re-entrant foam cells is responsible for bothnegative Poisson's ratio (since the cell unfolds when stretched) and for other characteristics such asaltered damping. The transformed foam exhibited a higher specific damping capacity than controlfoam under compressive pre-strain; at large cyclic strains with no pre-strain, but not under tensilepre-strain. In tensile pre-strain, the cell ribs were not in contact to the degree they were in the morecompressed mode, and therefore did not cause additional damping.
The relationship between the amount of applied pre-strain and the specific damping capacityis shown in Figures 9 and 10. For the untransformed foam the kink in the curve from 5% to 15%compressive pre-strain may be attributed to a microbuckling instability(14) which gives rise to abanded appearance in the foam when compressed. The banding is due to the fact that in this strainregime microbuckling of the cell ribs begins and progresses, and some cell ribs come into contactgiving rise to frictional damping. The transformed foam exhibits the kink near 0% compression,perhaps since the ribs are pre-buckled by the transformation process and that a frictional interactionalso occurs as ribs make and break contact.
In the untransformed foam cyclically loaded at ±5, ±10, and ±15% strain, the specificdamping capacity (based on the secant modulus energy calculation) decreased as the amplitude ofcyclic loading was increased. Both transformed and untransformed foam exhibited a similar trend.At high amplitudes of cyclic loading the hysteresis loops became more asymmetric, so that thesecant approach gave rise to an excessively high value of stored energy hence an underestimate ofthe damping. Since there is no unique way of characterizing damping in nonlinear materials, analternate approach is described below.
As presented in the Methods section, a secant modulus was used to determine the storedenergy in order to calculate Ψ. A case can be made for incorporating the curvature of the plot inevaluating the stored energy, however in a nonlinear material it is not so straightforward to evaluateenergy of the elastic portion. Damping was calculated for the extreme case of ±15% strain and themaximum tensile and compressive pre-strain, using the average of the stresses for loading and
unloading to determine the stored energy. Values of damping Ψ2π were larger. For example in
transformed foam under large compressive pre-strain Ψ2π was about 0.23 if calculated using the
larger "triangle", and more than 0.7 if calculated using the smaller "triangle", compared with 0.13 ifcalculated via the secant approach. These differences associated with interpretation of stored energyare most notable for highly asymmetric loops; in the region of small pre-strain, interpretation ismuch more straightforward. Formal development of methods for evaluation of dimensionlessdamping in nonlinear materials is a topic for future effort.
The nonlinear properties of foam are relevant in a variety of applications. For example inseat cushions, pre-compression occurs as a result of the weight of the person. Moreover, thedamping governs the transmission of vibration to the person, and this perception of vibration isimportant in automobile seats(14). The magnitude of the damping at small amplitude, as well as thepeak in damping near 10% pre-compression are comparable to results obtained in a differentflexible polyurethane foam(15).
Conclusions
The hysteresis behavior of both control (untransformed) and negative Poisson's ratio(transformed) foam were characterized at various levels of pre-strain as well as cyclic strain about agiven pre-strain level. At higher levels of cyclic strain, the hysteresis loops became markedly non-linear ("boomerang shaped") for both foams. From the hysteresis loops, the specific dampingcapacity of the foams for each level was determined based on the ratio of energy dissipated toenergy stored. Except in the case of extreme tensile pre-strain, the foams having a negativePoisson's ratio exhibited a higher value of specific damping capacity.

6
TABLES
Table 1. Specific Damping Capacity as a Function of Pre-Strain and Cyclic Strain for
Untransformed Foams
Level of Ψ/(2π) for Various Levels of Cyclic Strain
Pre-Strain ±2% ±5% ±10% ±15%
-65% 0.185 0.151 0.119 0.089
-50% 0.210 0.172 0.153 0.122
-15% 0.201 0.259 0.235 0.199
0% 0.161 0.174 0.157 0.131
15% 0.157 0.175 0.153 0.136
25% 0.172 0.181 0.174 0.156
Note: "-" indicates compression
Table 2. Specific Damping Capacity as a Function of Pre-Strain and Cyclic Strain for Transformed
Foams
Level of Ψ/(2π) for Various Levels of Cyclic Strain
Pre-Strain ±2% ±5% ±10% ±15%
-50% 0.212 0.189 0.158 0.131
-30% 0.198 0.197 0.164 0.145
-10% 0.161 0.157 0.132 0.117
0% 0.168 0.175 0.178 0.197
40% 0.142 0.138 0.146 0.130
60% 0.177 0.146 0.139 0.140
Note: "-" indicates compression

7
References
1. Lakes R. S., "Foam structures with a negative Poisson's ratio", Science, 235, 1987, 1038-1040
2. Friis E. A., Lakes R. S. and Park J. B., "Negative Poisson's ratio polymeric and metallicfoams", J. Materials Science, 23, 1988, 4406-4414
3. Caddock B. D. and Evans K. E., "Microporous materials with negative Poisson's ratios: I.microstructure and mechanical properties", Journal of Physics D: Applied Physics, 22, 1989, 1877-1882
4. Evans K. E. and Caddock B. D., "Microporous materials with negative Poisson's ratios: II.mechanisms and interpretation", Journal of Physics D: Applied Physics, 22, 1989, 1883-1887
5. Alderson K. L. and Evans K. E., "The fabrication of microporous polyethylene having anegative Poisson's ratio", Polymer, 33, 1992, 4435-4438
6. Graesser E. J. and Wong C. R., The relationship of traditional damping measures formaterials with high damping capacity: a review. In M3D: Mechanics and Mechanisms of MaterialDamping, (edited by Kinra V. K. and Wolfenden A.), ASTM, Philadelphia, 1992
7. Ferry J. D., Viscoelastic Properties of Polymers, 2nd ed., J. Wiley, NY, 1970
8. Nashif A. D., Jones D. I. G. and Henderson J. P., Vibration Damping, J. Wiley, NY, 1985
9. Lazan B. L., Damping of Materials and Members in Structural Mechanics, Pergamon, NY,1968
10. Choi J. B. and Lakes R. S., "Non-linear properties of polymer cellular materials with anegative Poisson's ratio", Journal of Materials Science, 27, 1992, 4678-4684
11. Gibson L. J. and Ashby M. F., Cellular Solids, Pergamon, 1988
12. Chen C. P. and Lakes R. S., "Dynamic wave dispersion and loss properties of conventionaland negative Poisson's ratio polymeric cellular materials", Cellular Polymers, 8, 1989, 343-359
13. Hilyard N. C., Hysteresis and energy loss in flexible polyurethane foams. In Low DensityPlastics, (edited by Hilyard N. C. and Cunningham A.), Chapman and Hall, London, 1994.
14. Rosakis, P., Ruina, A., and Lakes, R.S., "Microbuckling instability in elastomeric cellularsolids", J. Materials Science, 28,1993, 4667-4672.
15. Cunningham A., Huygens E. and Leenslag J. W., "MDI comfort cushioning for automotiveapplications", Cellular Polymers, 13, 1994, 461-472
16. Lakes R. S., Viscoelastic Solids, CRC Press, Boca Raton, FL, 1998.

8
FIGURES
Figure 1. Stress σ vs. strain ε for viscoelastic materials under cyclic loading.(a) Linear material exhibits an elliptic loop(16).(b) A nonlinear material.(c) Another nonlinear material.
Figure 2. Hysteresis loops for the untransformed foam at various levels of pre-strain, with cyclicloading at ±2%. The hysteresis loops (magnification = 5x) from the 10th cycle are shown.
Figure 3. Hysteresis loops for the untransformed foam at various levels of pre-strain, with cyclicloading at ±15%. The hysteresis loops (magnification = 1x) from the 10th cycle are shown.
Figure 4. Hysteresis loops for the negative Poisson's ratio foam at various levels of pre-strain, withcyclic loading at ±2%. The hysteresis loops (magnification = 5x) from the 10th cycle are shown.
Figure 5. Hysteresis loops for the negative Poisson's ratio foam at various levels of pre-strain, withcyclic loading at ±15%. The hysteresis loops (magnification = 1x) from the 10th cycle are shown.
9
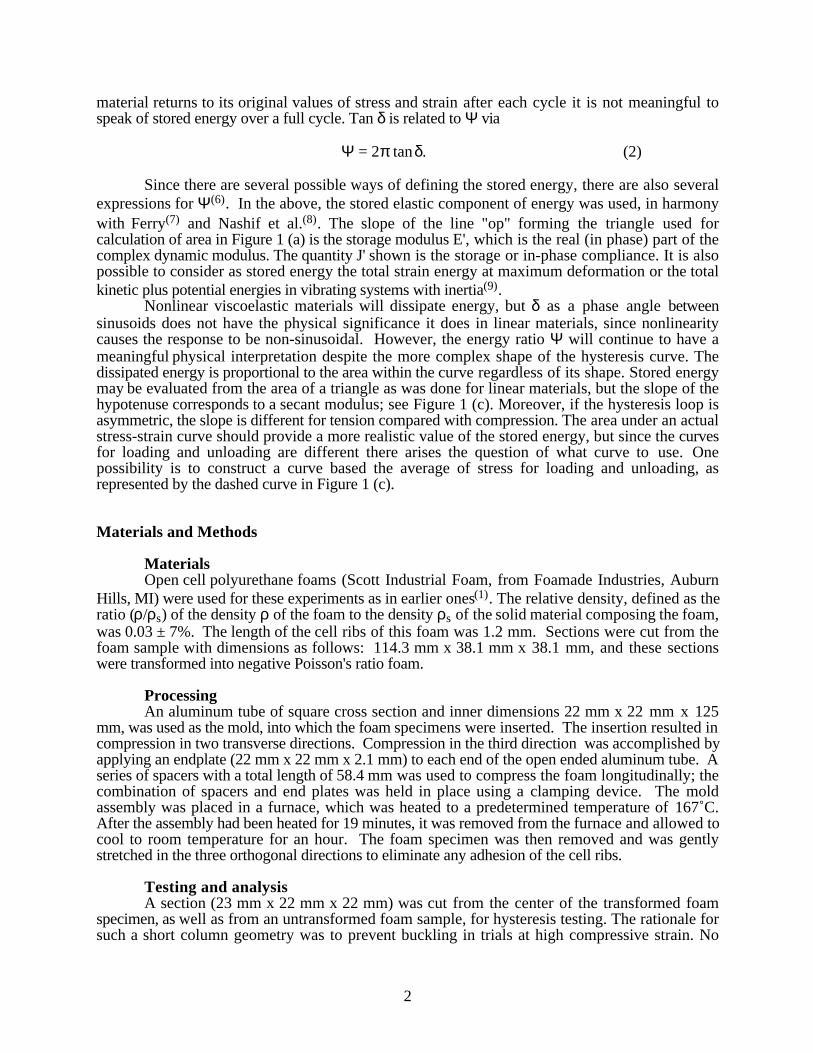
Figure 6. A comparison of the negative Poisson's ratio foam and the control foam at a specifiedtensile pre-strain is shown. The specific damping capacity, Ψ/(2π), as a function of cyclic strain ispresented. The transformed foam with a resultant negative Poisson's ratio is designated by "np"and the untransformed foam is designated by "con".
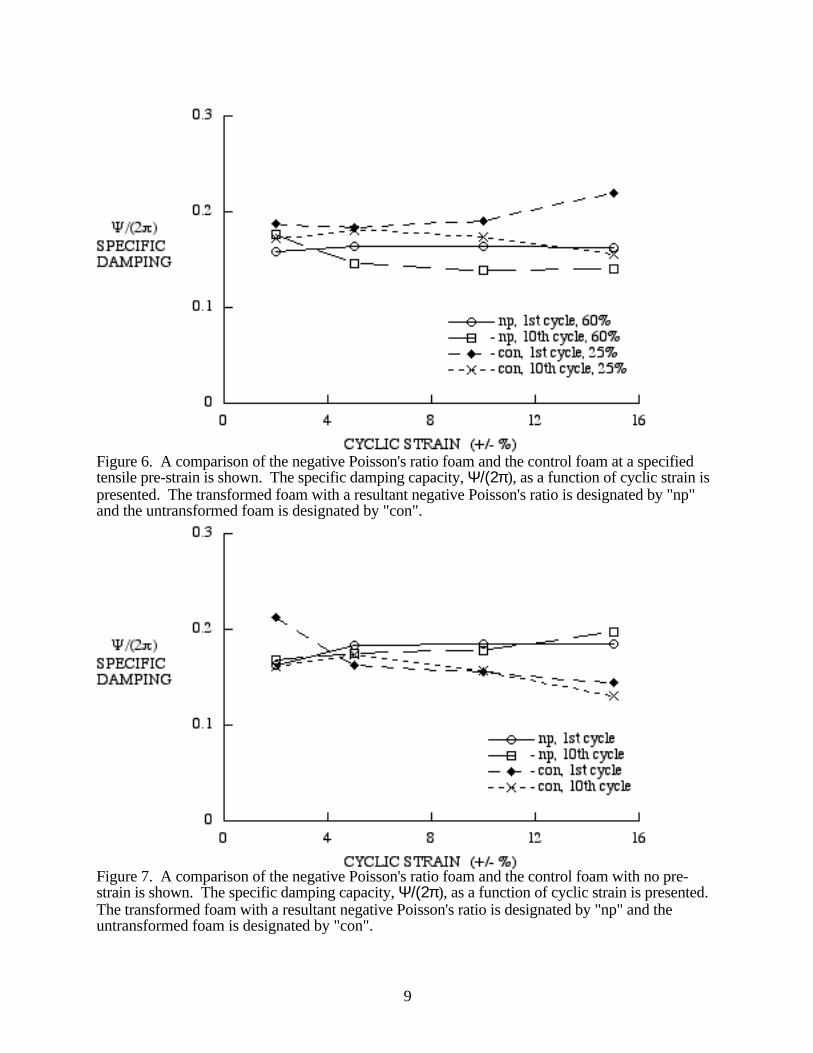
Figure 7. A comparison of the negative Poisson's ratio foam and the control foam with no pre-strain is shown. The specific damping capacity, Ψ/(2π), as a function of cyclic strain is presented.The transformed foam with a resultant negative Poisson's ratio is designated by "np" and theuntransformed foam is designated by "con".
10
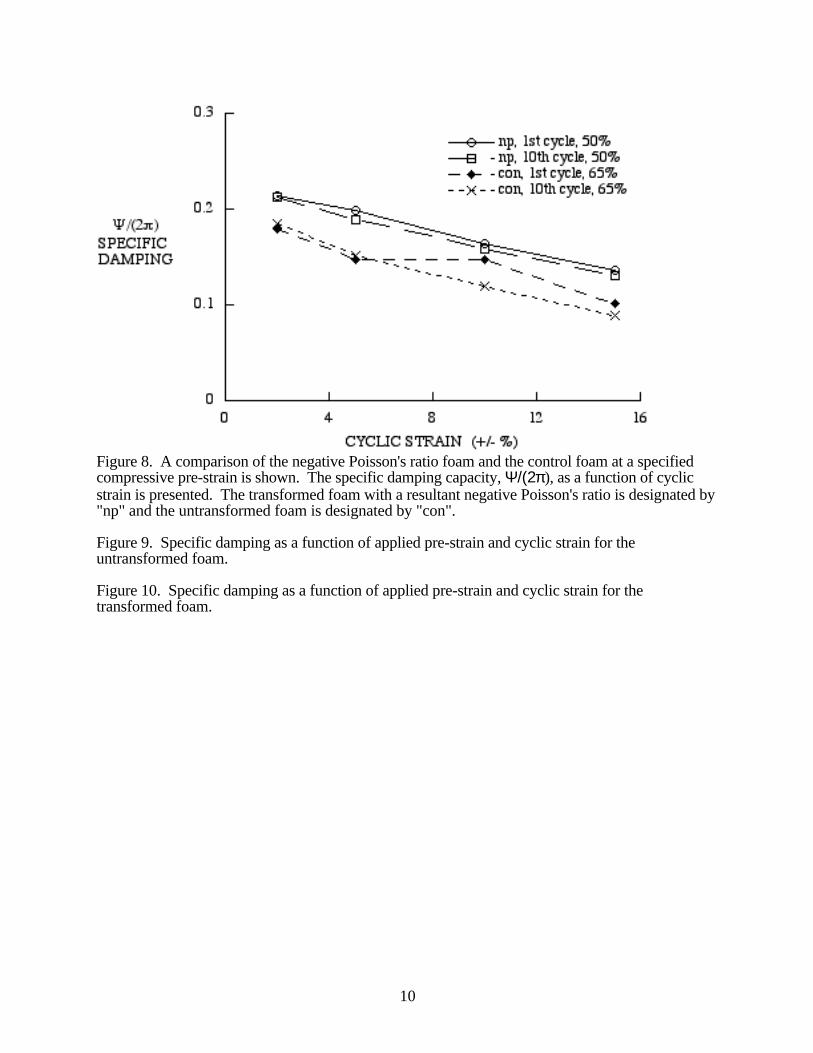
Figure 8. A comparison of the negative Poisson's ratio foam and the control foam at a specifiedcompressive pre-strain is shown. The specific damping capacity, Ψ/(2π), as a function of cyclicstrain is presented. The transformed foam with a resultant negative Poisson's ratio is designated by"np" and the untransformed foam is designated by "con".
Figure 9. Specific damping as a function of applied pre-strain and cyclic strain for theuntransformed foam.
Figure 10. Specific damping as a function of applied pre-strain and cyclic strain for thetransformed foam.